Selective footprinting of 40S and 80S ribosome subpopulations (Sel-TCP-seq) to study translation and its control
Susan Wagner, Jonathan Bohlen, Anna Herrmannova, Jan Jelínek, Thomas Preiss, Leoš Shivaya Valášek, Aurelio A. Teleman


Extended
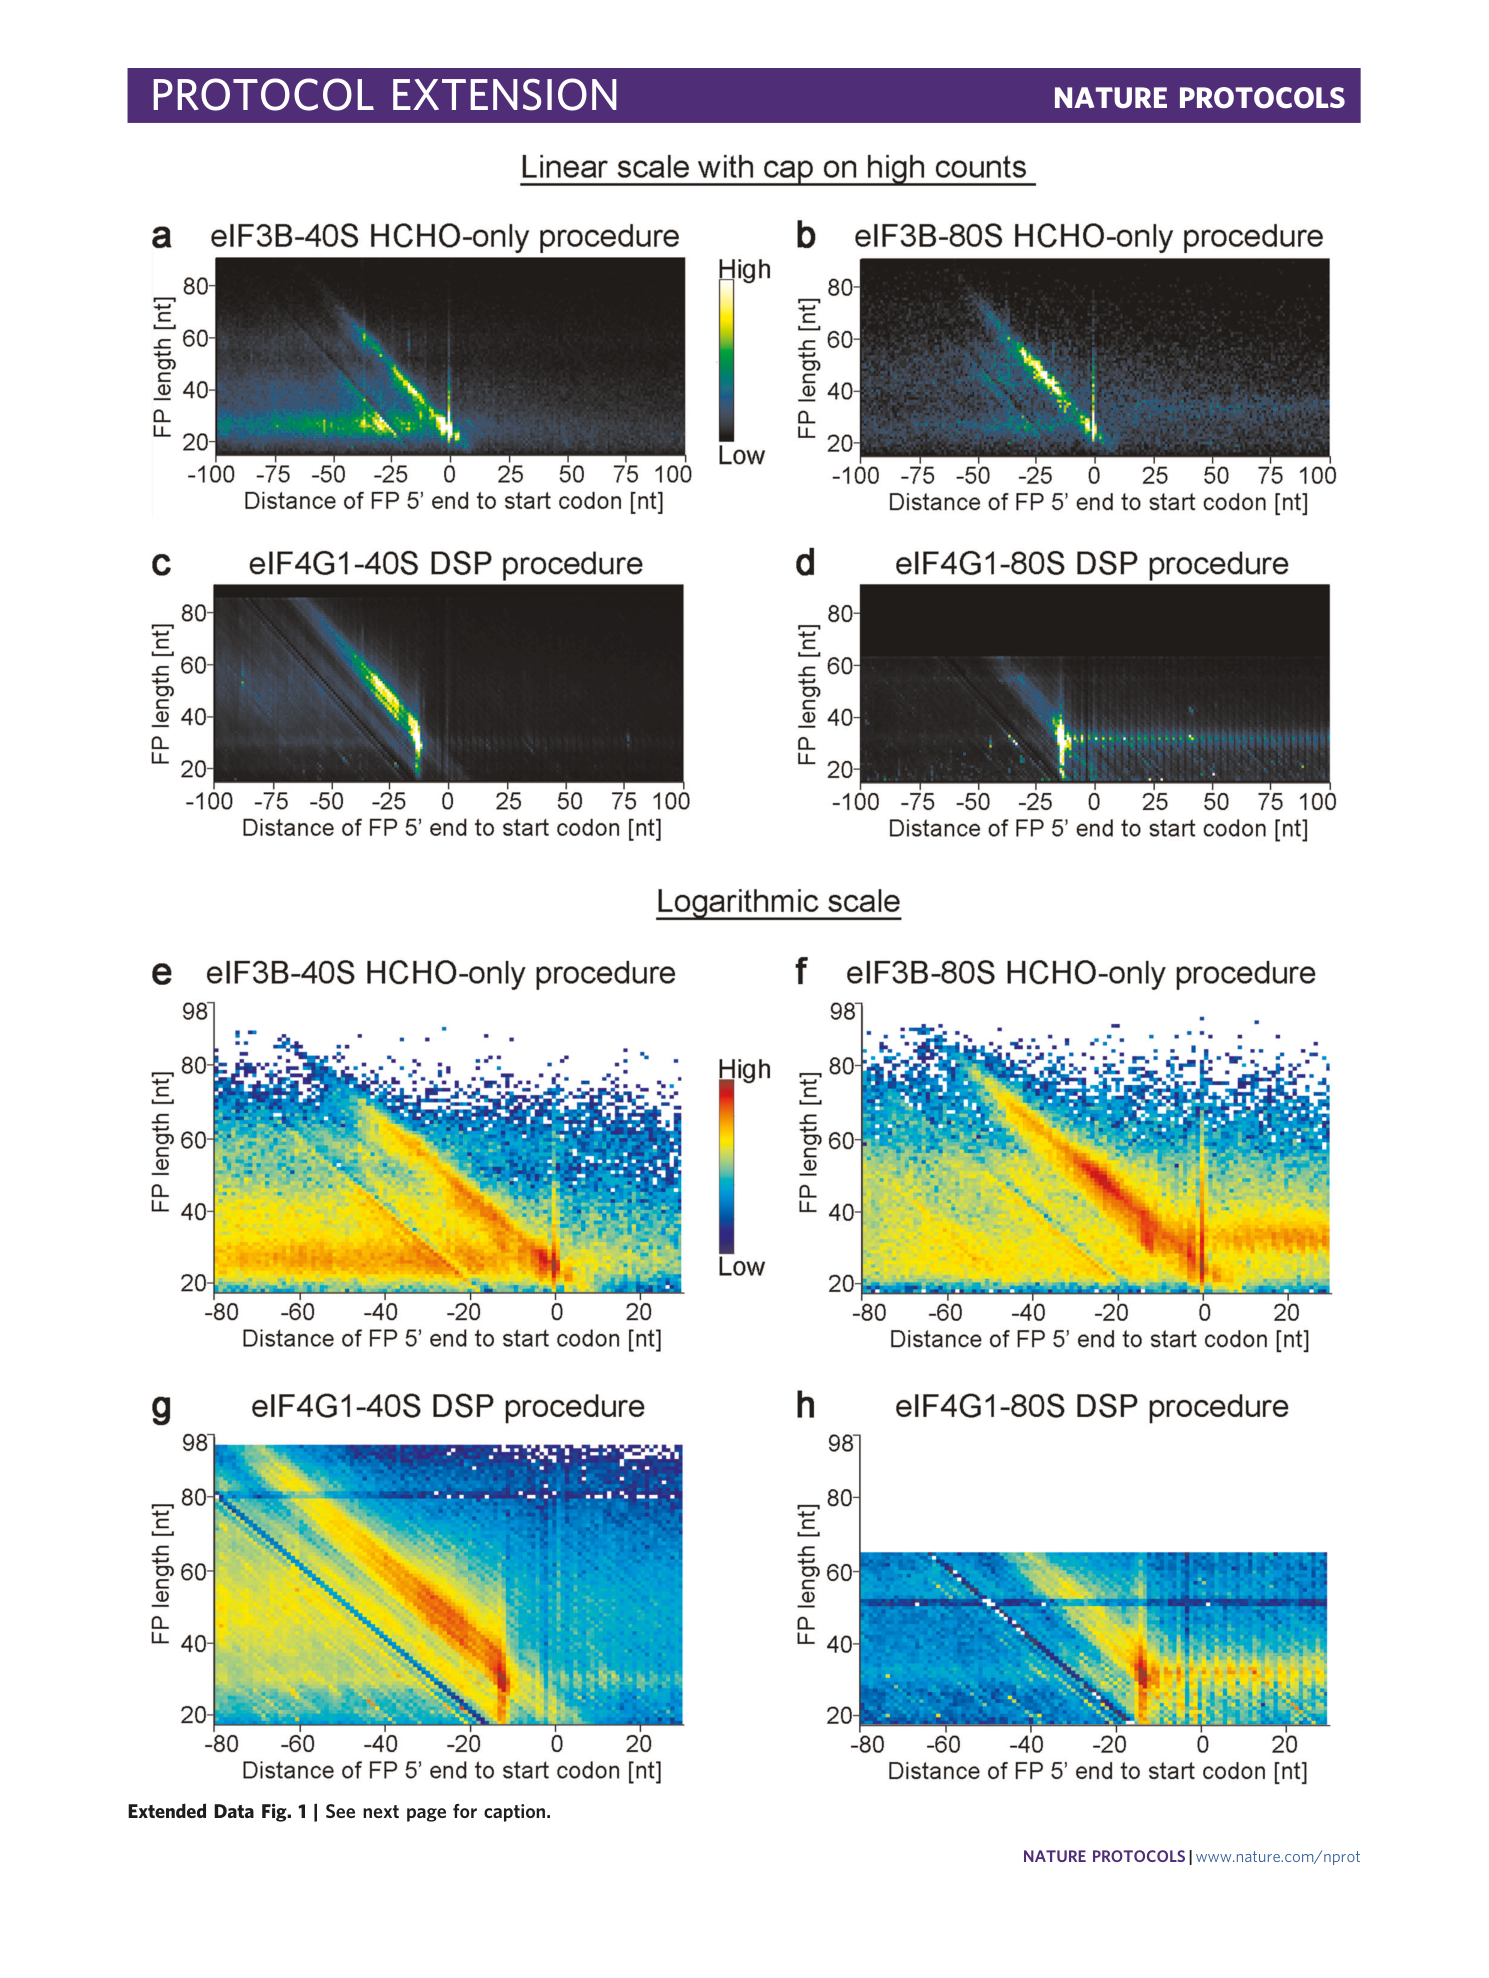
[ Extended Data Fig. 1 Useful representation of the selected 40S and 80S libraries, complementing Fig. 5 . ](https://www.nature.com/articles/s41596-022-00708-4/figures/6)
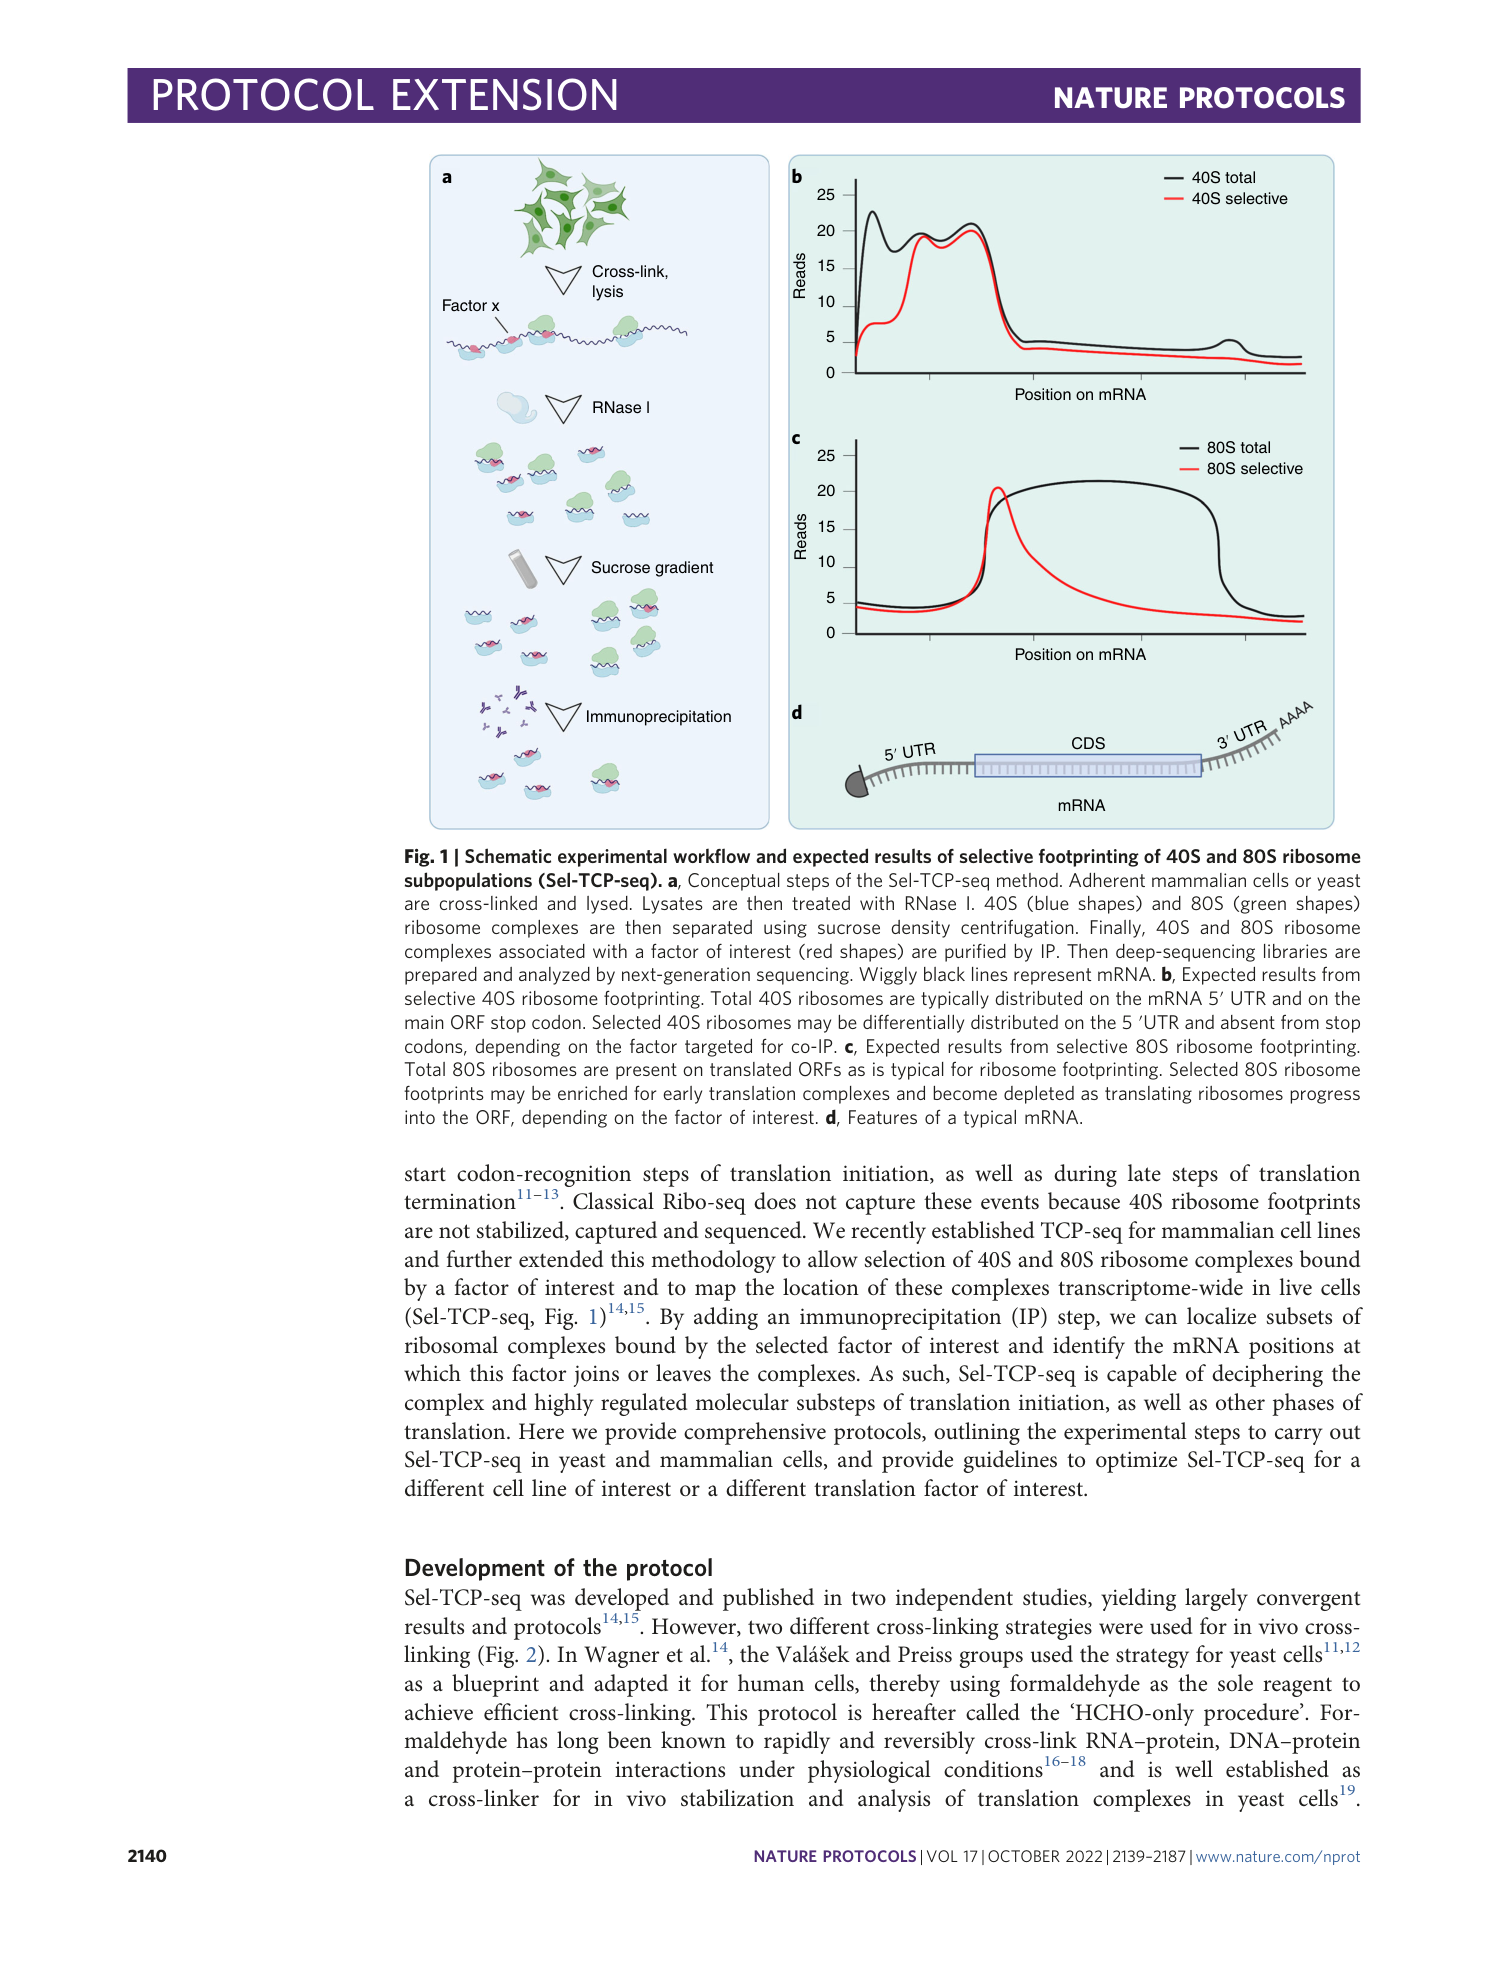
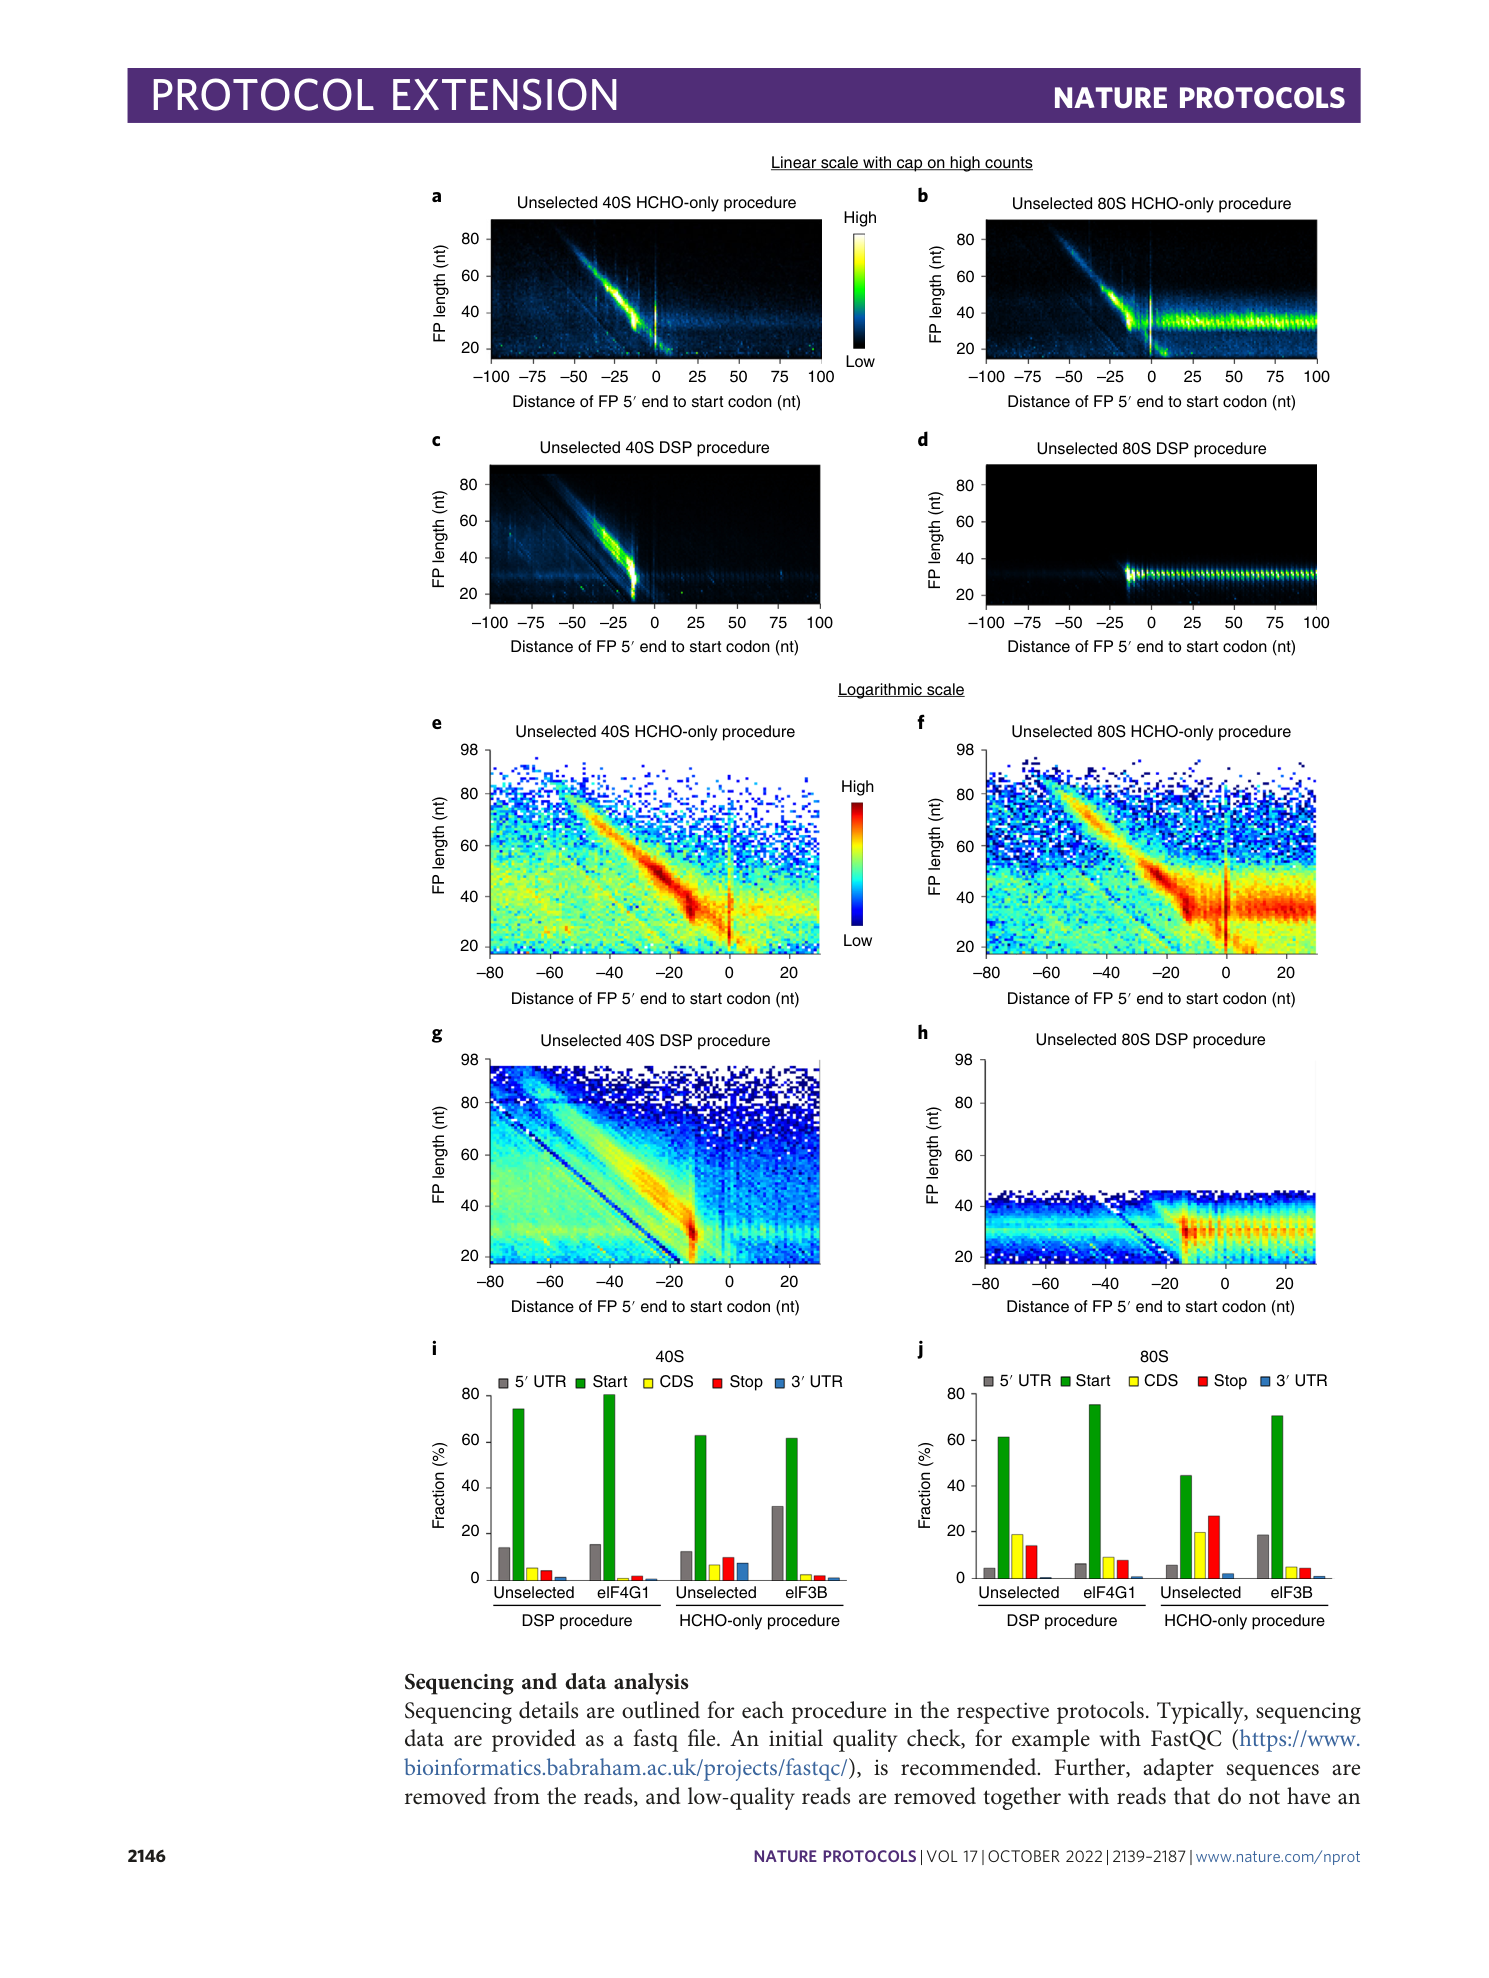
The datasets are available at NCBI Geo (GSE168977 and GSE139132). Similar plots, i.e., plots generated from the same datasets, were published previously 1 , 2 . a – h , Metagene plots of the distribution of the footprint length at any position around the start codon represented as a heatmap. The position of the 5′ end of the footprint is plotted. In a – d , counts are plotted in linear scale with a cap. In e – h , counts are plotted in log 10 scale. The full data range is represented. a and e show eIF3B-40S footprints from the HCHO-only procedure. b and f show eIF3B-80S footprints from the HCHO-only procedure. c and g show eIF4G1-40S footprints from the DSP procedure. d and h show eIF4G1-80S footprints from the DSP procedure. Note: For this specific eIF4G1-80S library, we carried out 75 sequencing cycles, and therefore, longer footprints are also detected.
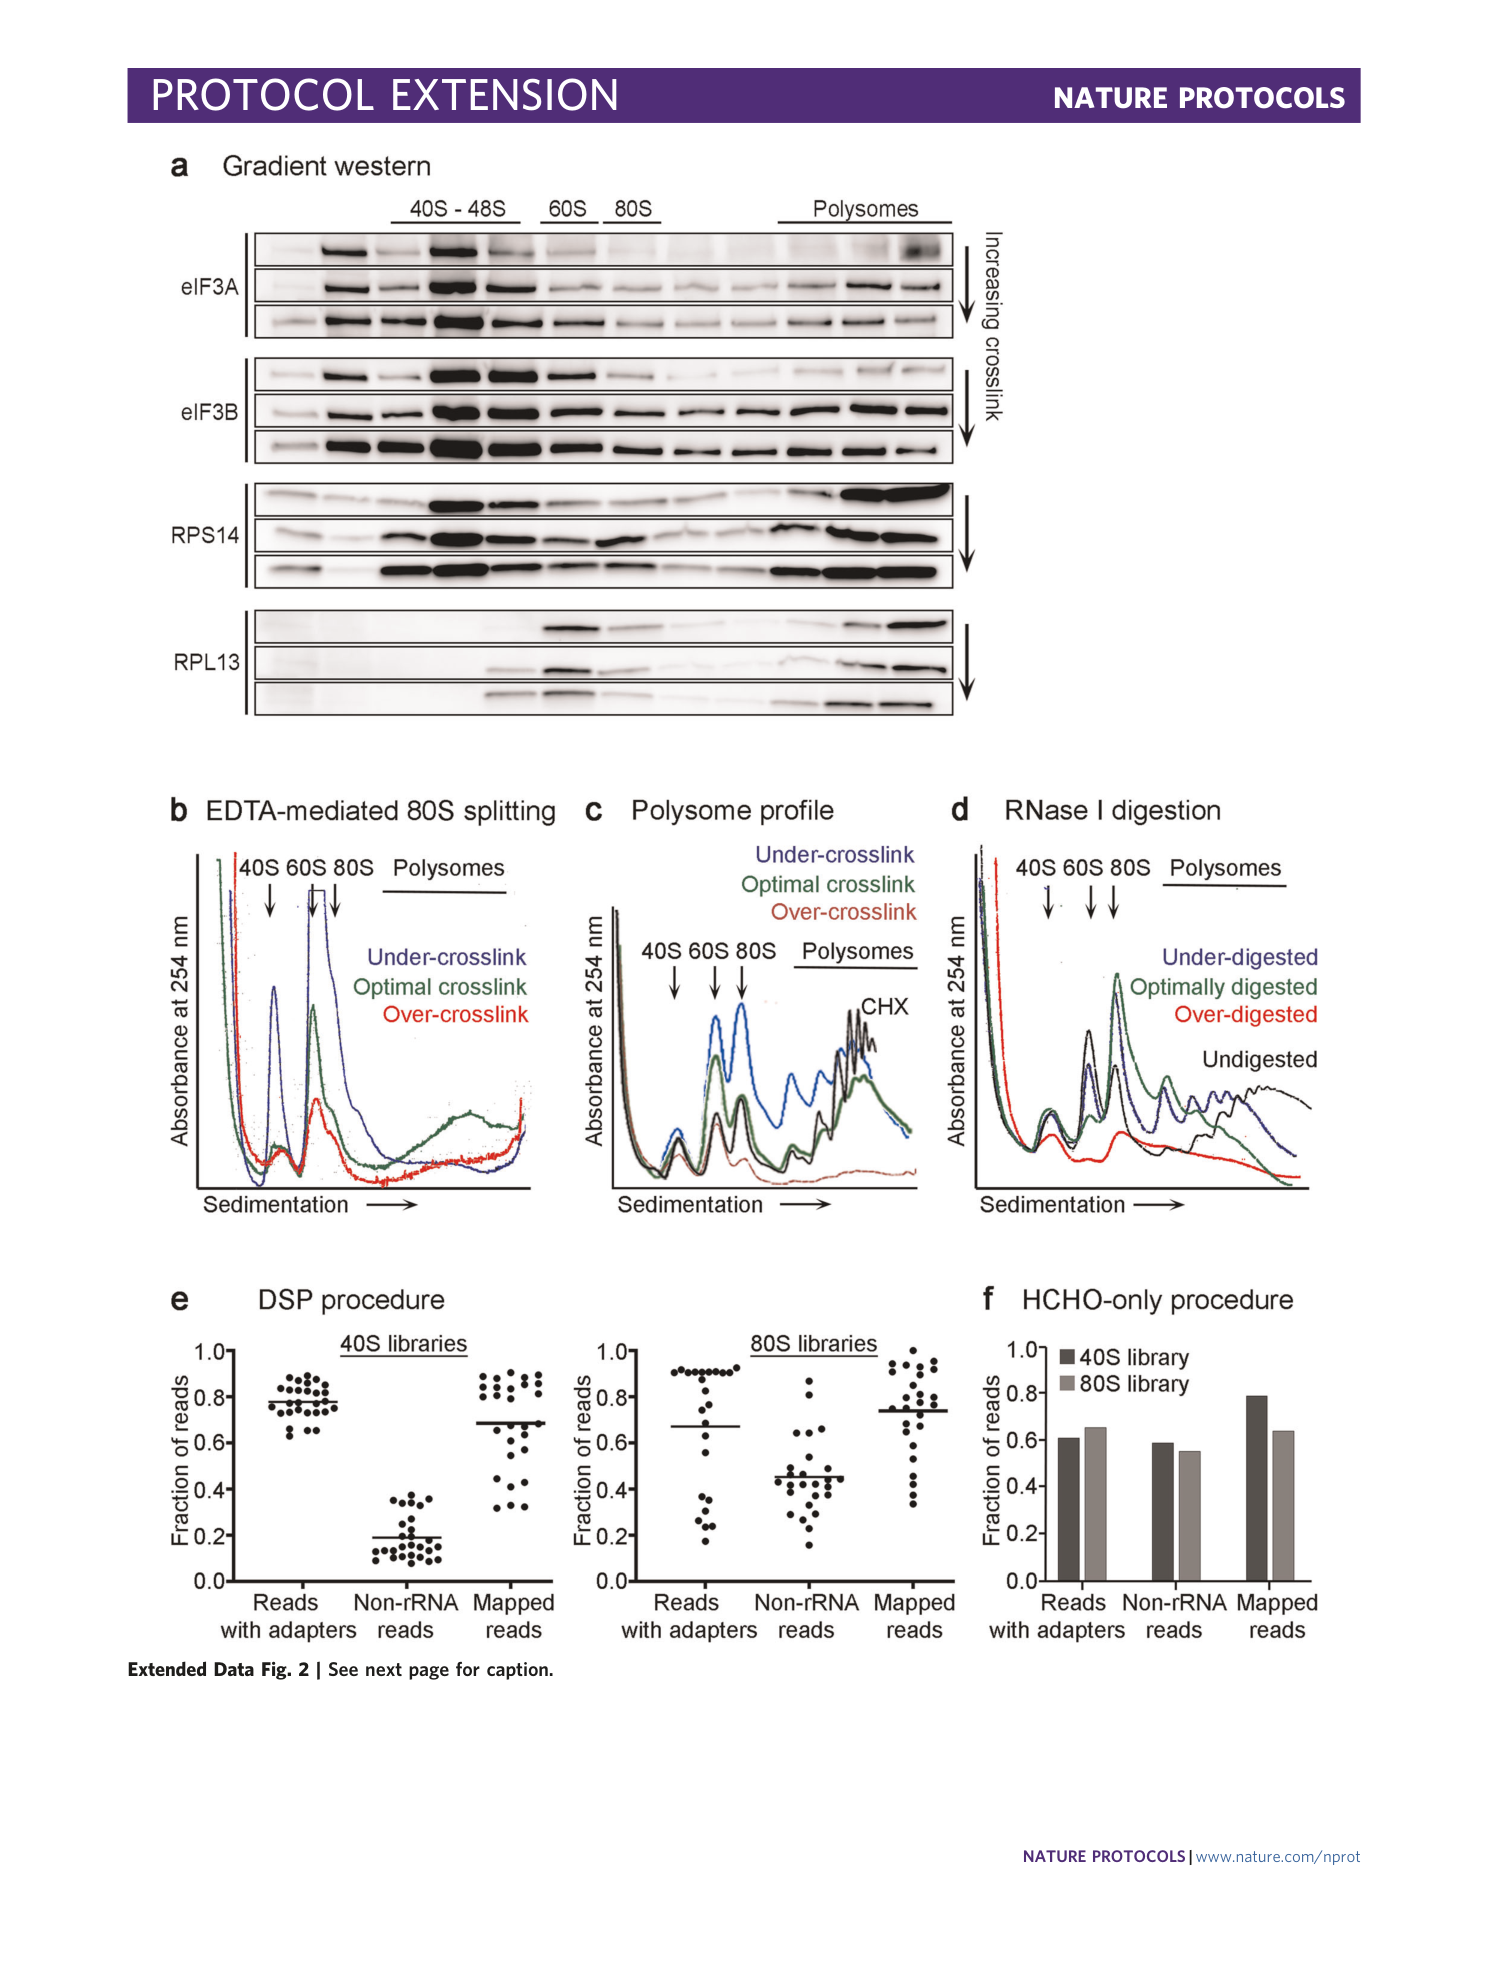
[ Extended Data Fig. 2 Examples of results useful for optimization experiments, complementing Box 1 , and a breakdown of the remaining sequencing reads. ](https://www.nature.com/articles/s41596-022-00708-4/figures/7)
a , Western blots of sucrose gradient fractions of three HEK293T lysates cross-linked with increasing efficiency. Probing with antibodies against a small ribosomal protein (RPS14) and a large ribosomal protein (RPL13) reveals fractions of 40S ribosomes and the polysomal fractions. Probing with antibodies against translation initiation factors eIF3A and eIF3B shows that, with increasing cross-linking efficiency, less eIF3A and eIF3B falls off the ribosomes during the high-velocity centrifugation, and therefore, more of these factors can be found in polysomal fractions as well as on the 40S. b , Profiles from three HEK293T lysates treated with EDTA. The cells were cross-linked with different efficiencies. The blue profile displays efficient EDTA-mediated splitting of the 80S ribosome into its 40S and 60S subunits, while the green profile displays reduced splitting, indicating efficient cross-linking of the cells. The red profile shows very efficient prevention of ribosome splitting and, at the same time, low polysomes. According to our experience, it reflects over-cross-linking of cells. c , Polysome profiles of HEK293T lysates that were either treated with cycloheximide (CHX, black profile) or cross-linked with different efficiencies indicated. The red profile represents over-cross-linking, while the blue profile represents under-cross-linking (large increase in 80S ribosomes and light polysomes and decrease in heavy polysomes). Panel c reproduced with permission from ref. 14 , Elsevier. d , Profiles of HEK293T lysates of cross-linked cells that were either left undigested (black profile) or digested with different RNase I concentrations. The green profile presents the most optimal digested lysate of the depicted profiles. e , f , Breakdown of the remaining fraction of sequencing reads after adapter removal (only those reads were kept that had an adapter and that were sufficiently long after adapter trimming), after rRNA removal and after mapping to a reference genome or transcriptome. e shows the breakdown for many libraries prepared according to the DSP procedure with the horizontal bar representing the average, and f for one exemplary library prepared according to the HCHO-only procedure.
Supplementary information
Supplementary Data 1
An exemplary bash script for data analysis as presented in the DSP procedure.
Supplementary Data 2
The fasta files used to deplete mouse and human rRNA sequences for data analysis as presented in the DSP procedure.
Supplementary Data 3
The fasta files used to deplete mouse and human tRNA sequences for data analysis as presented in the DSP procedure.
Supplementary Data 4
Tab-delimited text file containing feature identifiers and a position coordinate for each feature, to be used as an input file for generating metagene plots.
