Expanding the Perseus Software for Omics Data Analysis With Custom Plugins
Sung-Huan Yu, Sung-Huan Yu, Daniela Ferretti, Daniela Ferretti, Julia P. Schessner, Julia P. Schessner, Jan Daniel Rudolph, Jan Daniel Rudolph, Georg H. H. Borner, Georg H. H. Borner, Jürgen Cox, Jürgen Cox
Abstract
The Perseus software provides a comprehensive framework for the statistical analysis of large-scale quantitative proteomics data, also in combination with other omics dimensions. Rapid developments in proteomics technology and the ever-growing diversity of biological studies increasingly require the flexibility to incorporate computational methods designed by the user. Here, we present the new functionality of Perseus to integrate self-made plugins written in C#, R, or Python. The user-written codes will be fully integrated into the Perseus data analysis workflow as custom activities. This also makes language-specific R and Python libraries from CRAN (cran.r-project.org), Bioconductor (bioconductor.org), PyPI (pypi.org), and Anaconda (anaconda.org) accessible in Perseus. The different available approaches are explained in detail in this article. To facilitate the distribution of user-developed plugins among users, we have created a plugin repository for community sharing and filled it with the examples provided in this article and a collection of already existing and more extensive plugins. © 2020 The Authors.
Basic Protocol 1 : Basic steps for R plugins
Support Protocol 1 : R plugins with additional arguments
Basic Protocol 2 : Basic steps for python plugins
Support Protocol 2 : Python plugins with additional arguments
Basic Protocol 3 : Basic steps and construction of C# plugins
Basic Protocol 4 : Basic steps of construction and connection for R plugins with C# interface
Support Protocol 4 : Advanced example of R Plugin with C# interface: UMAP
Basic Protocol 5 : Basic steps of construction and connection for python plugins with C# interface
Support Protocol 5 : Advanced example of python plugin with C# interface: UMAP
Support Protocol 6 : A basic workflow for the analysis of label-free quantification proteomics data using perseus
INTRODUCTION
The complex downstream analysis of proteomic data requires the integration of bioinformatics, statistics, network analysis, and, frequently, machine learning. This has led to the development of the Perseus software (Tyanova et al., 2016) as a comprehensive multi-purpose tool and framework for such analyses. The user-friendly interface facilitates a variety of data transformations and visualizations and provides gapless documentation, a storable analysis workspace, and a visual representation of the analysis workflow. The options for multidimensional omics data analysis include normalization, pattern recognition, time-series analysis, cross-omics comparisons, and controlled multiple-hypothesis testing.
The core data structure is a matrix, containing one row per entry in the dataset, usually a protein or protein group. The columns can contain variable information of different data types. Perseus distinguishes between “Numerical” columns containing single number values, “Multi-numerical” columns that can contain more than one value in one cell (split by semi-colons), “Categorical” columns that can contain binary flags, grouping information, or biological annotation of individual entries (which can be added through Perseus), and, finally “Text” columns for anything that is neither a number nor a category. Perseus additionally distinguishes the columns containing the “Main” data for each entry, e.g., the quantitative expression values of each protein group in different samples. These types can be specified on data import and changed throughout the analysis. In addition to the annotation columns, annotation rows can be defined to specify column grouping parameters such as biological conditions and technical replicates. This structure makes Perseus very flexible, allowing statistical analysis for a considerable variety of experimental designs and thereby facilitating hypothesis generation (Rudolph & Cox, 2019).
Despite this broad applicability there will always be a specific case study or new technology that requires additional functionalities so far not provided by Perseus. To expand Perseus’ functionality with plugins is neither difficult nor complex: the core data structure is propagated to external plugins and back to the Perseus framework through well-defined interfaces. Newly implemented functionalities can be directly incorporated into the Perseus interface, making them indistinguishable from the core functions. This had already been possible for plugins written in C#, since it is Perseus's native language, but it is now also possible for plugins written in other languages including R and Python. This facilitates the interoperability of Perseus with external scripting languages, and allows developers to use a language they are already comfortable with. The backend providing this new functionality is called PluginInterop: it runs the external plugin with a specified executable and facilitates passing additional arguments to the plugin (Rudolph & Cox, 2019). Since R and Python are widely used in data science, two companion libraries are provided for these two languages to be used alongside PluginInterop: PerseusR and perseuspy. They provide the other half of the interface for seamless transfer of matrices and annotations from Perseus to R/Python data frame objects and vice versa.
In this article, we provide extensive explanations for all the steps and details of creating custom plugins for Perseus in all three languages—starting from the basic installation steps and the use of the different interfaces and proceeding all the way to advanced analysis plugins. Together with the protocols, we provide a GitHub repository (https://github.com/JurgenCox/perseus-plugin-programming) where the given examples are available for download, as well as a list of already existing plugins of varying complexity and where to find them online (Table 1).
| Plugins | Usage | Languages | Reference/link |
|---|---|---|---|
| DualQualityFilter | Dual-quality matrix filter; intended to be used for filtering SILAC data based on MS/MS count and variability. | R | https://github.com/JuliaS92/PerseusR-DualQualityFilter |
| ProfileCorrelation | For each row, calculates pairwise correlations between profiles defined by categorical annotation rows | Python | https://github.com/JuliaS92/PerseusPy-ReplicateCorrelation |
| DE analysis | Differential expression analysis for Omics data. The algorithms include DESeq2 (Love, Huber, & Anders, 2014), EdgeR (Robinson, McCarthy, & Smyth, 2010) and Limma (Ritchie et al., 2015). | R + C# | DESeq2, EdgeR, and Limma |
| Clustering | Dimensionality-reduction methods. The newly added algorithms are UMAP (Becht et al., 2019; McInnes et al., 2018) and tSNE (Maaten, van der, van der Maaten, & Hinton, 2008). | R/Python + C# | UMAP and tSNE |
| imputeLCMD | The collection of imputation methods for proteomics data. The software of imputeLCMD (Johnson, Li, & Rabinovic, 2007) is from sva (Leek, Johnson, Parker, Jaffe, & Storey, 2012). | R + C# | sva |
| Quantile normalization | Making the distributions identical in statistical properties. The software is from Limma (Ritchie et al., 2015). | R + C# | Limma |
| Remove batch effect (proteinGroup) | Remove the batch effect in protein group level. The algorithms contain Limma (Ritchie et al., 2015) and ComBat (Johnson et al., 2007). | R + C# | Limma and ComBat |
| PHOTON | Elucidation of Signaling Pathways from Large-Scale Phosphoproteomic Data Using Protein Interaction Networks (Rudolph & Cox, 2019) | Python + C# | https://github.com/jdrudolph/photon |
| WGCNA | Weighted correlation coefficient network analysis (Langfelder & Horvath, 2008) | R + C# | WGCNA |
| Proteomics ruler | Proteomics normalization without spike-in standard (Wiśniewski, Hein, Cox, & Mann, 2014). | C# | https://maxquant.org/perseus_plugins |
STRATEGIC PLANNING
Before starting to develop a new Perseus plugin, a few things need to be considered, for instance, which language should be employed, who is going to use the plugin, and how many additional arguments are needed for the plugin to work. These are relevant questions, since there are two ways of integrating non-C# plugins into Perseus. They can be incorporated with a command line interface or with a C# wrapper for R/Python plugins. The command line interface lets you select the plugin script file and provides a single input line for arguments to be passed to the script. On the other hand, the C# wrapper generates a small graphical user interface to ask for parameter values and adds a separate entry to a selectable interface menu in Perseus, thereby avoiding the manual selection of the script file before every run (see Figs. 1-4). Thus, a C# wrapper for R/Python plugins is not required if the plugin is meant to be used only by the developer or users comfortable with the command line interface. Conversely, the use of a C# wrapper is highly recommended if a broad user base is expected or a larger number of arguments needs to be supplied to the plugin. A third alternative is to write the plugin entirely in C#, in which case the integration is direct, and no wrapping code is necessary. For all these variants, detailed protocols are provided. If an R or Python plugin is being developed, it is always possible to initially use the command line interface, and then add a C# wrapper before it is released to other users, as long as some conventions are followed. All the software development tools required for Perseus plugin development are freely available.
Basic Protocol 1: BASIC STEPS FOR R PLUGINS
R is one of the most widely used programming languages for bioinformatics. Numerous packages for statistical data analysis and visualization have been created by R developers. In order to make Perseus more powerful by making these functions available from within the software, a package for integrating R scripts into Perseus was developed—PerseusR (Rudolph & Cox, 2019). With this, all custom tools originally scripted in R can now be used within Perseus. In this basic protocol, a simple example of an R-only plugin, extracting the head (top rows) of a matrix, will be presented to illustrate how the data transfer between Perseus and R functions. This example will be run through the command line style interface. The code of this example is available at: https://github.com/JurgenCox/perseus-plugin-programming/blob/master/scripts/head.R.
Necessary Resources
Hardware
- A computer running Windows 8 (64 bit) or higher, or Windows Server 2008 or higher
- 4 GB RAM minimum
- At least a quad core processor is recommended
Software
- Perseus 1.6.13 or higher:–can be downloaded from https://maxquant.org/perseus
- R: Please use a version ≥ 3.5.0. The Rscript executable has to be listed in the PATH environment variable of the operating system. Please refer to the “Troubleshooting” if Perseus cannot find your R installation, which is indicated in the command line style interface.
- PerseusR: available at https://github.com/cox-labs/PerseusR, where installation instructions are provided
- install.packages(“devtools”)
- library(devtools)
- install_github(“cox-labs/PerseusR”)
- R-supported editor like Visual Studio, RStudio or Notepad++
Input files
- This protocol requires no extra input files. The outlined plugin works with a randomly generated matrix, which can be done using the dice button in Perseus.
1.Parse command line arguments from Perseus.
- args = commandArgs(trailingOnly=TRUE)
- if (length(args) != 2) {
- stop("Do not provide additional arguments!", call.=FALSE)
- }
- inFile <- args[1]
- outFile <- args[2]
2.Use PerseusR to read the data matrix written by Perseus.
- library(PerseusR)
- mdata <- read.perseus(inFile)
3.Get the main matrix of Perseus for data processing.
- counts <- main(mdata)
4.Execute the main custom code for data analysis or modification.
- mdata2 <- head(counts, n=15)
- aCols <- head(annotCols(mdata), n=15)
5.Export the output matrix to Perseus with correct format.
- mdata2 <- matrixData(main=mdata2, annotCols=aCols, annotRows=annotRows(mdata))
- print(paste(`writing to', outFile))
- write.perseus(mdata2, outFile)
6.Apply the plugin in Perseus.
- Open Perseus and import the matrix/load a session file.
A random matrix is used for testing the plugin in this tutorial.
- Execute the plugin.
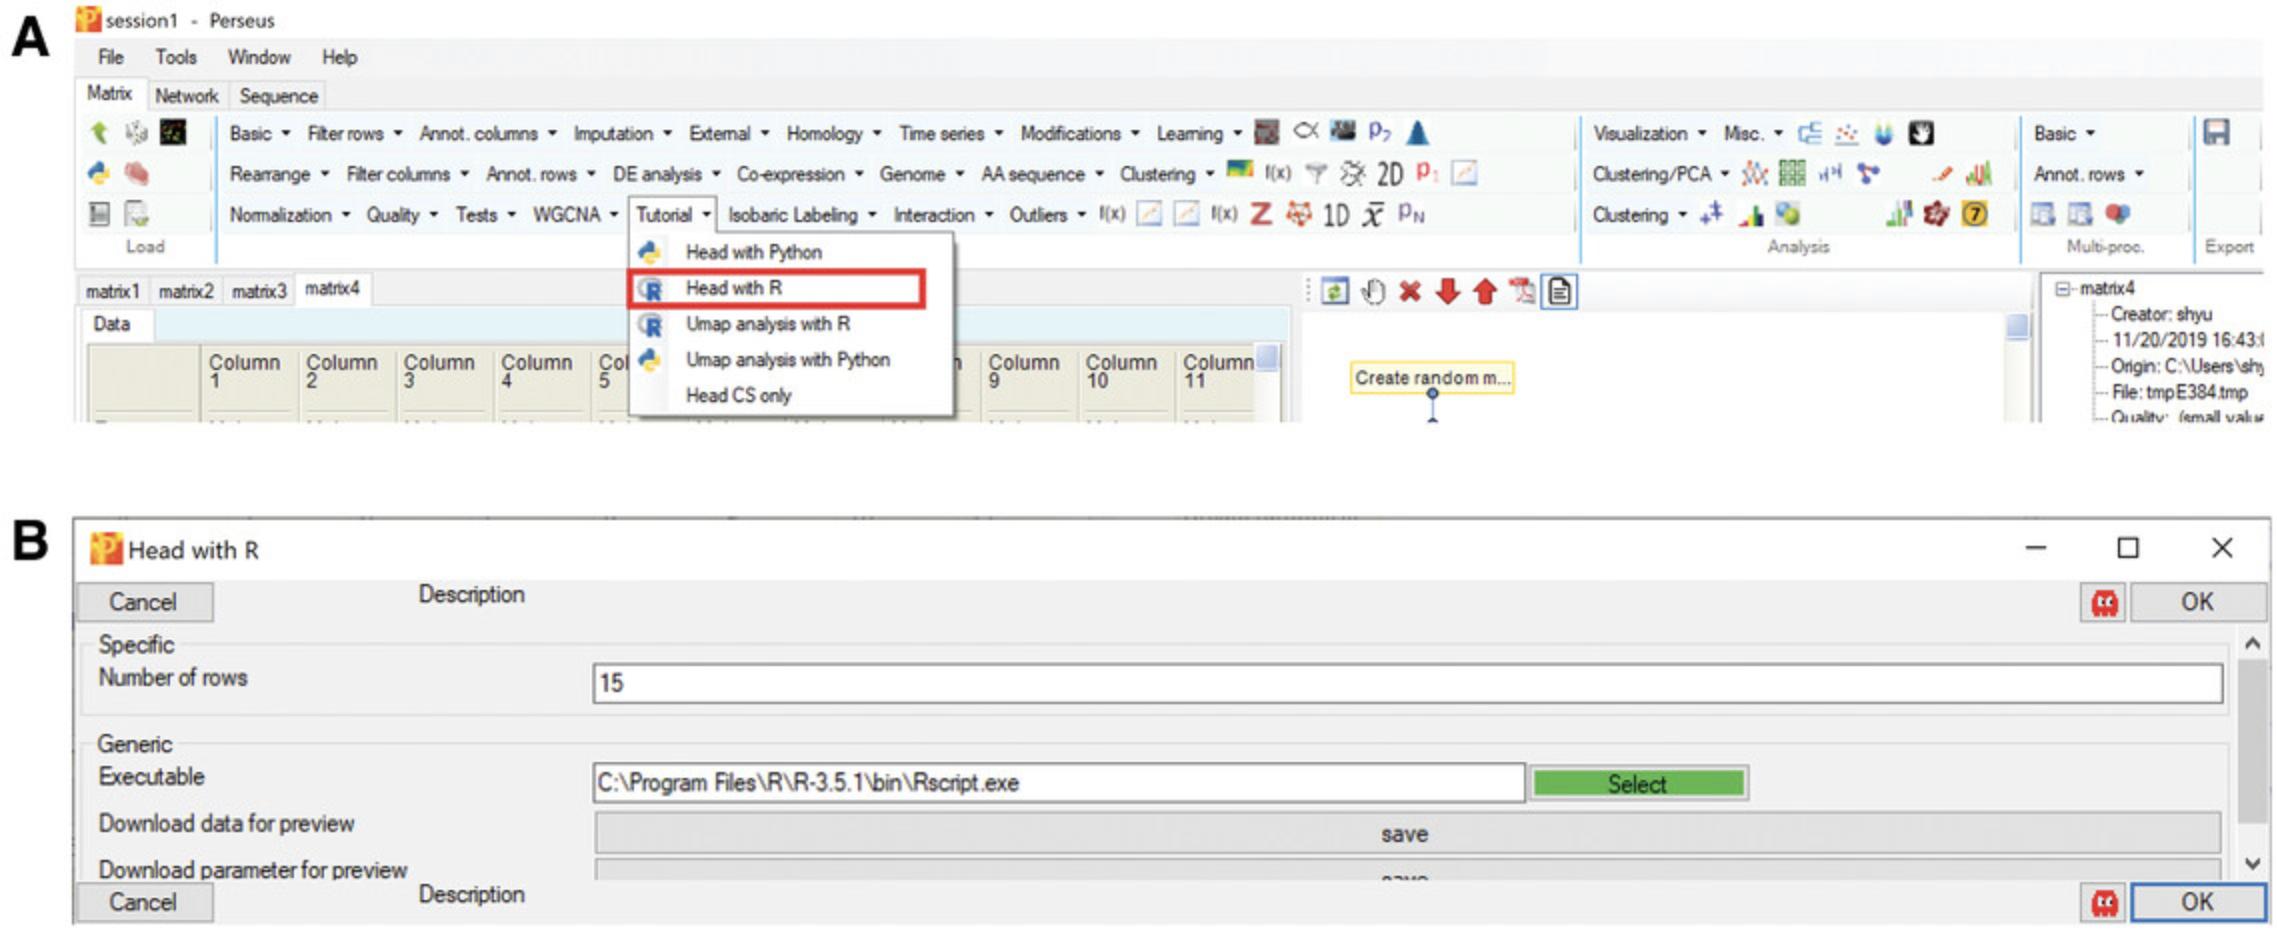
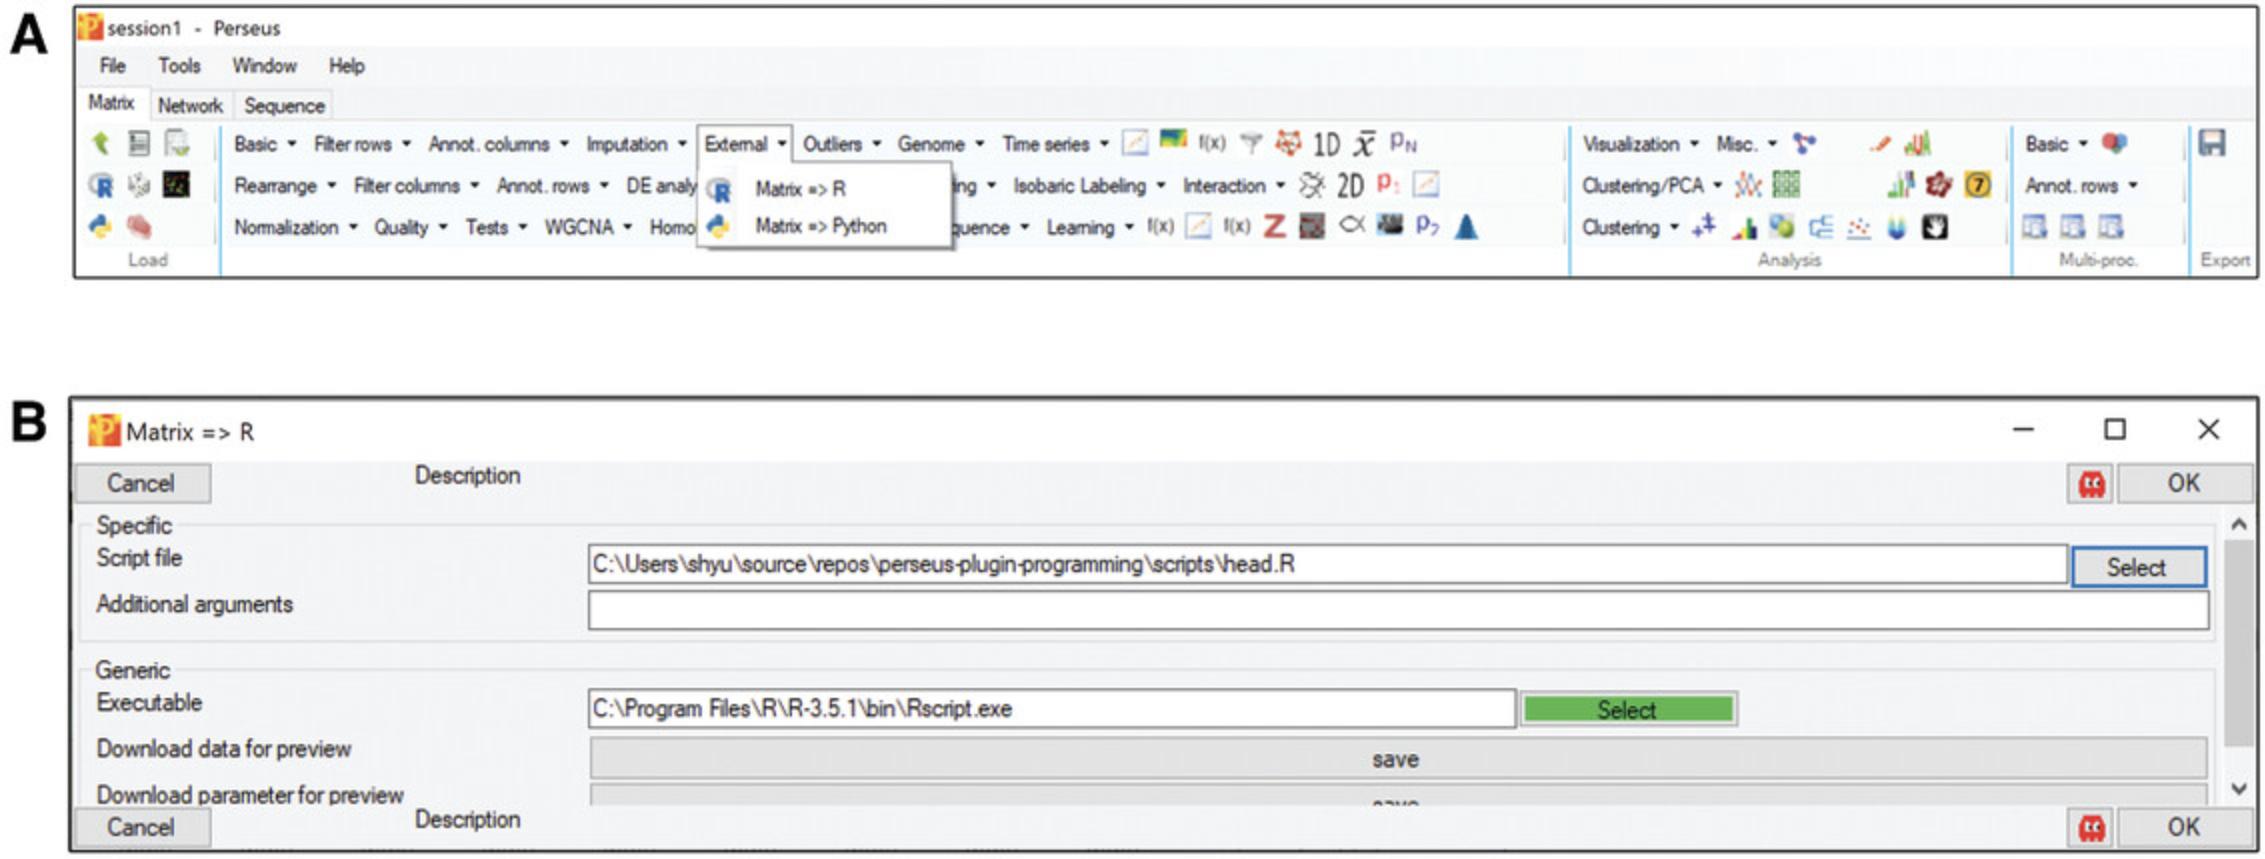
In the “Processing” block, click “External” –> “Matrix –> R”. If the button “select” is green, it means that Perseus recognized your R installation and PerseusR (Figure5A), otherwise navigate to yourRscript.exeor add it to your systems PATH variable. Afterwards, specify the R script that you want to execute and click OK (Fig.5B).
Support Protocol 1: R PLUGINS WITH ADDITIONAL ARGUMENTS
In order to make a script more flexible and useful, additional parameters are usually required. With the above example of extracting the head of a matrix (Basic Protocol 1), it will be much more convenient if the number of rows can be defined by the users. The following steps will provide the details of how to add parameters to the plugins. The script, including all steps, can also be found at https://github.com/JurgenCox/perseus-plugin-programming/blob/master/scripts/head_add_argument.R.
Necessary Resources
- Same as Basic Protocol 1
1.Install the argparser library (https://cran.r-project.org/web/packages/argparser/) with install_packages("argparser") and parse command line arguments from Perseus.
- argv <- commandArgs(trailingOnly=TRUE)
- library("argparser")
- p <- arg_parser(description = "Head processing")
- p <- add_argument(p, `input', help="path of the input file")
- p <- add_argument(p, `output', help="path of the output file")
- p <- add_argument(p, `--nrow', type="numeric", default=15, help="the number of row")
- argp <- parse_args(p, argv)
2.Use PerseusR to read the data in Perseus.
- library(PerseusR)
- mdata <- read.perseus(inFile)
3.Get the main matrix of Perseus for the data processing.
- counts <- main(mdata)
4.Execute the main part for data analysis or modification.
- mdata2 <- head(counts, n=num)
- aCols <- head(annotCols(mdata), n=num)
5.Export the output matrix to Perseus with correct format.
- mdata2 <- matrixData(main=mdata2, annotCols=aCols, annotRows=annotRows(mdata))
- print(paste(`writing to', outFile))
- write.perseus(mdata2, outFile)
6.Apply the plugin in Perseus.
Basic Protocol 2: BASIC STEPS FOR PYTHON PLUGINS
In recent years, many useful Python packages have been developed for computational biology and data visualization. Moreover, an annual conference (SciPy) provides a platform where up-to-date Python tools are released and presented. Perseuspy builds a bridge to integrate Python libraries into Perseus as plugins (Rudolph & Cox, 2019). In this section, we provide the basic steps for generating Python-only plugins through the command line style interface. The code for this example is available at https://github.com/JurgenCox/perseus-plugin-programming/blob/master/scripts/head.py.
Necessary Resources
Hardware
- A computer running Windows 8 (64 bit) or higher or Windows Server 2008 or higher
- 4 GB RAM minimum
- At least a quad core processor is recommended
Software
- Perseus 1.6.13 or higher: can be downloaded from https://maxquant.org/perseus.
- Python: use version higher than 3.7.0. The Python executable has to be listed in the PATH environment variable of the operating system. Please refer to Troubleshooting if Perseus cannot find your Python installation, which is indicated in the command line−style interface.
- Perseuspy: available at https://github.com/cox-labs/perseuspy. An installation guide and required dependencies can be found in the repository. Also available on PyPI (https://pypi.org/project/perseuspy/).
- Python supported editor like Visual Studio, PyCharm or Notepad++
Input files
- This protocol requires no extra input files. The outlined plugin works with a randomly generated matrix, which can be generated using the dice button in Perseus.
1.Import the required packages.
- import sys
- from perseuspy import pd
2.Parse command line arguments from Perseus.
- _, infile, outfile = sys.argv
3.Read the data from Perseus.
- df = pd.read_perseus(infile)
4.The main custom code for data analysis or modification.
- df2 = df.head(15)
5.Export the output matrix to Perseus with correct format.
- df2.to_perseus(outfile)
6.Apply the plugin in Perseus.
- Open Perseus and import the matrix or load a session.
A random matrix is used for testing the plugin in this tutorial.
- Execute the plugin.
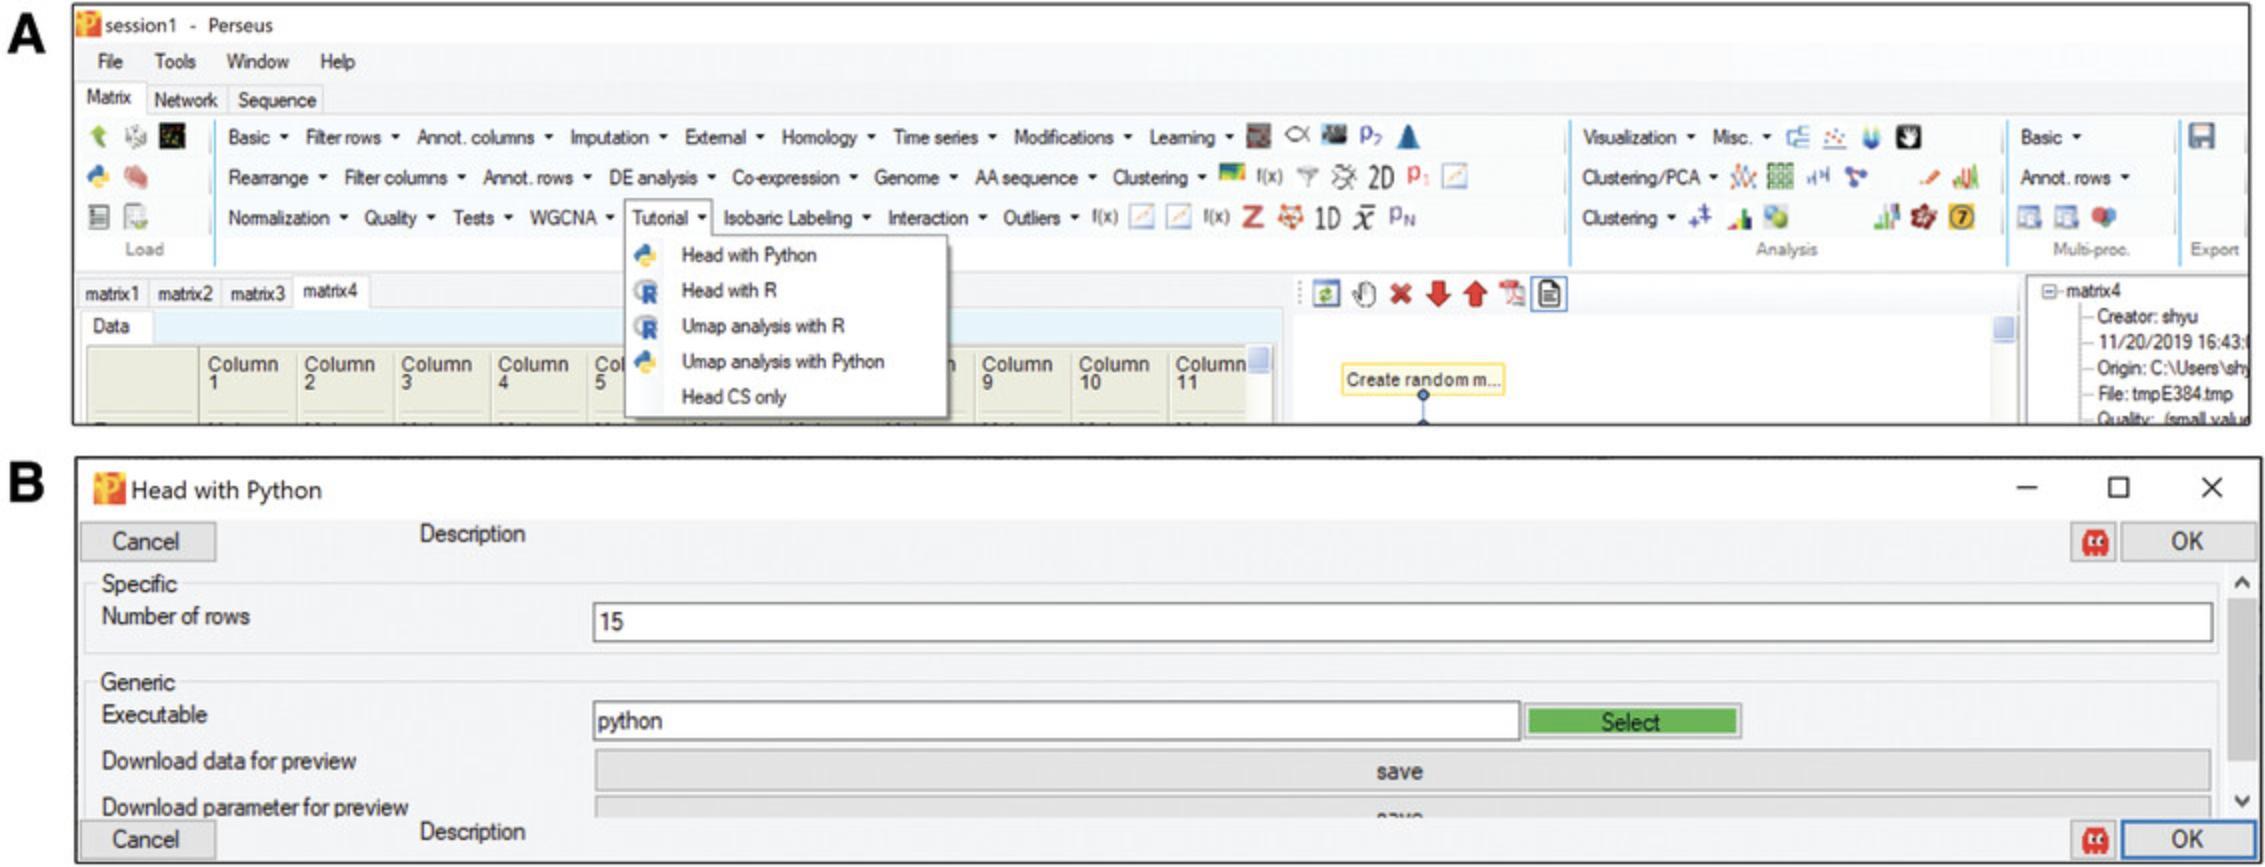
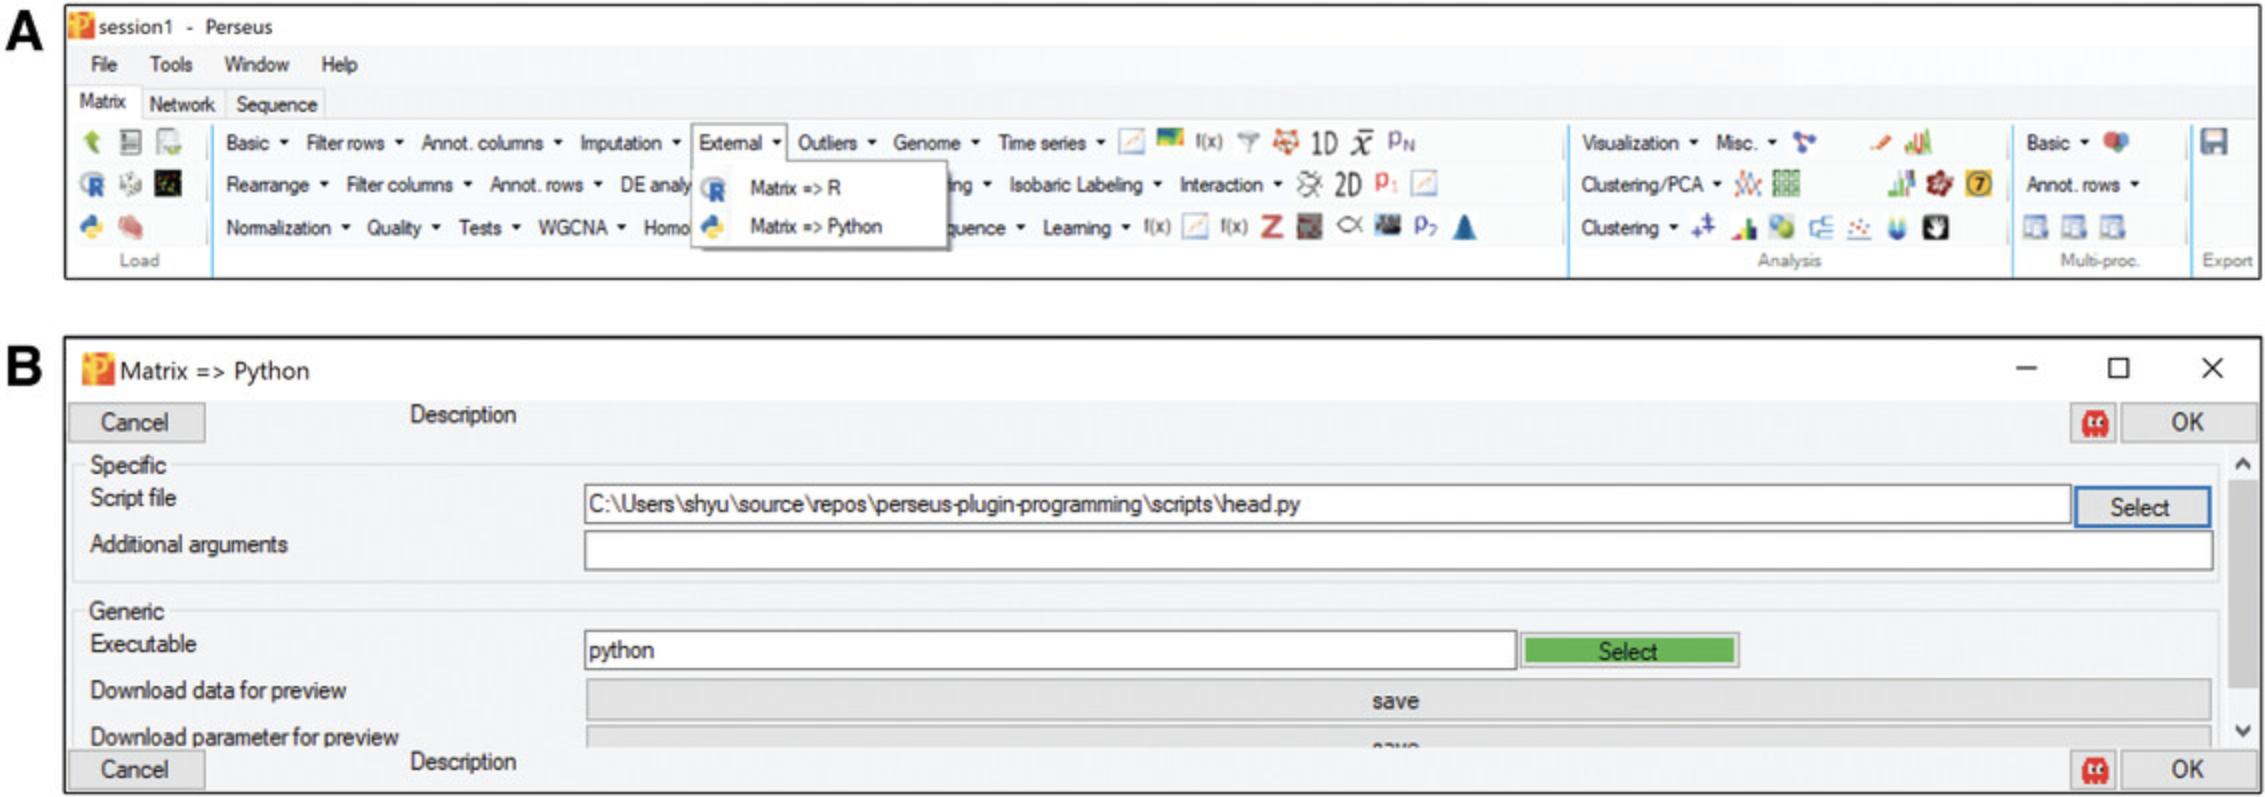
In the “Processing” block, click “External” –> “Matrix –> Python”. If the button “select” is green, it means that Perseus recognized your Python installation and perseuspy (Fig.6A); otherwise, navigate to yourpython.exeor add it to your systems PATH variable. Afterwards, specify the Python script that you want to execute and click OK (Fig.6B).
Support Protocol 2: PYTHON PLUGINS WITH ADDITIONAL ARGUMENTS
For a more elaborate analysis, Python plugins can also be passed additional arguments just like R plugins. The following steps will demonstrate the steps needed for adding parameters to plugins. The example the number of rows to obtain from the top of the matrix can be specified by the user. The script is available at https://github.com/JurgenCox/perseus-plugin-programming/blob/master/scripts/head_add_argument.py.
Necessary Resources
- Same as Basic Protocol 2
- Additionally, the package argparse needs to be installed in the Python environment
1.Import the required packages.
- import argparse
- from perseuspy import pd
2.Parse command line arguments from Perseus.
- parser = argparse.ArgumentParser("Head processing")
- parser.add_argument("input", help="path of the input file")
- parser.add_argument("output", help="path of the output file")
- parser.add_argument("--nrow", type=int, default=15, help="the number of row")
- arg = parser.parse_args()
3.Read the data from Perseus.
- df = pd.read_perseus(arg.input)
4.Retrieve the user-define arguments (--nrow) to modify the matrix.
- df_head = df.head(arg.nrow)
5.Export the output matrix to Perseus with correct format.
- df2.to_perseus(arg.output)
6.Apply the plugin in Perseus.
Basic Protocol 3: BASIC STEPS AND CONSTRUCTION OF C# PLUGINS
Even better integrated plugins with an automatically generated graphical user interface for the parameters can be generated when using C#, which is the original programming language of Perseus. The architecture of Perseus plugins is systematic and well structured. Numerous C# plugins can be found at https://github.com/JurgenCox/perseus-plugins. All the scripts can be recycled and modified by users. The same basic example as in the previous sections will be used to explain how to generate a C# plugin. The script of the example can be seen at https://github.com/JurgenCox/perseus-plugin-programming/blob/master/PluginTutorial/Head_c_sharp.cs.
Necessary Resources
Hardware
- A computer running Windows 8 (64 bit) or higher, or Windows Server 2008 or higher
- 4 GB RAM minimum
- At least a quad core processor is recommended
Software
- Perseus 1.6.13 or higher: can be downloaded from https://maxquant.org/perseus
- For editing C# code, Visual Studio Community Edition is recommended (https://www.visualstudio.com/downloads/). Please select the “.Net Desktop Development workflow” in the installer to install everything required. To ensure version compatibility, please use .NET Framework <= 4.7.2 or .NET Core <= 2.1.
- .NET packages BaseLibS and PerseusAPI: Both of these can be installed by using “Manage NuGet Packages” in Visual Studio, which is explained in step 2 of the protocol
1.Create a C# project.
2.Add the dependencies.
3.Import packages and define namespace with a class.
- using System.Linq;
- using BaseLibS.Graph;
- using BaseLibS.Param;
- using PerseusApi.Document;
- using PerseusApi.Generic;
- using PerseusApi.Matrix;
- namespace PluginTutorial
- {
- public class PluginHead : IMatrixProcessing
- {
- }
- }
4.Generate basic structure of the C# plugin.
- namespace PluginTutorial
- {
- public class PluginHead : IMatrixProcessing
- {
- public bool HasButton => false;
- public string Description => "extract the header of the matrix.";
- public string HelpOutput => "extract the header of the matrix.";
- public string[] HelpSupplTables => new string[0];
- public int NumSupplTables => 0;
- public string Name => "Head CS only";
- public string Heading => "Tutorial";
- public float DisplayRank => 6;
- public string[] HelpDocuments => new string[0];
- public int NumDocuments => 0;
- public string Url => null;
- public Bitmap2 DisplayImage => null;
- public bool IsActive => true;
- public int GetMaxThreads(Parameters parameters)
- {
- return 1;
- }
- public void ProcessData(IMatrixData mdata, Parameters param, ref
- IMatrixData[] supplTables,
- ref IDocumentData[] documents, ProcessInfo processInfo)
- {
- }
- public Parameters GetParameters(IMatrixData mdata, ref string errorString)
- {
- }
- }
- }
5.Add parameters.
- public Parameters GetParameters(IMatrixData mdata, ref string errorString)
- {
- return new Parameters(new IntParam("Number of rows", 15)
- {
- Help = "The number of rows for the header needs to be kept."
- });
- }
- public Parameters GetParameters(IMatrixData mdata, ref string errorString)
- {
- return new Parameters(new IntParam("Number of rows", 15)
- {Help = "The number of rows to retain."},
- new IntParam("Number of columns", 2)
- {Help = "The number of columns to retain."}
- );
- }
6.Generate the code for data processing.
- public void ProcessData(IMatrixData mdata, Parameters param, ref IMatrixData[]
- supplTables, ref IDocumentData[] documents,
- ProcessInfo processInfo)
- {
- int lines = param.GetParam
("Number of rows").Value; - int[] head = Enumerable.Range(0, lines).ToArray();
- mdata.ExtractRows(head);
- }
7.Compile the plugin and copy the dll.
8.Apply the plugin in Perseus.
- Open Perseus and import the matrix or open a session.
A random matrix is used for testing the plugin in this tutorial.
- Execute the plugin.
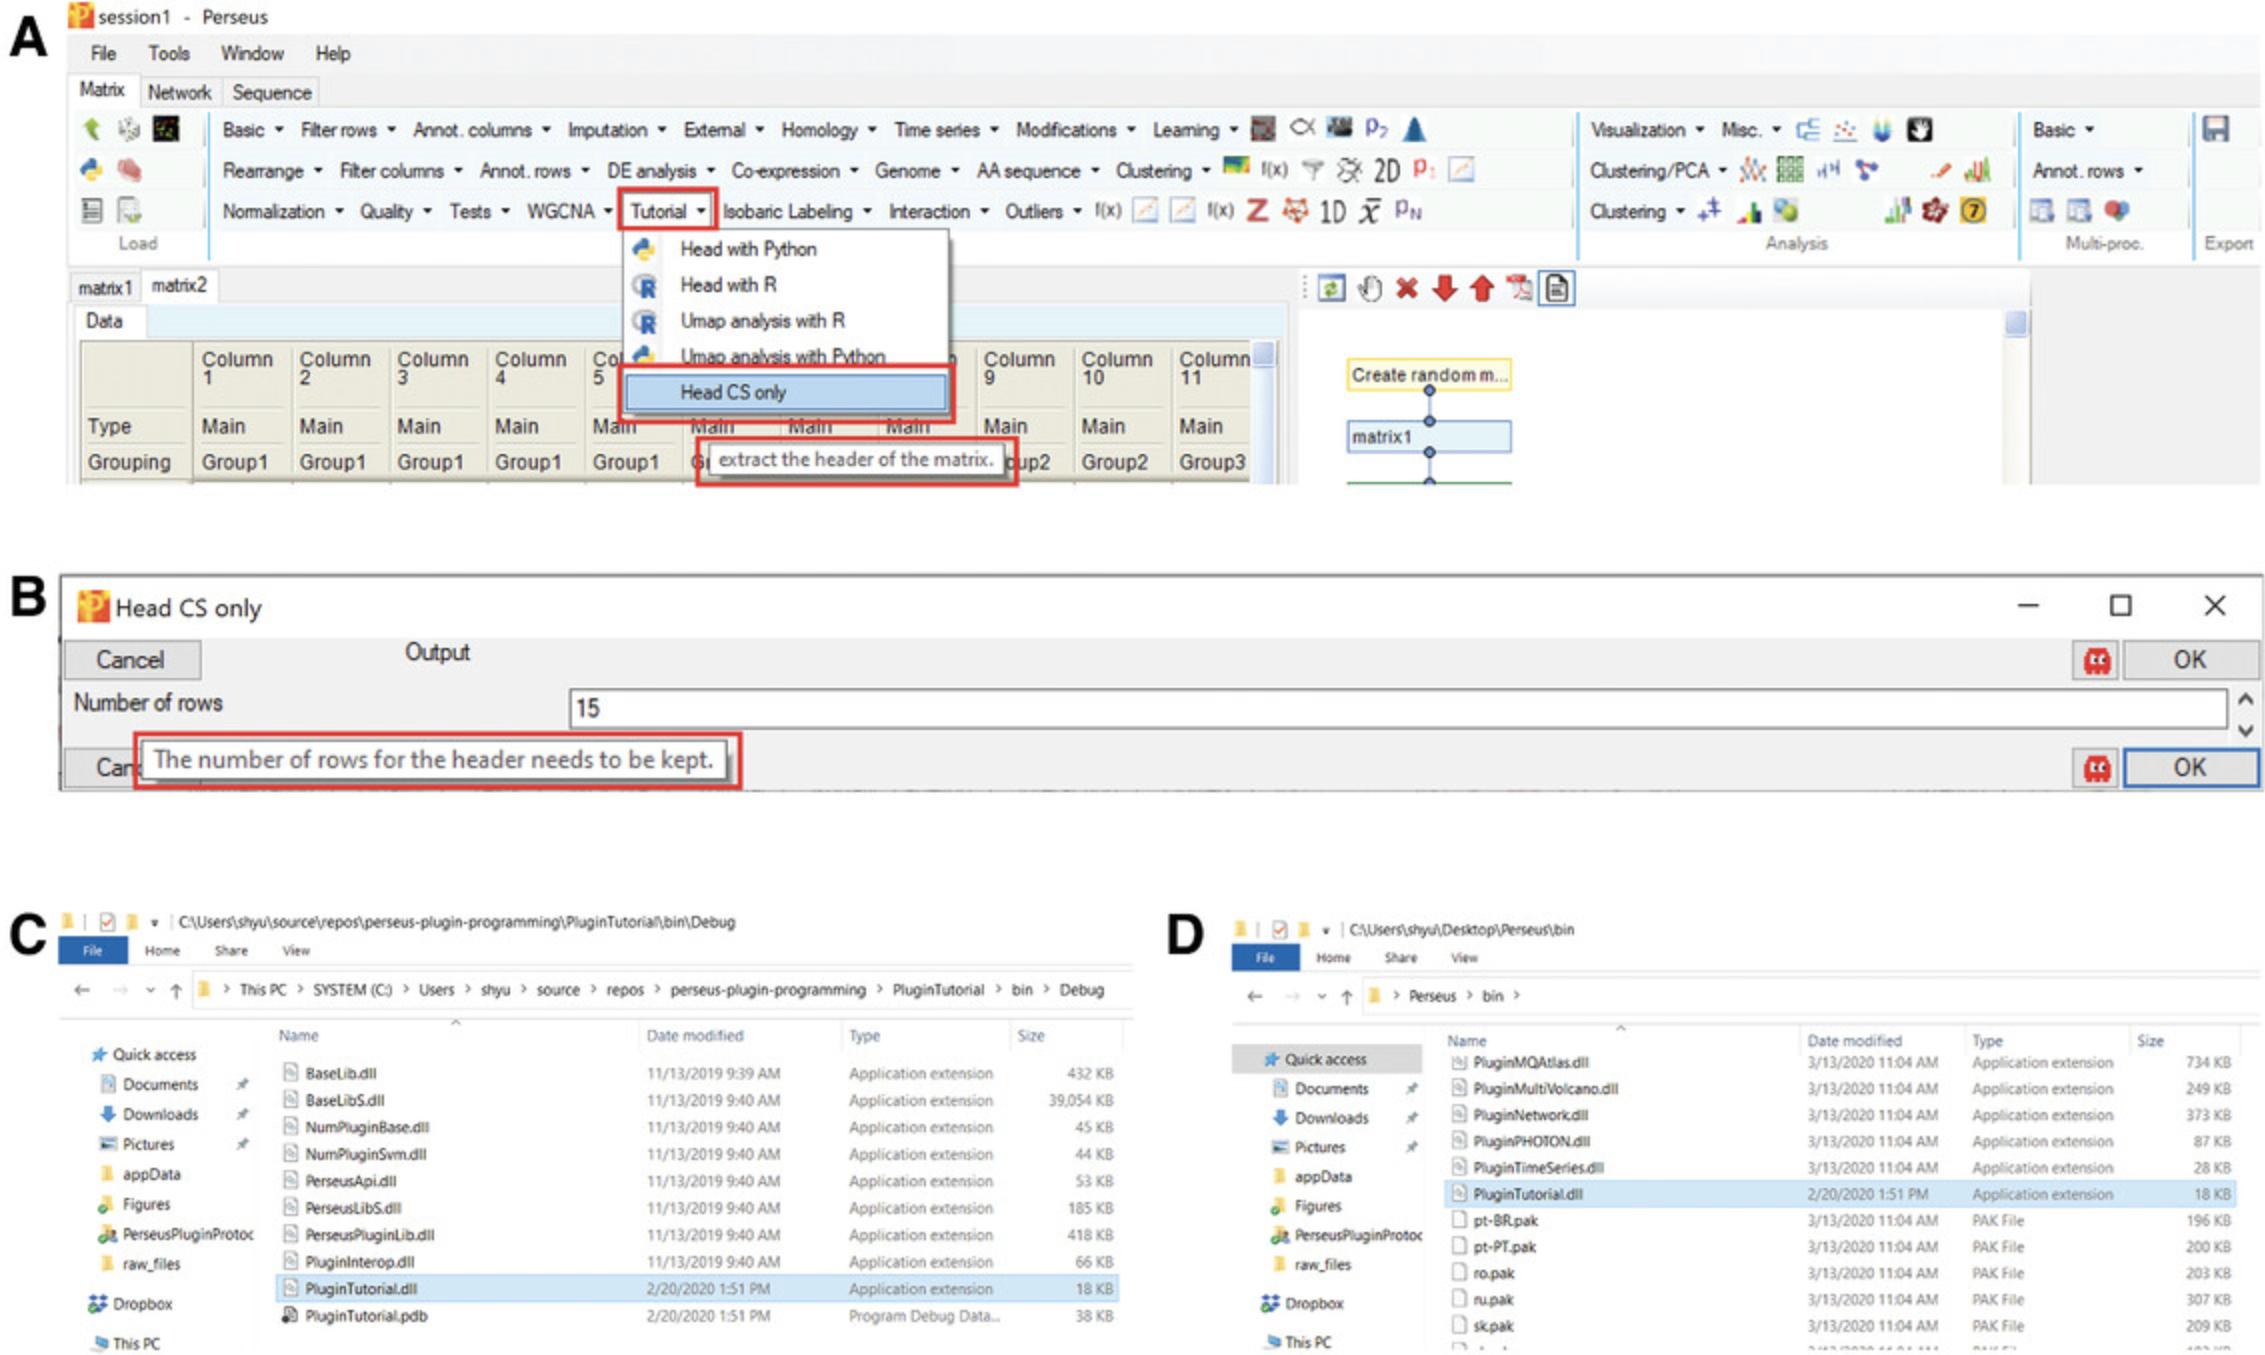
Click “Tutorial” –> “Head CS only” in “Processing” block (Fig.7A). Then, specify the number of rows for extraction and click OK (Fig.7B).
Resource for C# Plugins
For more examples and source codes of C# plugins, please check the repository: https://github.com/JurgenCox/perseus-plugins.
Basic Protocol 4: BASIC STEPS OF CONSTRUCTION AND CONNECTION FOR R PLUGINS WITH C# INTERFACE
Although C# can generate a user-friendly interface for the plugins, R and Python packages are still not able to be integrated into Perseus with the native C# interface. To combine the flexibility of R and Python with the graphical user interface generated by C#, the C# package PluginInterop was created (Rudolph & Cox, 2019). Here, the basic methods of PluginInterop needed to create an R plugin with C# interface will be presented step by step. The R script can be found at https://github.com/JurgenCox/perseus-plugin-programming/blob/master/PluginTutorial/Resources/head_c_sharpR.R, and the C# script at https://github.com/JurgenCox/perseus-plugin-programming/blob/master/PluginTutorial/Head_with_r.cs.
Necessary Resources
- All requirements of Basic Protocols 1 and 3
- Additionally, the C# package PluginInterop is required: this can also be installed by using “Manage NuGet Packages” in a Visual Studio project as described in step 2.
1.Create a C# project.
2.Add the dependencies.
3.Import packages and define namespace with a class.
- using BaseLibS.Param;
- using PerseusApi.Matrix;
- using System.IO;
- using PluginInterop;
- using System.Text;
- using PluginTutorial.Properties;
- namespace PluginTutorial
- {
- public class HeadR : PluginInterop.R.MatrixProcessing
- {
- }
- }
4.Override methods in the class.
- public class HeadR : PluginInterop.R.MatrixProcessing
- {
- public override string Heading => "Tutorial";
- public override string Name => "Head with R";
- public override string Description => "extract the header of the matrix";
- protected override bool TryGetCodeFile(Parameters param, out string
- codeFile)
- {
- byte[] code = (byte[])Resources.ResourceManager.GetObject("head_c_sharpR");
- codeFile = Path.GetTempFileName();
- File.WriteAllText(codeFile, Encoding.UTF8.GetString(code));
- return true;
- }
- protected override string GetCommandLineArguments(Parameters param)
- {
- var tempFile = Path.GetTempFileName();
- param.ToFile(tempFile);
- return tempFile;
- }
- protected override Parameter[] SpecificParameters(IMatrixData mdata, ref string errString)
- {
- if (mdata.ColumnCount < 3)
- {
- errString = "Please add at least 3 main columns to the matrix.";
- return null;
- }
- return new Parameter[]
- {
- new IntParam("Number of rows", 15)
- {
- Help = "The number of rows for the header needs to be kept."
- }
- };
- }
- }
5.Generate R script for data processing.
- args = commandArgs(trailingOnly = TRUE)
- paramFile <- args[1]
- inFile <- args[2]
- outFile <- args[3]
- parameters <- parseParameters(paramFile)
- num_row <- intParamValue(parameters, `Number of rows')
6.Store R script to resource folder.
-
Click “Resources.”
-
Click “Add Resource” and navigate to the target R script (head_c_sharpR.R). Then save it.
7.Build the solution and place the required files to the bin folder of Perseus.
Support Protocol 3: ADVANCED EXAMPLE OF R PLUGIN WITH C# INTERFACE: UMAP
UMAP (Becht et al., 2019; McInnes, Healy, & Melville, 2018) is a powerful dimensionality-reduction algorithm that is widely used for many different studies. It will be extremely useful to add UMAP to Perseus. This section will take UMAP as an advanced example to demonstrate how powerful the new Perseus plugin interface is for data analysis. The C# script can be found at https://github.com/JurgenCox/perseus-plugin-programming/blob/master/PluginTutorial/UmapAnalysis_with_r.cs, and the R script is saved at https://github.com/JurgenCox/perseus-plugin-programming/blob/master/PluginTutorial/Resources/Umap_R.R.
Necessary Resources
- All of the resources listed in Basic Protocol 4
- UMAP: a dimensionality-reduction method. The R version of UMAP can be found at CRAN (https://cran.r-project.org/web/packages/umap/index.html)
Input files
- The samples for the example of UMAP analysis can be downloaded at PRIDE (PXD003710) (Bailey, McDevitt, Westphall, Pagliarini, & Coon, 2014). Additionally, the MaxQuant (Cox & Mann, 2008; Sinitcyn, Rudolph, & Cox, 2018; Tyanova, Temu, & Cox, 2016; Yu, Kiriakidou, & Cox, 2020) proteinGroup table of this dataset is also provided at https://github.com/JurgenCox/perseus-plugin-programming/tree/master/dataset. The values are normalized and transformed by logarithm, and the unreliable protein groups (reversed, only identified by site, contaminant, containing more than 30% missing values) are all removed from the table. Moreover, the data is well annotated by experimental design. This table can be directly used for the advanced example.
1.Create a C# project.
2.Add the dependencies.
3.Import packages and define namespace with a class.
4.Override methods in the class.
- public override string Heading => "Tutorial";
- public override string Name => "Umap analysis with R";
- public override string Description => "Applying Umap to cluster the data";
- byte[] code = (byte[])Resources.ResourceManager.GetObject("Umap_R");
- protected override Parameter[] SpecificParameters(IMatrixData mdata, ref string errString)
- {
- if (mdata.ColumnCount < 3)
- {
- errString = "Please add at least 3 main data columns to the matrix.";
- return null;
- }
- return new Parameter[]
- {
- new IntParam("Number of neighbors", 15)
- {
- Help = "The number of neighbors."
- },
- new IntParam("Number of components", 2)
- {
- Help = "The number of components."
- },
- new IntParam("Random state", 1)
- {
- Help = "Set seed for reproducibility."
- },
- new DoubleParam("Minimum distance", 0.1)
- {
- Help = "Set minimum distance between the data point."
- },
- new SingleChoiceParam("Metric")
- {
- Values= new[] { "euclidean", "manhattan", "cosine", "pearson","pearson2"},
- Help = "The method of metric for doing clustering."
- }
- };
- }
5.Generate R script for data processing.
- args = commandArgs(trailingOnly = TRUE)
- paramFile <- args[1]
- inFile <- args[2]
- outFile <- args[3]
- parameters <- parseParameters(paramFile)
- n_neighbor <- intParamValue(parameters, "Number of neighbors")
- n_component <- intParamValue(parameters, "Number of components")
- seed <- intParamValue(parameters, "Random state")
- metric <- singleChoiceParamValue(parameters, "Metric")
- m_dist <- intParamValue(parameters, "Minimum distance")
6.Store R script to resource folder.
7.Build the solution and place the required files to the bin folder of Perseus
8.Run UMAP and plot the result.
SinceproteinGroup.txtis already pre-processed and grouped, it can be directly loaded into Perseus by clicking the green icon of arrow in the block of “Load.”
- Run R plugin of UMAP.
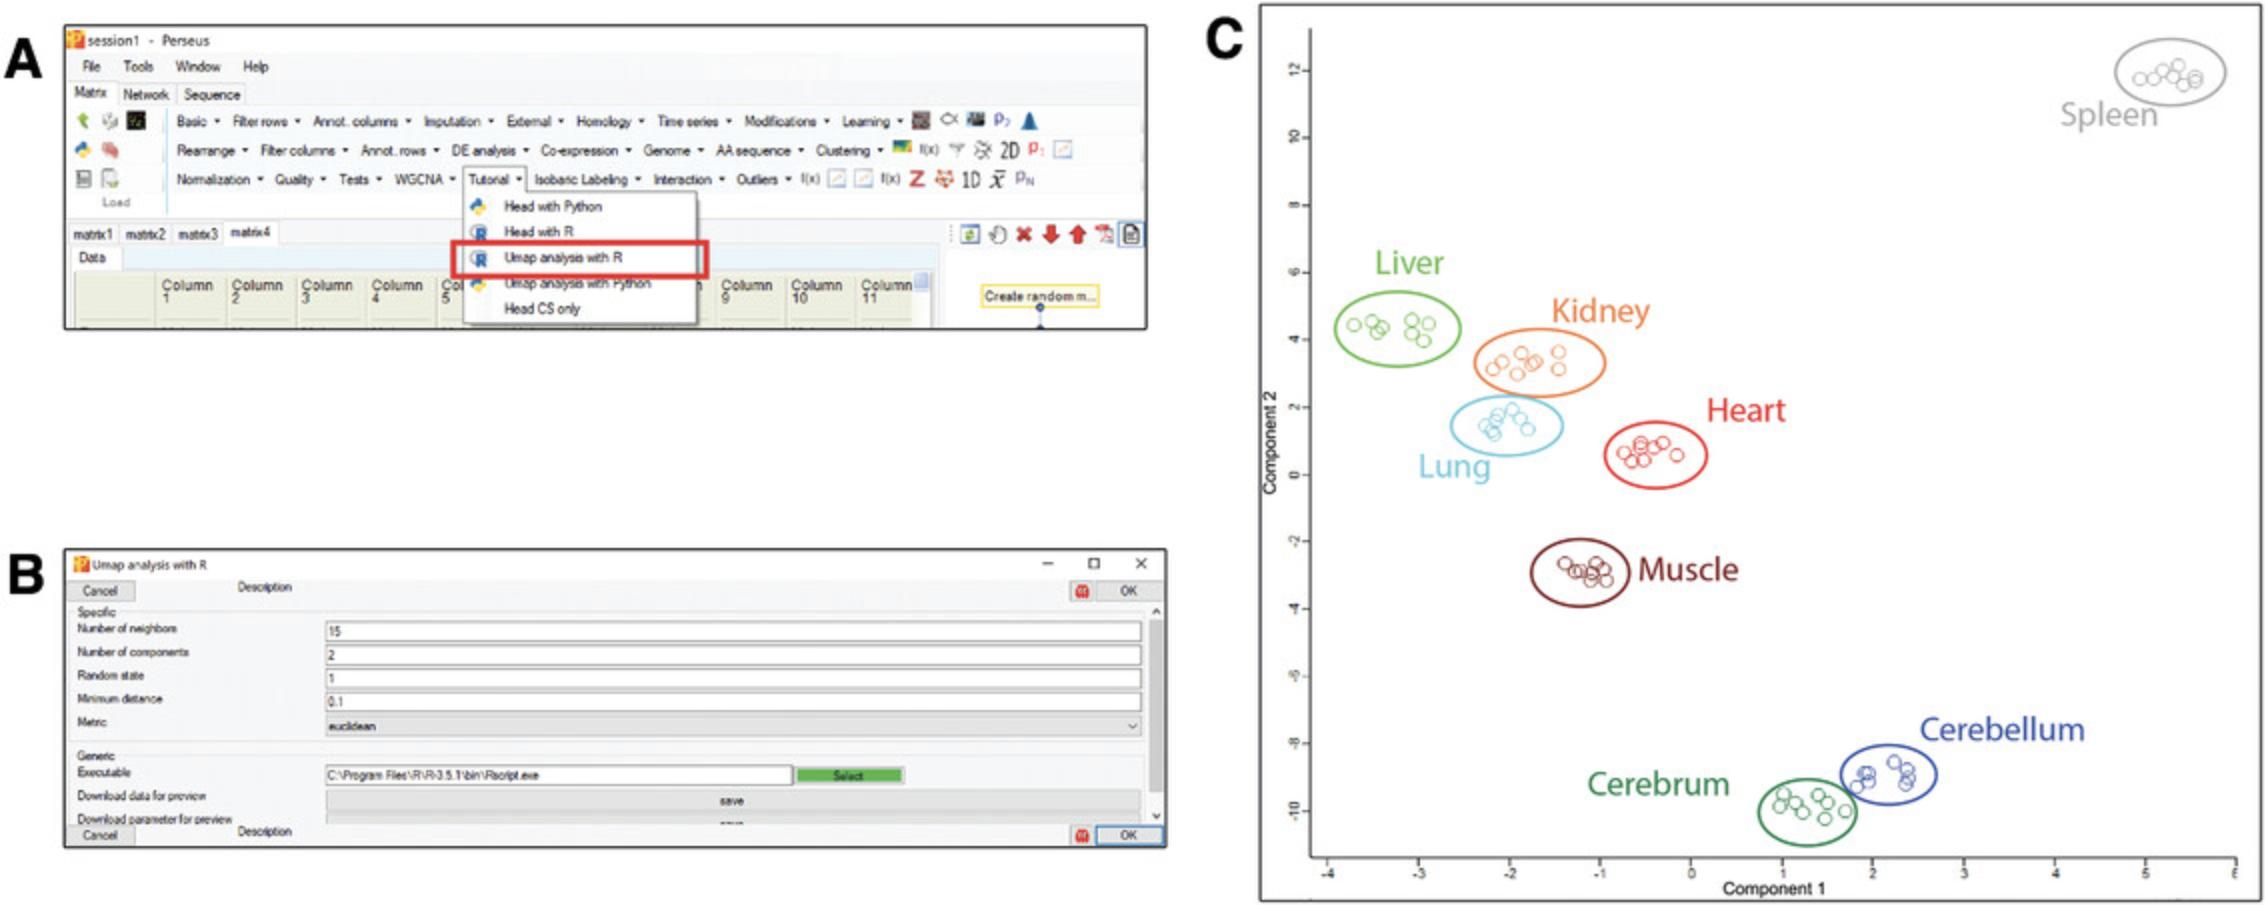
Click “Tutorial” −> “Umap analysis with R” to specify the parameters and run the plugin (Fig.2Aand2B). After running the plugin of UMAP, the matrix will be transposed and the main values will be changed to components.
- Plot the result of UMAP.
Use scatter plot (with columns) to view the result of the UMAP analysis. The outcome shows that the data points are clustered based on cell types (Fig.2C).
Basic Protocol 5: BASIC STEPS OF CONSTRUCTION AND CONNECTION FOR PYTHON PLUGINS WITH C# INTERFACE
This protocol will continue to demonstrate how to generate Python plugins with C# interface using the same examples as Basic Protocol 4.The C# script of the basic example can be found at https://github.com/JurgenCox/perseus-plugin-programming/blob/master/PluginTutorial/Head_with_py.cs, and the Python code can be found at https://github.com/JurgenCox/perseus-plugin-programming/blob/master/PluginTutorial/Resources/head_c_sharpPy.py.
Necessary Resources
- All requirements of Basic Protocols 2 and 3
- Additionally, the C# package PluginInterop is required: this can also be installed by using “Manage NuGet Packages” in a Visual Studio project as described in step 2
1.Create a C# project.
2.Add the dependencies.
3.Import packages and define namespace with a class.
- public class HeadPy : PluginInterop.Python.MatrixProcessing
4.Override methods in the class.
- public override string Heading => "Tutorial";
- public override string Name => "Head with Python";
- public override string Description => "extract the header of the matrix";
- protected override bool TryGetCodeFile(Parameters param, out string codeFile)
- {
- byte[] code = (byte[])Resources.ResourceManager.GetObject(
- "head_c_sharpPy");
- codeFile = Path.GetTempFileName();
- File.WriteAllText(codeFile, Encoding.UTF8.GetString(code));
- return true;
- }
5.Generate Python script of data processing.
- _, paramfile, infile, outfile = sys.argv
- parameters = parse_parameters(paramfile)
- head = intParam(parameters, "Number of rows")
6.Store Python script to resource folder.
7.Build the solution and place the required files to the bin folder of Perseus
Support Protocol 4: ADVANCED EXAMPLE OF PYTHON PLUGIN WITH C# INTERFACE: UMAP
Since UMAP is also available in Python, the same analysis can be used as an advanced example to show the power of Perseus Plugins for data analysis. The C# and Python scripts are listed at https://github.com/JurgenCox/perseus-plugin-programming/blob/master/PluginTutorial/UmapAnalysis_with_py.cs, and https://github.com/JurgenCox/perseus-plugin-programming/blob/master/PluginTutorial/Resources/Umap_Py.py, respectively.
Necessary Resources
- All of the requirements listed in Basic Protocol 5.
- UMAP: a dimensionality-reduction method. The Python version of UMAP can be found at PyPI (https://pypi.org/project/umap-learn/).
Input files
- Same as Support Protocol 4
1.Create a C# project.
2.Add the dependencies.
3.Import packages and define namespace with a class.
4.Override methods in the class.
- public override string Heading => "Tutorial";
- public override string Name => "Umap analysis with Python";
- public override string Description => "Applying Umap to cluster the data";
- protected override bool TryGetCodeFile(Parameters param, out string codeFile)
- {
- byte[] code = (byte[])Resources.ResourceManager.GetObject("Umap_Py");
- codeFile = Path.GetTempFileName();
- File.WriteAllText(codeFile, Encoding.UTF8.GetString(code));
- return true;
- }
5.Generate Python script for data processing.
- n_neighbor = intParam(parameters, "Number of neighbors")
- n_component = intParam(parameters, "Number of components")
- seed = intParam(parameters, "Random state")
- m_dist = doubleParam(parameters, "Minimum distance")
- metric = singleChoiceParam(parameters, "Metric")
- annotations = read_annotations(infile)
- newDF1 = main_df(infile, df)
6.Store Python script to resource folder.
7.Build the solution and place the required files in the bin folder of Perseus
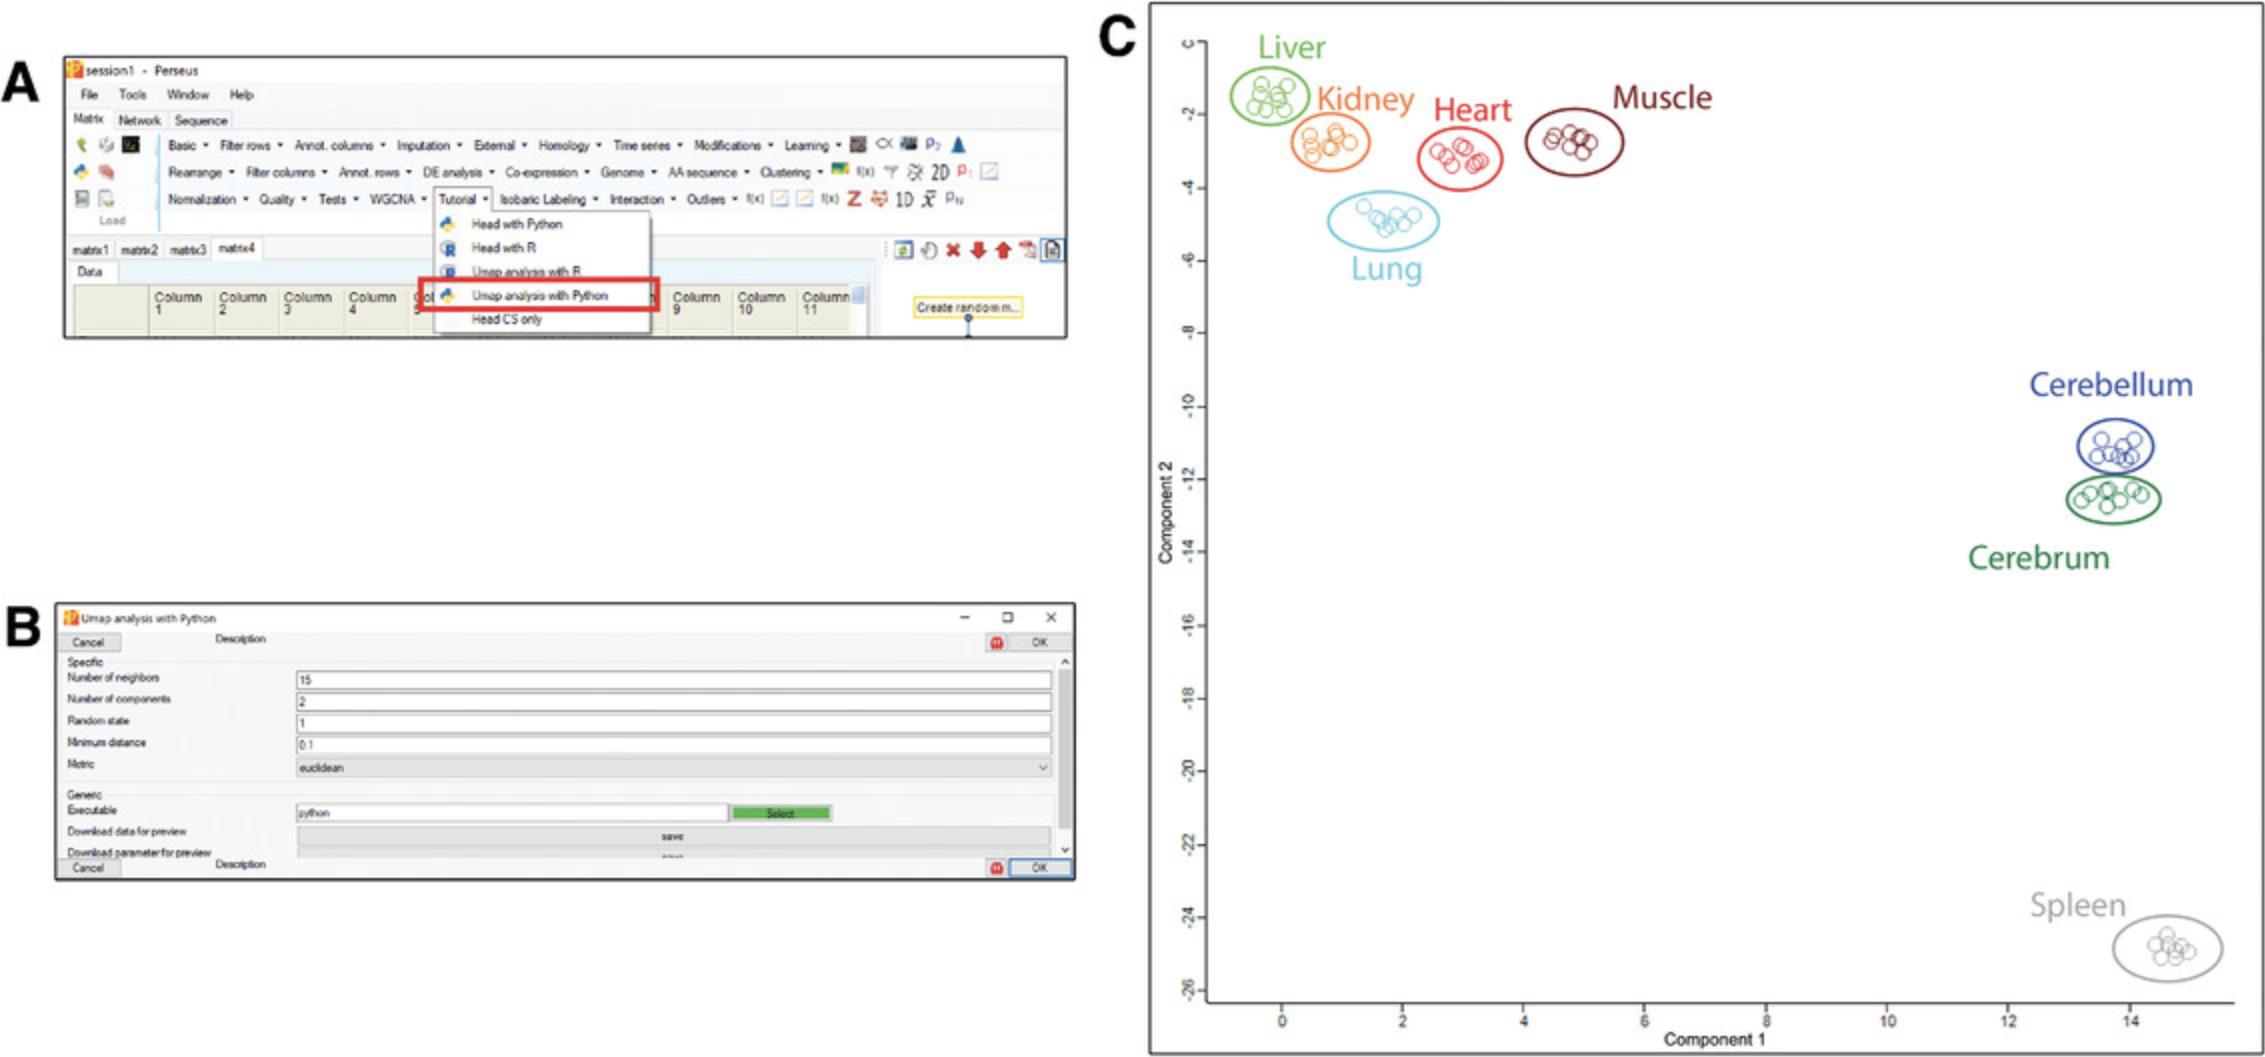
8.Run UMAP and plot the results.
Support Protocol 5: A BASIC WORKFLOW FOR THE ANALYSIS OF LABEL-FREE QUANTIFICATION PROTEOMICS DATA USING PERSEUS
Based on the above protocols, Perseus plugins can be generated according to the user's needs. In order to demonstrate the benefits that Perseus can offer for data analysis, a basic workflow for the analysis of label-free quantification (LFQ) will be presented in this section. The UMAP plugin generated via Support Protocols 4 and 5 can be applied to this analysis. The samples are from a part of the dataset in a Proteome Informatics Research Group (iPRG) 2015 Study (Choi et al., 2017). The proteinGroup table used for this example can be downloaded from https://github.com/JurgenCox/perseus-plugin-programming/blob/master/dataset/proteinGroups_LFQ.txt.
Necessary Resources
All of the requirements listed in Basic Protocol 5 and Support Protocol 5
Input files
- proteinGroups_LFQ.txt from https://github.com/JurgenCox/perseus-plugin-programming/blob/master/dataset/proteinGroups_LFQ.txt. This dataset contains three samples named as 1, 2, and 3. Moreover, each sample has three technical replicates labeled as A, B, and C.
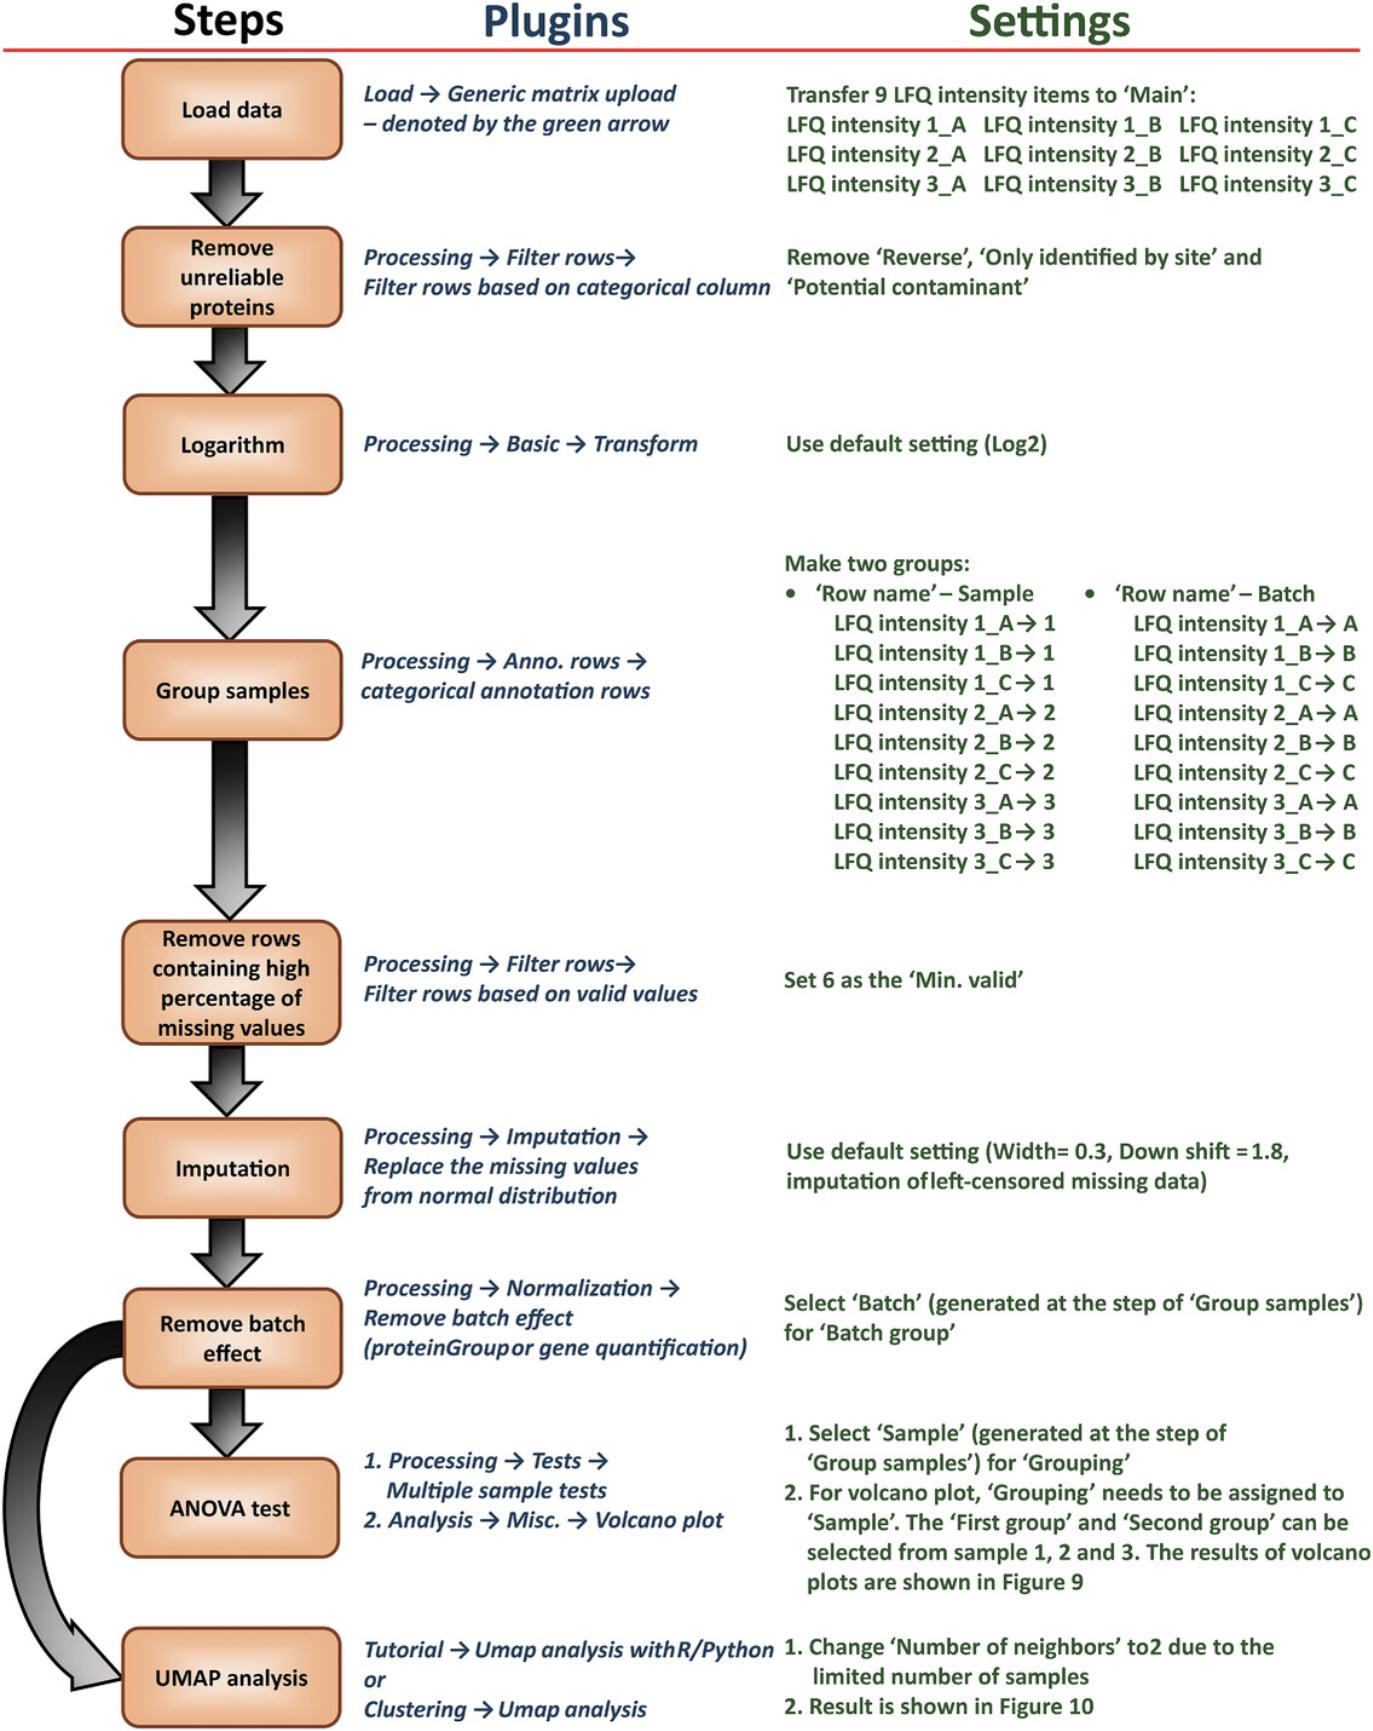
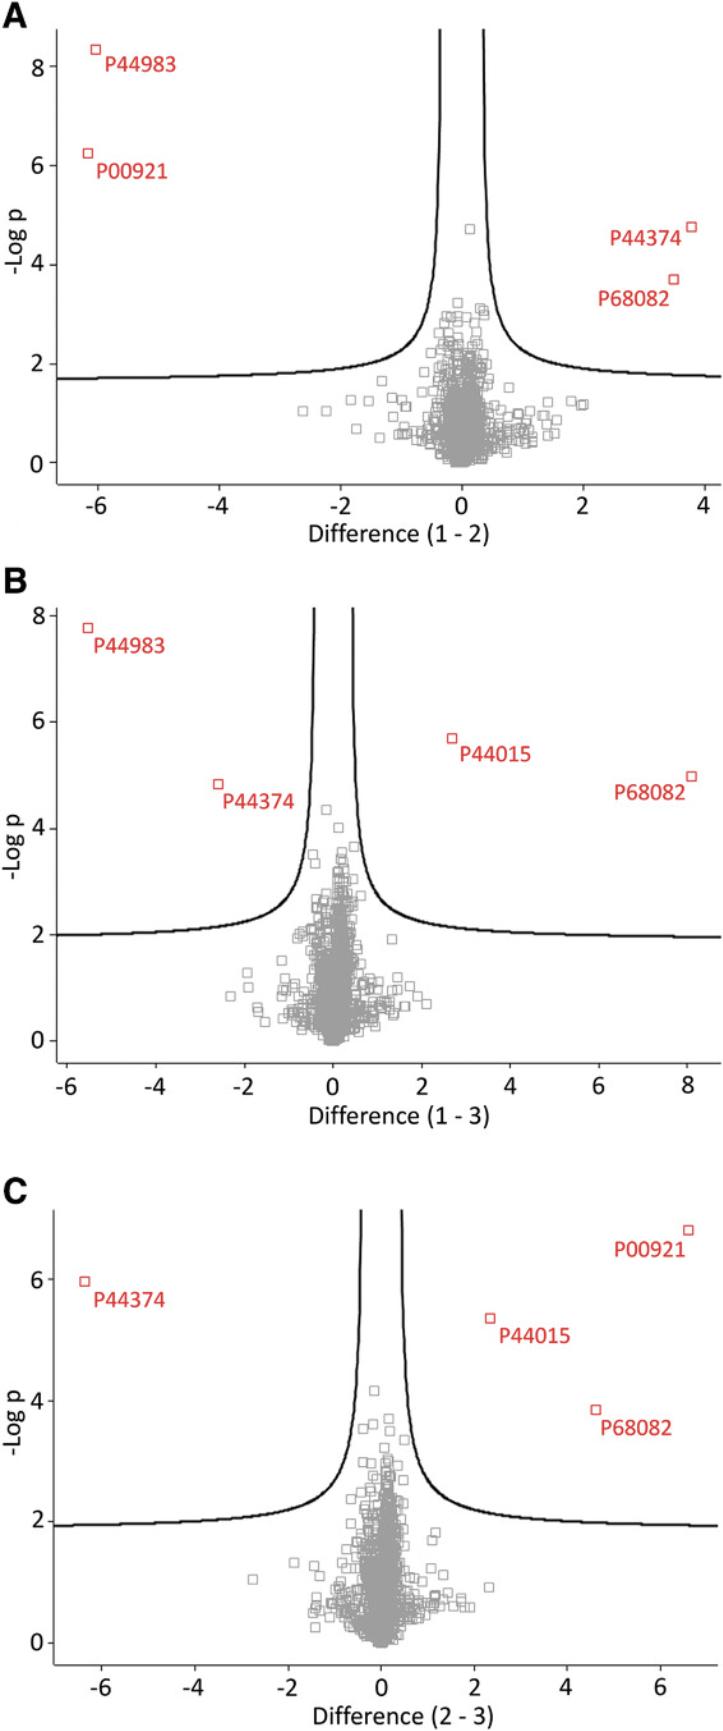
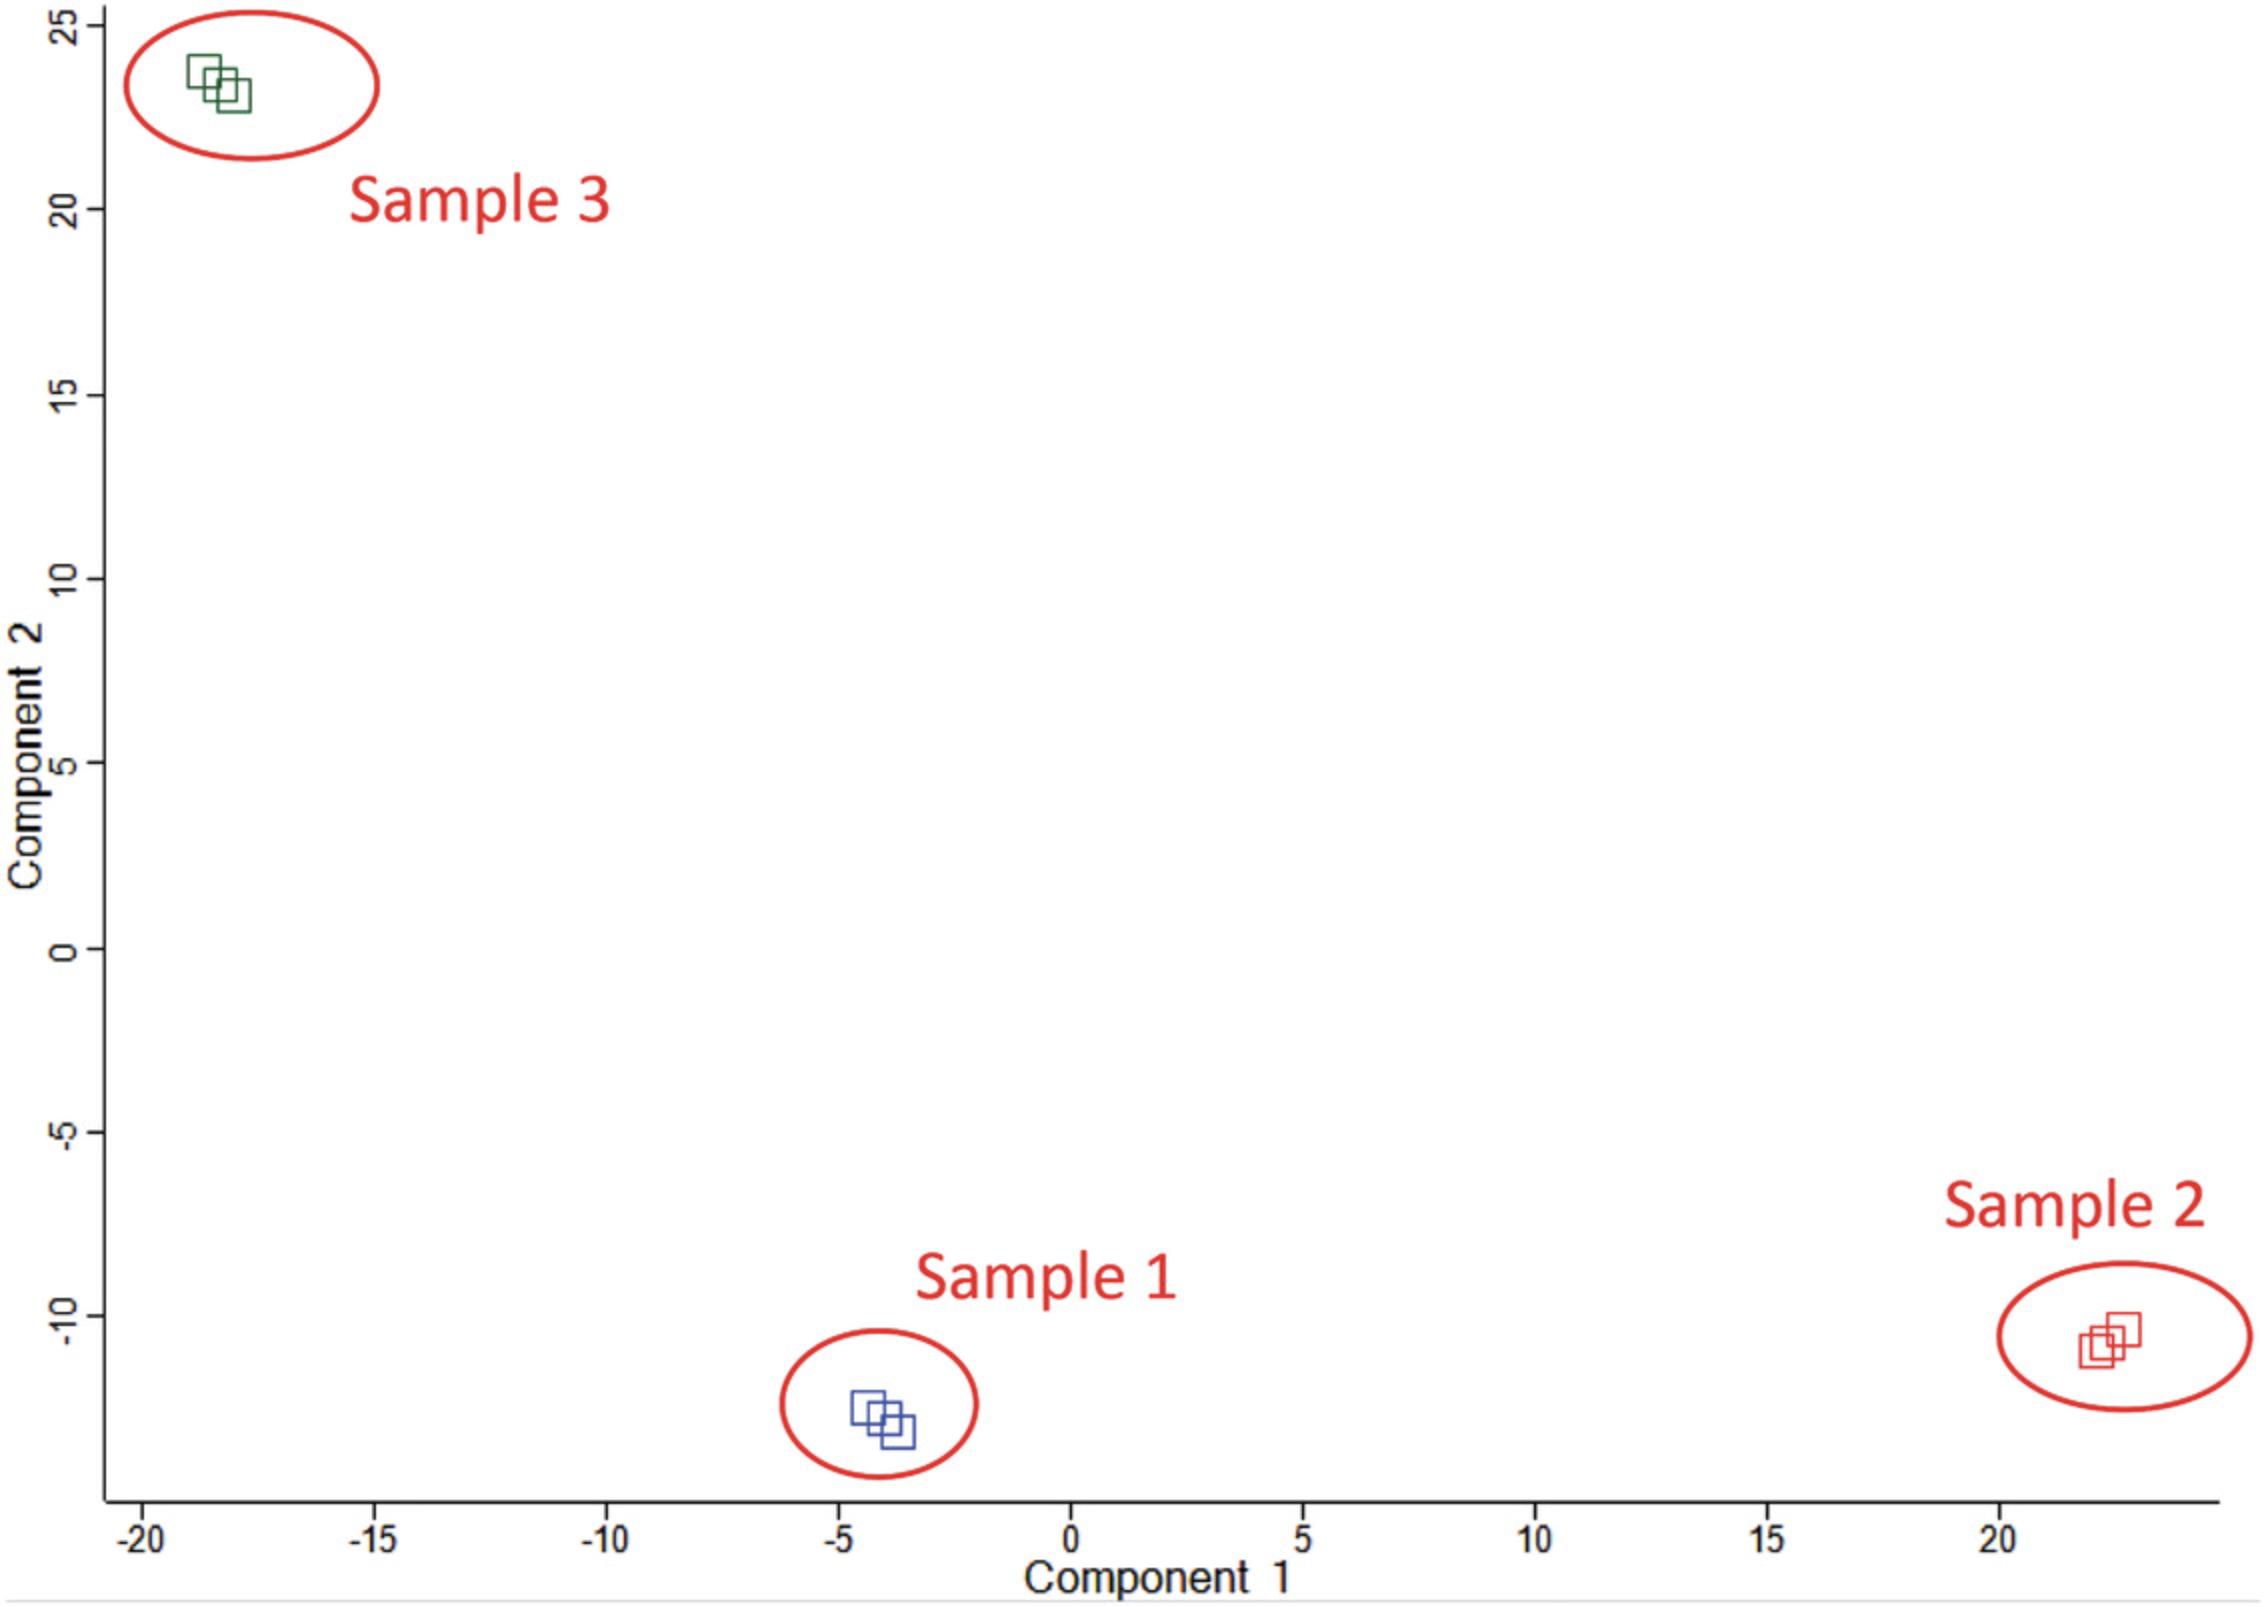
The workflow, plugins, and settings for the basic analysis are shown in Figure 8. The results of most commonly used statistics methods–differential expression analysis (ANOVA test is used) and dimensionality reduction (UMAP is applied) are presented in Figure 9 and 10. This example only demonstrates a basic workflow. Perseus contains numerous useful plugins and parameters. The user can change the settings based on different requirements.
GUIDELINES FOR UNDERSTANDING RESULTS
During the development of new Perseus plugins, execution errors may occur. In this case. a window, “Execution halted,” will pop up and show the trace-back of the error. If this happens, refer to the troubleshooting information in Table 2 about common mistakes and how to avoid them. If the error stems from the external plug-in, it is recommended to use the two download options provided in the command line−style interfaces. The first one allows you to download a data preview, which is just the regular temporary file written for the data transfer from Perseus to the plugin. The second download option is for the parameters. This allows the developer to generate test data and parameters for debugging the plugin outside of Perseus, without writing the same temporary files multiple times. If the plugin executes smoothly without any errors, it is still recommended to validate correctness of the results, for instance by writing unit tests. For this, the developer should prepare a minimal test data set that allows validation of the computation results. Additionally, the returned data types of all columns should be assessed, to seamlessly integrate the resulting matrix into the overall workflow. If everything is correct, a second test data set that challenges the plugin with common error sources like missing values or false column types should be generated. Once the plugin is fully functional, proper documentation of the plug-in's dependencies and parameters will ensure that it can be successfully applied by Perseus users or other developers. Many useful tools have already been integrated into Perseus and made available to the community (Table 1). With this, we hope to enable many developers to add custom functionality to Perseus; we also hope that users will soon have an even larger collection of plugins available to use in their research.
| C# function parameter specification | R function for parameter value retrieval | Python function for parameter value retrieval |
|---|---|---|
| IntParam | intParamValue | intParam |
| DoubleParam | intParamValue | doubleParam |
| BoolParam | boolParamValue | boolParam |
| SingleChoiceParam | singleChoiceParamValue | singleChoiceParam |
| SingleChoiceWithSubParams | singleChoiceParamValuea | singleChoiceWithSubParams |
| BoolWithSubParams | boolParamValuea | boolWithSubParams |
- a For these functions to return the correct value, all sub-parameters need to have unique names across the whole plugin.
COMMENTARY
Background Information
Perseus was originally developed together with MaxQuant (Cox & Mann, 2008; Tyanova et al., 2016) for quantitative proteomics analysis. MaxQuant is one of the most commonly used software applications for mass-spectrometry-based proteomics data analysis. It can support numerous types of labeling strategies and MS platforms (Cox et al., 2014; Tyanova, Mann, & Cox, 2014; Yu et al., 2020). Moreover, different quantification methods, false-discovery rate control, and visualization are also provided in MaxQuant. The output tables of MaxQuant can be directly imported into Perseus for the downstream bioinformatics and statistical analyses.
In past decades, high-throughput sequencing (HTS) has become a potent method in numerous biological research fields. Perseus also provides the ability to import BAM files and genome annotation files for mRNA quantification (Tyanova et al., 2016). Thus, the bioinformatics and statistical analyses can be applied to HTS datasets as well. This makes Perseus a powerful multi-omics data analysis platform (Poulopoulos et al., 2019).
Critical Parameters
Table 2 lists commonly used parameters for R, Python, and C# plugins.
Troubleshooting
Table 3 provides troubleshooting information.
| Error | Solution |
|---|---|
| The R or python executable cannot be found by Perseus. | The executables have to be added to the system “Path” environment variable. To do this, open the “Control Panel,” go to “System,” and then to “Advanced System Settings.” In the new window, click on the “Environment variables” configuration. From the list of environment variables, select the “PATH,” click “edit,” and check that the entry for the R/Python executable is correct. If it is missing, add the directory as a new entry. These instructions are for Windows 10. If you cannot locate your path variable, please refer to one of many instructions that can be found online. |
| A package (in R) or library (in python) cannot be imported. | If this error occurs, please make sure that your R or Python environment contains the respective library. Perseus cannot install required libraries on the fly. |
| Perseus cannot recognize the output matrix generated after R or Python execution | Be sure in which kind of format the output from the R/Python script is defined. Perseus takes the matrix generated by a data.frame |
| Identification of Annotation Rows in case of possible groups | In plugins where annotation rows are necessary, be sure that your script recognizes the groups defined in the matrix input, adding the if-case as the argument (!length(annotRows(mdata)), and then call it again at the end of script execution if you want to combine your annotation with the results obtained |
| PerseusR package (in R) and/or Perseuspy (in python) are not recognized |
Before to use the packages, check if the installation is done correctly by the command line In R: library(PerseusR) In Python: import argparse from perseuspy |
Acknowledgments
This work was partially funded by the Max Planck Society for the Advancement of Science and the German Research Foundation (DFG/Gottfried Wilhelm Leibniz Prize MA 1764/2-1), and has been made possible in part by grant number 2019-202671 from the Chan Zuckerberg Foundation. Open access funding enabled and organized by Projekt DEAL
Author Contributions
Sung-Huan Yu : Conceptualization; formal analysis; methodology; writing-original draft; writing-review & editing. Daniela Ferretti : Formal analysis; software; writing-original draft; writing-review & editing. Julia P. Schessner : Formal analysis; writing-original draft; writing-review & editing. Jan Daniel Rudolph : Writing-original draft; writing-review & editing. Georg H. H. Borner : Writing-original draft; writing-review & editing. Jürgen Cox : Conceptualization; formal analysis; funding acquisition; investigation; methodology; project administration; software; supervision; writing-original draft; writing-review & editing.
Literature Cited
- Bailey, D. J., McDevitt, M. T., Westphall, M. S., Pagliarini, D. J., & Coon, J. J. (2014). Intelligent data acquisition blends targeted and discovery methods. Journal of Proteome Research , 13(4), 2152–2161. doi: 10.1021/pr401278j.
- Becht, E., McInnes, L., Healy, J., Dutertre, C.-A., Kwok, I. W. H., Ng, L. G., … Newell, E. W. (2019). Dimensionality reduction for visualizing single-cell data using UMAP. Nature Biotechnology , 37(1), 38–44. doi: 10.1038/nbt.4314.
- Choi, M., Eren-Dogu, Z. F., Colangelo, C., Cottrell, J., Hoopmann, M. R., Kapp, E. A., … Vitek, O. (2017). ABRF Proteome Informatics Research Group (iPRG) 2015 study: Detection of differentially abundant proteins in label-free quantitative LC-MS/MS experiments. Journal of Proteome Research , 16(2), 945–957. doi: 10.1021/acs.jproteome.6b00881.
- Cox, J., Hein, M. Y., Luber, C. A., Paron, I., Nagaraj, N., & Mann, M. (2014). Accurate proteome-wide label-free quantification by delayed normalization and maximal peptide ratio extraction, termed MaxLFQ. Molecular and Cellular Proteomics , 13(9), 2513–2526. doi: 10.1074/mcp.M113.031591.
- Cox, J., & Mann, M. (2008). MaxQuant enables high peptide identification rates, individualized p.p.b.-range mass accuracies and proteome-wide protein quantification. Nature Biotechnology , 26(12), 1367–1372. doi: 10.1038/nbt.1511.
- Johnson, W. E., Li, C., & Rabinovic, A. (2007). Adjusting batch effects in microarray expression data using empirical Bayes methods. Biostatistics , 8(1), 118–127. doi: 10.1093/biostatistics/kxj037.
- Langfelder, P., & Horvath, S. (2008). WGCNA: An R package for weighted correlation network analysis. BMC Bioinformatics , 9(1), 559. doi: 10.1186/1471-2105-9-559.
- Leek, J. T., Johnson, W. E., Parker, H. S., Jaffe, A. E., & Storey, J. D. (2012). The sva package for removing batch effects and other unwanted variation in high-throughput experiments. Bioinformatics (Oxford, England) , 28(6), 882–883. doi: 10.1093/bioinformatics/bts034.
- Love, M. I., Huber, W., & Anders, S. (2014). Moderated estimation of fold change and dispersion for RNA-seq data with DESeq2. Genome Biology , 15(12), 550. doi: 10.1186/s13059-014-0550-8.
- van der Maaten, L., & Hinton, G. (2008). Visualizing data using t-SNE. Retrieved from http://citeseerx.ist.psu.edu/viewdoc/summary?doi=10.1.1.457.7213.
- McInnes, L., Healy, J., & Melville, J. (2018). UMAP: Uniform Manifold Approximation and Projection for Dimension Reduction. Retrieved from http://arxiv.org/abs/1802.03426.
- Mckinney, W. (2010). Data Structures for Statistical Computing in Python. In S. van der W. J. Millman (Ed.), Proceedings of the 9th Python in Science Conference (51–56).
- Poulopoulos, A., Murphy, A. J., Ozkan, A., Davis, P., Hatch, J., Kirchner, R., & Macklis, J. D. (2019). Subcellular transcriptomes and proteomes of developing axon projections in the cerebral cortex. In Nature (Vol. 565, Issue 7739, pp. 356–360). New York: Nature Publishing Group. doi: 10.1038/s41586-018-0847-y.
- Ritchie, M. E., Phipson, B., Wu, D., Hu, Y., Law, C. W., Shi, W., & Smyth, G. K. (2015). Limma powers differential expression analyses for RNA-sequencing and microarray studies. Nucleic Acids Research , 43(7), e47–e47. doi: 10.1093/nar/gkv007.
- Robinson, M. D., McCarthy, D. J., & Smyth, G. K. (2010). edgeR: A Bioconductor package for differential expression analysis of digital gene expression data. Bioinformatics (Oxford, England) , 26(1), 139–140. doi: 10.1093/bioinformatics/btp616.
- Rudolph, J. D., & Cox, J. (2019). A network module for the perseus software for computational proteomics facilitates proteome interaction graph analysis. Journal of Proteome Research , 18(5), 2052–2064. doi: 10.1021/acs.jproteome.8b00927.
- Sinitcyn, P., Rudolph, J. D., & Cox, J. (2018). Computational methods for understanding mass spectrometry–based shotgun proteomics data. Annual Review of Biomedical Data Science , 1(1), 207–234. doi: 10.1146/annurev-biodatasci-080917-013516.
- Tyanova, S., Mann, M., & Cox, J. (2014). MaxQuant for in-depth analysis of large SILAC datasets. Methods in Molecular Biology , 1188, 351–364. doi: 10.1007/978-1-4939-1142-4_24.
- Tyanova, S., Temu, T., & Cox, J. (2016). The MaxQuant computational platform for mass spectrometry−based shotgun proteomics. Nature Protocols , 11(12), 2301–2319. doi: 10.1038/nprot.2016.136.
- Tyanova, S., Temu, T., Sinitcyn, P., Carlson, A., Hein, M. Y., Geiger, T., … Cox, J. (2016). The Perseus computational platform for comprehensive analysis of (prote)omics data. Nature Methods , 13(9), 731–740. doi: 10.1038/nmeth.3901.
- Wiśniewski, J. R., Hein, M. Y., Cox, J., & Mann, M. (2014). A “Proteomic Ruler” for protein copy number and concentration estimation without spike-in standards. Molecular & Cellular Proteomics, 13(12), 3497–3506. doi: 10.1074/mcp.M113.037309.
- Yu, S.-H., Kiriakidou, P., & Cox, J. (2020). Isobaric matching between runs and novel PSM-level normalization in MaxQuant strongly improve reporter ion-based quantification. BioRxiv , 2020.03.30.015487. doi: 10.1101/2020.03.30.015487.
Internet Resources
Plugin repositories __
* <https://github.com/cox-labs/PluginTutorial>
Tutorial scripts.
* <https://github.com/JurgenCox/perseus-plugins>
Source code for many plug-ins.
Tutorial videos can be found in MaxQuant Summer School __
* [https://www.youtube.com/watch?v=fYGx4oplCpI&t=3146s](https://www.youtube.com/watch?v=fYGx4oplCpI&t=3146s)
MQSS 2018.
* <https://www.youtube.com/watch?v=-3oq9e_92lc>
MQSS 2019.
Citing Literature
Number of times cited according to CrossRef: 11
- Isabella Provenzale, Fiorella A. Solari, Claudia Schönichen, Sanne L. N. Brouns, Delia I. Fernández, Marijke J. E. Kuijpers, Paola E. J. Meijden, Jonathan M. Gibbins, Albert Sickmann, Chris Jones, Johan W. M. Heemskerk, Endothelium‐mediated regulation of platelet activation: Involvement of multiple protein kinases, The FASEB Journal, 10.1096/fj.202300360RR, 38 , 4, (2024).
- Paula Carrillo-Rodriguez, Frode Selheim, Maria Hernandez-Valladares, Mass Spectrometry-Based Proteomics Workflows in Cancer Research: The Relevance of Choosing the Right Steps, Cancers, 10.3390/cancers15020555, 15 , 2, (555), (2023).
- Weiqi Zhang, Marc Planas‐Marquès, Marianne Mazier, Margarita Šimkovicová, Mercedes Rocafort, Melissa Mantz, Pitter F. Huesgen, Frank L. W. Takken, Annick Stintzi, Andreas Schaller, Nuria S. Coll, Marc Valls, The tomato P69 subtilase family is involved in resistance to bacterial wilt, The Plant Journal, 10.1111/tpj.16613, 118 , 2, (388-404), (2023).
- Paleerath Peerapen, Chanettee Chanthick, Visith Thongboonkerd, Quantitative proteomics reveals common and unique molecular mechanisms underlying beneficial effects of caffeine and trigonelline on human hepatocytes, Biomedicine & Pharmacotherapy, 10.1016/j.biopha.2022.114124, 158 , (114124), (2023).
- David Skerrett-Byrne Anthony, Chen Jiang Chen, Brett Nixon, Hubert Hondermarck, Transcriptomics, Encyclopedia of Cell Biology, 10.1016/B978-0-12-821618-7.00157-7, (363-371), (2023).
- Bethany Claridge, Alin Rai, Jarmon G. Lees, Haoyun Fang, Shiang Y. Lim, David W. Greening, Cardiomyocyte intercellular signalling increases oxidative stress and reprograms the global‐ and phospho‐proteome of cardiac fibroblasts, Journal of Extracellular Biology, 10.1002/jex2.125, 2 , 12, (2023).
- Enes K Ergin, Anuli C Uzozie, Siyuan Chen, Ye Su, Philipp F Lange, SQuAPP—simple quantitative analysis of proteins and PTMs, Bioinformatics, 10.1093/bioinformatics/btac628, 38 , 21, (4956-4958), (2022).
- Miao-Hsia Lin, Pei-Shan Wu, Tzu-Hsuan Wong, I-Ying Lin, Johnathan Lin, Jürgen Cox, Sung-Huan Yu, Benchmarking differential expression, imputation and quantification methods for proteomics data, Briefings in Bioinformatics, 10.1093/bib/bbac138, 23 , 3, (2022).
- Hamid Hamzeiy, Daniela Ferretti, Maria S. Robles, Jürgen Cox, Perseus plugin “Metis” for metabolic-pathway-centered quantitative multi-omics data analysis for static and time-series experimental designs, Cell Reports Methods, 10.1016/j.crmeth.2022.100198, 2 , 4, (100198), (2022).
- Mingjie He, Jiahui Wang, Sandra Herold, Lin Xi, Waltraud X. Schulze, A Rapid and Universal Workflow for Label‐Free‐Quantitation‐Based Proteomic and Phosphoproteomic Studies in Cereals, Current Protocols, 10.1002/cpz1.425, 2 , 6, (2022).
- Brooke L. Brauer, Kwame Wiredu, Sierra Mitchell, Greg B. Moorhead, Scott A. Gerber, Arminja N. Kettenbach, Affinity-based profiling of endogenous phosphoprotein phosphatases by mass spectrometry, Nature Protocols, 10.1038/s41596-021-00604-3, 16 , 10, (4919-4943), (2021).

