A general protocol for precise syntheses of ordered mesoporous intermetallic nanoparticles
Yusuke Yamauchi, Hao Lv, Yanzhi Wang, Lizhi Sun, Ben Liu
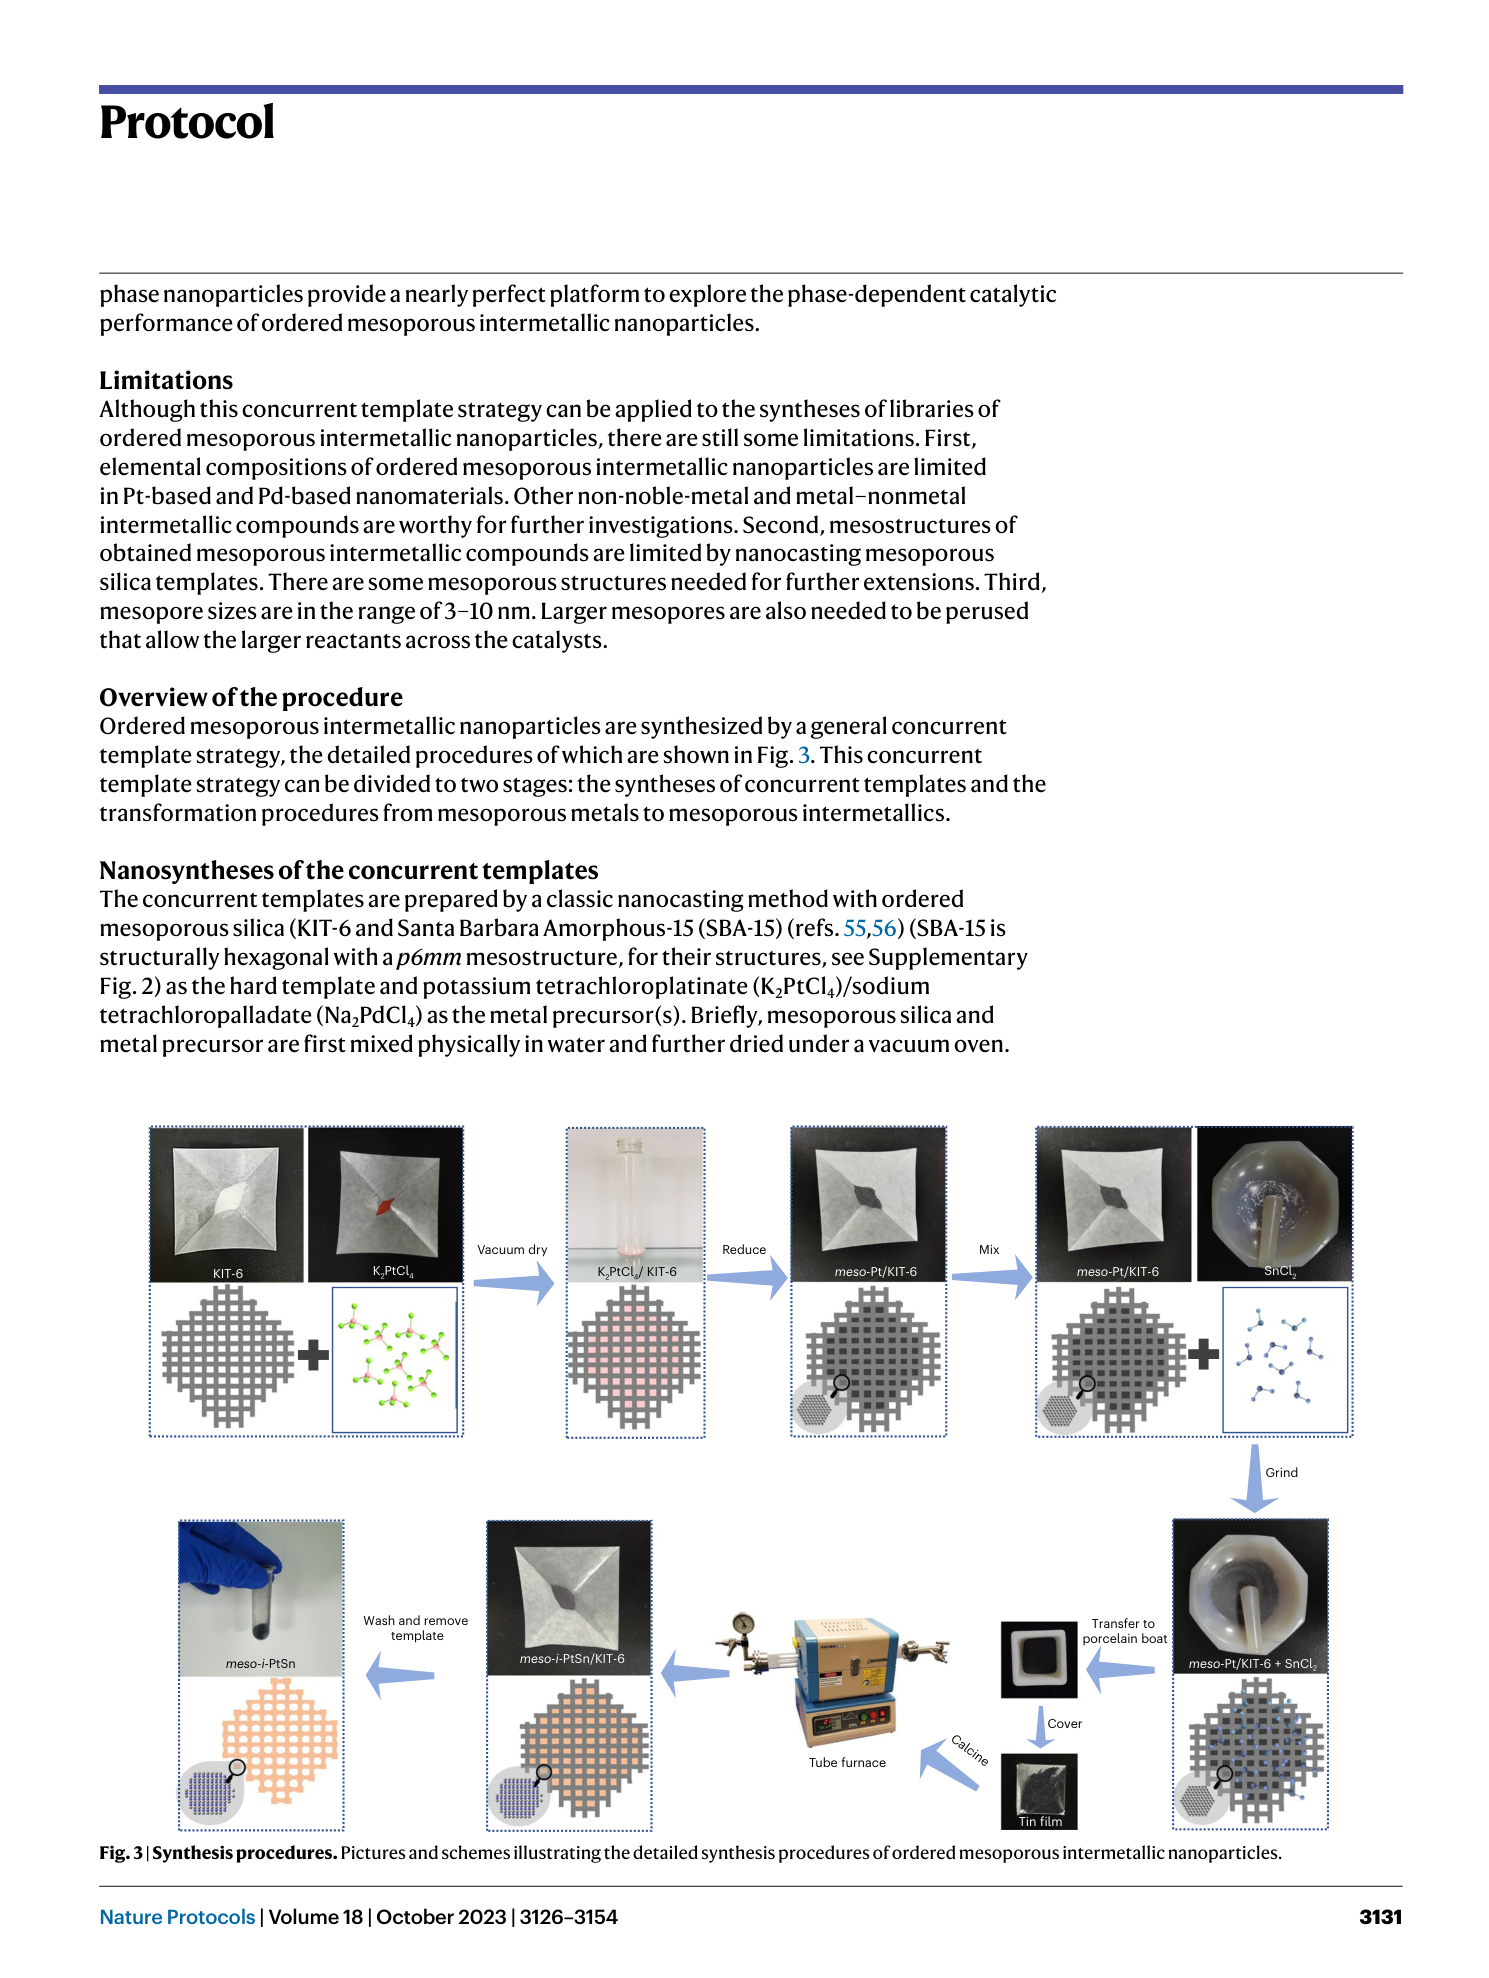
mesoporous intermetallic nanoparticles
concurrent template strategy
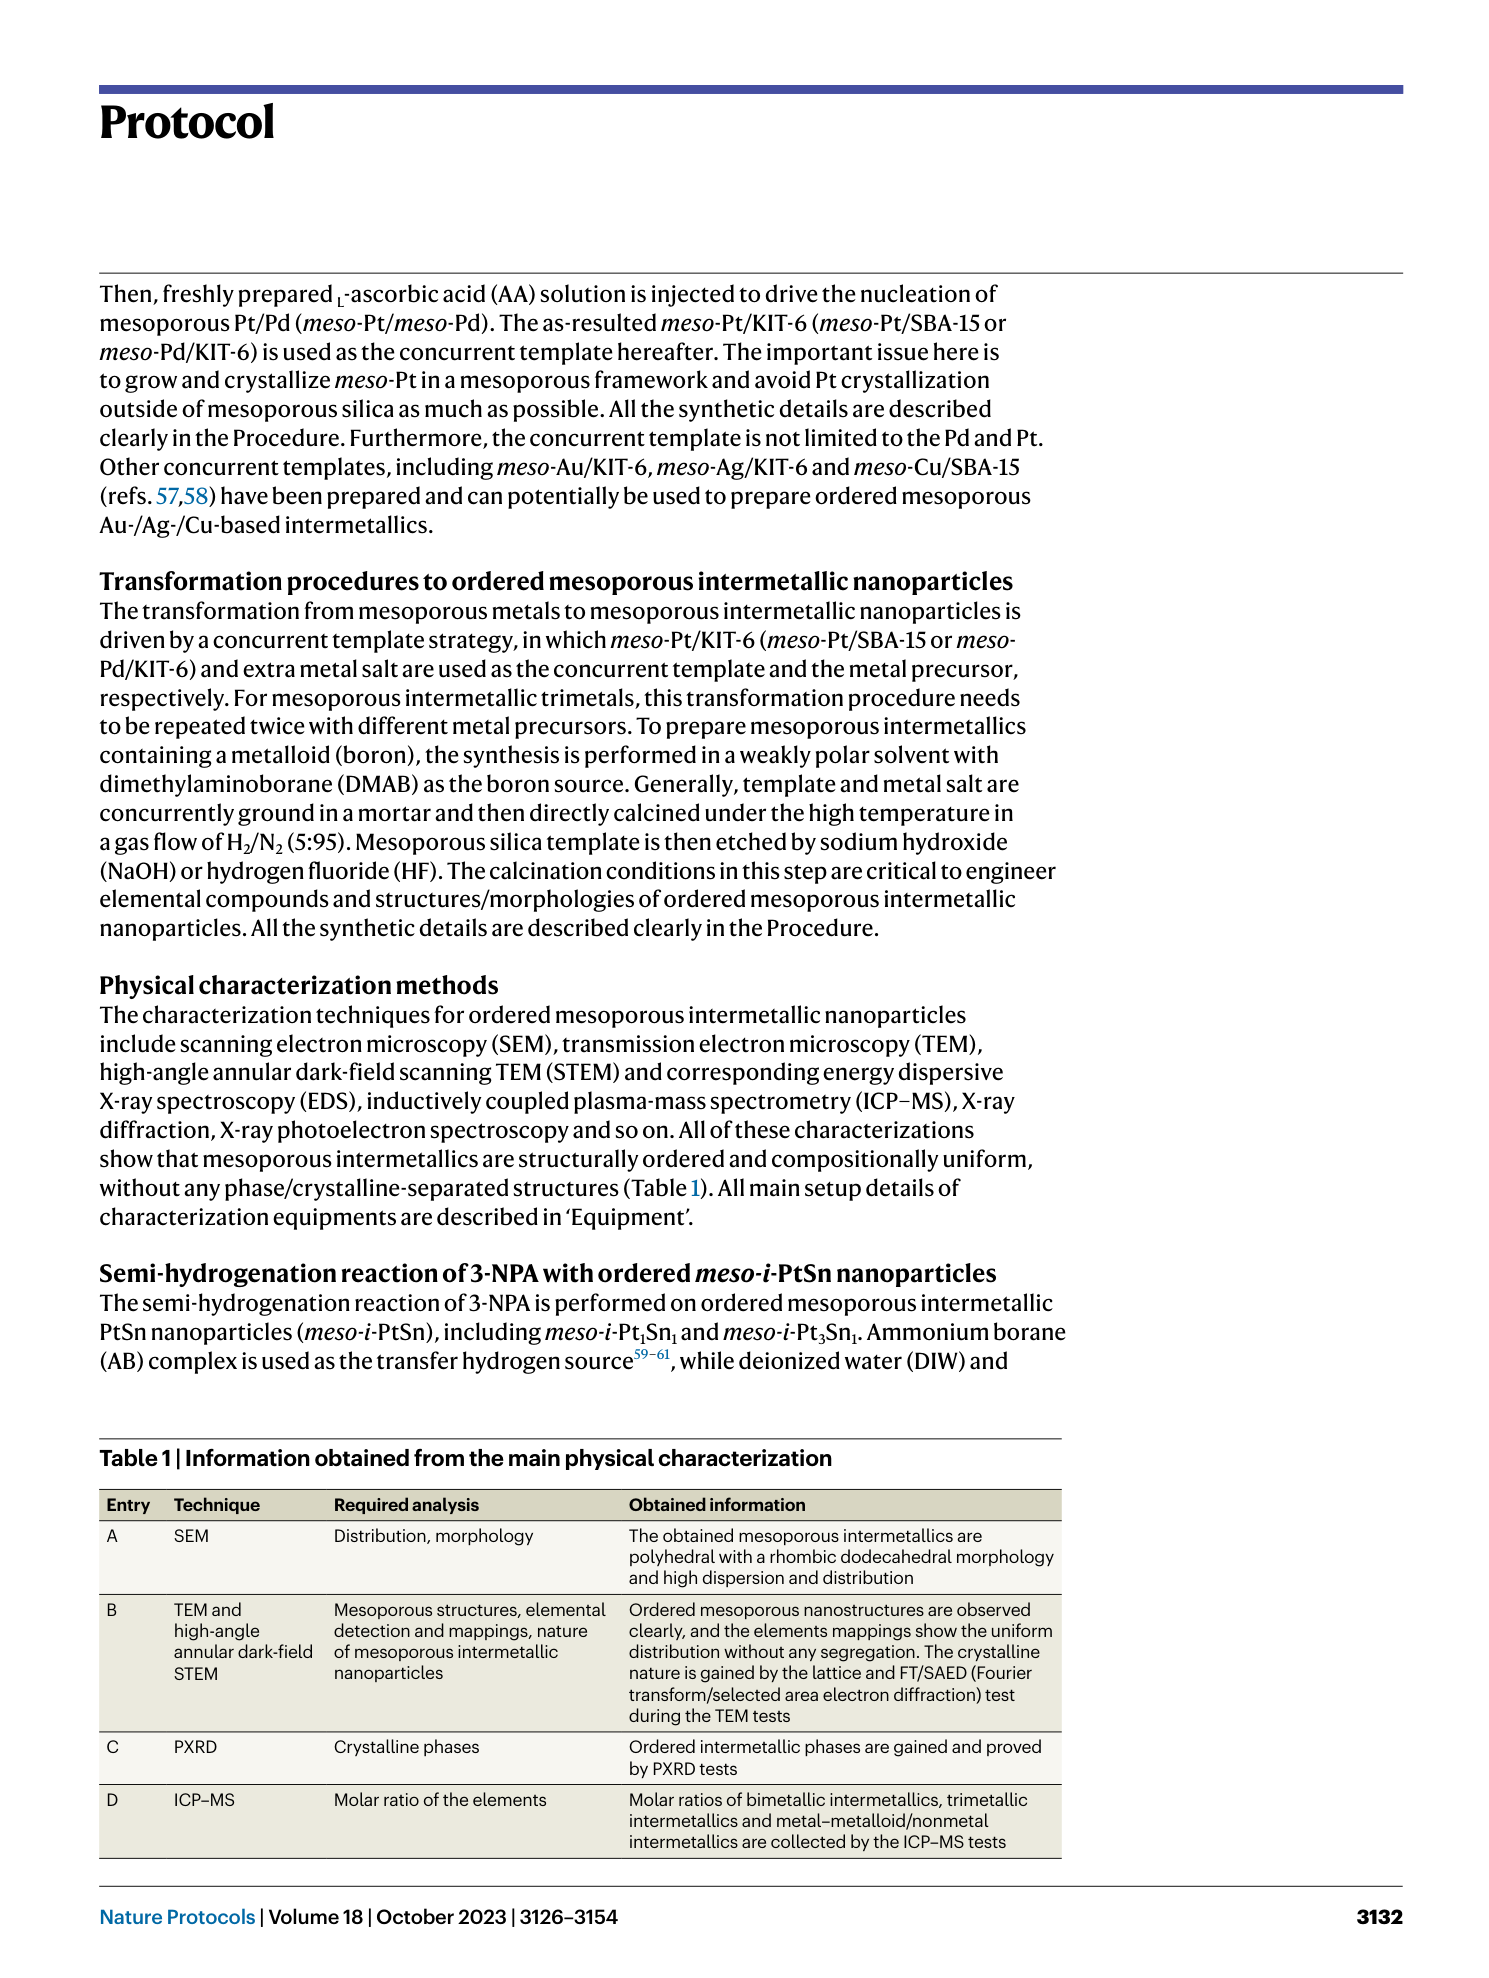
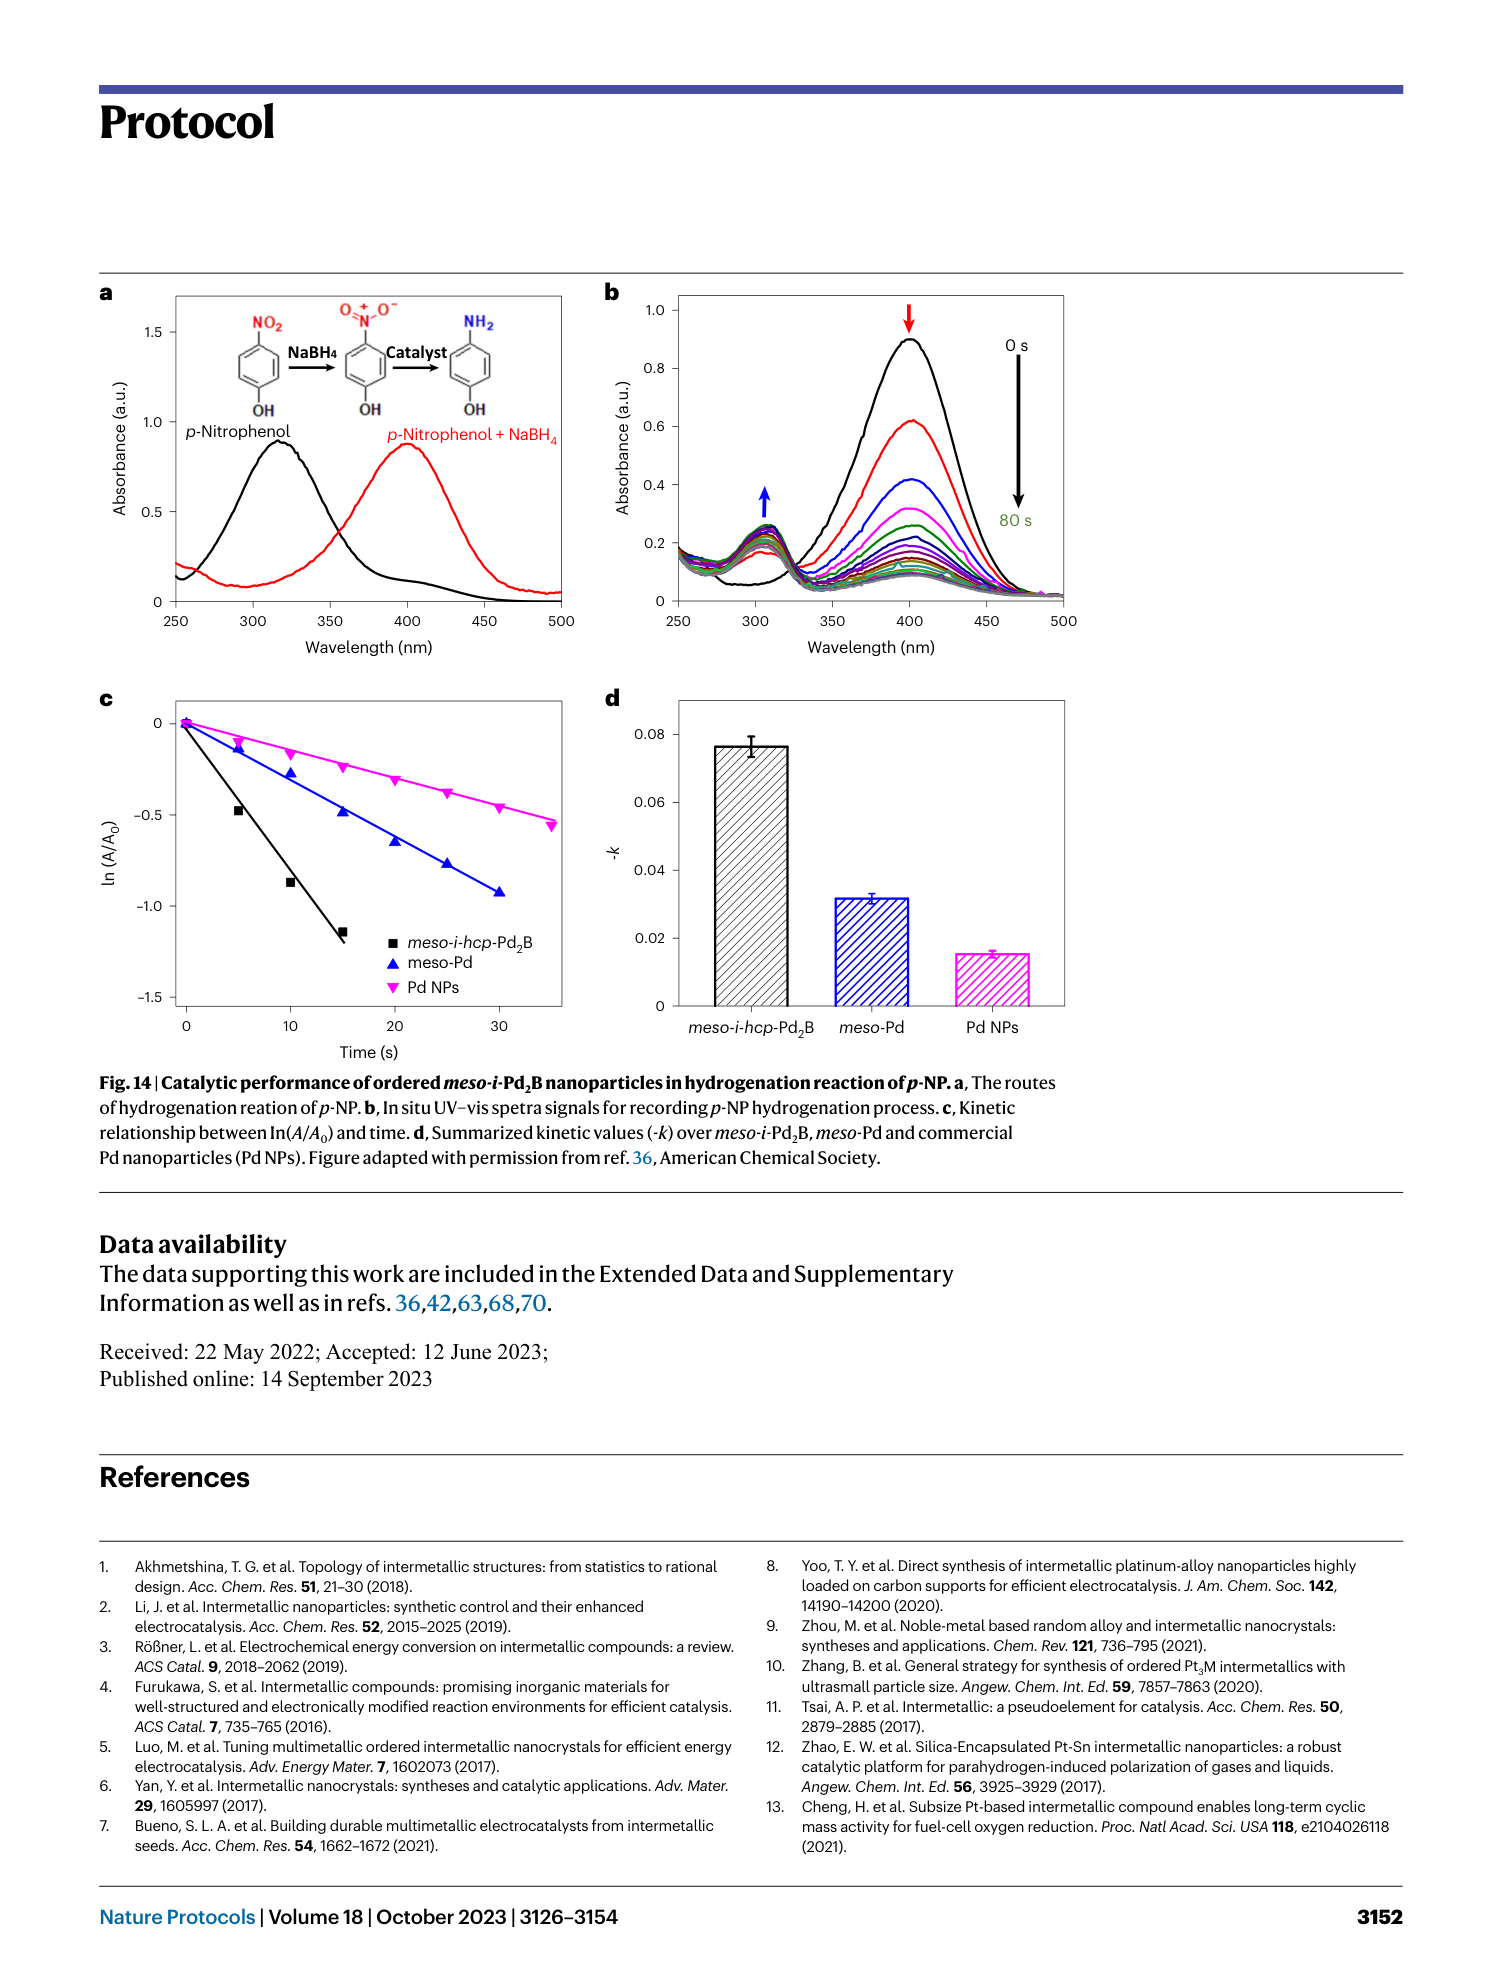
catalytic performance
KIT-6
stoichiometry optimization


Extended
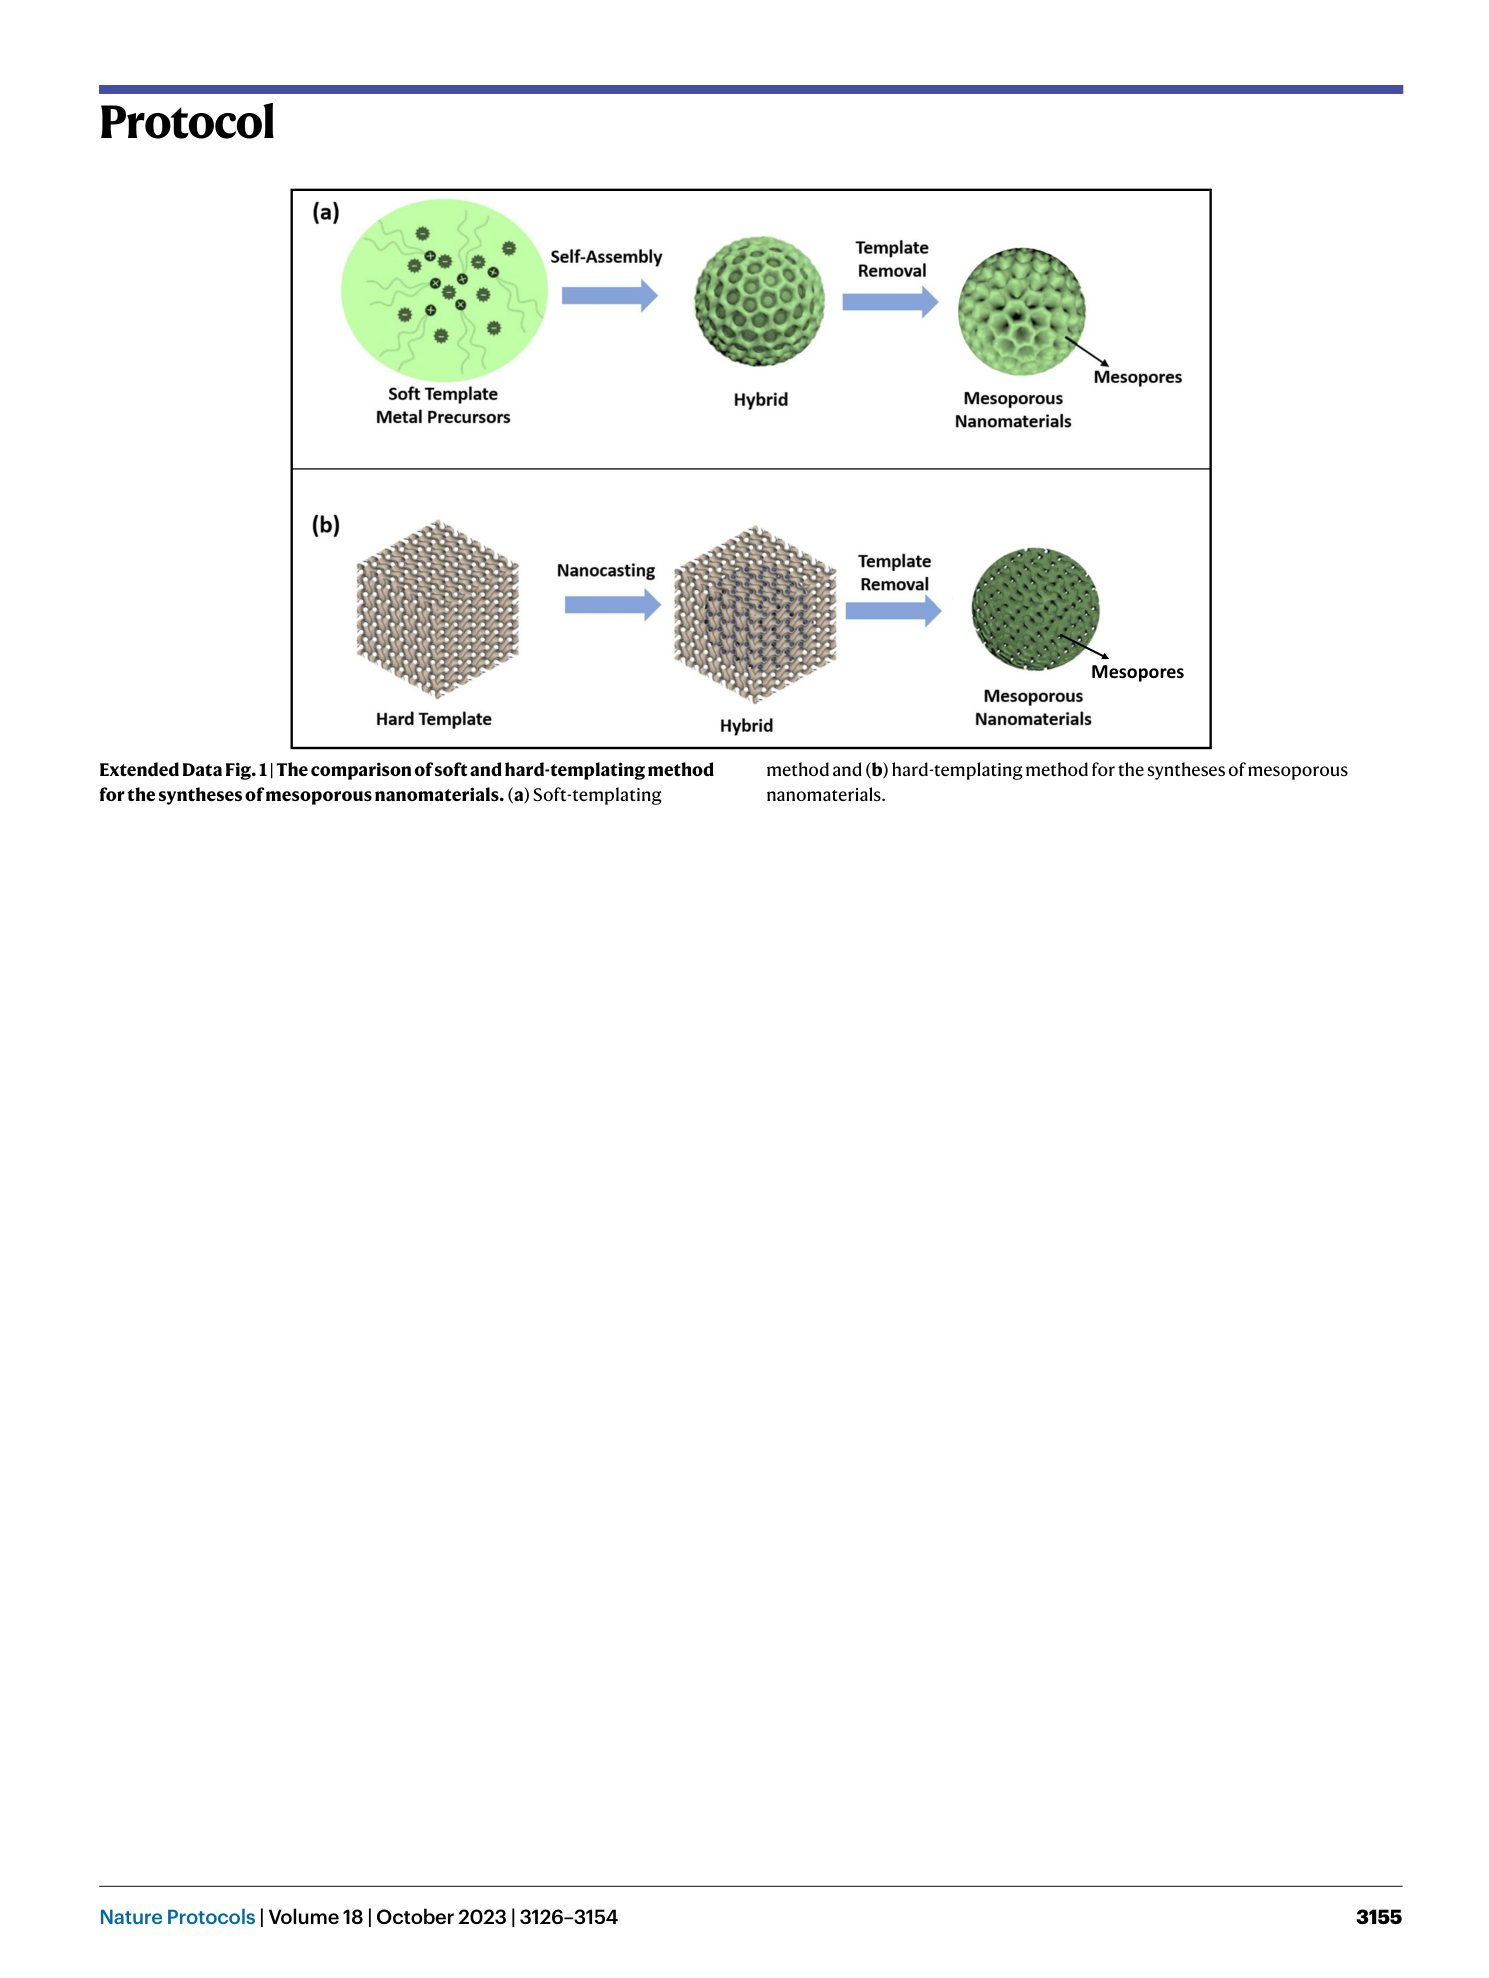
Extended Data Fig. 1 The comparison of soft and hard-templating method for the syntheses of mesoporous nanomaterials.
( a ) Soft-templating method and ( b ) hard-templating method for the syntheses of mesoporous nanomaterials.
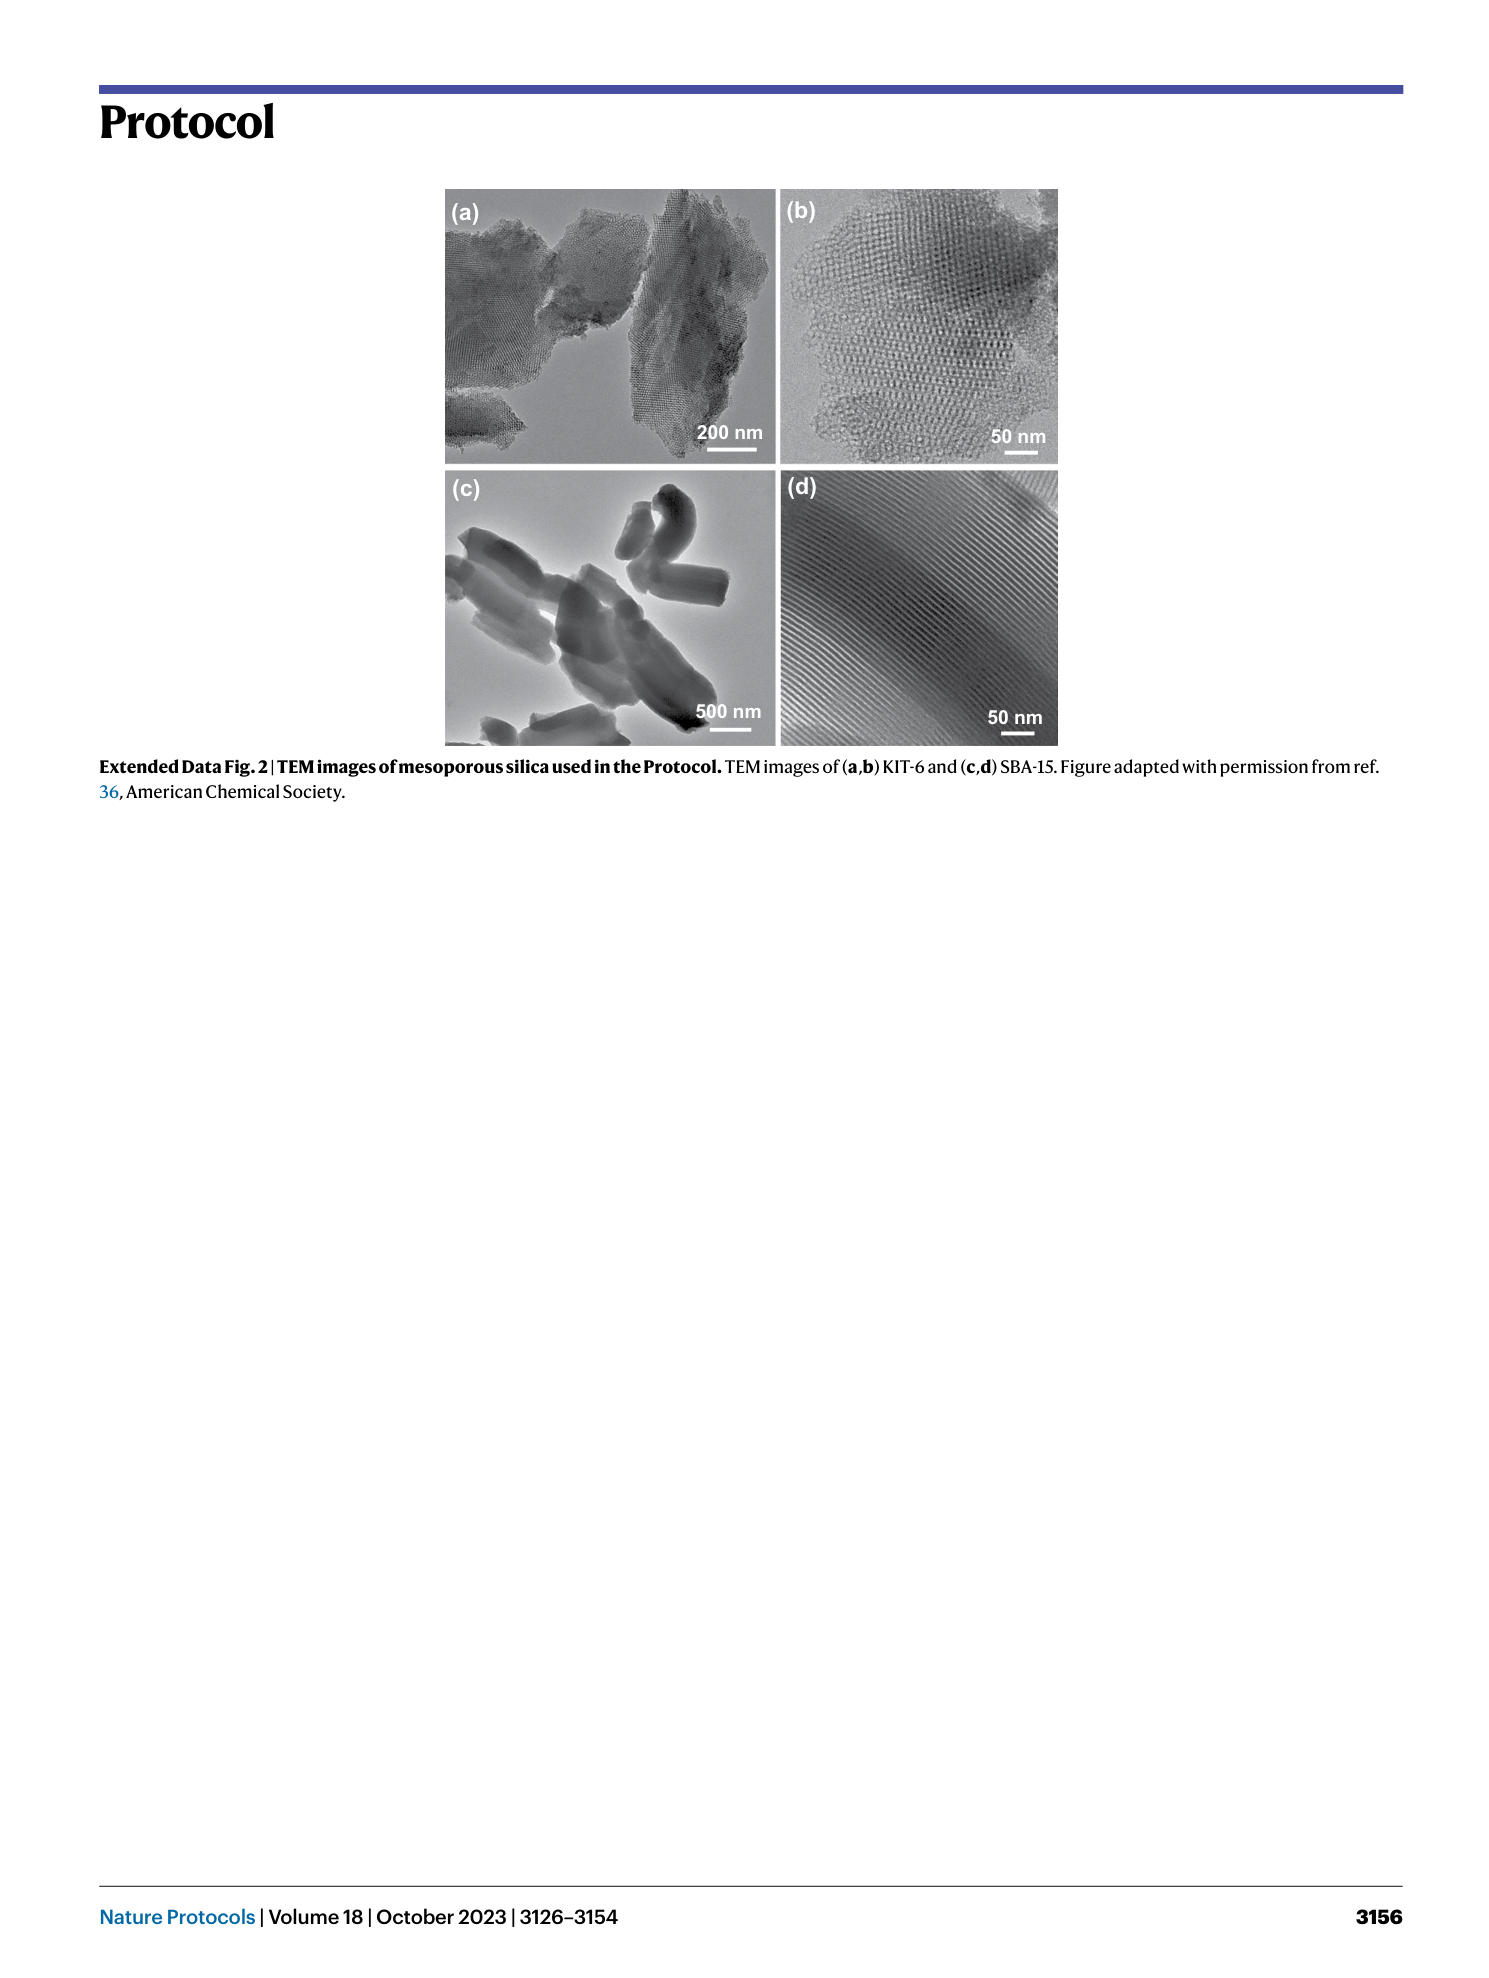
Extended Data Fig. 2 TEM images of mesoporous silica used in the Protocol.
TEM images of ( a , b ) KIT-6 and ( c , d ) SBA-15. Figure adapted with permission from ref. 36 , American Chemical Society.
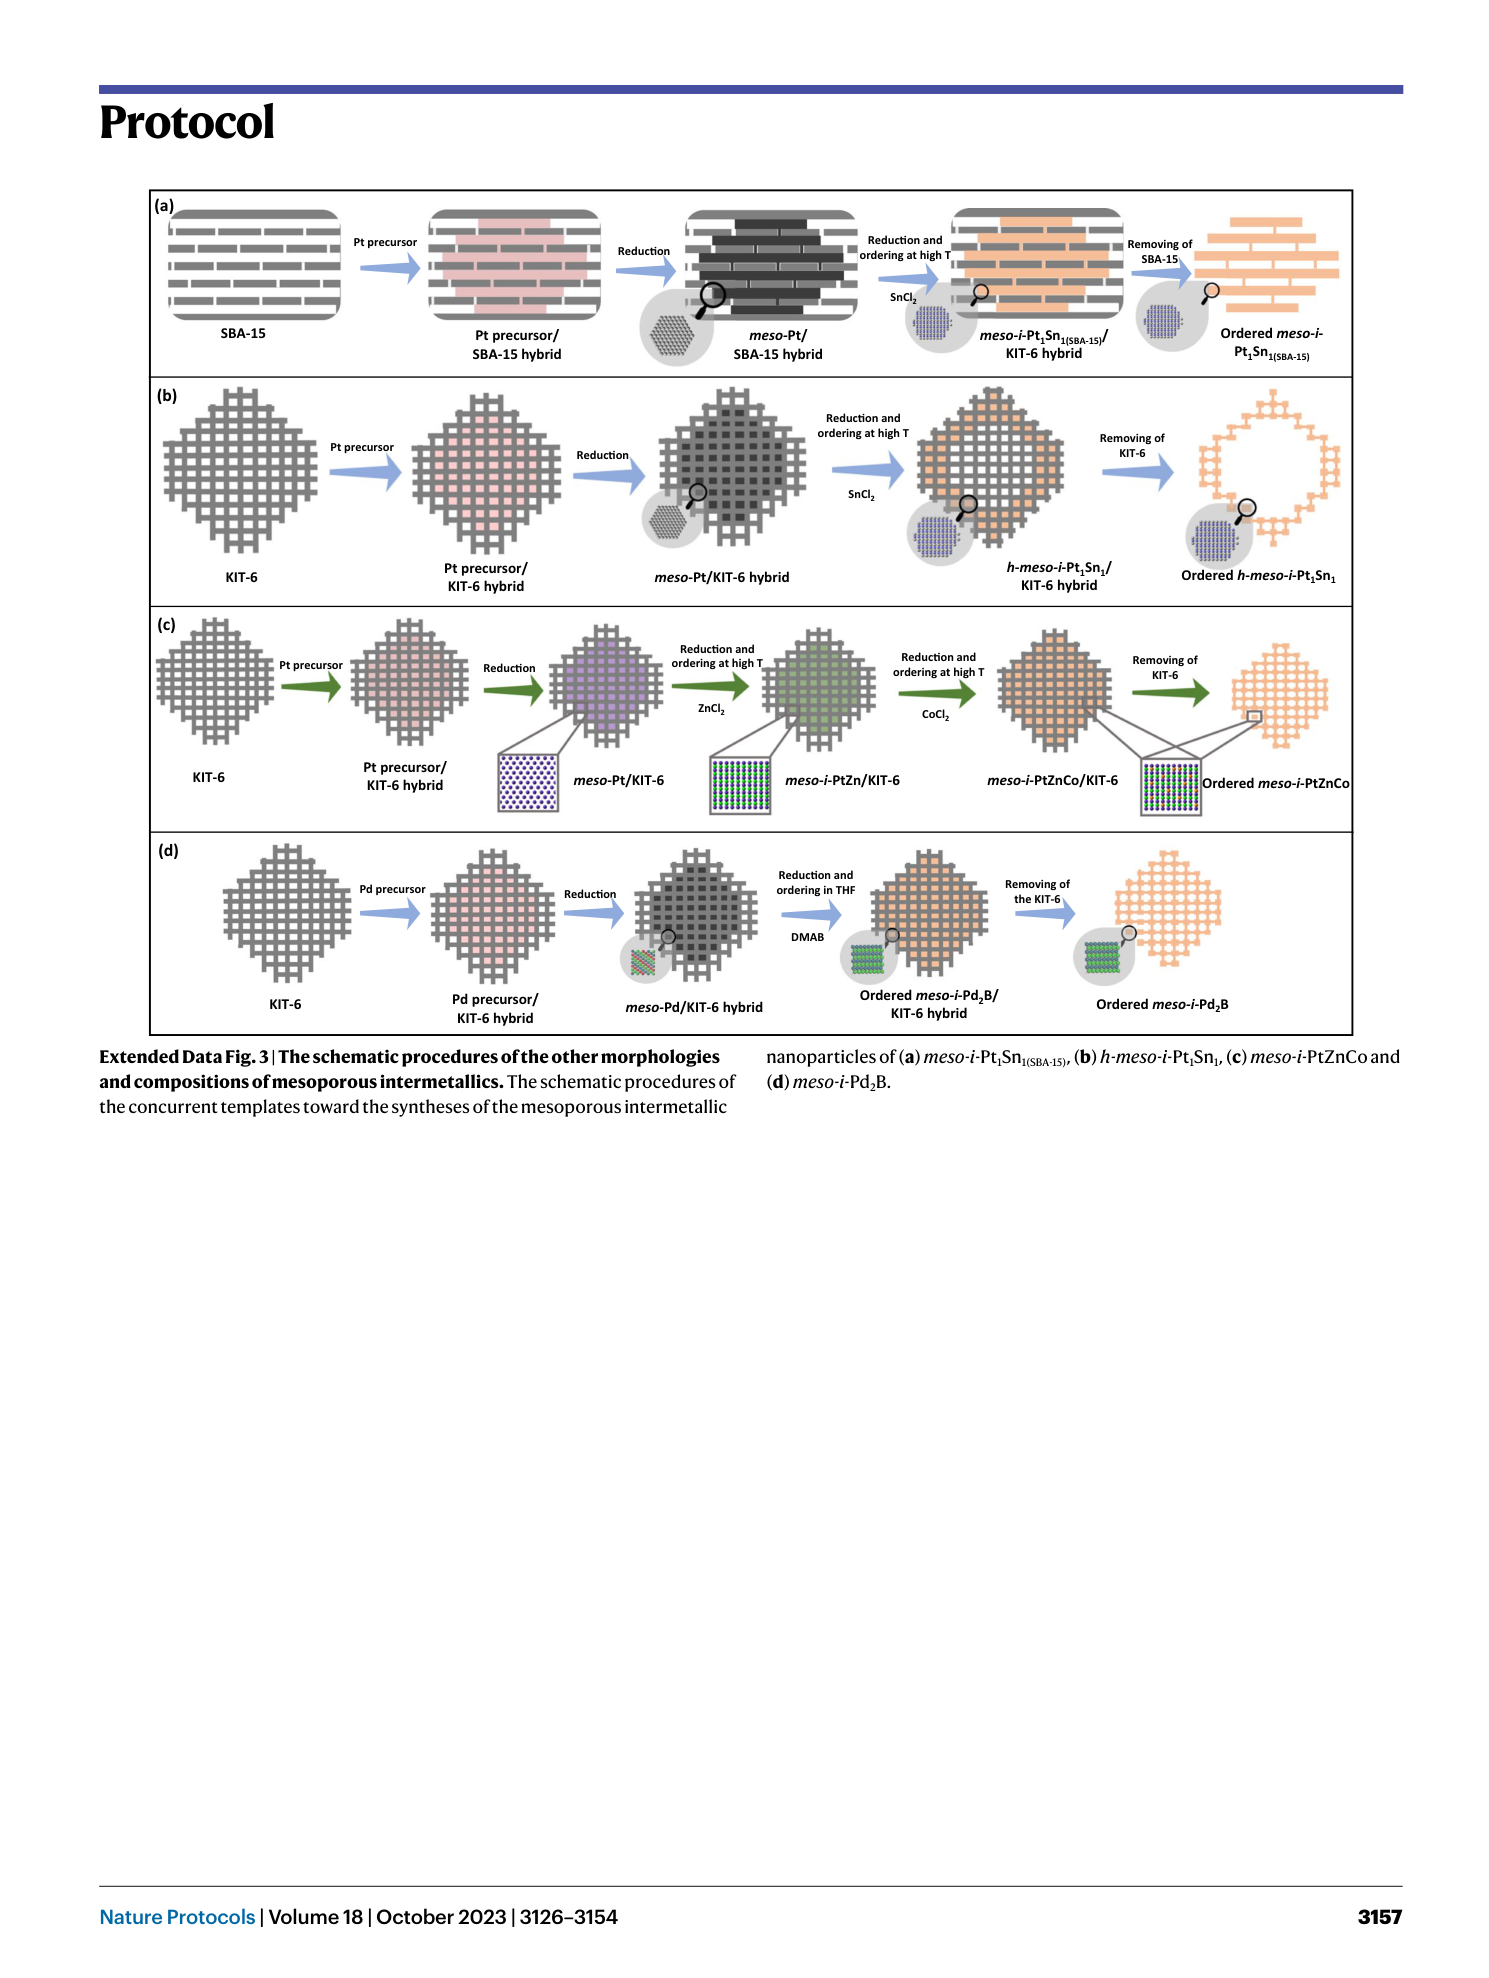
Extended Data Fig. 3 The schematic procedures of the other morphologies and compositions of mesoporous intermetallics.
The schematic procedures of the concurrent templates toward the syntheses of the mesoporous intermetallic nanoparticles of ( a ) meso-i -Pt 1 Sn 1(SBA-15) , ( b ) h-meso-i -Pt 1 Sn 1 , ( c ) meso-i -PtZnCo and ( d ) meso-i -Pd 2 B.
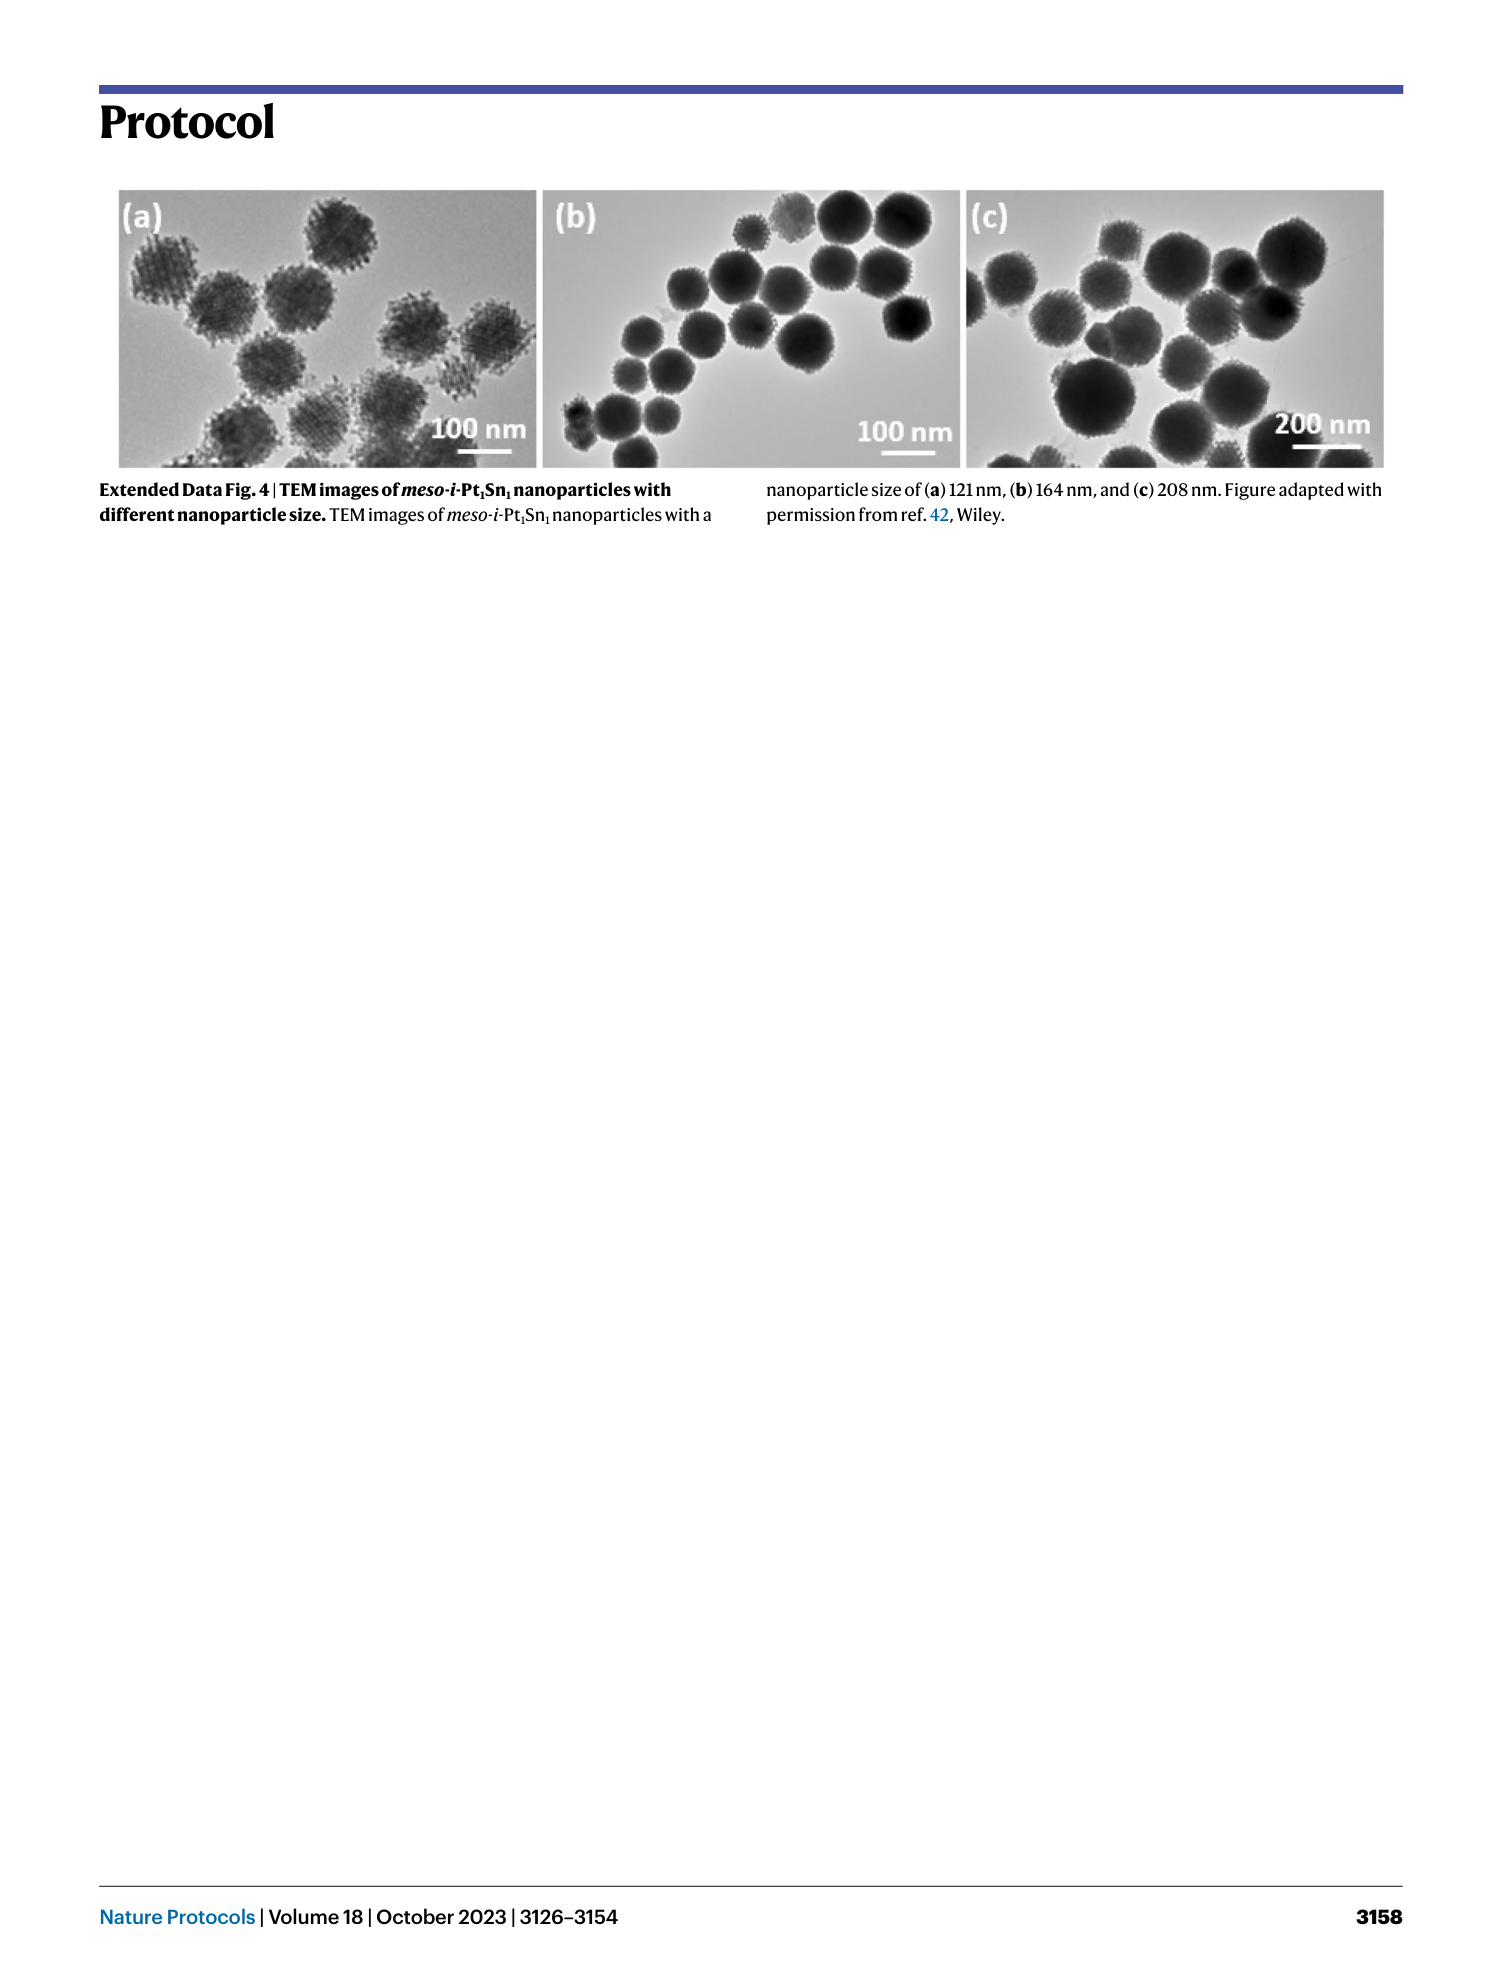
Extended Data Fig. 4 TEM images of meso - i -Pt 1 Sn 1 nanoparticles with different nanoparticle size.
TEM images of meso - i -Pt 1 Sn 1 nanoparticles with a nanoparticle size of ( a ) 121 nm, ( b ) 164 nm, and ( c ) 208 nm. Figure adapted with permission from ref. 42 , Wiley.
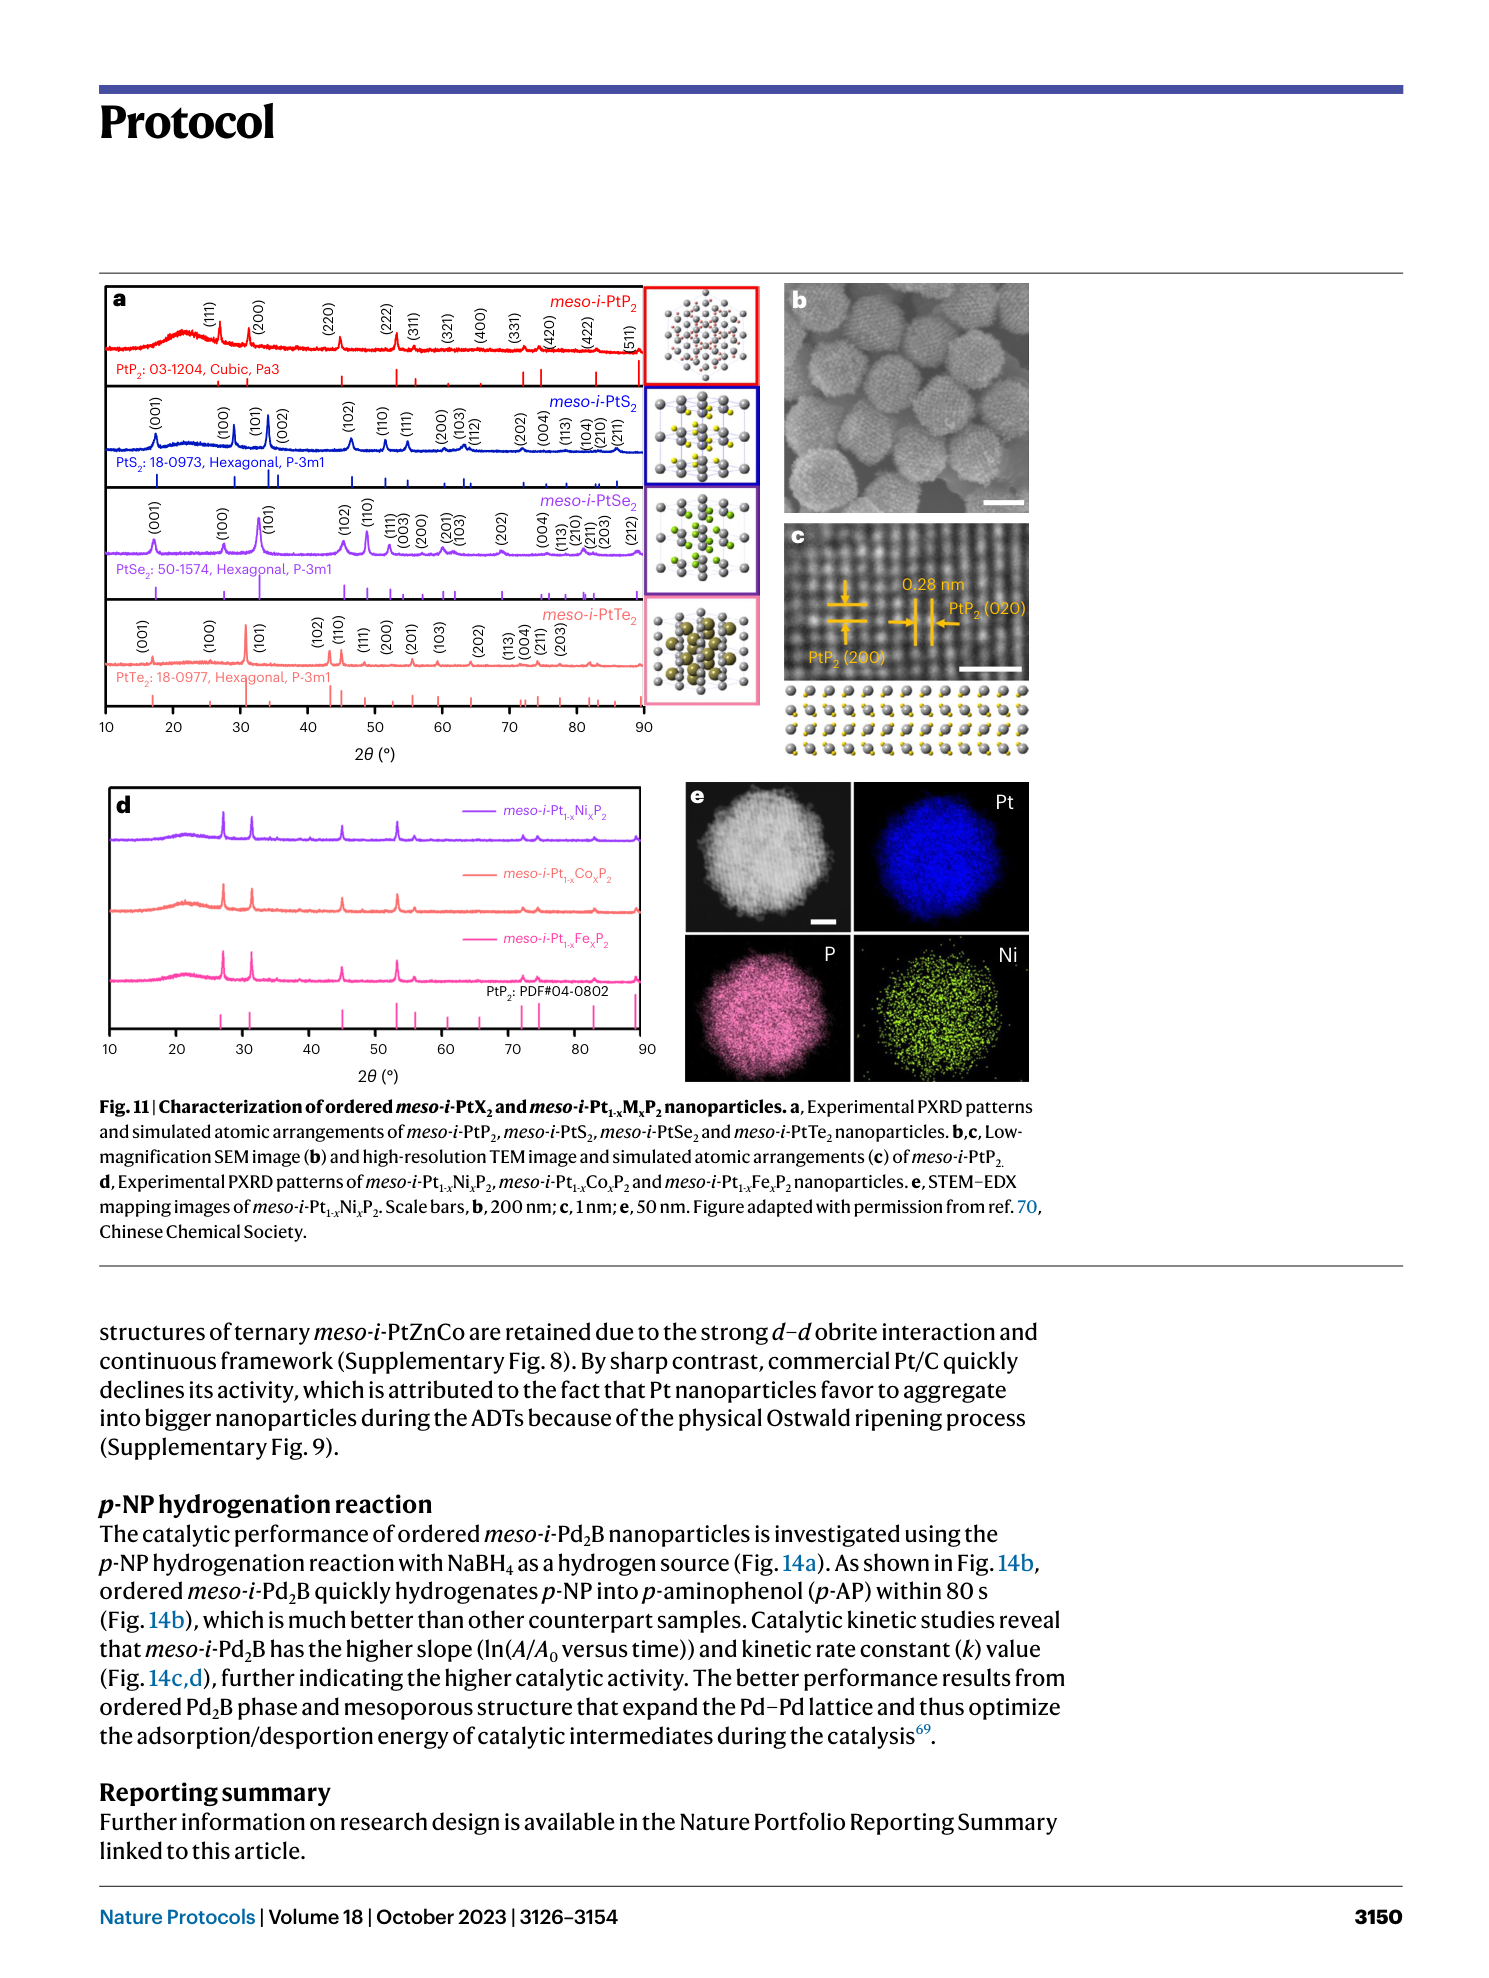
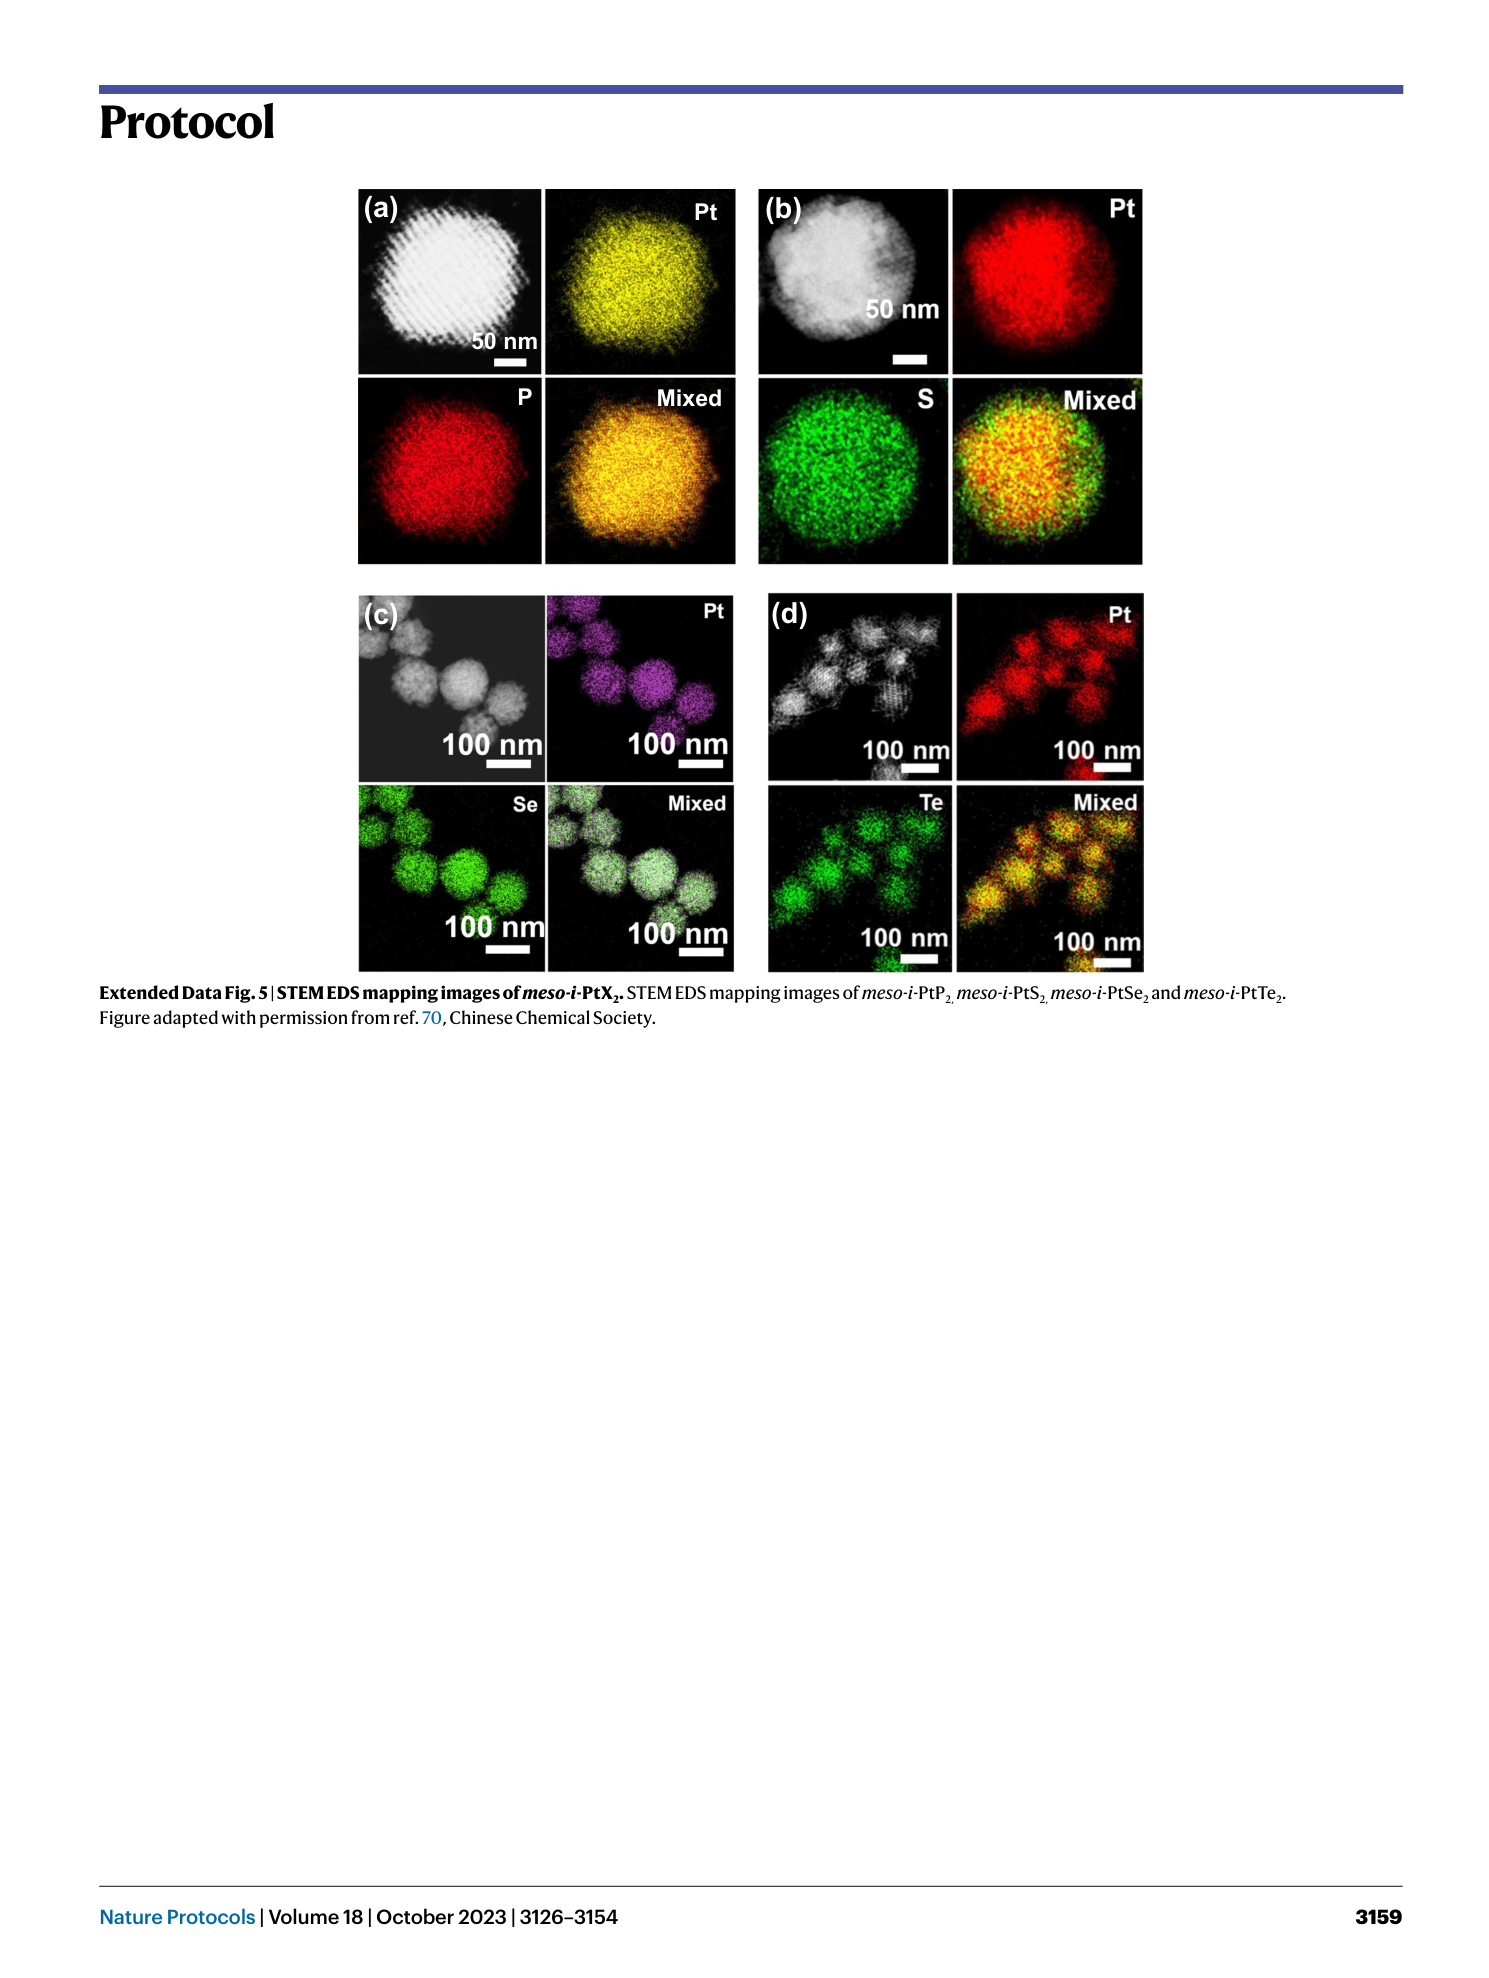
Extended Data Fig. 5 STEM EDS mapping images of meso-i -PtX 2 .
STEM EDS mapping images of meso-i -PtP 2, meso-i -PtS 2, meso-i -PtSe 2 and meso-i -PtTe 2 . Figure adapted with permission from ref. 70 , Chinese Chemical Society.
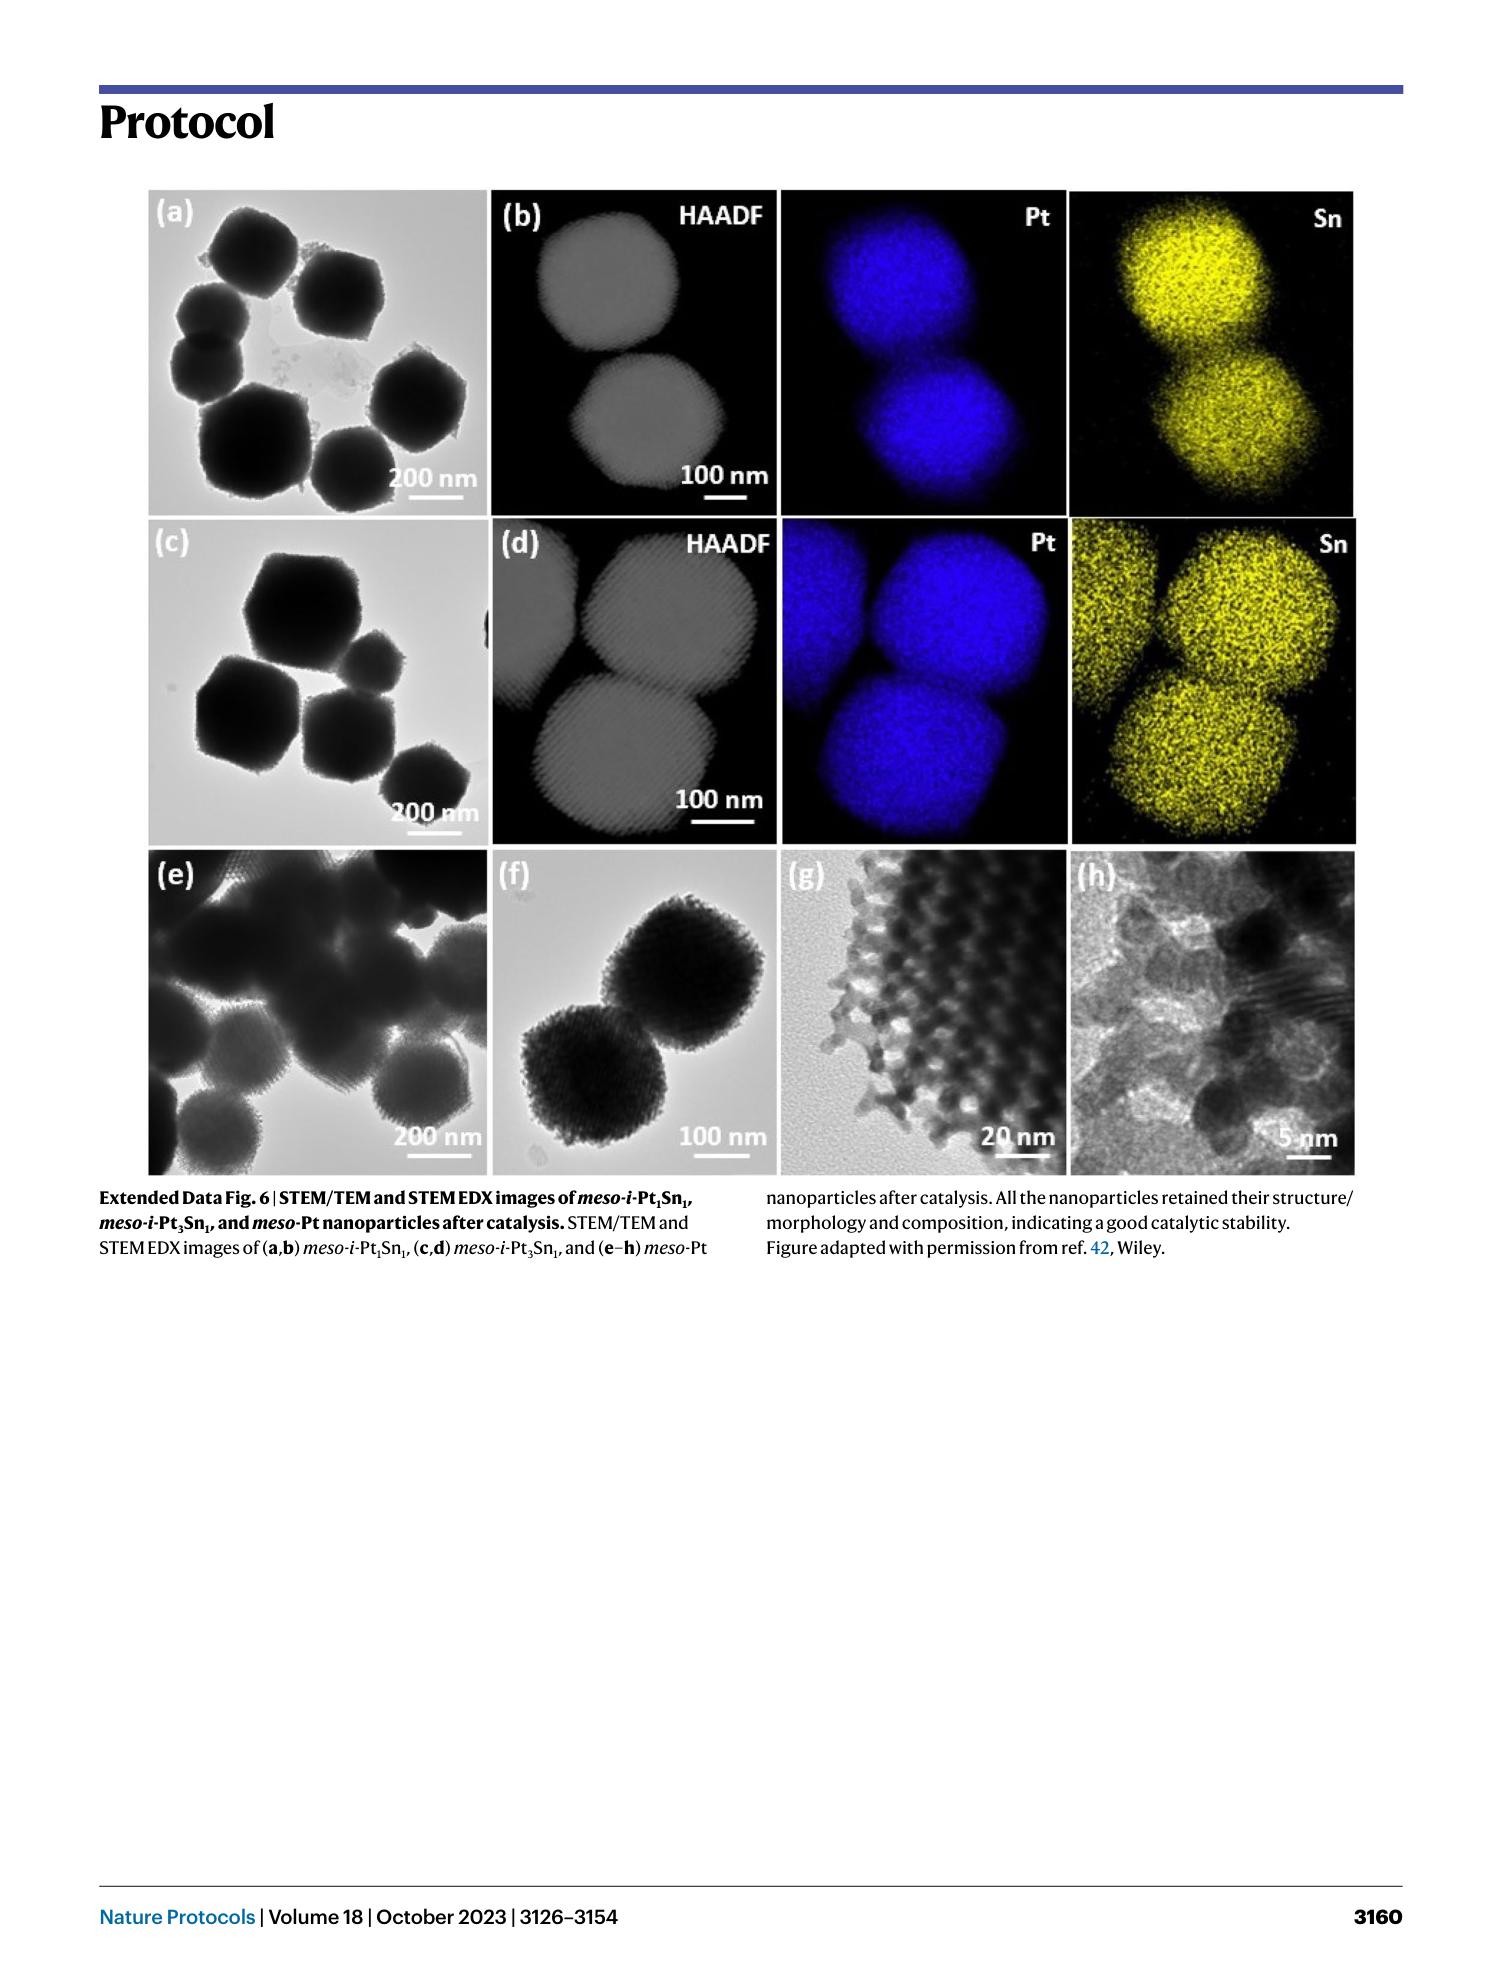
Extended Data Fig. 6 STEM/TEM and STEM EDX images of meso-i -Pt 1 Sn 1 , meso-i -Pt 3 Sn 1 , and meso -Pt nanoparticles after catalysis.
STEM/TEM and STEM EDX images of ( a , b ) meso-i -Pt 1 Sn 1 , ( c , d ) meso-i -Pt 3 Sn 1 , and ( e – h ) meso -Pt nanoparticles after catalysis. All the nanoparticles retained their structure/morphology and composition, indicating a good catalytic stability. Figure adapted with permission from ref. 42 , Wiley.
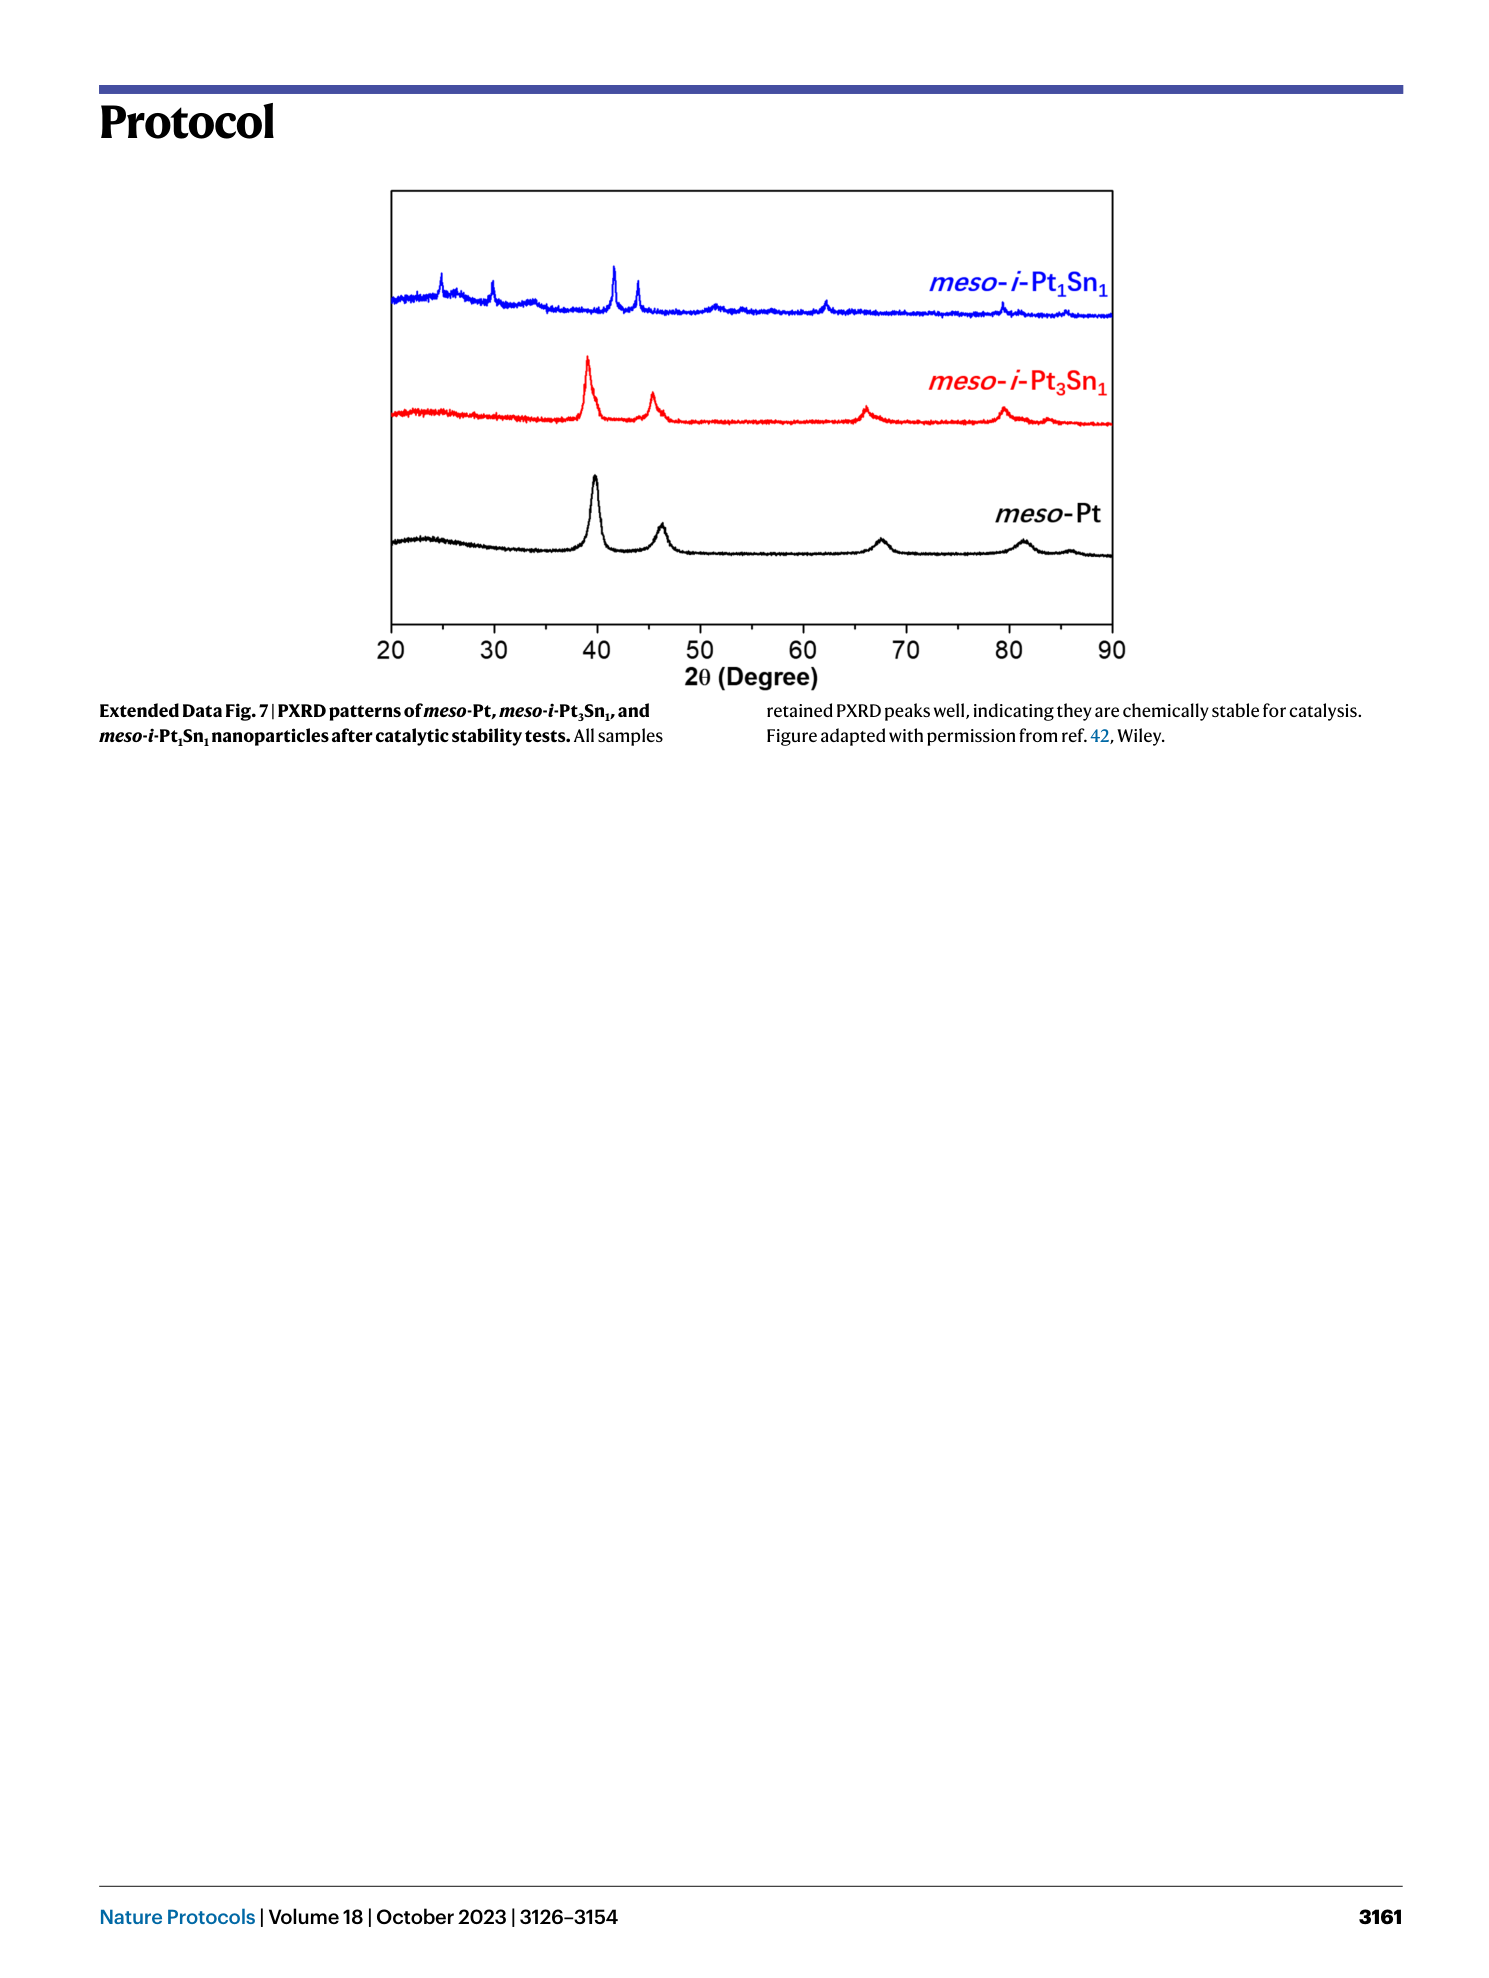
Extended Data Fig. 7 PXRD patterns of meso -Pt, meso - i -Pt 3 Sn 1 , and meso - i -Pt 1 Sn 1 nanoparticles after catalytic stability tests.
All samples retained PXRD peaks well, indicating they are chemically stable for catalysis. Figure adapted with permission from ref. 42 , Wiley.
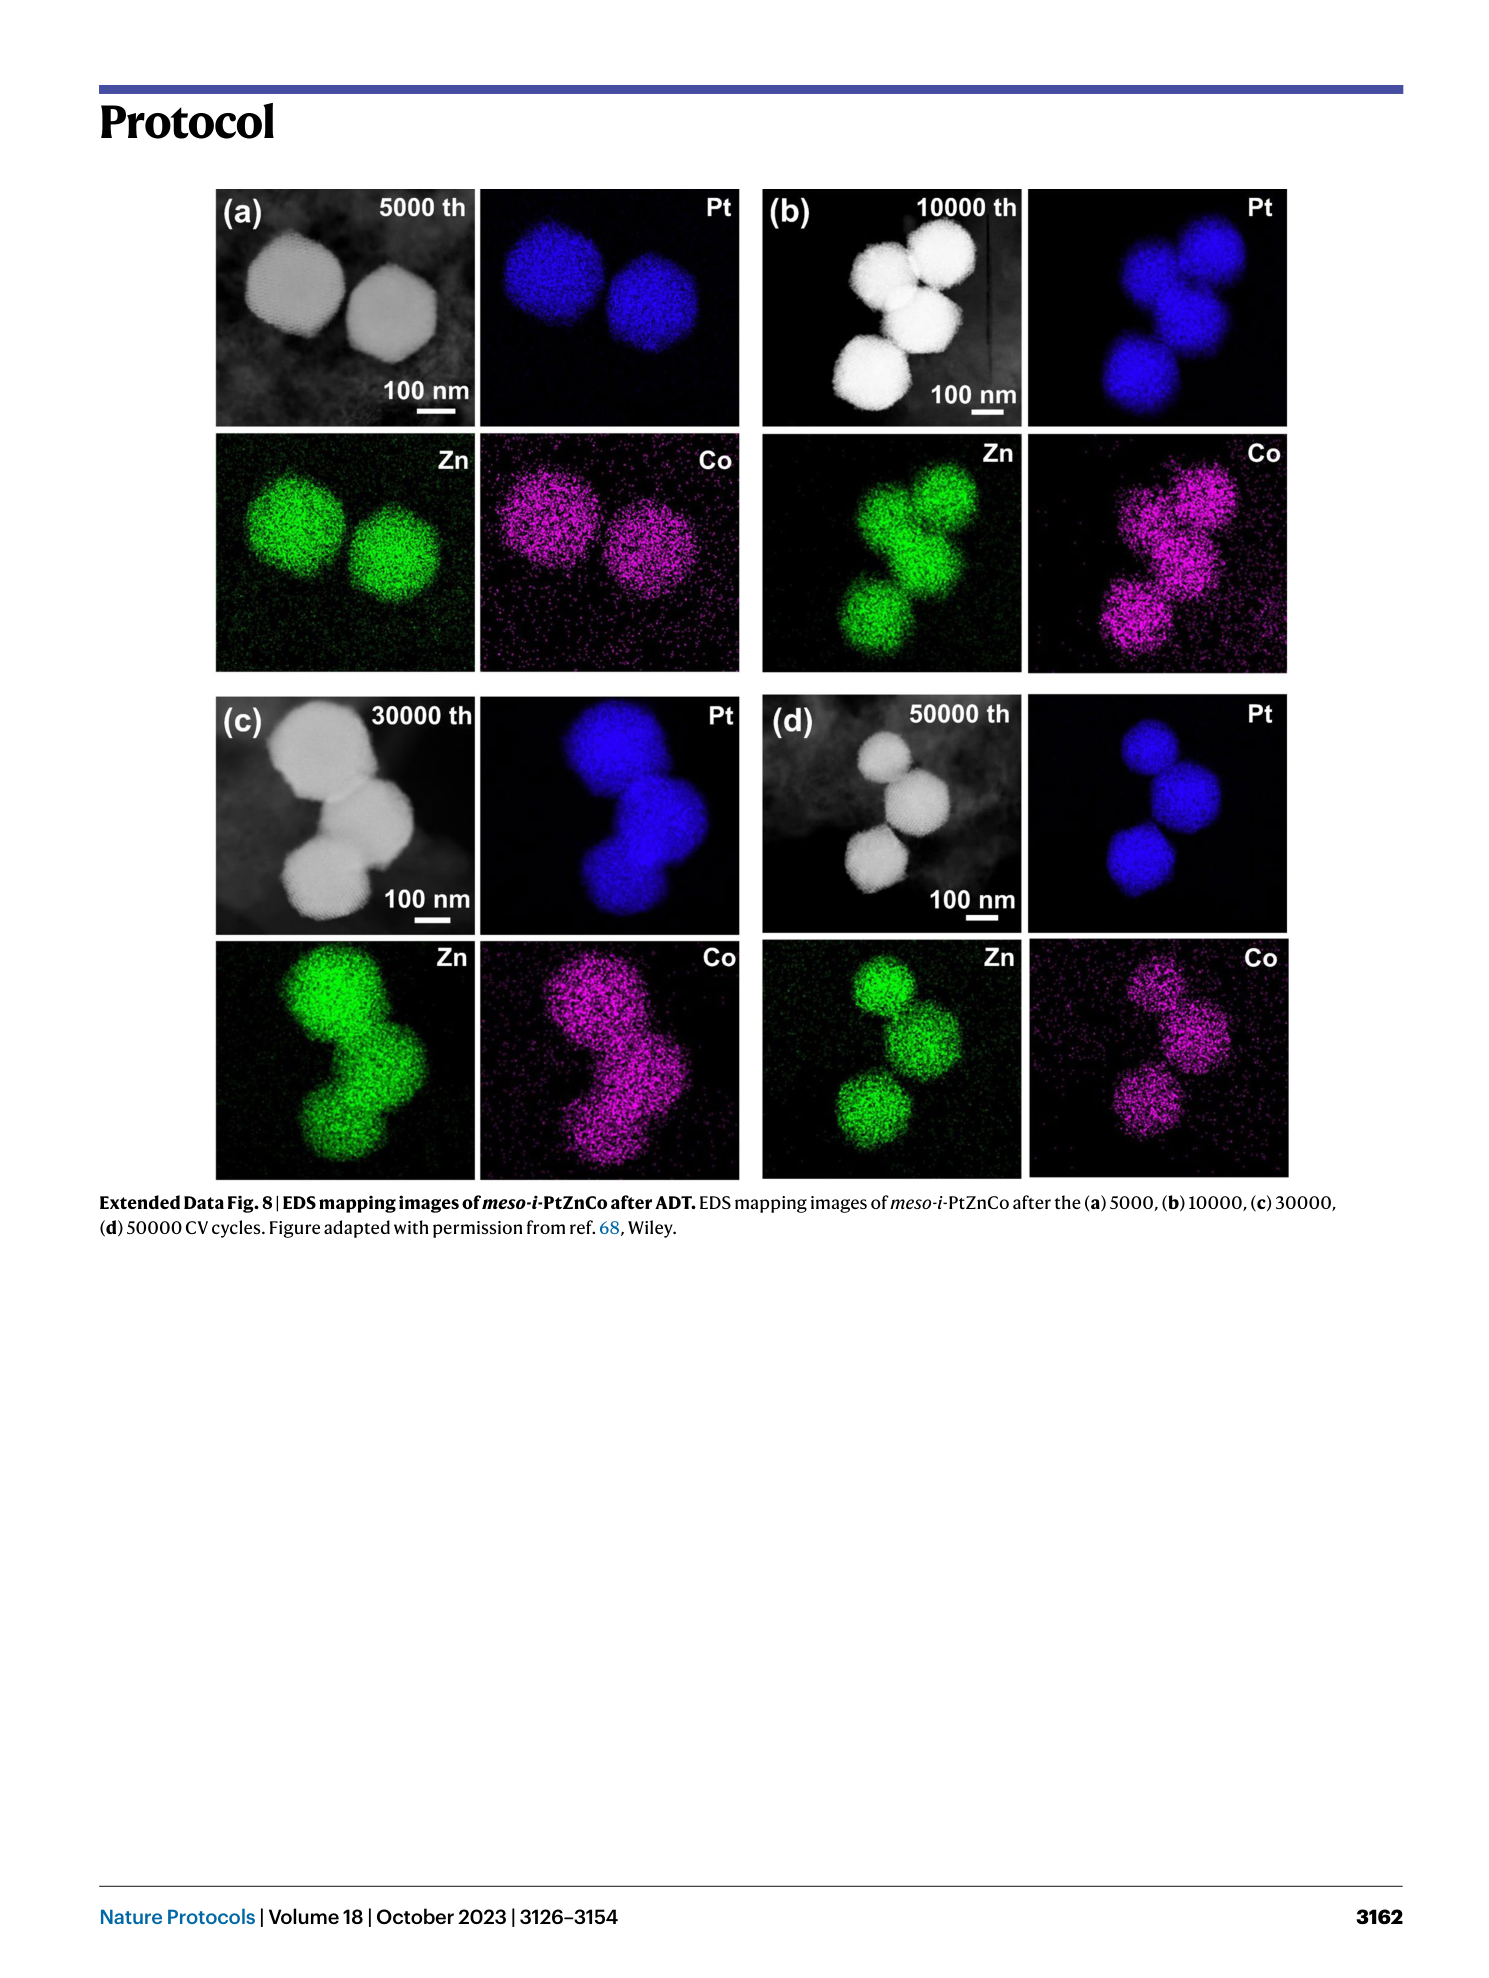
Extended Data Fig. 8 EDS mapping images of meso-i -PtZnCo after ADT.
EDS mapping images of meso-i -PtZnCo after the ( a ) 5000, ( b ) 10000, ( c ) 30000, ( d ) 50000 CV cycles. Figure adapted with permission from ref. 68 , Wiley.
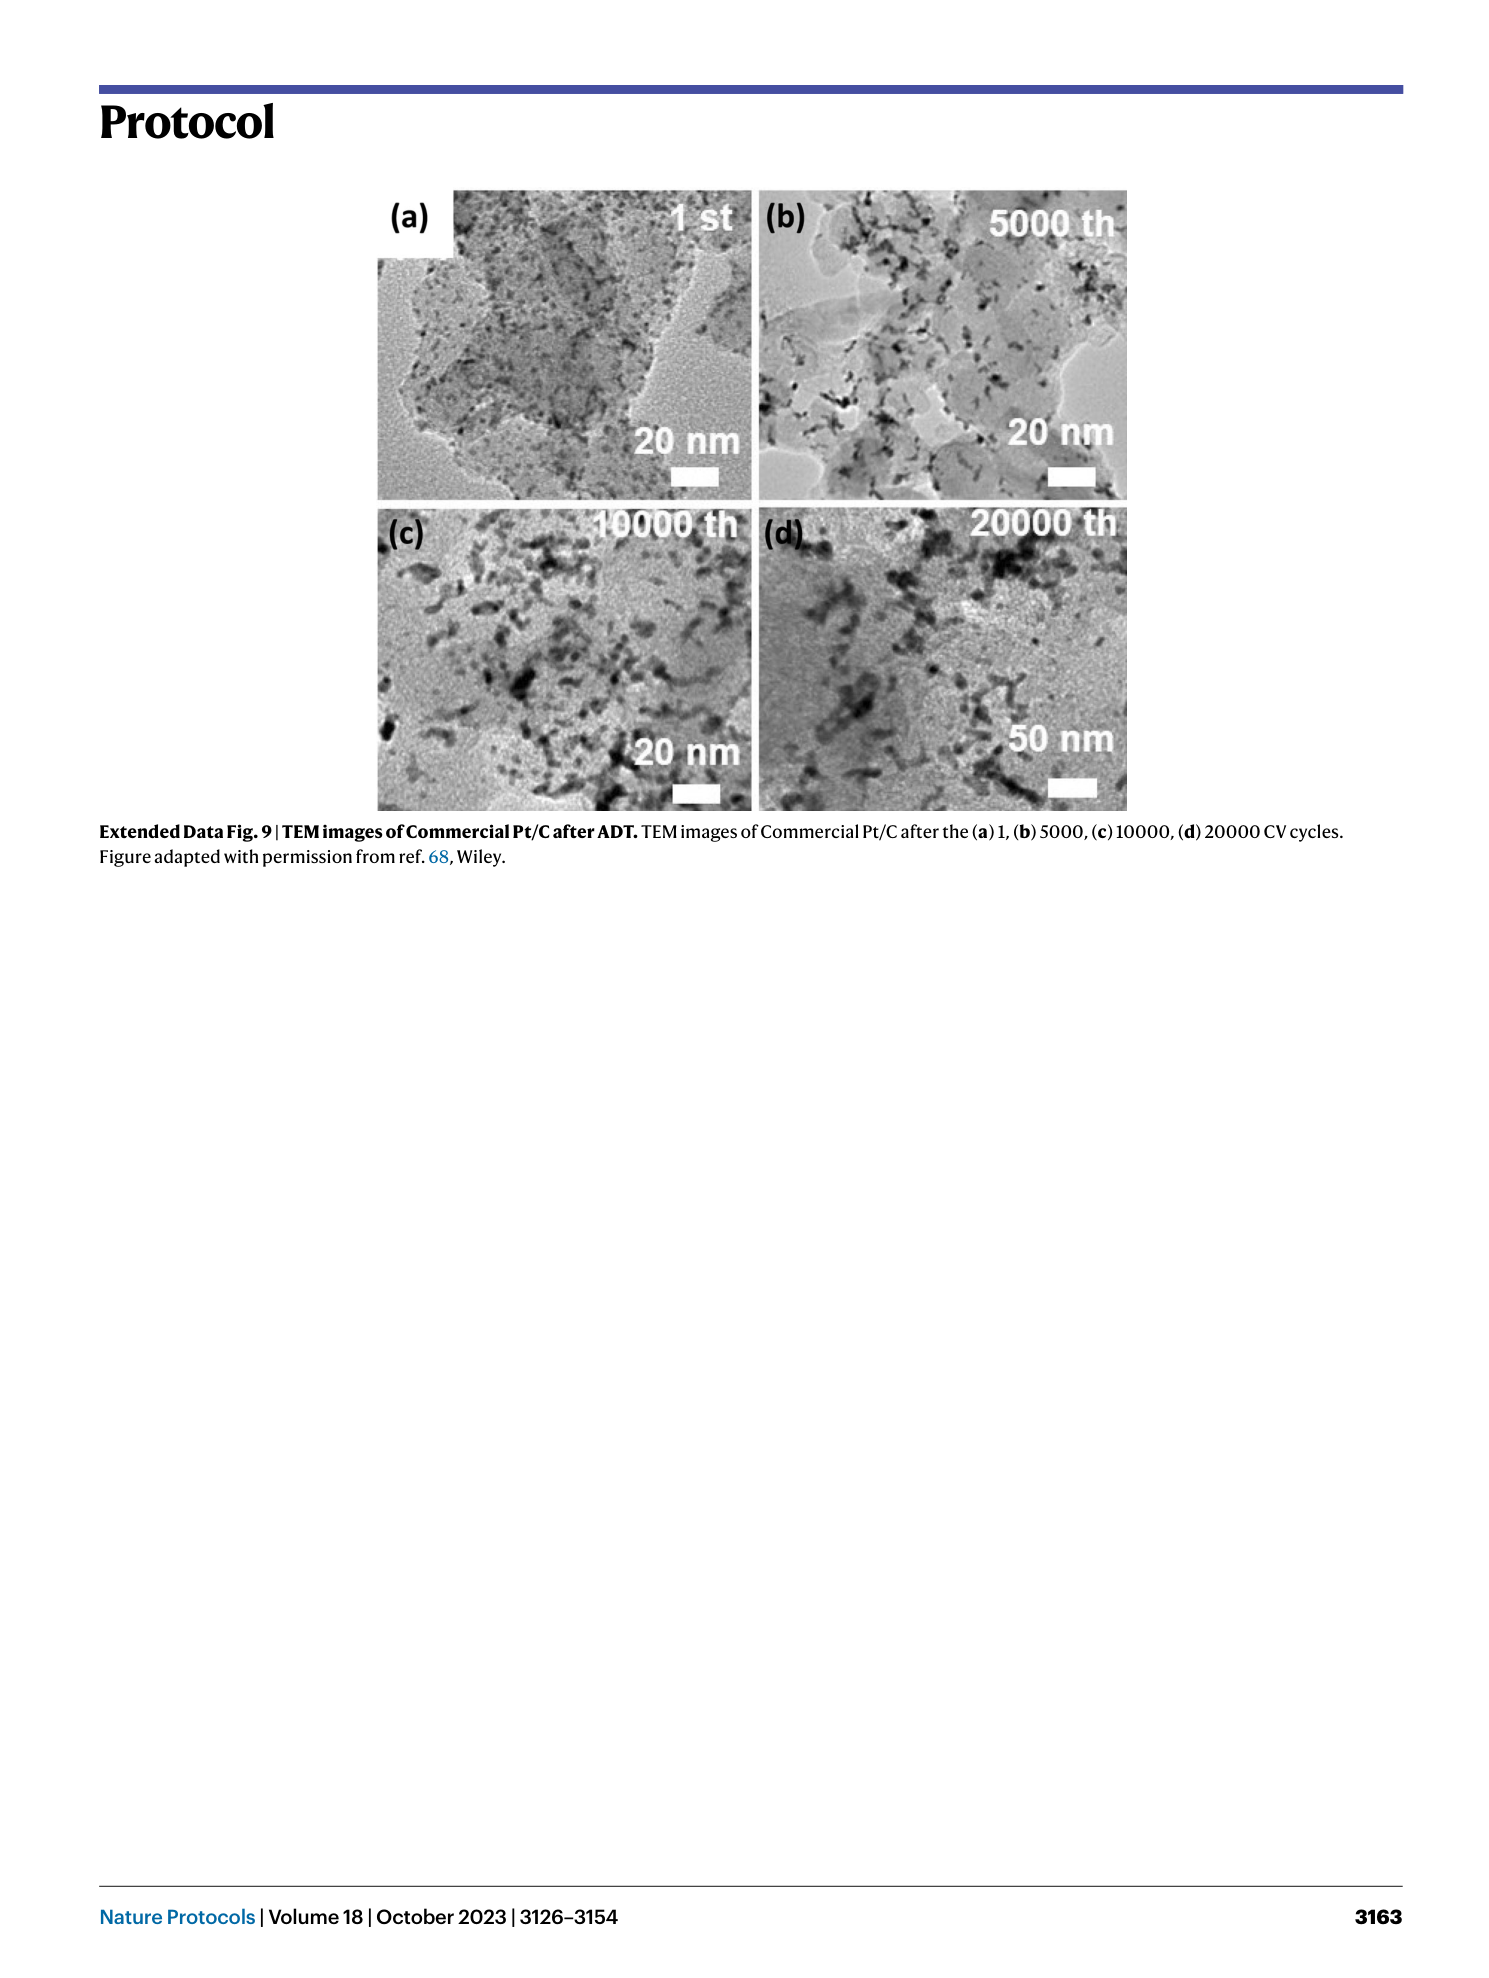
Extended Data Fig. 9 TEM images of Commercial Pt/C after ADT.
TEM images of Commercial Pt/C after the ( a ) 1, ( b ) 5000, ( c ) 10000, ( d ) 20000 CV cycles. Figure adapted with permission from ref. 68 , Wiley.
