iDRiP for the systematic discovery of proteins bound directly to noncoding RNA
Hsueh-Ping Chu, Anand Minajigi, Yunfei Chen, Robert Morris, Chia-Yu Guh, Yu-Hung Hsieh, Myriam Boukhali, Wilhelm Haas, Jeannie T. Lee
Extended
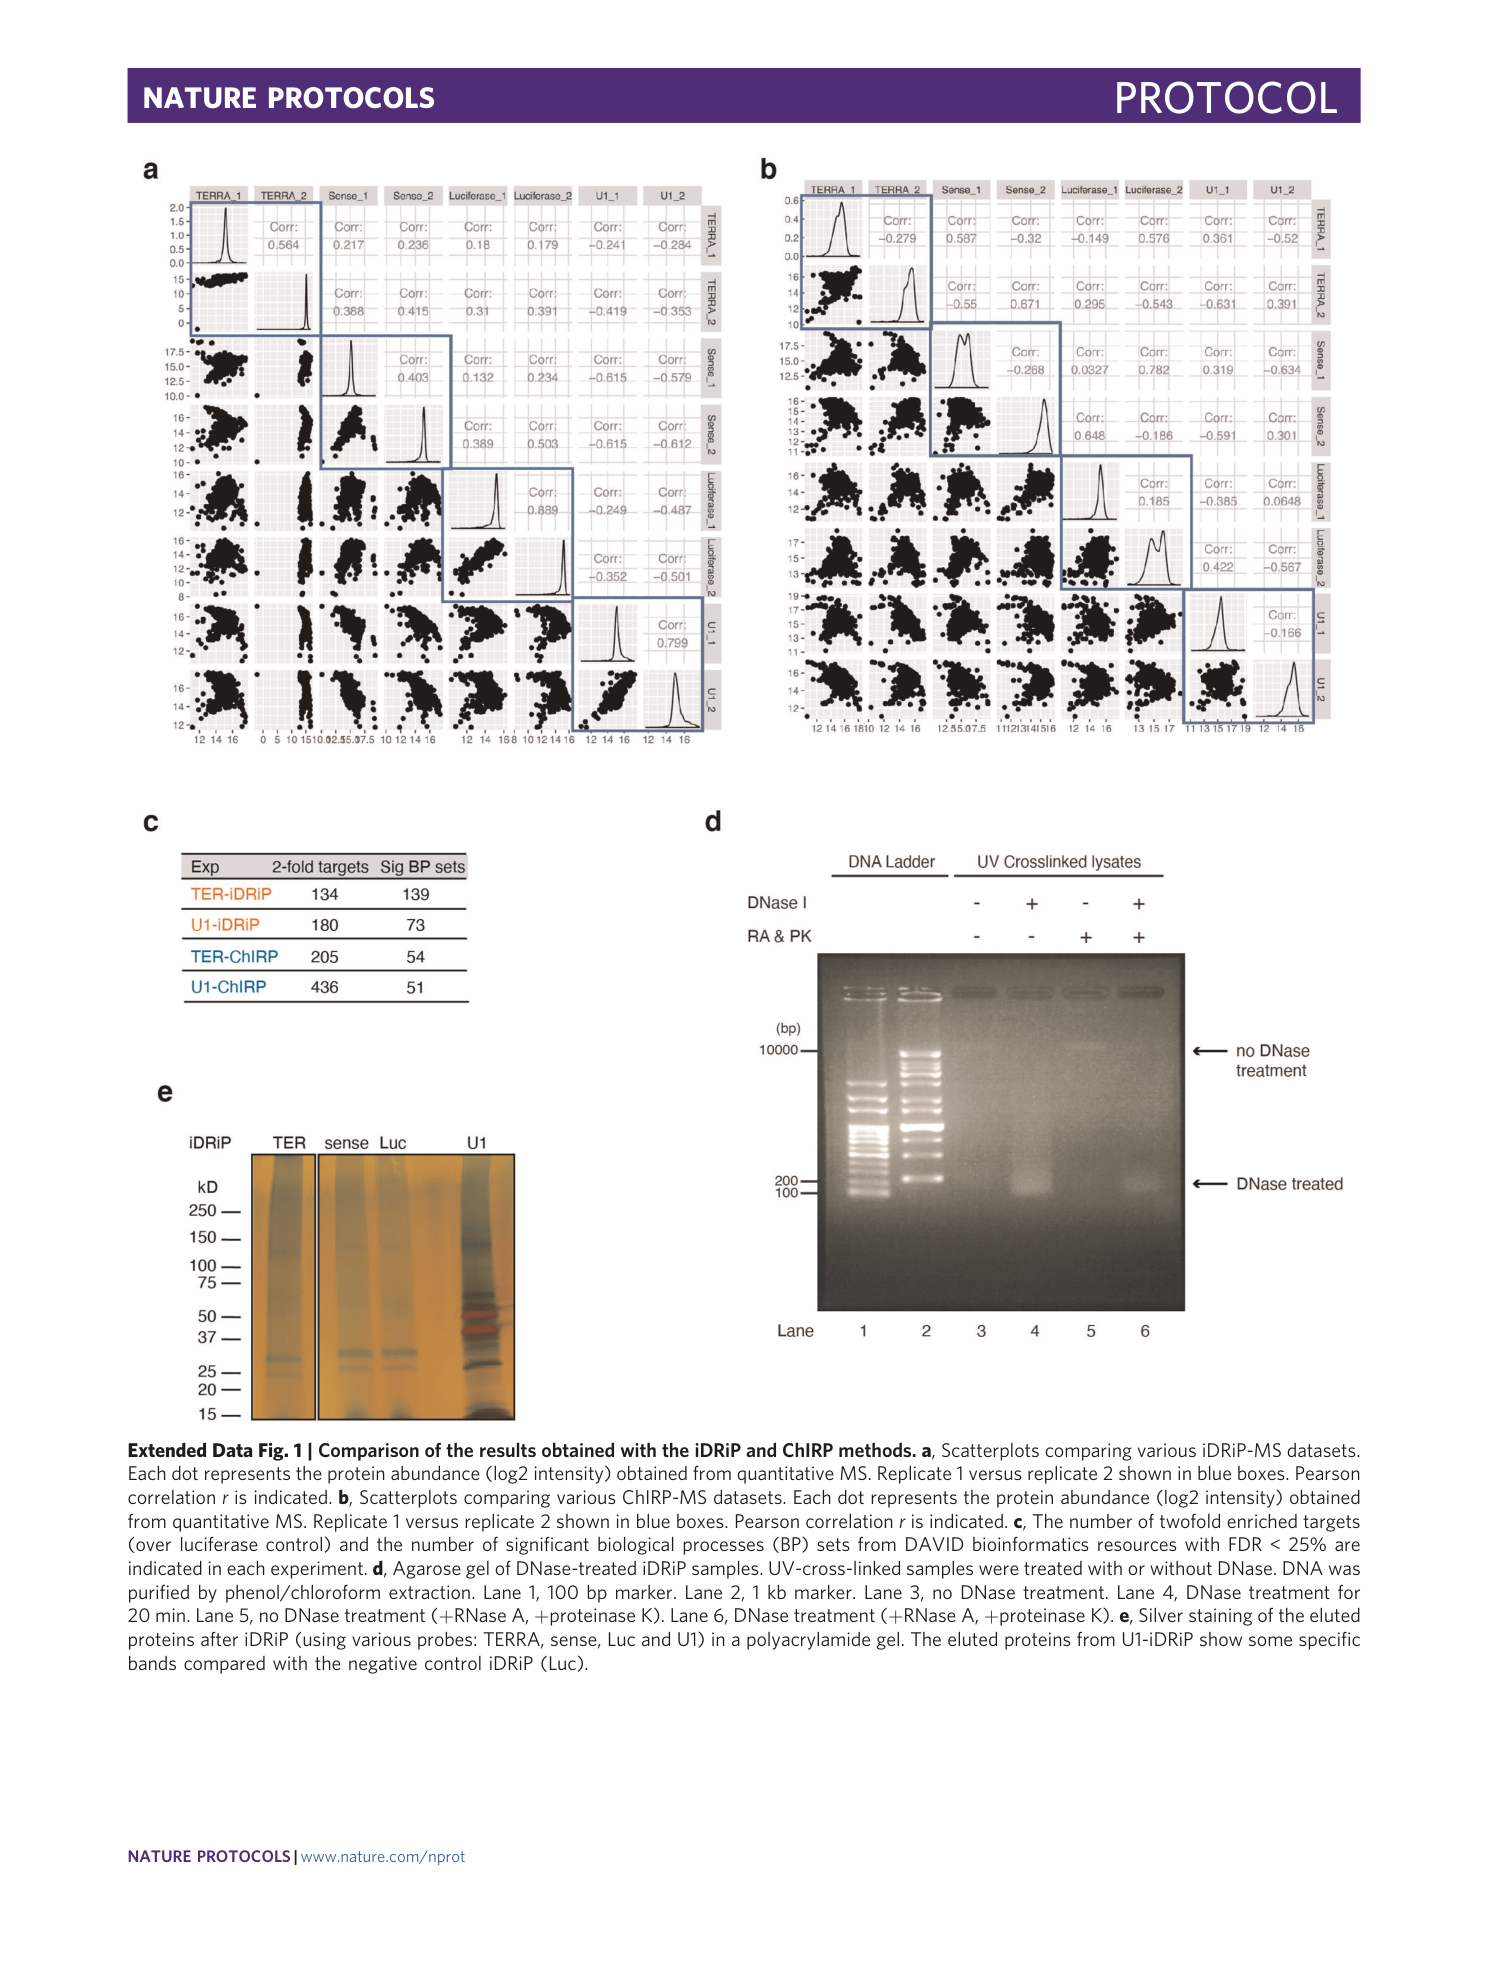
Extended Data Fig. 1 Comparison of the results obtained with the iDRiP and ChIRP methods.
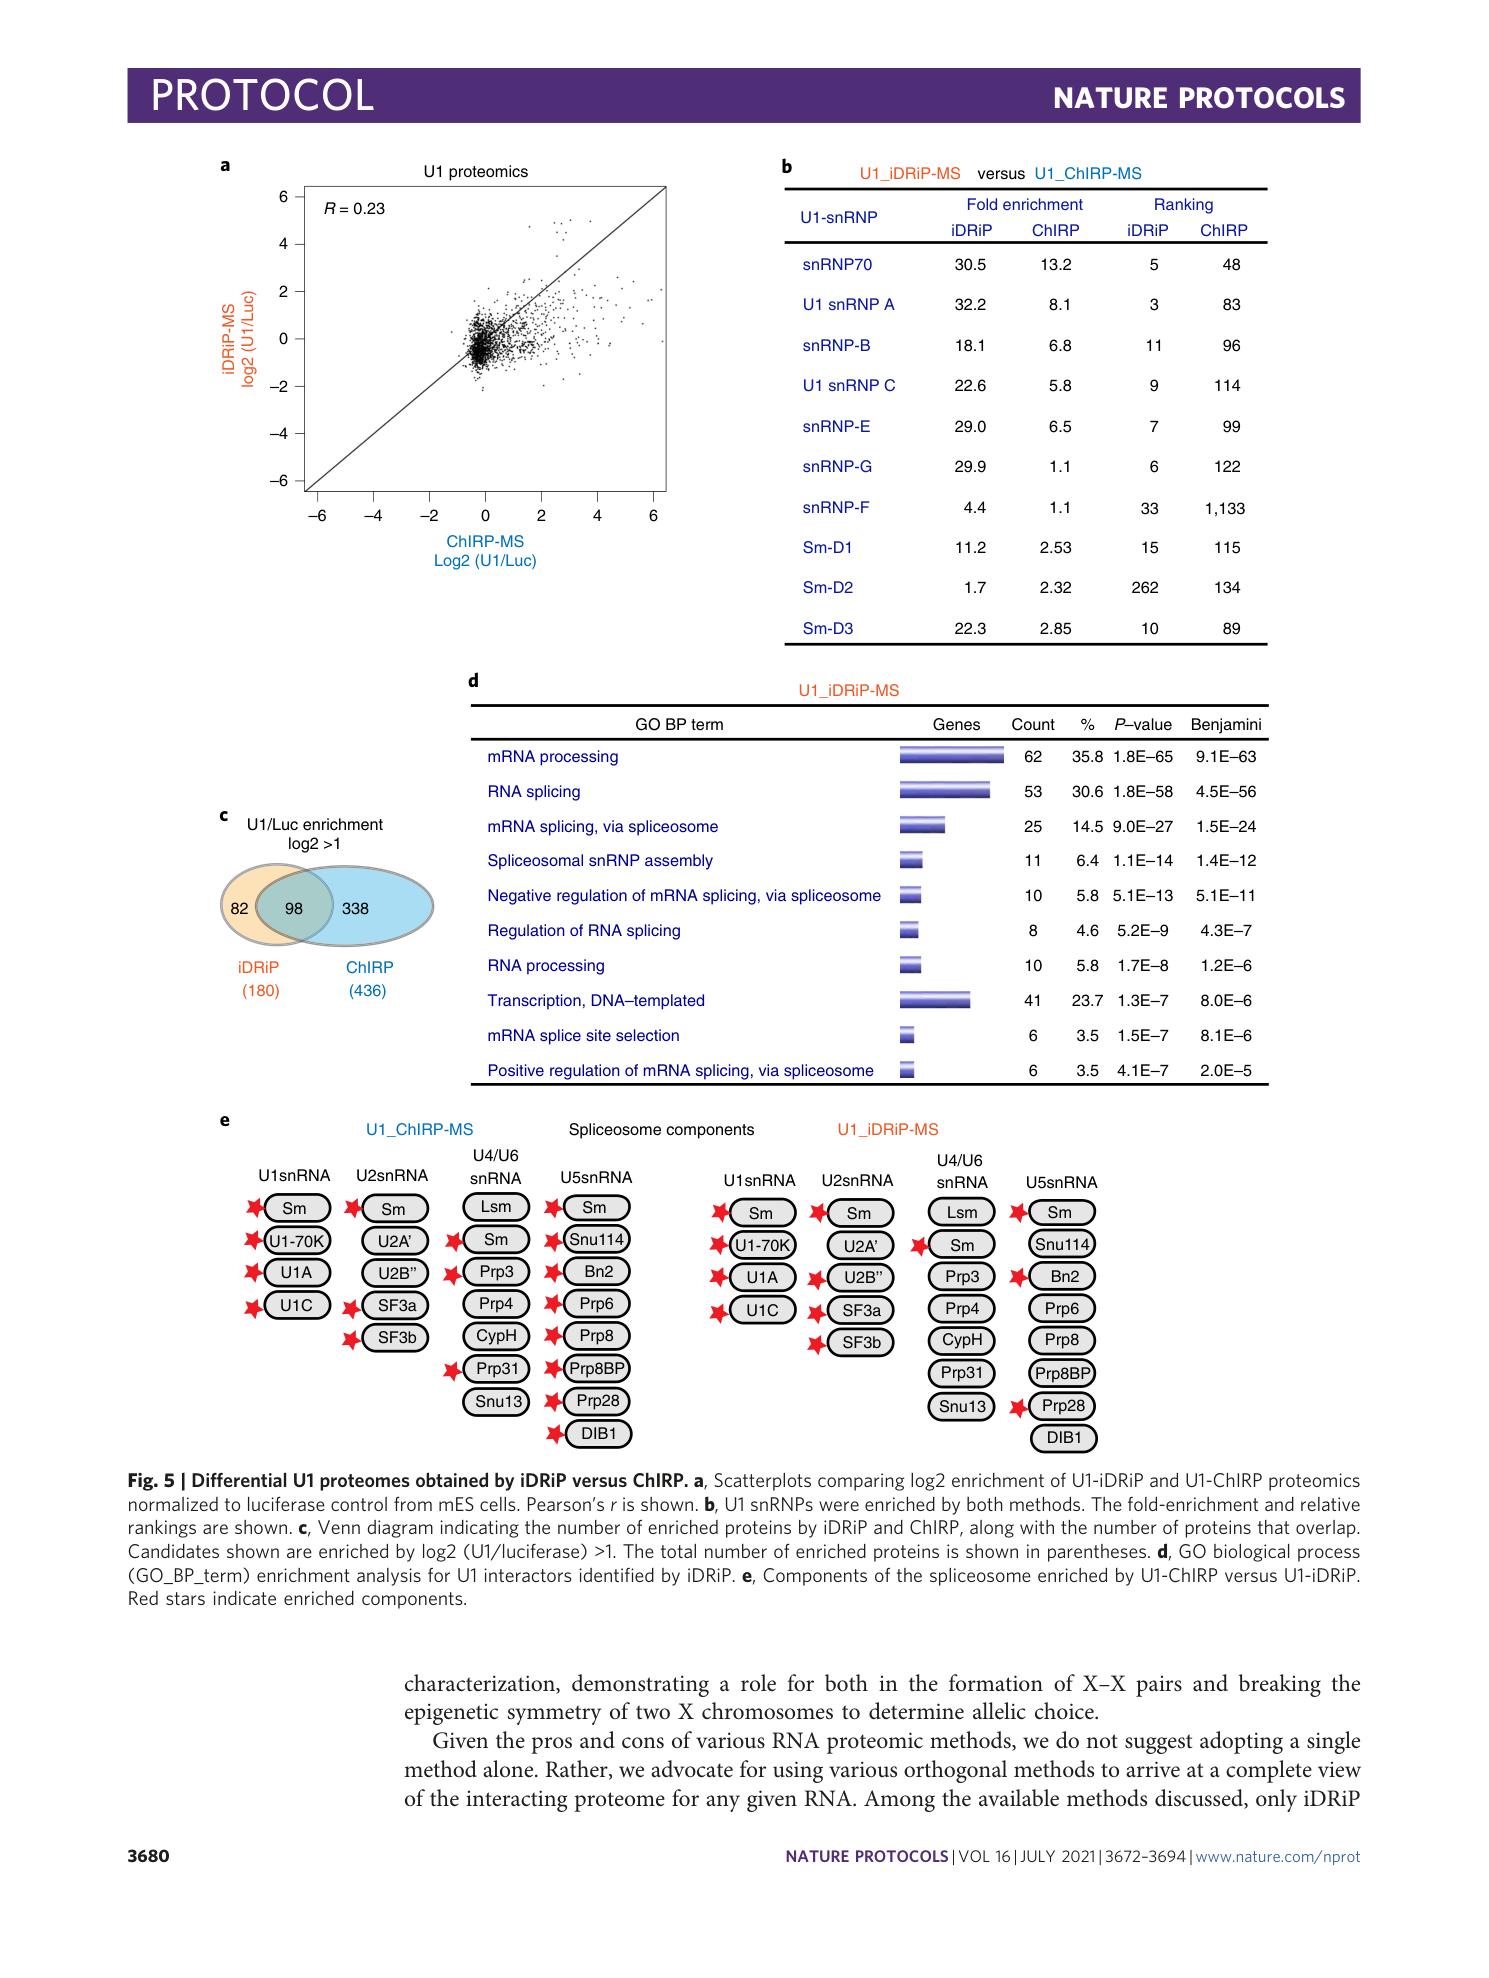
a , Scatterplots comparing various iDRiP-MS datasets. Each dot represents the protein abundance (log2 intensity) obtained from quantitative MS. Replicate 1 versus replicate 2 shown in blue boxes. Pearson correlation r is indicated. b , Scatterplots comparing various ChIRP-MS datasets. Each dot represents the protein abundance (log2 intensity) obtained from quantitative MS. Replicate 1 versus replicate 2 shown in blue boxes. Pearson correlation r is indicated. c , The number of twofold enriched targets (over luciferase control) and the number of significant biological processes (BP) sets from DAVID bioinformatics resources with FDR < 25% are indicated in each experiment. d , Agarose gel of DNase-treated iDRiP samples. UV-cross-linked samples were treated with or without DNase. DNA was purified by phenol/chloroform extraction. Lane 1, 100 bp marker. Lane 2, 1 kb marker. Lane 3, no DNase treatment. Lane 4, DNase treatment for 20 min. Lane 5, no DNase treatment (+RNase A, +proteinase K). Lane 6, DNase treatment (+RNase A, +proteinase K). e , Silver staining of the eluted proteins after iDRiP (using various probes: TERRA, sense, Luc and U1) in a polyacrylamide gel. The eluted proteins from U1-iDRiP show some specific bands compared with the negative control iDRiP (Luc).
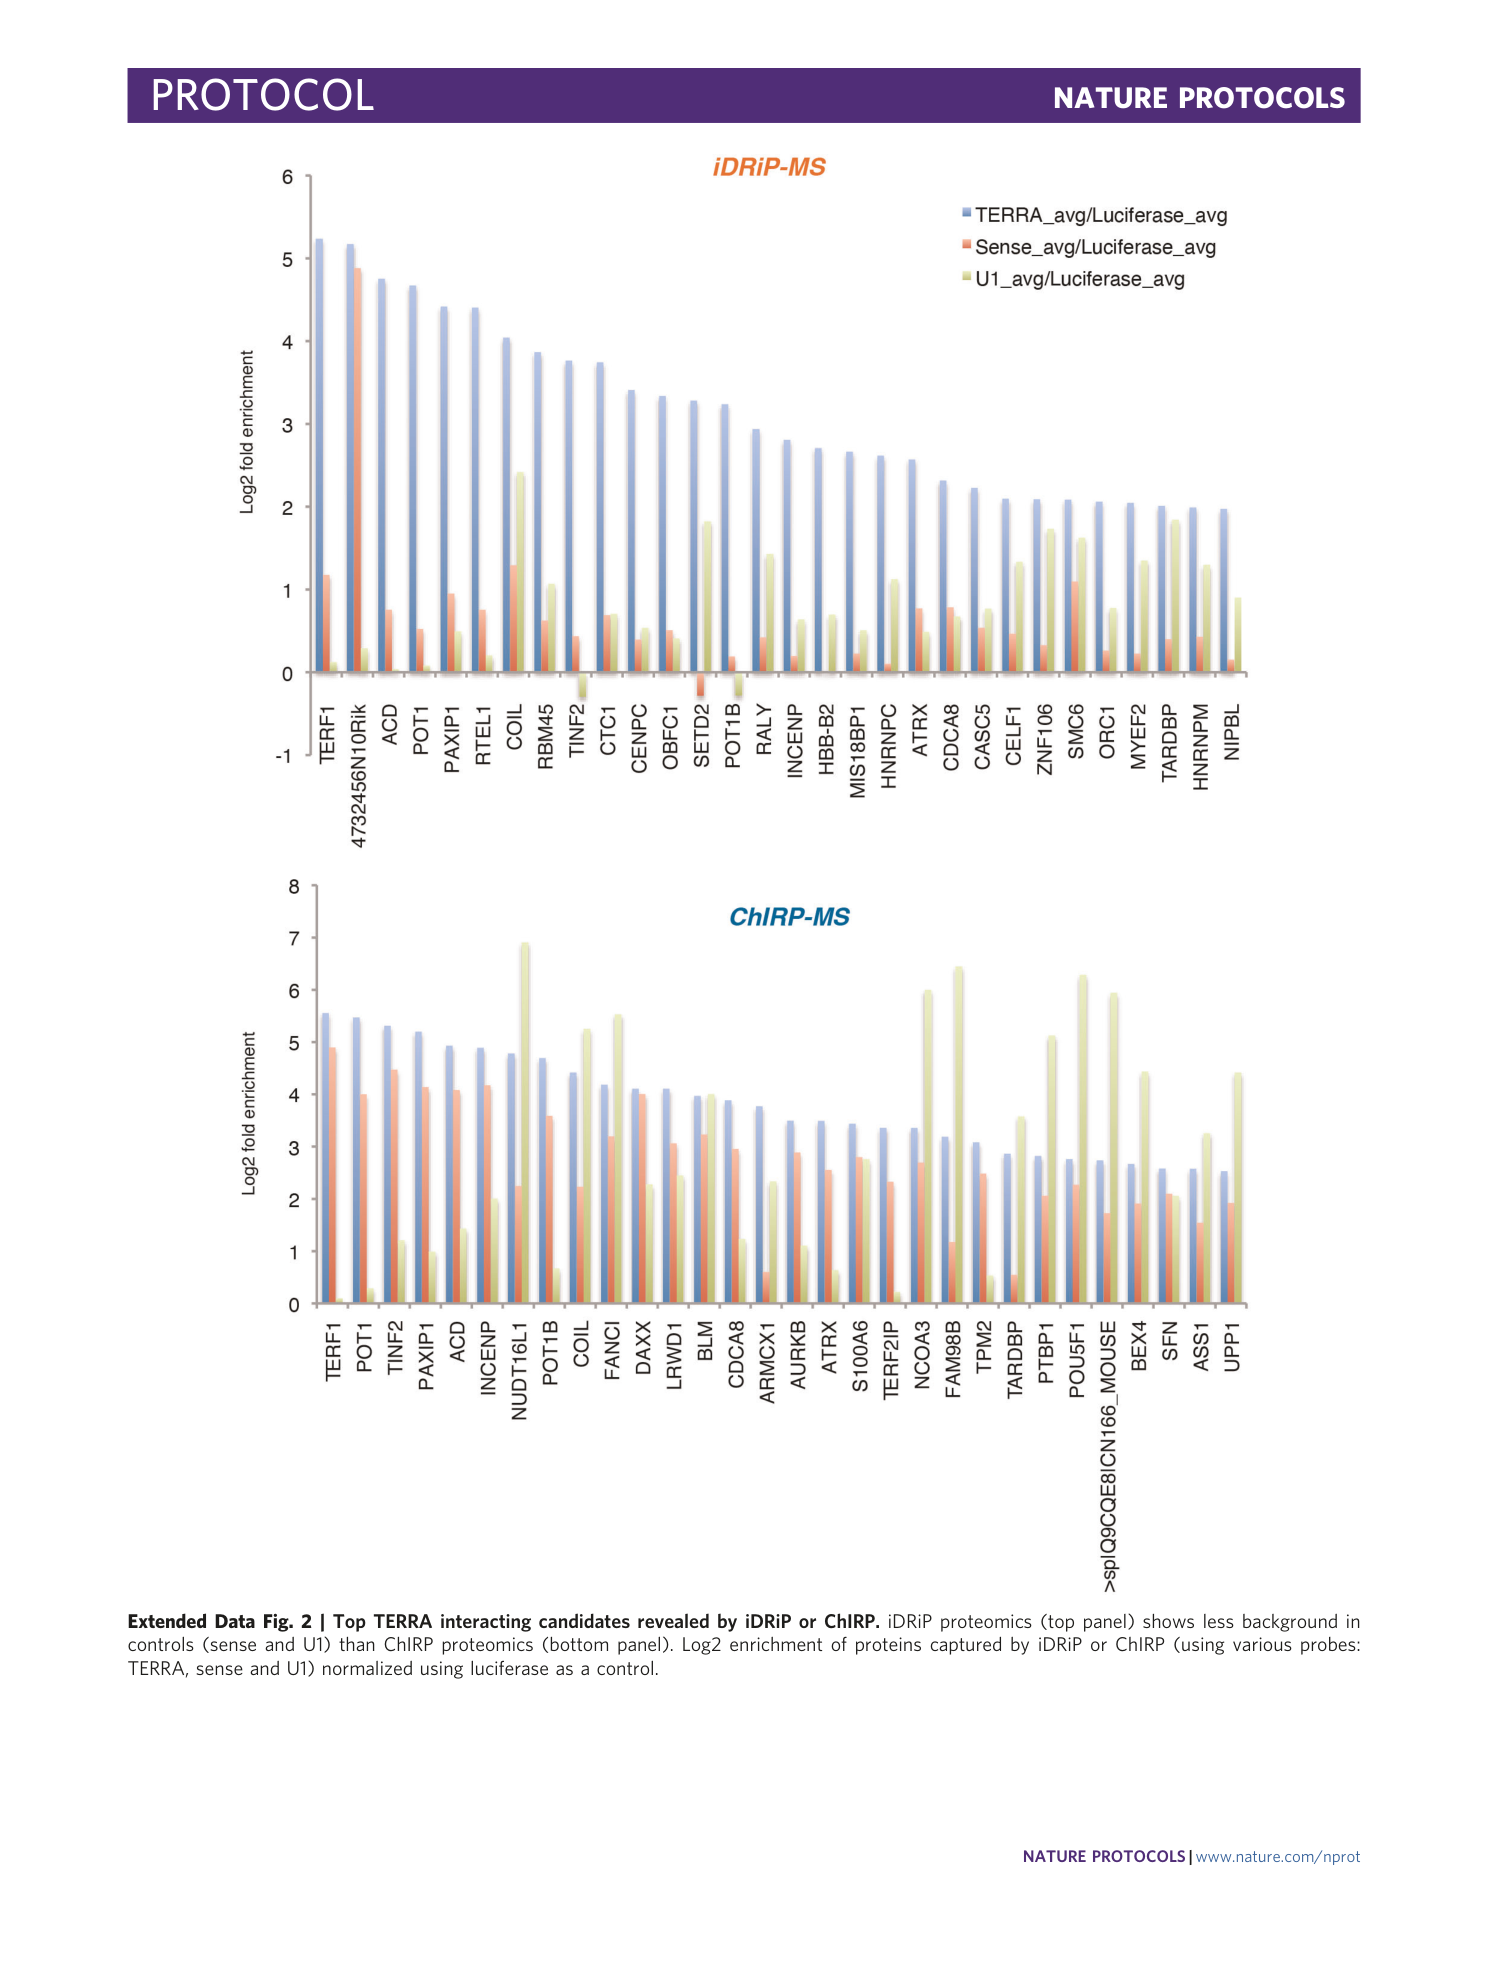
Extended Data Fig. 2 Top TERRA interacting candidates revealed by iDRiP or ChIRP.
iDRiP proteomics (top panel) shows less background in controls (sense and U1) than ChIRP proteomics (bottom panel). Log2 enrichment of proteins captured by iDRiP or ChIRP (using various probes: TERRA, sense and U1) normalized using luciferase as a control.
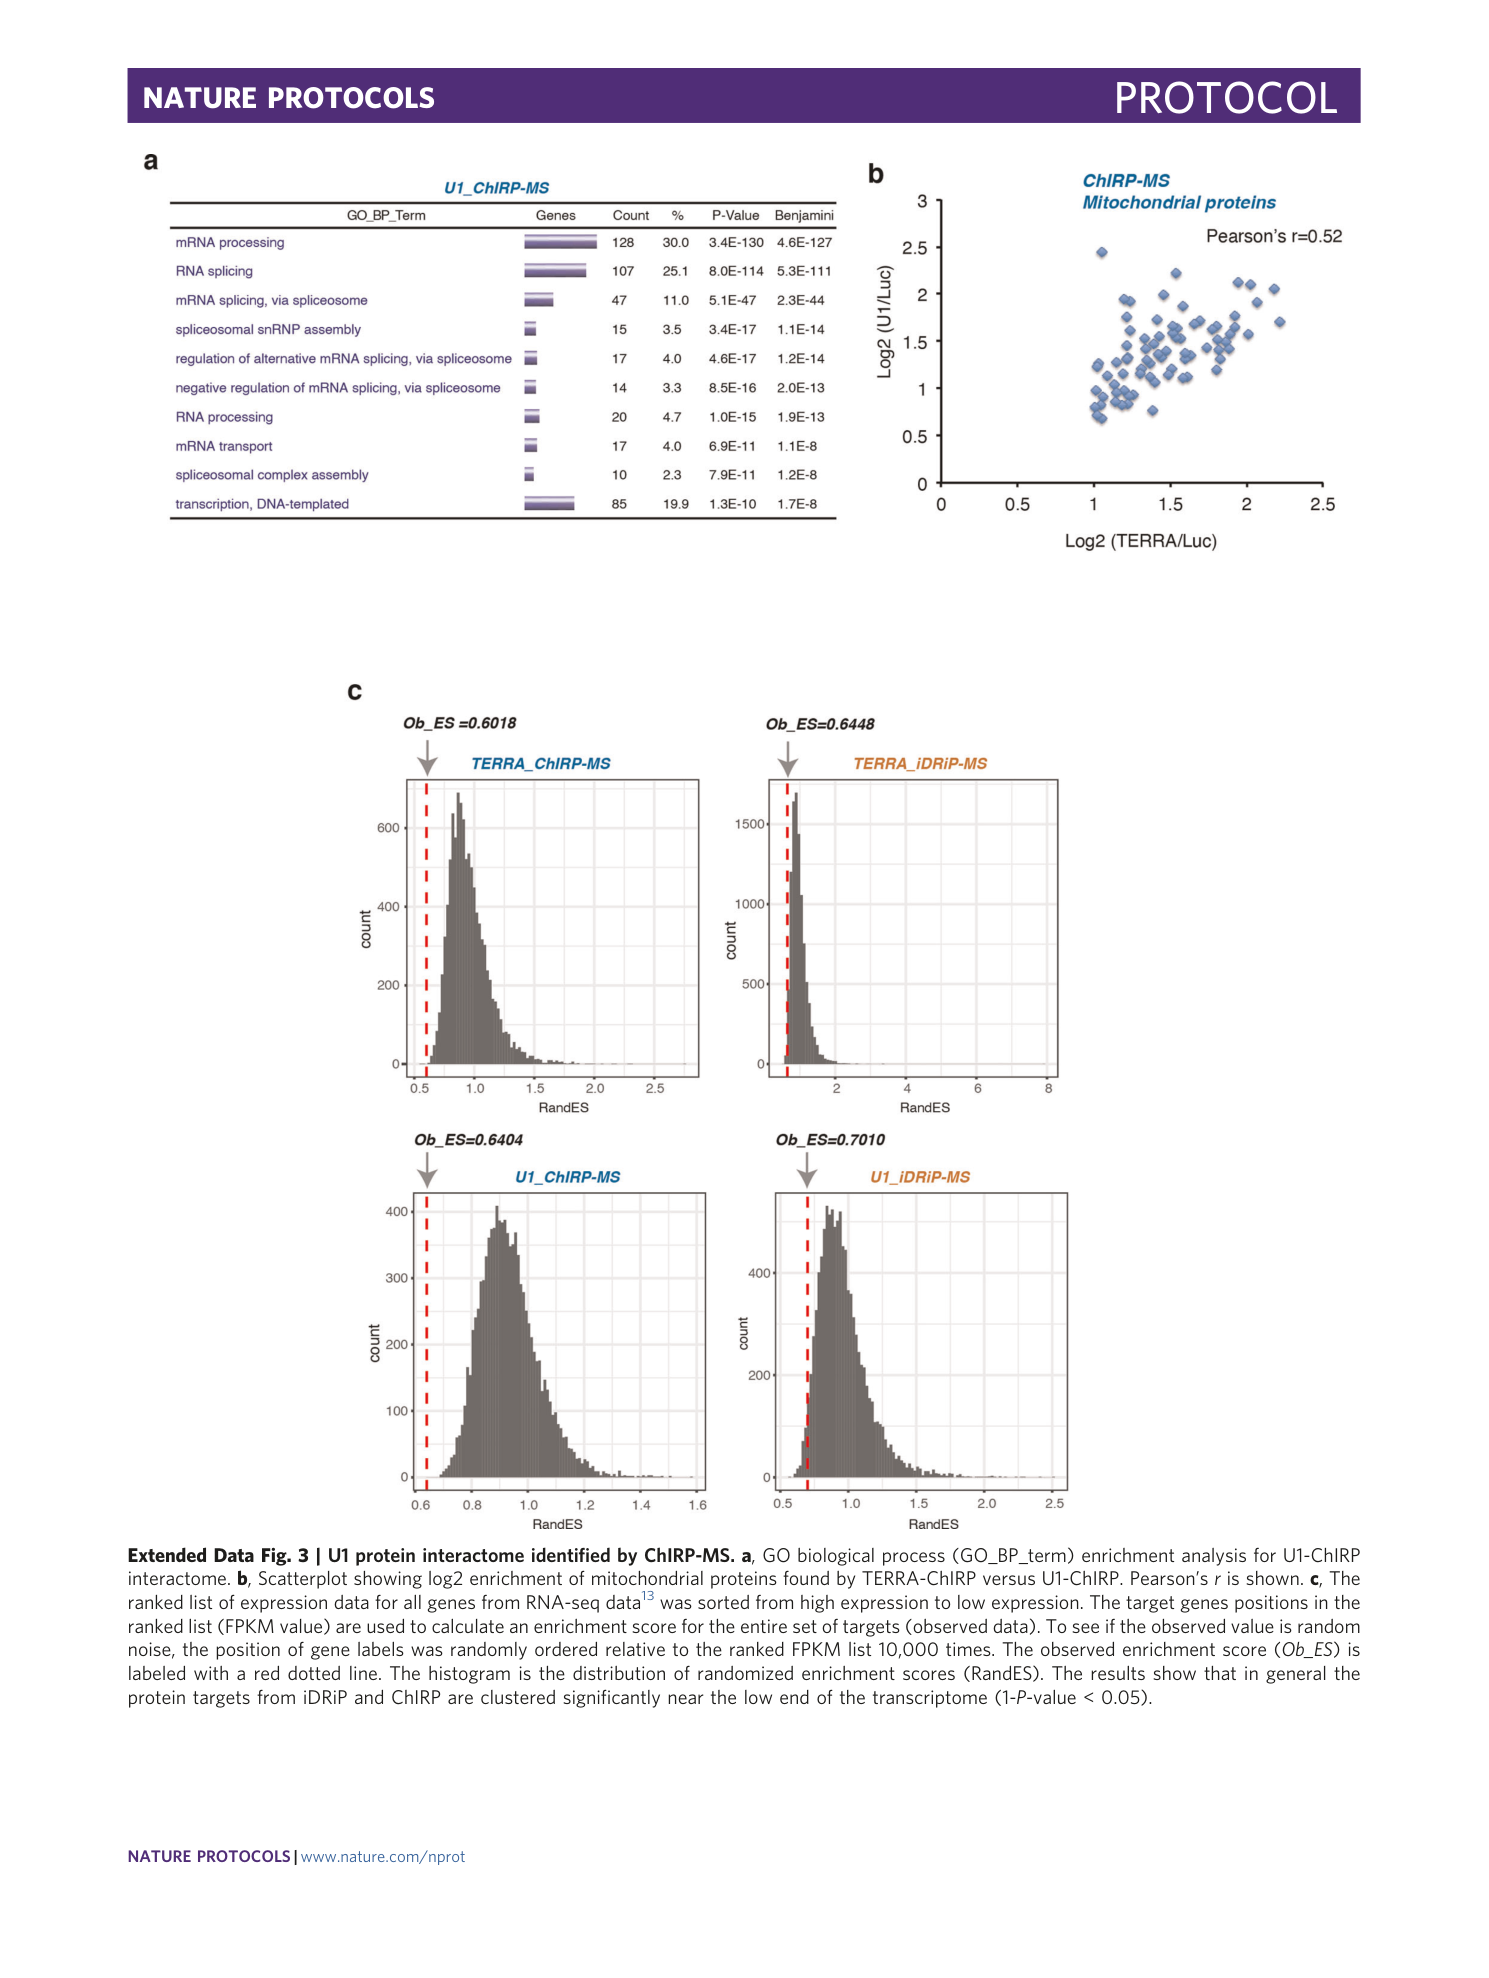
Extended Data Fig. 3 U1 protein interactome identified by ChIRP-MS.
a , GO biological process (GO_BP_term) enrichment analysis for U1-ChIRP interactome. b , Scatterplot showing log2 enrichment of mitochondrial proteins found by TERRA-ChIRP versus U1-ChIRP. Pearson’s r is shown. c , The ranked list of expression data for all genes from RNA-seq data 13 was sorted from high expression to low expression. The target genes positions in the ranked list (FPKM value) are used to calculate an enrichment score for the entire set of targets (observed data). To see if the observed value is random noise, the position of gene labels was randomly ordered relative to the ranked FPKM list 10,000 times. The observed enrichment score ( Ob_ES ) is labeled with a red dotted line. The histogram is the distribution of randomized enrichment scores (RandES). The results show that in general the protein targets from iDRiP and ChIRP are clustered significantly near the low end of the transcriptome (1- P -value < 0.05).
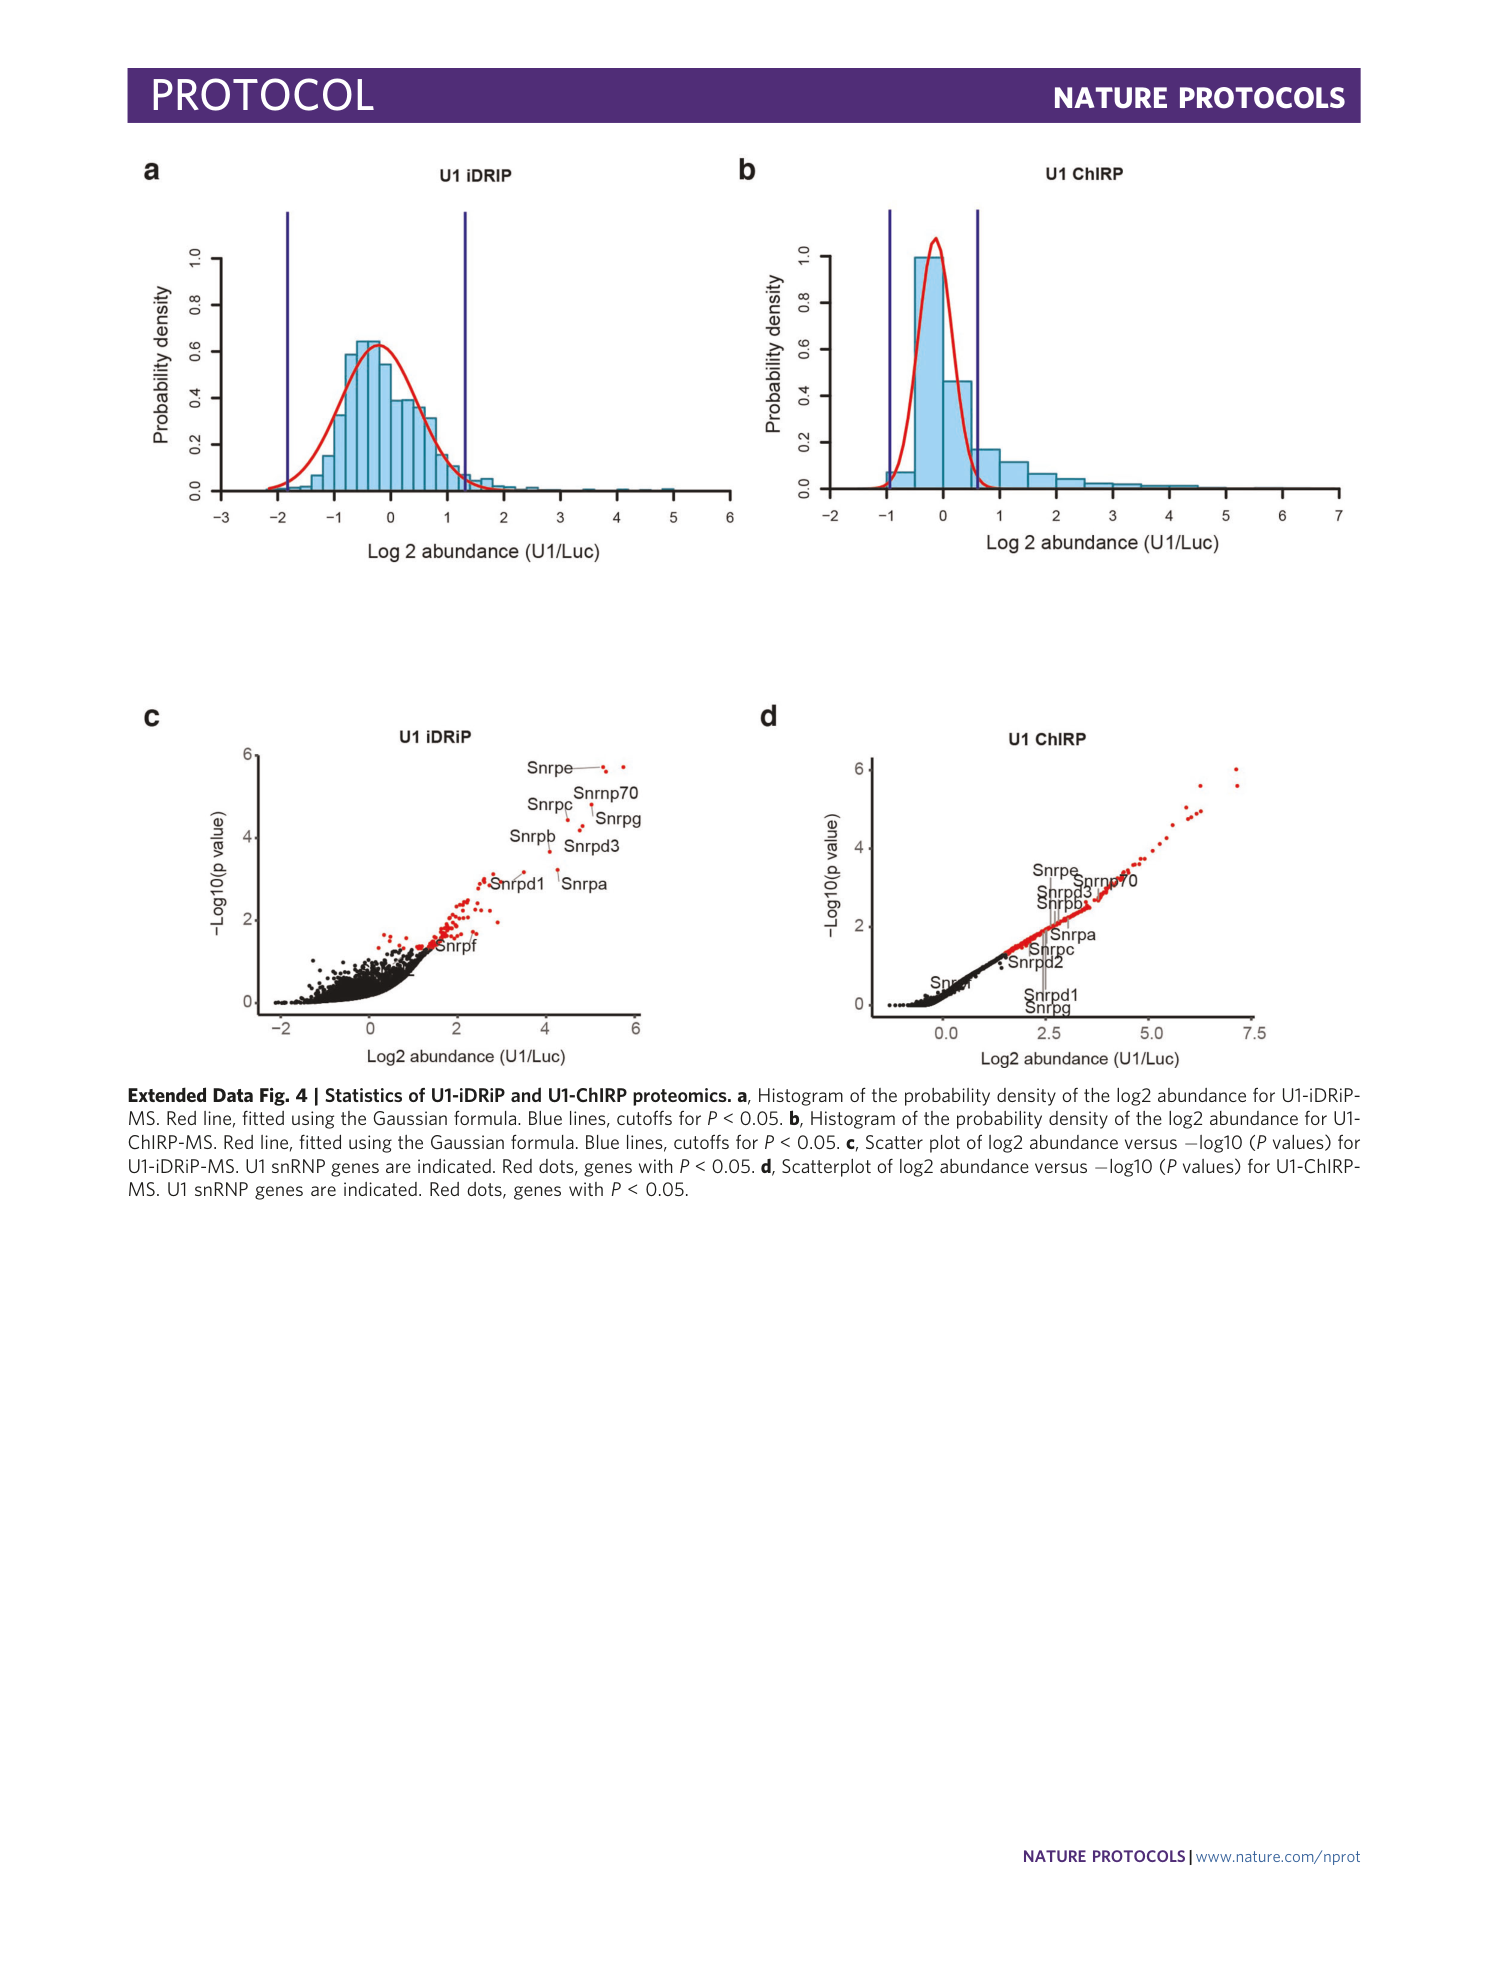
Extended Data Fig. 4 Statistics of U1-iDRiP and U1-ChIRP proteomics.
a , Histogram of the probability density of the log2 abundance for U1-iDRiP-MS. Red line, fitted using the Gaussian formula. Blue lines, cutoffs for P < 0.05. b , Histogram of the probability density of the log2 abundance for U1-ChIRP-MS. Red line, fitted using the Gaussian formula. Blue lines, cutoffs for P < 0.05. c , Scatter plot of log2 abundance versus −log10 ( P values) for U1-iDRiP-MS. U1 snRNP genes are indicated. Red dots, genes with P < 0.05. d , Scatterplot of log2 abundance versus −log10 ( P values) for U1-ChIRP-MS. U1 snRNP genes are indicated. Red dots, genes with P < 0.05.
Supplementary information
Supplementary Information
Supplementary Methods.
Supplementary Table 1
TERRA-iDRiP-MS enrichment table . The protein intensities after TERRA-iDRiP-MS analysis.
Supplementary Table 2
TERRA-ChIRP-MS enrichment table . The protein intensities after TERRA-ChIRP-MS analysis.
Supplementary Table 3
U1-iDRiP-MS enrichment table . The protein intensities after U1-iDRiP-MS analysis.
Supplementary Table 4
U1-ChIRP-MS enrichment table . The protein intensities after U1-ChIRP-MS analysis.
Supplementary Table 5
Statistics for U1-iDRiP-MS using the fitting curve method . The log2 enrichments of two biological replicates of U1-iDRiP-MS were averaged and p values and FDR were calculated by fitting a normal distribution.
Supplementary Table 6
Statistics for U1-ChIRP-MS using the fitting curve method . The log2 enrichments of two biological replicates of U1-ChIRP-MS were averaged and p values and FDR were calculated by fitting a normal distribution.
Supplementary Table 7
Statistics for U1-iDRiP-MS by rank product method . Analysis of p values for two biological replicates of U1-iDRiP-MS using the rank product method.
Supplementary Table 8
Statistics for U1-ChIRP-MS by rank product method . Analysis of p values for two biological replicates of U1-ChIRP-MS using the rank product method.
