Transplantation of intestinal organoids into a mouse model of colitis
Satoshi Watanabe, Sakurako Kobayashi, Nobuhiko Ogasawara, Ryuichi Okamoto, Tetsuya Nakamura, Mamoru Watanabe, Kim B. Jensen, Shiro Yui
Extended
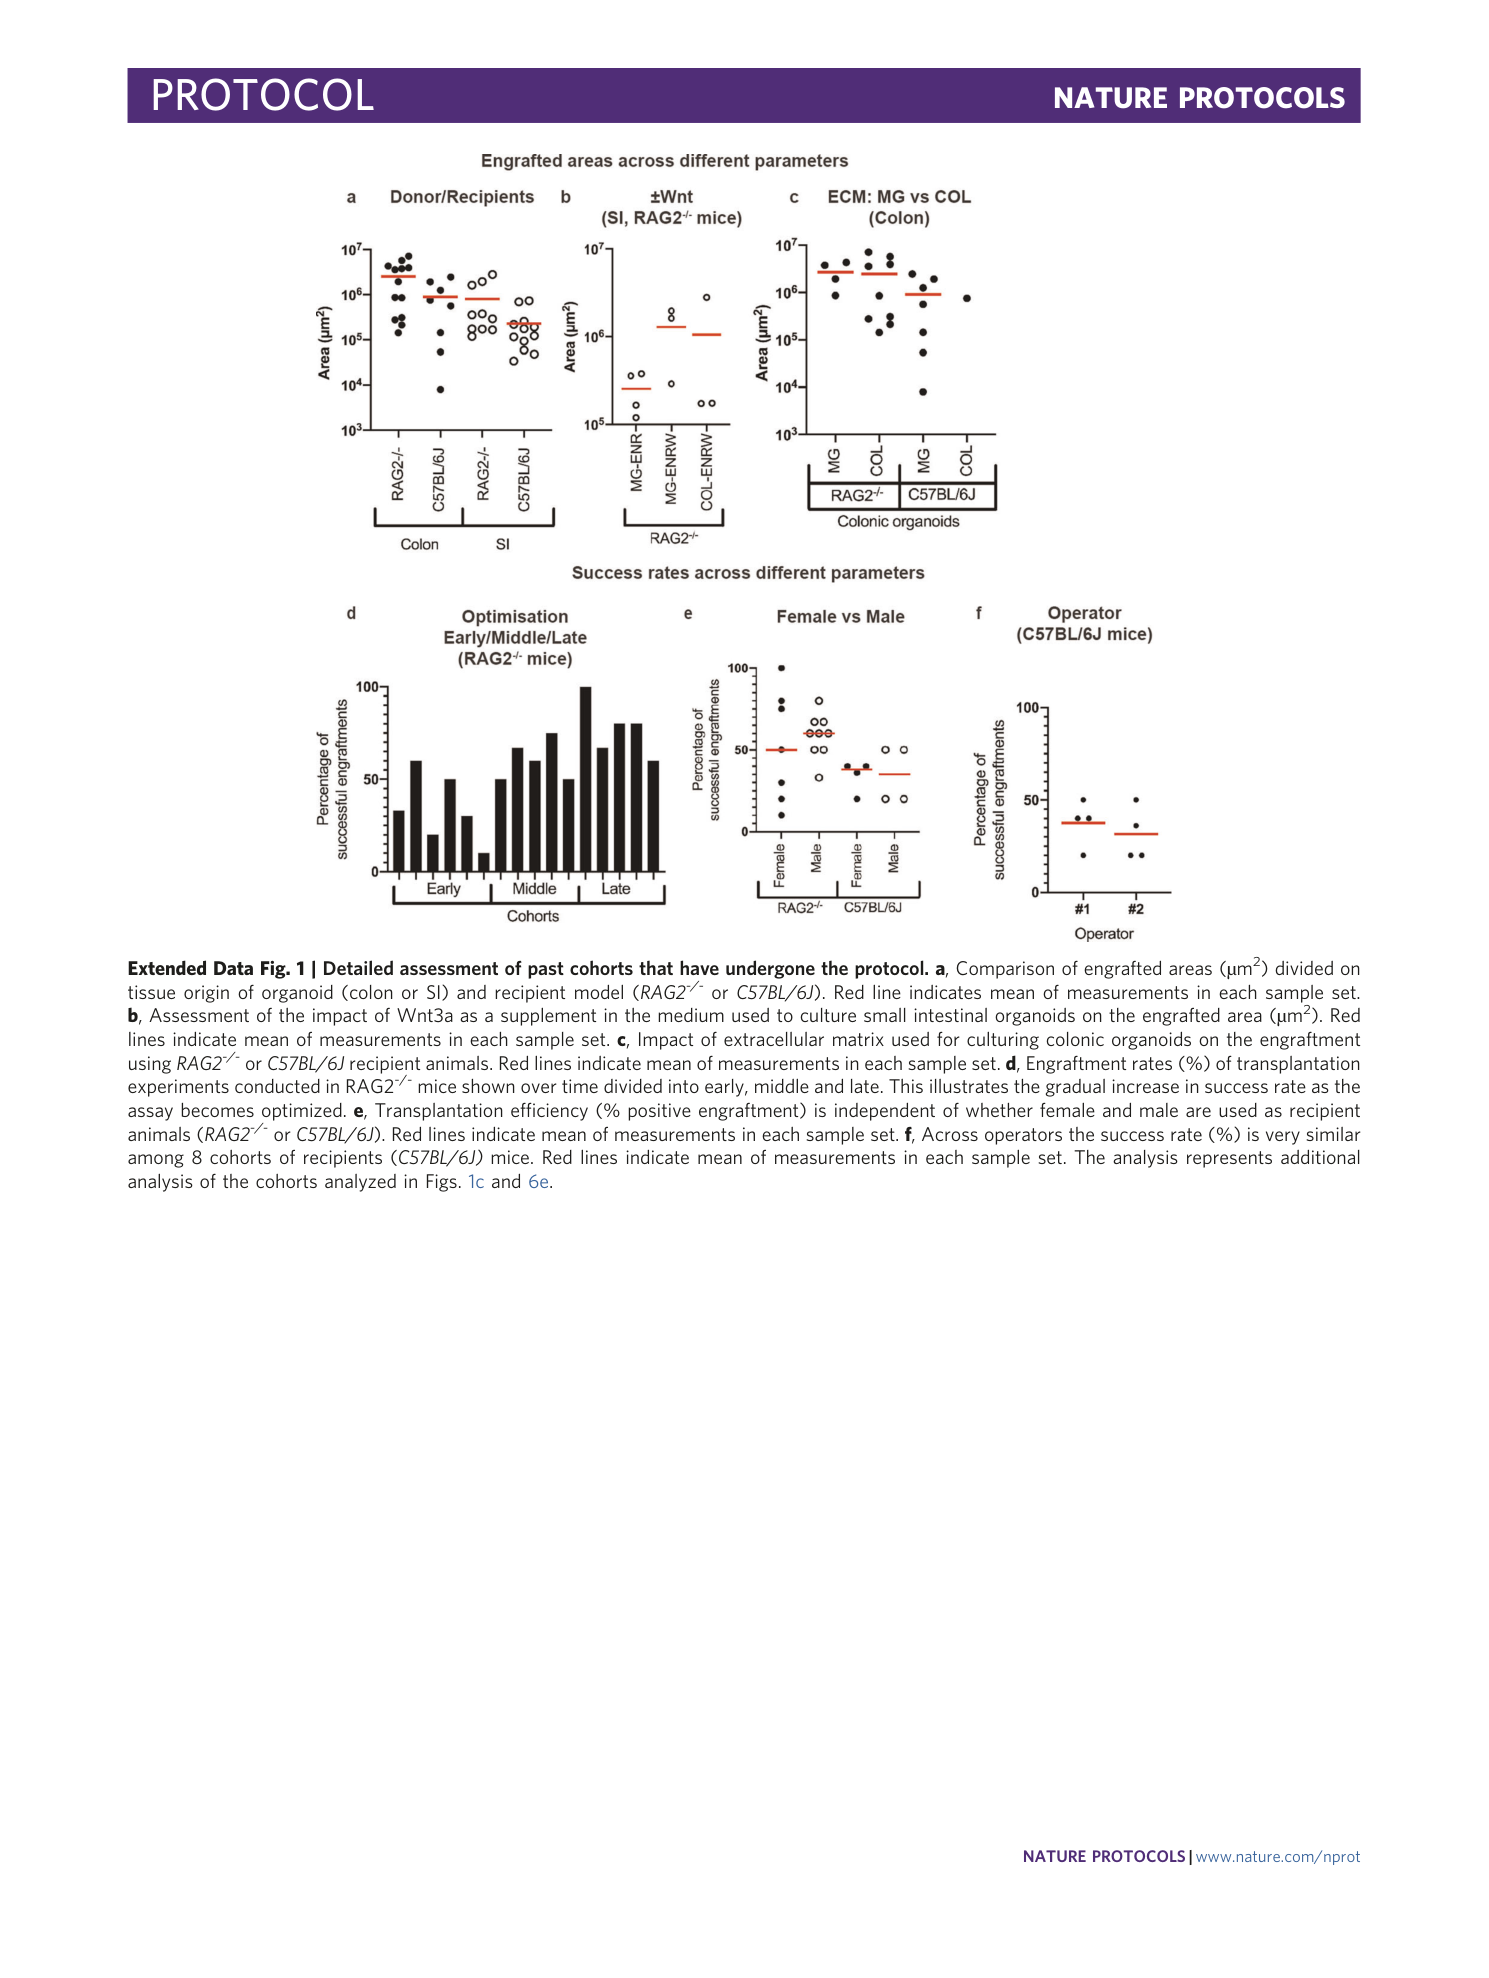
Extended Data Fig. 1 Detailed assessment of past cohorts that have undergone the protocol.
a , Comparison of engrafted areas (µm 2 ) divided on tissue origin of organoid (colon or SI) and recipient model ( RAG2 -/- or C57BL/6J ). Red line indicates mean of measurements in each sample set. b , Assessment of the impact of Wnt3a as a supplement in the medium used to culture small intestinal organoids on the engrafted area (µm 2 ). Red lines indicate mean of measurements in each sample set. c , Impact of extracellular matrix used for culturing colonic organoids on the engraftment using RAG2 -/- or C57BL/6J recipient animals. Red lines indicate mean of measurements in each sample set. d , Engraftment rates (%) of transplantation experiments conducted in RAG2 -/- mice shown over time divided into early, middle and late. This illustrates the gradual increase in success rate as the assay becomes optimized. e , Transplantation efficiency (% positive engraftment) is independent of whether female and male are used as recipient animals ( RAG2 -/- or C57BL/6J ). Red lines indicate mean of measurements in each sample set. f , Across operators the success rate (%) is very similar among 8 cohorts of recipients ( C57BL/6J) mice. Red lines indicate mean of measurements in each sample set. The analysis represents additional analysis of the cohorts analyzed in Figs. 1c and 6e .
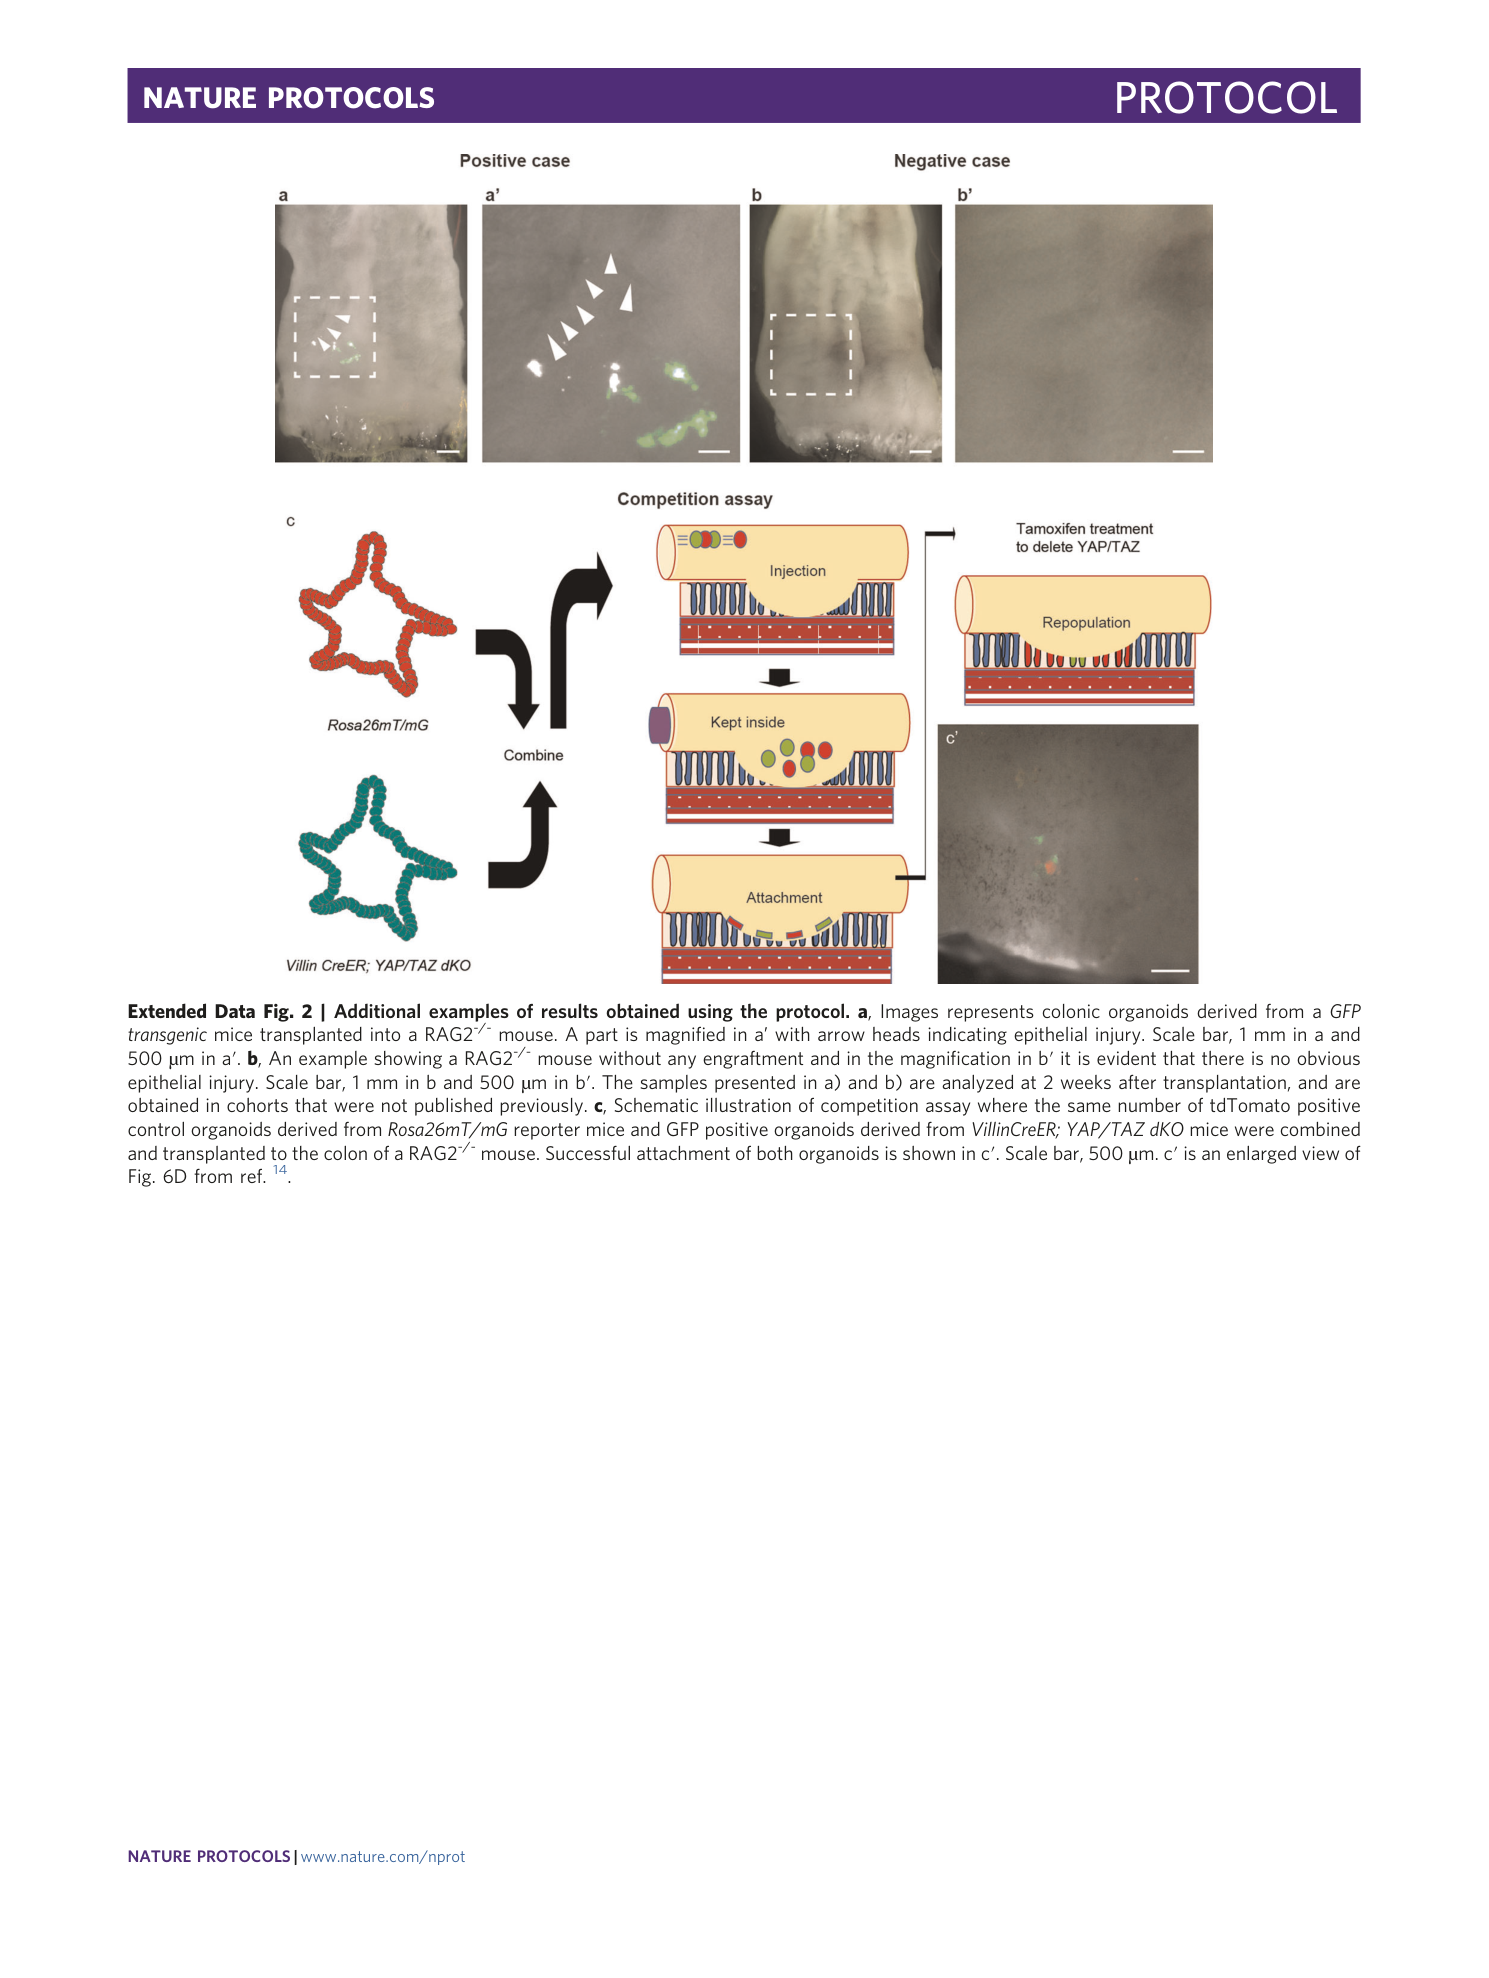
Extended Data Fig. 2 Additional examples of results obtained using the protocol.
a , Images represents colonic organoids derived from a GFP transgenic mice transplanted into a RAG2 -/- mouse. A part is magnified in a’ with arrow heads indicating epithelial injury. Scale bar, 1 mm in a and 500 µm in a′. b , An example showing a RAG2 -/- mouse without any engraftment and in the magnification in b′ it is evident that there is no obvious epithelial injury. Scale bar, 1 mm in b and 500 µm in b′. The samples presented in a) and b) are analyzed at 2 weeks after transplantation, and are obtained in cohorts that were not published previously. c , Schematic illustration of competition assay where the same number of tdTomato positive control organoids derived from Rosa26mT/mG reporter mice and GFP positive organoids derived from VillinCreER; YAP/TAZ dKO mice were combined and transplanted to the colon of a RAG2 -/- mouse. Successful attachment of both organoids is shown in c′. Scale bar, 500 µm. c′ is an enlarged view of Fig. 6D from ref. 14 .
Supplementary information
Supplementary Video 1
Anal infusion of a suspension of organoid fragments
Supplementary Video 2
Retraction of catheter and temporary closing of anus
Supplementary Data
Details of past cohorts, organoid sizes and areas of engraftment.
