Massively Parallel Sequencing of the Mitogenome from Human Hair Shafts in Forensic Investigations
Jade T. Korber, Jade T. Korber, Lauren C. Canale, Lauren C. Canale, Mitchell M. Holland, Mitchell M. Holland
Abstract
This article highlights methods used to perform DNA extraction, mitochondrial DNA quantification, multiplex PCR amplification, amplicon-based massively parallel sequencing, and data analysis of the mitochondrial genome (mitogenome) from human hair shafts. The focus is on applications to forensic casework, but this set of protocols can be used for any purpose involving small cuttings (as small as 1 to 5 mm) of human hair shafts up to 40 years from the time of collection. © 2023 The Authors. Current Protocols published by Wiley Periodicals LLC.
Basic Protocol 1 : Extraction of mitochondrial DNA from human hair shafts
Basic Protocol 2 : Quantification of mitochondrial DNA (copies/μl)
Basic Protocol 3 : Multiplex amplification of the mitogenome
Basic Protocol 4 : Library preparation and sequencing of mitogenome amplicons
Basic Protocol 5 : Data analysis of mitogenome haplotypes
INTRODUCTION
The aim of this article is to provide a set of protocols for routine analysis of the mitochondrial genome (mitogenome) sequence from small fragments of human hair shafts (as small as 1 to 5 mm). The following protocols and discussion will assist the practitioner in the effective extraction of DNA from hair, accurate quantification of the mitochondrial DNA (mtDNA) copies recovered, amplification of the mitogenome in small pieces using a multiplex approach, massively parallel sequencing (MPS), and data analysis using software specifically designed to report phylogenetically accurate mito-haplotypes. Basic Protocol 1 provides a superior method for the routine extraction of mtDNA from as little as 1 mm of hair shaft. Basic Protocol 2 provides a reliable, custom quantification assay to assess the number of mtDNA copies per unit volume in the DNA extract. Readers should refer to Canale et al. (2021) for a review of mitogenome MPS analysis. Basic Protocol 3 provides a method for PCR amplification conditions and parameters for the entire mitogenome in a single multiplex commercially available from Promega. Basic Protocol 4 provides a method for library preparation of the amplicons for sequence analysis (commercially available from Promega) on the MiSeq instrument (Illumina). Basic Protocol 5 provides the settings and parameters for a software program for the analysis of mtDNA sequence data and interpretation for use in forensic casework (GeneMarker® HTS, commercially available from SoftGenetics). Readers should refer to Canale et al. (2022) for research findings associated with mitogenome MPS analysis of small fragments of human hair shafts using these five basic protocols.
NOTE : Appropriate informed consent is necessary for obtaining and use of human study material, when applicable.
NOTE : Experiments involving PCR require extremely careful technique to prevent contamination.
Basic Protocol 1: EXTRACTION OF MITOCHONDRIAL DNA FROM HUMAN HAIR SHAFTS
There are several commercial kits available for DNA extraction, with various applications and proprietary reagents. For best results with hair shafts, this protocol combines both the Applied Biosystems PrepFiler™ Forensic DNA Extraction Kit and the Qiagen QiaAmp® DNA Investigator Kit, as recommended by Gallimore et al. (2018). The QiaAmp® protocol is followed for the digestion and lysis portion of the extraction (dissolving of the hair fragment in the lysis solution), and the PrepFiler™ protocol is used for purification of the extract. A 2-cm cutting of hair is recommended, but whole mitogenome sequences can be obtained from as little as 1 mm of rootless hair (Canale et al., 2022). The following extraction protocol is robust, routinely resulting in >4000 mtDNA copies/µl from 5-mm hair cuttings. The protocol also describes a cleaning procedure for hair fragments prior to extraction. The resulting extract can then be quantified, amplified, and sequenced (see Basic Protocols 2 to 4).
Materials
-
10% (v/v) commercial bleach (7 mM sodium hypochlorite solution)
-
70% (v/v) ethanol (EtOH; Decon Labs, cat. no. 64-17-5) or deionized water
-
Human hair sample(s), ≥1 mm
-
5% (w/v) Terg-a-zyme (Alconox, cat. no. 1304-1)
-
100% EtOH, 200 proof (molecular grade; VWR, cat. no. 71006-012)
-
Molecular-grade water (Thermo Fisher Scientific, cat. no. 10977023)
-
Qiagen® Buffer ATL (Qiagen, cat. no. 939011)
-
1.0 M dithiothreitol (DTT; Promega, cat. no. V3151)
-
20 mg/ml proteinase K (Thermo Fisher Scientific, cat. no. AM2546; make fresh)
-
Qiagen® Buffer AL (Qiagen, cat. no. 19075)
-
PrepFiler™ Forensic DNA Extraction Kit (Thermo Fisher Scientific, cat. no. 4463351), containing PrepFiler™ Magnetic Particles, Wash Buffers A and B, and Elution Buffer
-
Isopropanol, 200 proof (VWR, cat. no. BDH1133-1LP)
-
Dead-air box with UV light source
-
UV Stratalinker (Stratagene, cat. no. 2400)
-
Laboratory tape
-
1.7-ml microcentrifuge tubes (VWR, cat. no. 20170-355)
-
Disposable scalpel (Fisher Scientific, cat. no. 02-688-80)
-
Forceps (Fisher Scientific, cat. no. 22-327379)
-
Sonicating bath (VWR, cat. no. 97043-960)
-
Thermomixer (Eppendorf, cat. no. 5384000020)
-
Mini centrifuge
-
Vortex
-
Magnetic stand (Thermo Fisher Scientific, cat. no. 12321D)
-
1.5-ml LoBind tubes (Eppendorf, cat. no. 022431021)
1.Prepare a dead-air box with a UV light source in which to perform the extraction by decontaminating the working surface with 10% commercial bleach, followed by 70% EtOH or deionized water.
2.Using the UV Stratalinker, irradiate all solutions except proteinase K as well as 1.7-ml microcentrifuge tubes, forceps, and a magnetic stand.
3.Secure human hair sample to a clean surface (e.g., a piece of butcher paper or weigh boat) using laboratory tape.
4.Cut a fragment of hair from 1 mm to 2 cm in length with a clean disposable scalpel.
5.Using UV-irradiated forceps cleaned with 10% bleach followed by 70% EtOH, place hair cutting into a UV-irradiated 1.7-ml microcentrifuge tube containing 1 ml UV-irradiated 5% Terg-a-zyme.
6.Place tube in a sonicating bath for 20 min.
7.Transfer hair cutting, using clean forceps, to a tube containing 1 ml UV-irradiated 100% EtOH. Rotate the tube to cover the hair with EtOH. Perform the EtOH wash in duplicate by transferring the cutting to a second tube containing 1 ml UV-irradiated 100% EtOH.
8.Transfer hair cutting, using sterile forceps, to a tube containing 1 ml UV-irradiated molecular-grade water. Perform the water wash in duplicate by transferring the cutting to a second tube containing 1 ml UV-irradiated molecular-grade water.
9.Place the hair cutting, using clean forceps, into a tube containing 300 µl UV-irradiated Qiagen® Buffer ATL.
10.Integrate an extraction reagent blank by including an extra tube of Qiagen® Buffer ATL without a hair sample.
11.Add 20 µl UV-irradiated 1.0 M DTT to each tube.
12.Add 20 µl freshly prepared 20 mg/ml proteinase K solution to each tube.
13.Incubate the tubes at 56°C with mixing at 900 rpm for 1 hr in a thermomixer.
14.Set thermomixer temperature to 70°C upon removal of tubes.
15.Visually inspect the tubes to verify that the hairs have fully dissolved. If not, incubate tubes for additional time (even overnight) in an attempt to drive the hair into solution.
16.Briefly centrifuge tubes in a mini centrifuge to remove liquid from the lids.
17.Add 300 µl UV-irradiated Qiagen® Buffer AL to each tube and vortex for 10 s.
18.Place tubes in the thermomixer and incubate at 70°C at 900 rpm for 10 min.
19.Remove tubes from thermomixer and briefly centrifuge to remove liquid from the lids.
20.Set thermomixer temperature to 23°C upon removal of tubes.
21.Allow tubes to equilibrate to room temperature (∼5 min) before proceeding.
22.Vortex UV-irradiated PrepFiler™ Magnetic Particles (from the PrepFiler™ Forensic DNA Extraction Kit) for ∼5 s and then centrifuge briefly.
23.Add 15 µl magnetic bead resin to each tube. Vortex at low speed for 10 s.
24.Add 300 µl UV-irradiated isopropanol to each tube and vortex on low speed for 5 s. Centrifuge briefly.
25.Incubate tubes in the thermomixer at 23°C for 10 min at 700 rpm.
26.Remove tubes from thermomixer and set thermomixer temperature to 70°C.
27.Vortex tubes at maximum speed and briefly centrifuge.
28.Place tubes in the UV-irradiated magnetic stand for 1 to 2 min, or until the size of the pellet at the back of each tube stops increasing in size.
29.Remove and discard all visible liquid.
30.Add 600 µl UV-irradiated PrepFiler™ Wash Buffer A to each tube.
31.Vortex at maximum speed for 15 s and briefly centrifuge.
32.Place tubes in magnetic stand for 30 to 60 s.
33.Discard all liquid without disturbing magnetic pellet.
34.Add 300 µl UV-irradiated PrepFiler™ Wash Buffer A to each tube.
35.Vortex at maximum speed for 15 s and briefly centrifuge (approximately 2 to 3 s).
36.Place tubes in magnetic stand for 30 to 60 s.
37.Discard all liquid without disturbing magnetic pellet.
38.Add 300 µl UV-irradiated PrepFiler™ Wash Buffer B to each tube.
39.Vortex at maximum speed for 15 s and briefly centrifuge.
40.Place tubes in magnetic stand for 30 to 60 s.
41.Discard all liquid without disturbing magnetic pellet.
42.Centrifuge briefly and place tubes back in magnetic stand for 30 to 60 s.
43.Use a low-volume pipet tip to remove residual liquid.
44.Air-dry tubes for 5 min at room temperature with lids open.
45.Add 40 µl UV-irradiated PrepFiler™ Elution Buffer to each tube.
46.Cap the tubes and vortex at maximum speed until no pellet is visible on the side of the tubes. Centrifuge briefly.
47.Incubate tubes for 5 min at 70°C at 900 rpm in the thermomixer.
48.Vortex tubes at max speed and centrifuge briefly.
49.Place tubes in magnetic stand for 1 min or until the pellet stops increasing in size.
50.Pipet the liquid into a clean, UV-irradiated 1.7-ml LoBind tube without disturbing magnetic pellet.
51.Store extraction products at 4°C for short-term storage (≤2 weeks) or −20°C for long-term storage (>2 weeks).
Basic Protocol 2: QUANTIFICATION OF MITOCHONDRIAL DNA (COPIES/μl)
This procedure is a custom mtDNA quantitative polymerase chain reaction (mtqPCR) duplex (Gallimore et al., 2018). It utilizes a small target of 69 base pairs (bp) in length to quantify the number of mtDNA copies per unit volume and a large target of 283 bp in length to assess degradation of mtDNA templates. See Table 1 for primer and probe sequences. The assay does not contain an internal PCR control (IPC) because the extraction outlined in Basic Protocol 1 does not typically retain elements inhibitory to the mtqPCR assay. The DNA standard used in the assay is the Applied Biosystems Quantifiler™ HP standard; the Quantifiler HP kit is designed to quantify the amount of chromosomal DNA in an extract, including an assessment of degradation. Alternatively, a synthetic standard of the target amplicons can be purchased and a known number of molecules of mtDNA per unit volume determined from the mass of synthetic DNA (Niederstätter et al., 2007; Timken et al., 2005). Regardless of the source of the standard DNA, the copies of mtDNA/µl in the standard must be established. Note that for this protocol, the number of copies were confirmed by the National Institute of Standards and Technology (NIST) using a digital droplet PCR approach. The stock standard of known concentration is used to make the necessary dilutions to serve as the standard curve. The mtqPCR reactions are prepared for amplification on the Applied Biosystems™ 7500 Real-Time PCR System. Although other qPCR instruments can be used, optimized conditions for the custom assay have only been established for the 7500.
| Oligonucleotide | Sequence (5’ → 3’)a |
|---|---|
| mtND1-F | CCC TAA AAC CCG CCA CAT CT |
| mtND1-R | GAG CGA TGG TGA GAG CTA AGG T |
| mtND1-probe | VIC-CCA TCA CCC TCT ACA TC-MGB |
| mt8154-F | GGG TAT ACT ACG GTC AAT GCT CTG A |
| mt8436-R | GTG ATG AGG AAT AGT GTA AGG AGT ATG G |
| mt8345-probe | FAM-CCA ACA CCT CTT TAC AGT GAA-MGB |
- a
VIC and FAM are the reporter dyes. MGB, minor groove binder.
The amplification of extracted mtDNA can have varying results depending on the amount of added template. To assist in obtaining optimal amplification results, a quantification step is performed first. The measured concentration of mtDNA in the extract can then be used to ensure an adequate amount of template is added to the amplification reaction. This assay is also designed to assess degradation of mtDNA using the following equation:
A degradation index (DI) of <1 indicates low degradation, 1 to 10 indicates moderate degradation, and >10 indicates extensive degradation. This information is valuable when assessing potential impacts on amplification and sequencing results (Canale et al., 2022).
Materials
-
10% (v/v) commercial bleach (7 mM sodium hypochlorite solution)
-
70% (v/v) EtOH (Decon Labs, cat. no. 64-17-5)
-
Diluted stock standard (Applied Biosystems Quantifiler™ DNA standard, Thermo Fisher Scientific, cat. no. 4343895, or any standard sample of known mtDNA quantity) of 1,000,000 mtDNA copies/µl
-
Low-EDTA TE (0.1 mM EDTA; pH 8.0; Quality Biological, cat. no. 351-324-721)
-
Molecular-grade water (Thermo Fisher Scientific, cat. no. 10977023)
-
2× TaqMan Universal Master Mix II, with UNG (Thermo Fisher Scientific, cat. no. 4440042)
-
50 mg/ml bovine serum albumin (BSA), DNA grade (Fisher Scientific, cat. no. AM2616)
-
4 μM ND1-F
-
4 μM mt8154-F
-
4 μM ND1-R
-
4 μM mt8436-R
-
10 µM ND1-probe
-
10 μM mt8345-probe
-
DNA extracts and reagent blanks from Basic Protocol 1
-
96-well optical plate, non-skirted (Neptune Scientific, cat. no. 3730.X)
-
Optical adhesive seal (Thermo Fisher Scientific, cat. no. 4311971)
-
Applied Biosystems™ 7500 Real-Time PCR System
NOTE : Any extract with suitable amounts of mtDNA (i.e., ≥500 copies/μl) can be used for this assay.
1.Prepare a workspace in which to perform the amplification by decontaminating the working surface with 10% commercial bleach followed by 70% EtOH.
2.Beginning with a diluted stock standard of 1,000,000 mtDNA copies/µl in low-EDTA TE, prepare standard dilutions using the following volumes:
- a. Standard 1 (40,000 copies/µl): 4 µl diluted stock in 96 µl molecular-grade water.
- b. Standard 2 (4000 copies/µl): 10 µl Standard 1 in 90 µl molecular-grade water.
- c. Standard 3 (400 copies/µl): 10 µl Standard 2 in 90 µl molecular-grade water.
- d. Standard 4 (40 copies/µl): 10 µl Standard 3 in 90 µl molecular-grade water.
- e. Standard 5 (30 copies/µl): 75 µl Standard 4 in 25 µl molecular-grade water.
- f. Standard 6 (20 copies/µl): 66.7 µl Standard 5 in 33.3 µl molecular-grade water.
- g. Standard 7 (10 copies/µl): 50 µl Standard 6 in 50 µl molecular-grade water.
- h. Standard 8 (2 copies/µl): 20 µl Standard 7 in 80 µl molecular-grade water.
3.Prepare master mix as follows, multiplying the following volumes by the total number of samples + controls (reagent blanks from Basic Protocol 1 and a no-template negative amplification control) + 16 standards, + an additional 10% to allow for pipetting losses:
- 10 μl 2× TaqMan Universal Master Mix II, with UNG
- 0.1 μl 50 mg/ml BSA
- 0.5 μl 4 μM ND1-F
- 0.5 μl 4 μM mt8154-F
- 0.5 μl 4 μM ND1-R
- 0.5 μl 4 μM mt8436-R
- 0.4 μl 10 μM ND1-probe
- 0.4 μl 10 μM mt8345-probe
- 2.1 μl molecular-grade water
- = 15 μl total volume.
4.Add 15 μl master mix to each applicable well of a 96-well optical plate.
5.Add 5 μl of each standard from step 2 to the first column of wells.
6.Add 5 μl of each standard from step 2 to the second column of wells.
7.Add 5 μl of each DNA extract or reagent blank prepared in Basic Protocol 1 to individual wells.
8.Add 15 μl master mix from step 3 to one well for a no-template amplification control.
9.Seal the plate with an optical adhesive seal.
10.Make sure no wells have bubbles at the bottom.
11.Open the tray of the Applied Biosystems™ 7500 Real-Time PCR System and place the optical plate onto the deck.
12.Run the following protocol:
| Initial step: | 10 min | 95°C |
| 45 cycles: | 15 s | 95°C |
| 60 s | 60°C. |
13.View the data generated by the HID Real-Time PCR Analysis Software, which is provided in mtDNA copies/μl. Based on the value for the small target (mtND1), calculate how much to dilute the extract to achieve the ideal input amount for amplification as described in Basic Protocol 3.
Basic Protocol 3: MULTIPLEX AMPLIFICATION OF THE MITOGENOME
MPS of extracted mtDNA from the hair shaft (Basic Protocol 1) requires an enrichment step. This protocol uses the PowerSeq® Whole Mito System from Promega, amplifying the entire human mitogenome as 161 amplicons in a single PCR reaction, ranging in size from 92 to 254 bp in length. The small size of the amplicons enables analysis of degraded samples and use of a dual amplification process to minimize the possible formation of concatemers, especially from the most degraded samples, whereas a single amplification approach can be used for samples with less degradation. The amplified products are then ready for library preparation and sequencing on an Illumina MiSeq® or MiSeq® FGx™ system (Basic Protocol 4).
Materials
-
PowerSeq® Whole Mito Amp and Prep Kit (Promega, cat. no. PS1600), containing Master Mix, Primer Pair Mixes 1 and 2, Amplification Grade Water, and 2800 M Control DNA
-
DNA extracts and reagent blanks from Basic Protocol 1
-
Low-EDTA TE (0.1 mM EDTA; pH 8.0; Quality Biological, cat. no. 351-324-721)
-
Mini centrifuge
-
Vortex
-
96-well optical plate, non-skirted (Neptune Scientific, cat. no. 3730.X)
-
Optical adhesive seal (Thermo Fisher Scientific, cat. no. 4311971)
-
Centrifuge with plate adapter
-
GeneAmp® 9700 thermal cycler (GMI, cat. no. 8401-30-1001)
NOTE : Any extract with suitable amounts of mtDNA (i.e., ≥500 copies/μl) can be used for this assay.
1.Completely thaw Master Mix, Primer Pair Mix 1, Primer Pair Mix 2, and Amplification Grade Water from the PowerSeq® Whole Mito Amp and Prep Kit at room temperature.
2.Briefly centrifuge the above reagents and 2800 M Control DNA. Vortex all tubes for 15 s before each use.
3.Prepare Amplification Mix 1 as follows, multiplying the following volumes by the total number of samples + positive and negative controls + an additional 10% to allow for pipetting losses:
- 2.5 µl PowerSeq® Whole Mito 5× Master Mix
- 1.25 µl PowerSeq® Whole Mito 10× Primer Pair Mix 1
- Amplification Grade Water to 12.5 µl.
| Position | Ref | Alt | 5000 pg | 2500 pg | 1000 pg | 500 pg | 250 pg | 125 pg | 62 pg | 31 pg | 16 pg | 8 pg |
|---|---|---|---|---|---|---|---|---|---|---|---|---|
| 152 | T | C | 100 | 100 | 100 | 100 | 100 | 100 | 100 | 100 | 100 | 100 |
| 263 | A | G | 99 | 99 | 99 | 100 | 99 | 100 | 99 | 100 | 100 | 100 |
| 315 | C | insC | 100 | 99 | 98 | 98 | 98 | 98 | 99 | 99 | 98 | 98 |
| 477 | T | C | 100 | 100 | 100 | 100 | 100 | 100 | 100 | 100 | 100 | 100 |
| 750 | A | G | 100 | 100 | 100 | 100 | 100 | 100 | 100 | 100 | 100 | 100 |
| 1438 | A | G | 100 | 100 | 100 | 100 | 100 | 100 | 100 | 100 | 100 | 100 |
| 3010 | G | A | 99 | 99 | 99 | 100 | 99 | 100 | 100 | 100 | 100 | 100 |
| 4769 | A | G | 100 | 100 | 100 | 100 | 100 | 100 | 100 | 100 | 100 | 100 |
| 8860 | A | G | 100 | 100 | 100 | 100 | 100 | 100 | 100 | 100 | 100 | 100 |
| 15326 | A | G | 100 | 100 | 100 | 100 | 100 | 100 | 100 | 100 | 100 | 100 |
| 16519 | T | C | 100 | 100 | 100 | 100 | 100 | 100 | 100 | 100 | 100 | 100 |
| Minimum read depth | 173 | 123 | 174 | 208 | 220 | 226 | 229 | 148 | 162 | 172 | ||
| Average read depth | 4287 | 4199 | 4663 | 4644 | 4256 | 4926 | 5232 | 4025 | 4427 | 5121 | ||
- a
Varying input amounts of positive-control 2800 M DNA were analyzed using the PowerSeq® Whole Mito System, the MiSeq® instrument and sequencing reagents, and GeneMarker® HTS software, version 2.5. Each template amount was sequenced in duplicate, and 22 libraries were pooled in a single run. The table shows the percentage of major variants reported and minimum and average coverage across the mitogenome. Data provided by Promega.
4.Prepare Amplification Mix 2 as follows, multiplying the following volumes by the total number of samples + positive and negative controls + an additional 10% to allow for pipetting losses:
- 2.5 µl PowerSeq® Whole Mito 5× Master Mix
- 1.25 µl PowerSeq® Whole Mito 10× Primer Pair Mix 2
- Amplification Grade Water to 12.5 µl.
5.Vortex Amplification Mix 1 (step 3) for 5 to 10 s.
6.Add Amplification Mix 1 to each applicable well in a 96-well optical plate.
7.Vortex Amplification Mix 2 (step 4) for 5 to 10 s.
8.Add Amplification Mix 2 to each applicable well in the 96-well plate.
9.Add 50 pg genomic DNA (∼3800 copies of mtDNA) from DNA extracts from Basic Protocol 1 to the wells with Amplification Mix 1 (step 6).
10.Add 50 pg genomic DNA to the wells with Amplification Mix 2 (step 8).
11.Dilute the 2800 M Control DNA from step 2 to 20 pg/µl by first vortexing the 2800 M Control DNA and then adding 2 µl of 2800 M Control DNA to 998 µl low-EDTA TE.
12.Add 2.5 µl of the diluted 2800 M Control DNA to a well with Amplification Mix 1.
13.Add 2.5 µl of the diluted 2800 M Control DNA to a well with Amplification Mix 2.
14.Add Amplification Grade Water to a well with Amplification Mix 1 alone and to a well with Amplification Mix 2 alone as negative controls.
15.Seal plate with an optical adhesive seal.
16.Centrifuge the plate for 30 s at 200 × g.
17.Place the plate into a GeneAmp® 9700 thermal cycler.
18.Create and run the following protocol:
| Initial step: | 1 min | 96°C |
| 30 cycles: | 10 s | 94°C |
| 1 min | 59°C | |
| 30 s | 72°C | |
| Final steps: | 10 min | 60°C |
| indefinitely | 4°C. |
19.Store amplification products at 4°C for short-term storage or −20°C for long-term storage.
Basic Protocol 4: LIBRARY PREPARATION AND SEQUENCING OF MITOGENOME AMPLICONS
The PowerSeq® Whole Mito System is designed for use with two MiSeq sequencing systems: the Illumina MiSeq® and Verogen (Qiagen) MiSeq® FGx™. An initial bead purification process removes PCR reagents from the products. Index adapters are then added to the purified amplicons so they can bind to the MiSeq flow cell. The index adapters contain unique barcode sequences, allowing for sample differentiation during data analysis. Once the MiSeq run is complete, FASTQ files are generated for each sample for analysis with appropriate software.
Materials
-
PowerSeq® Whole Mito Purification Kit (Promega, cat. no. PS1600), containing ProNex® Size-Selective Chemistry beads, Wash Buffer, Nuclease-Free Water, Elution Buffer, and ProNex® Binding Buffer
-
100% EtOH, 200 proof (molecular grade; VWR, cat. no. 71006-012)
-
Amplification Mix 1 and 2 reaction products from Basic Protocol 3
-
20 mg/ml proteinase K (Thermo Fisher Scientific, cat. no. AM2546; make fresh)
-
PowerSeq® Whole Mito Amp and Prep Kit (Promega, cat. no. PS1600), including Library Prep Buffer and Library Prep Reagent
-
IDT Index Plate (IDT for Illumina - TruSeq® DNA UD Indexes v2 Index Plate, Illumina, cat. no. 20040870), including DNA Adapters
-
PowerSeq ® Quant MS System (Promega, cat. no. PS5000), containing PowerSeq® Quant MS DNA Standard, PowerSeq® Quant MS 1× Dilution Buffer, PowerSeq® Quant 2× Master Mix, PowerSeq® Quant MS 10× Primer Mix, and Amplification Grade Water
-
MiSeq ® Reagent Kit v3 (600 cycles; Illumina, cat. no. MS-102-3003), containing MiSeq v3 reagent cartridge and HT1 hybridization buffer
-
Deionized water
-
2.0 N NaOH (Thomas Scientific, cat. no. UN1824)
-
PhiX Control v3 (Illumina, cat. no. FC-110-3001)
-
96-well plates (Neptune Scientific, cat. no. 3730.X)
-
Vortex
-
Magnetic stand (Thermo Fisher Scientific, cat. no. 12331D)
-
Optical adhesive seal (Thermo Fisher Scientific, cat. no. 4311971)
-
Centrifuge with plate adapter
-
96-well optical plate, non-skirted (Neptune Scientific, cat. no. 3730.X)
-
Applied Biosystems™ 7500 Real-Time PCR System
-
1.7-ml microcentrifuge tubes (VWR, cat. no. 20170-355)
-
Illumina MiSeq® or Illumina MiSeq® FGx™ instrument
Purification of amplification products from Basic Protocol 3
1.Allow the ProNex® Size-Selective Chemistry beads from the PowerSeq® Whole Mito Purification Kit to stand for 30 min to 1 hr to equilibrate to room temperature.
2.Add 200 ml of 100% EtOH to the Wash Buffer from the kit to reconstitute.
3.Optional: Pipet 10 µl of each Amplification Mix 1 reaction product from Basic Protocol 3 into a new 96-well plate.
4.Optional: Pipet 10 µl of each Amplification Mix 2 reaction product from Basic Protocol 3 into the new 96-well plate, combining with the corresponding Amplification Mix 1 wells.
5.Add 50 µl freshly prepared 20 mg/ml proteinase K to 950 µl Nuclease-Free Water from the kit to create a 1 mg/ml solution.
6.Add 5 µl of the 1 mg/ml proteinase K solution to each well containing the 20 µl of combined Amplification Mixes.
7.Vortex ProNex® Size-Selective Chemistry beads (step 1) vigorously for 10 s.
8.Add 75 µl ProNex® Size-Selective Chemistry beads to each well.
9.Mix thoroughly using a pipet set to 80 µl, pipetting gently 10 times.
10.Incubate at room temperature for 10 min.
11.Place plate on a magnetic stand at room temperature for ∼5 min or until liquid is clear.
12.Remove and discard supernatant from each well. Make sure to avoid the bead pellet.
13.Add 200 µl Wash Buffer from step 2 to each well.
14.Incubate at room temperature for 30 s.
15.Remove and discard supernatant from each well. Make sure to avoid the bead pellet.
16.Repeat steps 13 to 15.
17.Use a 20-µl pipet to remove residual Wash Buffer from each well.
18.Air-dry samples (still on the magnetic stand) for 5 min.
19.Add 23 µl Elution Buffer (from the PowerSeq® Whole Mito Purification Kit) to each well.
20.Remove plate from magnetic stand.
21.Mix thoroughly by gently pipetting 10 times.
22.Incubate at room temperature for 2 min.
23.Place plate on magnetic stand at room temperature for ∼1 min or until liquid is clear.
24.Transfer 21 µl of the supernatant to a new 96-well plate. Make sure to avoid the bead pellet.
25.Seal the plate with an optical adhesive seal. Use immediately or store ≤7 days at −25° to −15°C.
Preparation and purification of the DNA libraries
26.Allow ProNex® Size-Selective Chemistry beads to stand for 30 min to 1 hr to equilibrate to room temperature.
27.Thaw Library Prep Buffer from the PowerSeq® Whole Mito Amp and Prep Kit at room temperature.
28.Place Library Prep Buffer and Library Prep Reagent on ice.
29.Thaw DNA Adapters in the IDT Index Plate at room temperature for 10 min.
30.Briefly centrifuge IDT Index Plate.
31.Pierce foil seal of IDT Index Plate with pipet tip.
32.Using the 96-well plate that contains the purified amplification products (see step 25), add the following to each applicable well:
- 30 µl Library Prep Buffer (see step 28)
- 4 µl Library Prep Reagent (see step 28)
- 5 µl DNA Adapter from IDT Index Plate (see step 29).
33.Mix each reaction thoroughly by gently pipetting 10 times.
34.Seal plate and incubate for 30 min at room temperature.
35.Cover used IDT Index Plate wells with an adhesive seal.
36.Make Binding Buffer Mixture as follows, multiplying the following volumes by the number of libraries + 2 for pipetting error:
- 30 µl ProNex® Binding Buffer
- 15 µl Nuclease-Free Water
- = 45 µl total volume.
37.Vortex ProNex® Size-Selective Chemistry beads (step 26) vigorously for 10 s.
38.Add 120 µl beads to each applicable well.
39.Mix thoroughly by pipetting up and down.
40.Incubate at room temperature for 10 min.
41.Place plate on a magnetic stand at room temperature for approximately 2 to 3 min or until clear.
42.Remove and discard supernatant. Make sure to avoid the bead pellet.
43.Add 45 µl Binding Buffer Mixture from step 36 to each applicable well.
44.Remove plate from magnetic stand.
45.Cover plate with adhesive seal and vortex.
46.Briefly spin plate.
47.Incubate at room temperature for 10 min.
48.Place plate on magnetic stand at room temperature for approximately 2 to 3 min or until clear.
49.Remove and discard supernatant. Make sure to avoid the bead pellet.
50.Add 200 µl Wash Buffer from step 2 to each applicable well.
51.Incubate on magnetic stand for 30 s.
52.Remove and discard the supernatant from each well. Make sure not to disturb the pellet.
53.Repeat steps 50 to 52.
54.Use a 20-µl pipet tip to remove residual EtOH from each well.
55.Air-dry on the magnetic stand for 5 min.
56.Add 23 µl Elution Buffer to each well.
57.Remove from magnetic stand.
58.Mix thoroughly by gently pipetting 10 times.
59.Incubate at room temperature for 5 min.
60.Place plate on magnetic stand and wait until the liquid is clear.
61.Transfer 20 µl supernatant to a new 96-well plate. Make sure not to disturb the bead pellet.
Quantification and normalization of libraries
62.Quantify the libraries using the PowerSeq® Quant MS System (see PowerSeq® Quant MS System Technical Manual TM511).
63.Prepare standard dilutions of the PowerSeq® Quant MS DNA Standard using the following amounts:
-
20 pM: 5 µl of 200 pM PowerSeq®Quant MS DNA Standard in 45 µl PowerSeq®Quant MS 1× Dilution Buffer.
-
2 pM: 5 µl of 20 pM Standard in 45 µl Dilution Buffer.
-
0.2 pM: 5 µl of 2 pM Standard in 45 µl Dilution Buffer.
-
0.02 pM: 5 µl of 0.2 pM Standard in 45 µl Dilution Buffer.
64.Dilute PowerSeq® Whole Mito libraries (step 62) up to 1:100,000 (which can be adjusted based on laboratory standards and previous experience with samples):
-
Add 2 µl library to 198 µl PowerSeq®Quant MS 1× Dilution Buffer to create a 1:100 dilution.
-
Mix thoroughly using a 200-µl pipet set to 198 µl.
-
Add 2 µl of the 1:100 dilution to 198 µl PowerSeq®Quant MS 1× Dilution Buffer to create a 1:10,000 dilution.
-
Mix thoroughly.
-
Add 2 µl of the 1:10,000 dilution to 18 µl PowerSeq®Quant MS 1× Dilution Buffer to create a 1:100,000 dilution.
-
Mix thoroughly.
65.Thaw PowerSeq® Quant 2× Master Mix, PowerSeq® Quant MS 10× Primer Mix, and Amplification Grade Water at room temperature.
66.Vortex Master Mix and Primer Mix for 10 s.
67.Make Reaction Mix, as follows, multiplying the following volumes by 4 standards (in triplicate) + positive control + 3 no-template controls + number of samples + 10% for pipetting error:
- 4 µl Amplification Grade Water
- 10 µl PowerSeq® Quant 2× Master Mix
- 2 µl PowerSeq® Quant MS 10× Primer Mix
- = 16 µl total volume.
68.Add 16 µl Reaction Mix to each applicable well of an optical 96-well plate.
69.Add 4 µl standards from step 63 to each applicable well.
70.Add 4 µl sample libraries from step 64 to each applicable well.
71.Add 4 µl PowerSeq® Quant MS 1× Dilution Buffer to all no-template control wells.
72.Seal the plate with an optical adhesive seal.
73.Centrifuge plate briefly.
74.Open the tray of the Applied Biosystems™ 7500 Real-Time PCR System and place the optical plate onto the deck.
75.Run the following protocol:
| Initial step: | 2 min | 95°C |
| 30 cycles: | 15 s | 95°C |
| 15 s | 60°C | |
| 45 s | 72°C. |
76.Normalize DNA library concentrations as follows:
- a.Use the following equation to determine the adjusted dilution target:
- b.Dilute each library with Elution Buffer to adjusted dilution target.
- c.If a library is below the dilution target, do not dilute.
- d.Dilute negative-control reactions (reagent blank from Basic Protocol 1 and negative amplification control generated in Basic Protocol 3) in the same volumes as the lowest-concentration sample library.
77.Pool 5 µl of each diluted library into a tube.
78.Vortex pooled libraries for 10 s.
Preparation for sequencing
79.Thaw the MiSeq v3 reagent cartridge from the MiSeq ® Reagent Kit v3 in a room-temperature deionized water bath for about 60 to 90 min.
80.Prepare 0.2 N NaOH by first adding 10 µl of 2.0 N NaOH to 90 µl Nuclease-Free Water and then vortexing thoroughly.
81.Thaw HT1 hybridization buffer from the MiSeq ® Reagent Kit v3 at room temperature.
82.Store HT1 buffer at 2° to 8°C until needed.
83.Denature the libraries by combining 5 µl of the pooled 4 nM libraries (step 78) and 5 µl of 0.2 N NaOH (step 80) in a 1.7-ml microcentrifuge tube.
84.Vortex and incubate for 5 min at room temperature.
85.Add 990 µl chilled HT1 buffer from step 82 to the tube.
86.Mix by inverting or pipetting.
87.Dilute and denature PhiX Control v3 by combining 2 µl PhiX Control v3, 3 µl Elution Buffer (from the PowerSeq® Whole Mito Purification Kit), and 5 µl 0.2 N NaOH in a 1.7-ml microcentrifuge tube.
88.Vortex and incubate for 5 min at room temperature.
89.Add 990 µl chilled HT1 buffer to the tube.
90.Mix by inverting or pipetting.
91.Prepare the sequencing dilution by combining 195 µl HT1 buffer, 365 µl pooled and denatured libraries (step 86), and 40 µl denatured PhiX control (step 90) in a 1.7-ml microcentrifuge tube.
92.Mix by inverting or pipetting
Loading onto MiSeq cartridge
93.Mix thawed reagent cartridge from step 79 by inverting 10 times.
94.Use a new 1-ml pipet tip to pierce the foil seal over the well labeled “Load Samples.”
95.Pipet all 600 µl of the prepared sample libraries into the well. Avoid touching the seal.
Operating Illumina MiSeq®
96a. Open Local Run Manager Software in Chromium (integrated software provided with the instrument) for the Illumina MiSeq®.
97a. Select Create Run.
98a. Select Generate FastQ.
99a. Enter a run name.
100a. Select TruSeq DNA PCR-Free as the Library Prep Kit.
101a. Select IDT-ILMN TruSeq DNA UD Indexes v2 (96 Indexes) as the Index Kit.
102a. Select either Single Read or Paired Read.
103a. Enter 276 for Read 1 and 276 for Read 2.
104a. Set Adapter Trimming to ON.
105a. Enter unique Sample ID for all samples.
106a. Select appropriate well for each sample.
107a. Select Save Run.
Operating Illumina MiSeq® FGx™
96b. Select 2.0 as the analysis software on the MFCS sign-in screen for the Illumina MiSeq® FGx™ instrument.
97b. Sign in using your username and password.
98b. Select Next.
99b. Select Sequence.
100b. Select Research Use Only as the run mode.
101b. Select Next.
102b. Load consumables as prompted by the software.
103b. Select Change Sample Sheet on the Load Reagents screen.
104b. Select applicable sample sheet.
105b. Use the sample sheet to set run name as desired.
106b. Use the sample sheet to set workflow type as mtDNA custom and read length as 276 × 276.
107b. Select Next to start pre-run check.
108b. Select Start Run once the pre-run check has completed.
Basic Protocol 5: DATA ANALYSIS OF MITOGENOME HAPLOTYPES
One of the most important and challenging aspects of forensic mtDNA testing is the analysis of the sequence data. MPS instruments, including the MiSeq, provide data as FASTQ files that contain the adapter-trimmed DNA sequences and quality scores (Liu & Harbison, 2018). A variety of software packages can be used to visualize and analyze the data. This protocol uses the SoftGenetics GeneMarker® HTS software (Holland et al., 2017). The sequence reads are first aligned phylogenetically to the revised Cambridge Reference Sequence (rCRS) (Bandelt & Parson, 2008; Parson et al., 2014). The software then identifies differences between the consensus sequence and the rCRS to generate variant call format (VCF) files. The consensus sequence is reported as a haplotype, which can be used to identify the haplogroup of the individual associated with the sample (Huber et al., 2018). It is expected that a laboratory will develop minimum criteria for reviewing, interpreting, and reporting the results generated by the software based on validation studies, guidelines such as the SWGDAM mtDNA interpretation guidelines (SWGDAM Guidelines, 2019), and the International Society for Forensic Genetics (ISFG) guidelines for mtDNA typing (Parson et al., 2014), literature references, and casework experience. The following protocol is a general framework for the analysis and interpretation of mtDNA. Details of the analysis and interpretation process can be found in McElhoe and Holland (2020) and McElhoe et al. (2022).
Materials
- SoftGenetics GeneMarker® HTS software
- Windows computer system (64-bit Windows OS 12 GB RAM 2.4 Hz Dual Quad Core Processor)
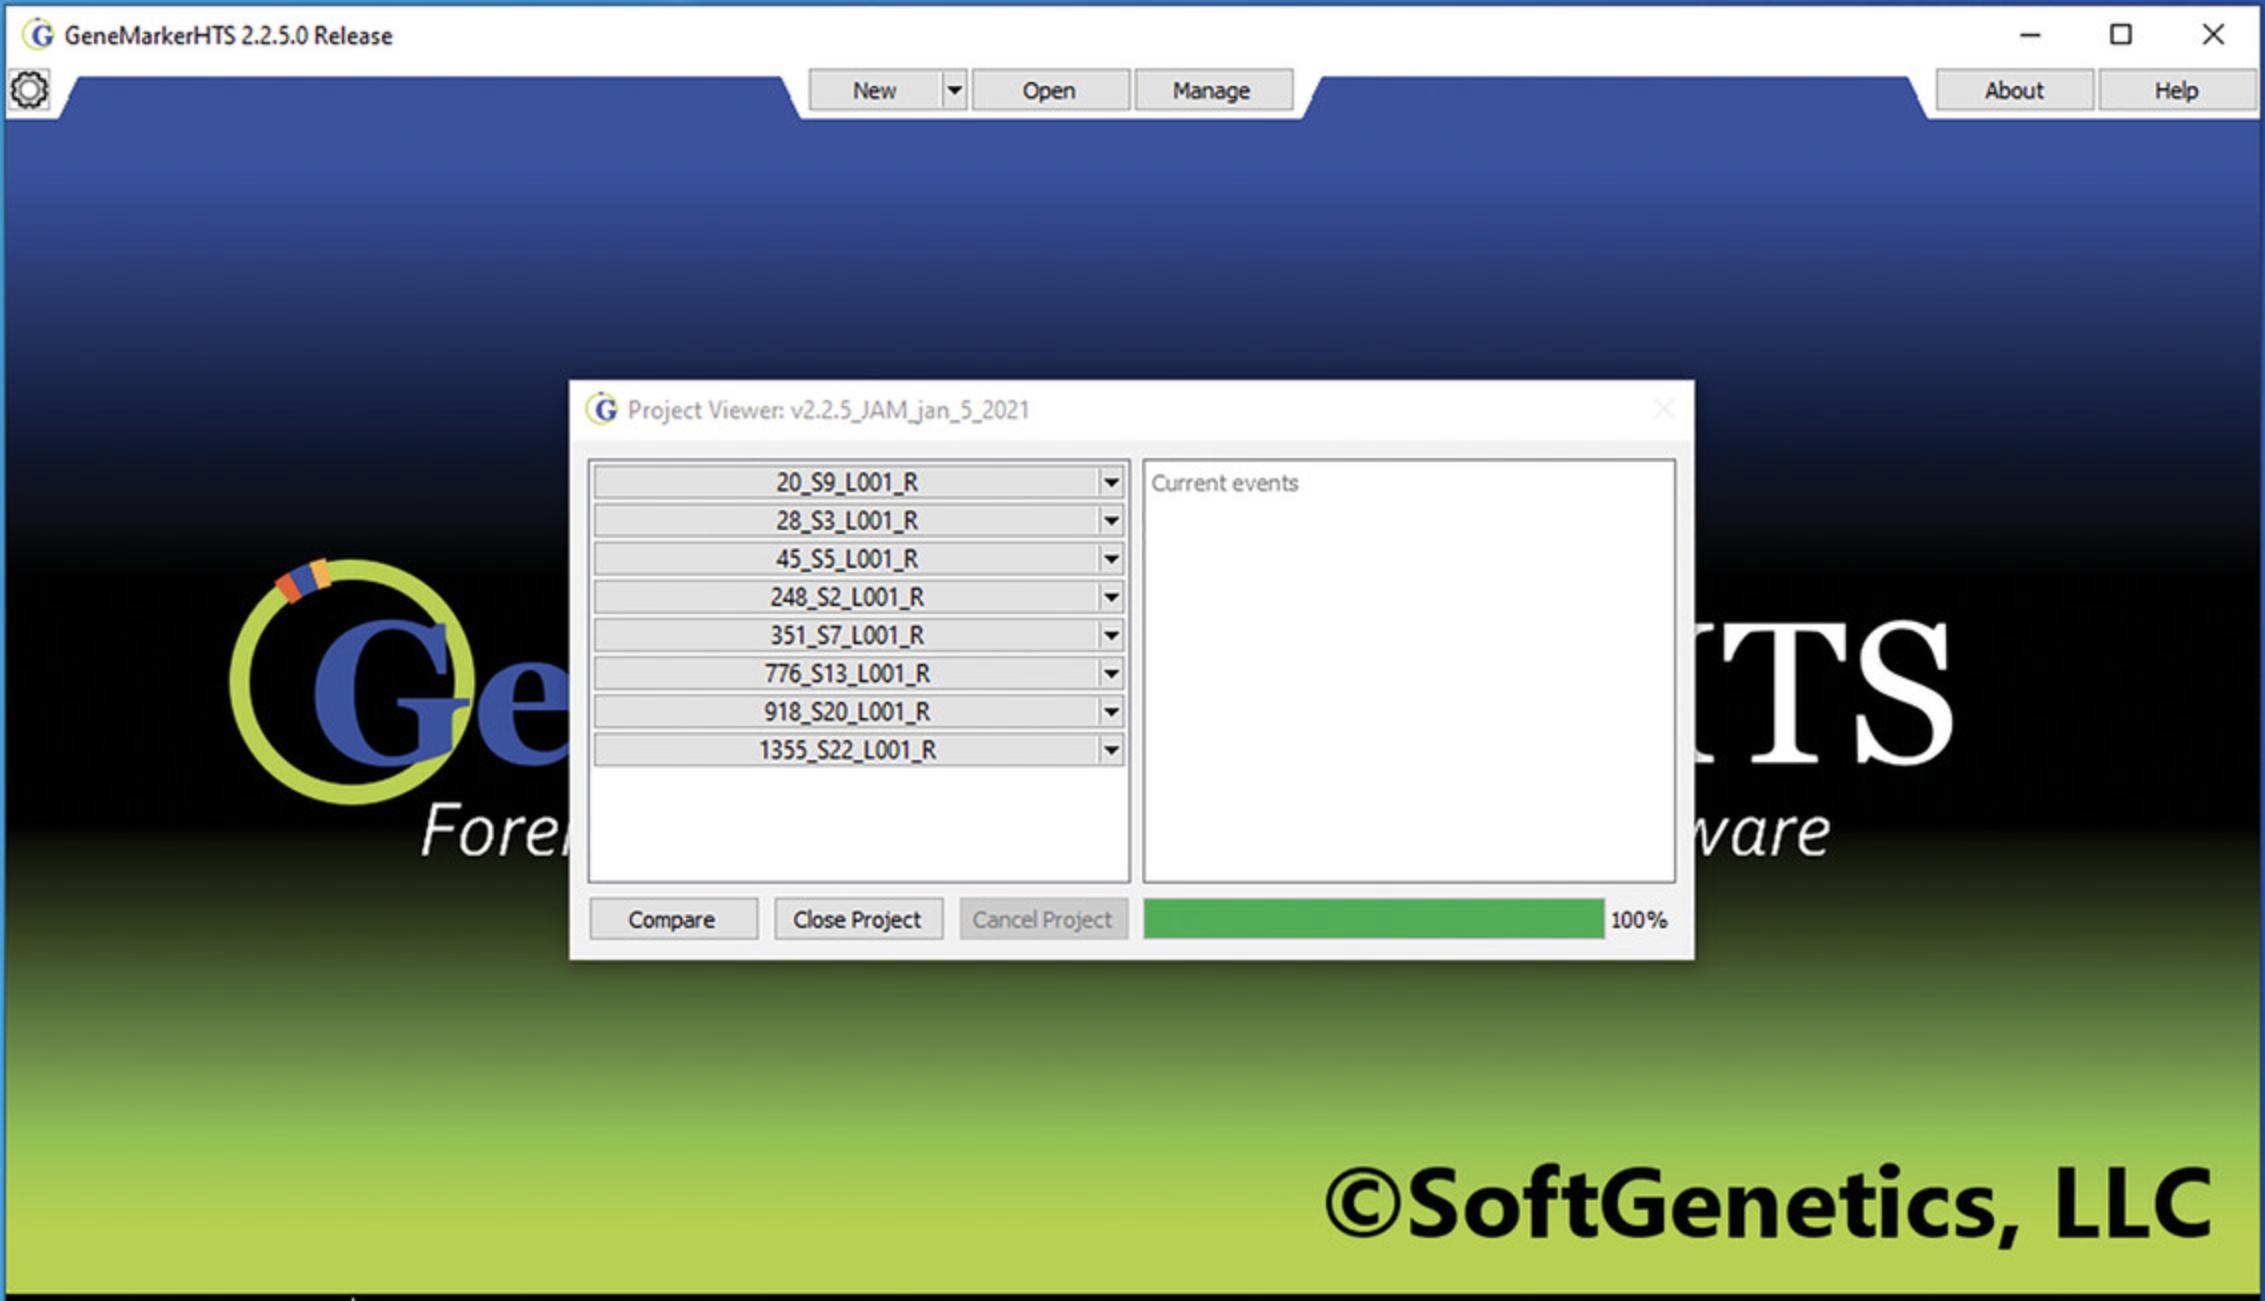
1.Open SoftGenetics GeneMarker® HTS software on a Windows computer system. To start a new project, select New.
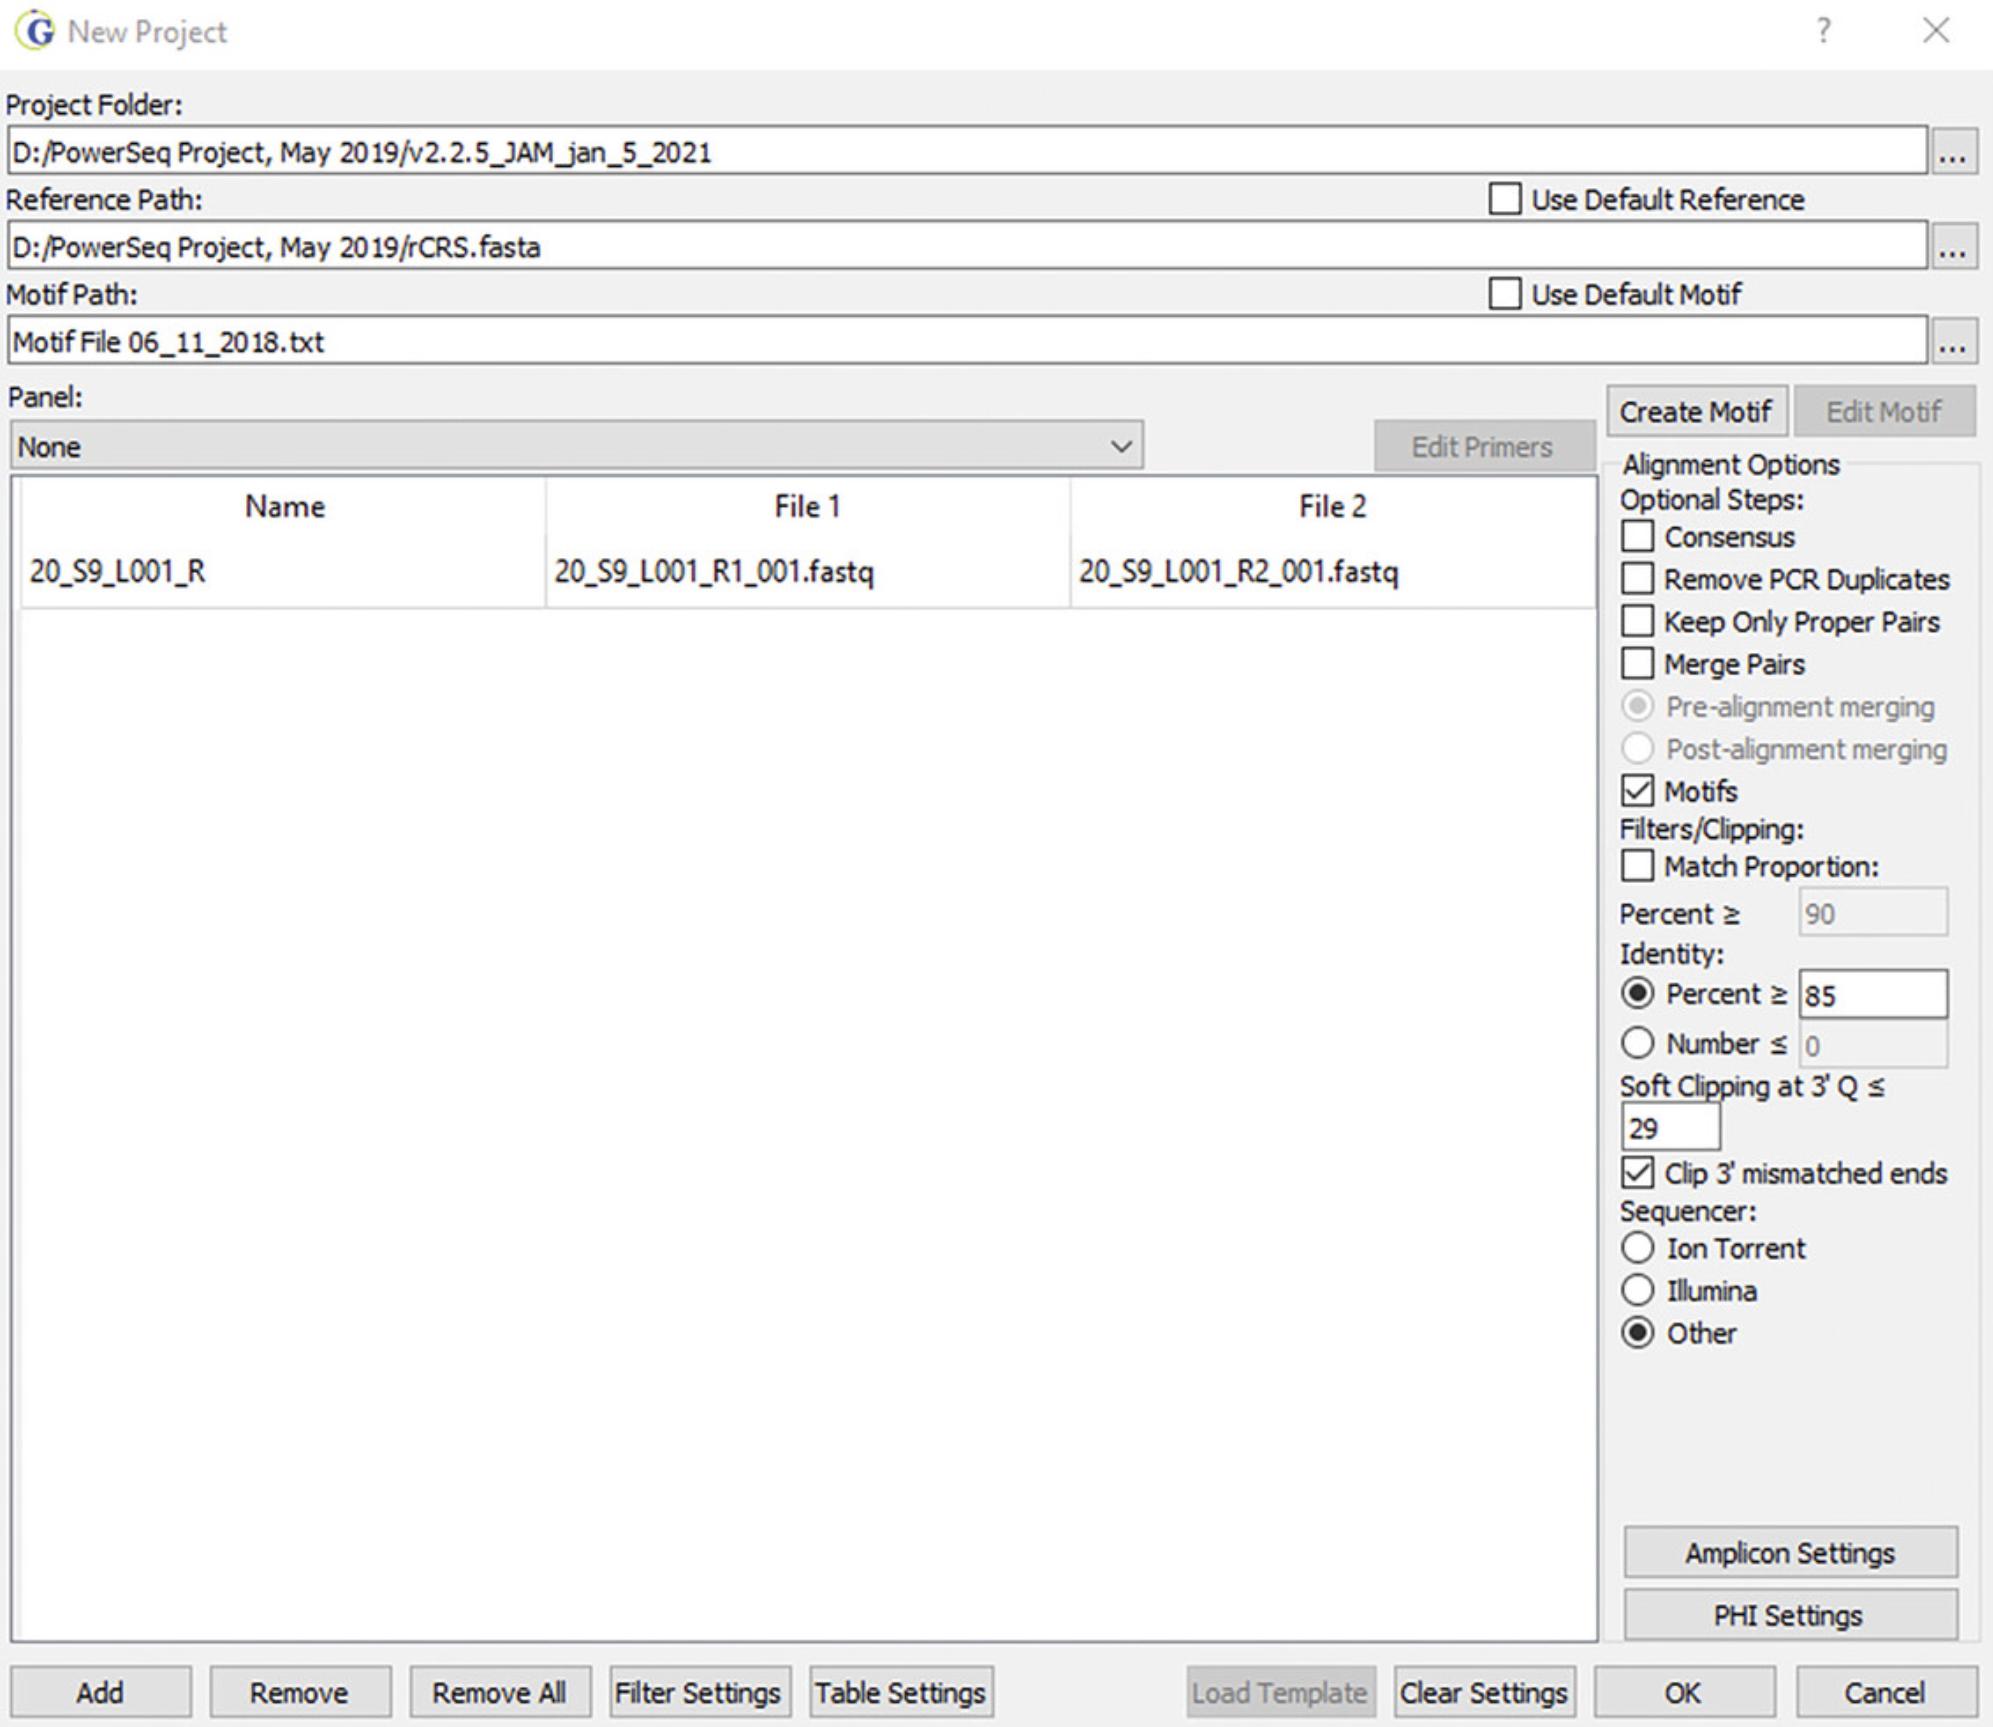
2.In the project wizard window (Fig. 2), do the following:
- a. Choose the Project Folder to which analysis results will be exported.
- b. Check the default box for Reference Path or select a custom file.
The rCRS.fasta file can be found at the GenBank National Library of Medicine NCBI website (NC_012920.1).
- c. Select a default or custom motif file.
This file allows for proper alignment of specific segments of the read pileup to the rCRS, resulting in phylogenetically single-nucleotide polymorphism (SNP) and INDEL (insertion and deletion) assignments used to construct the haplotype (Holland et al., 2017).
- d. Select Promega_PowerSeq_FullMito v1 as the Panel and select Allow Primer Mismatches under the panel options.
- e. Select Add and select FASTQ files to be analyzed.
As an example, two files for sample 20_S9_L001_R are provided, with the R1 and R2 FASTQ files (R1 = Read 1 and R2 = Read 2).
- f. Select Illumina as the Sequencer.
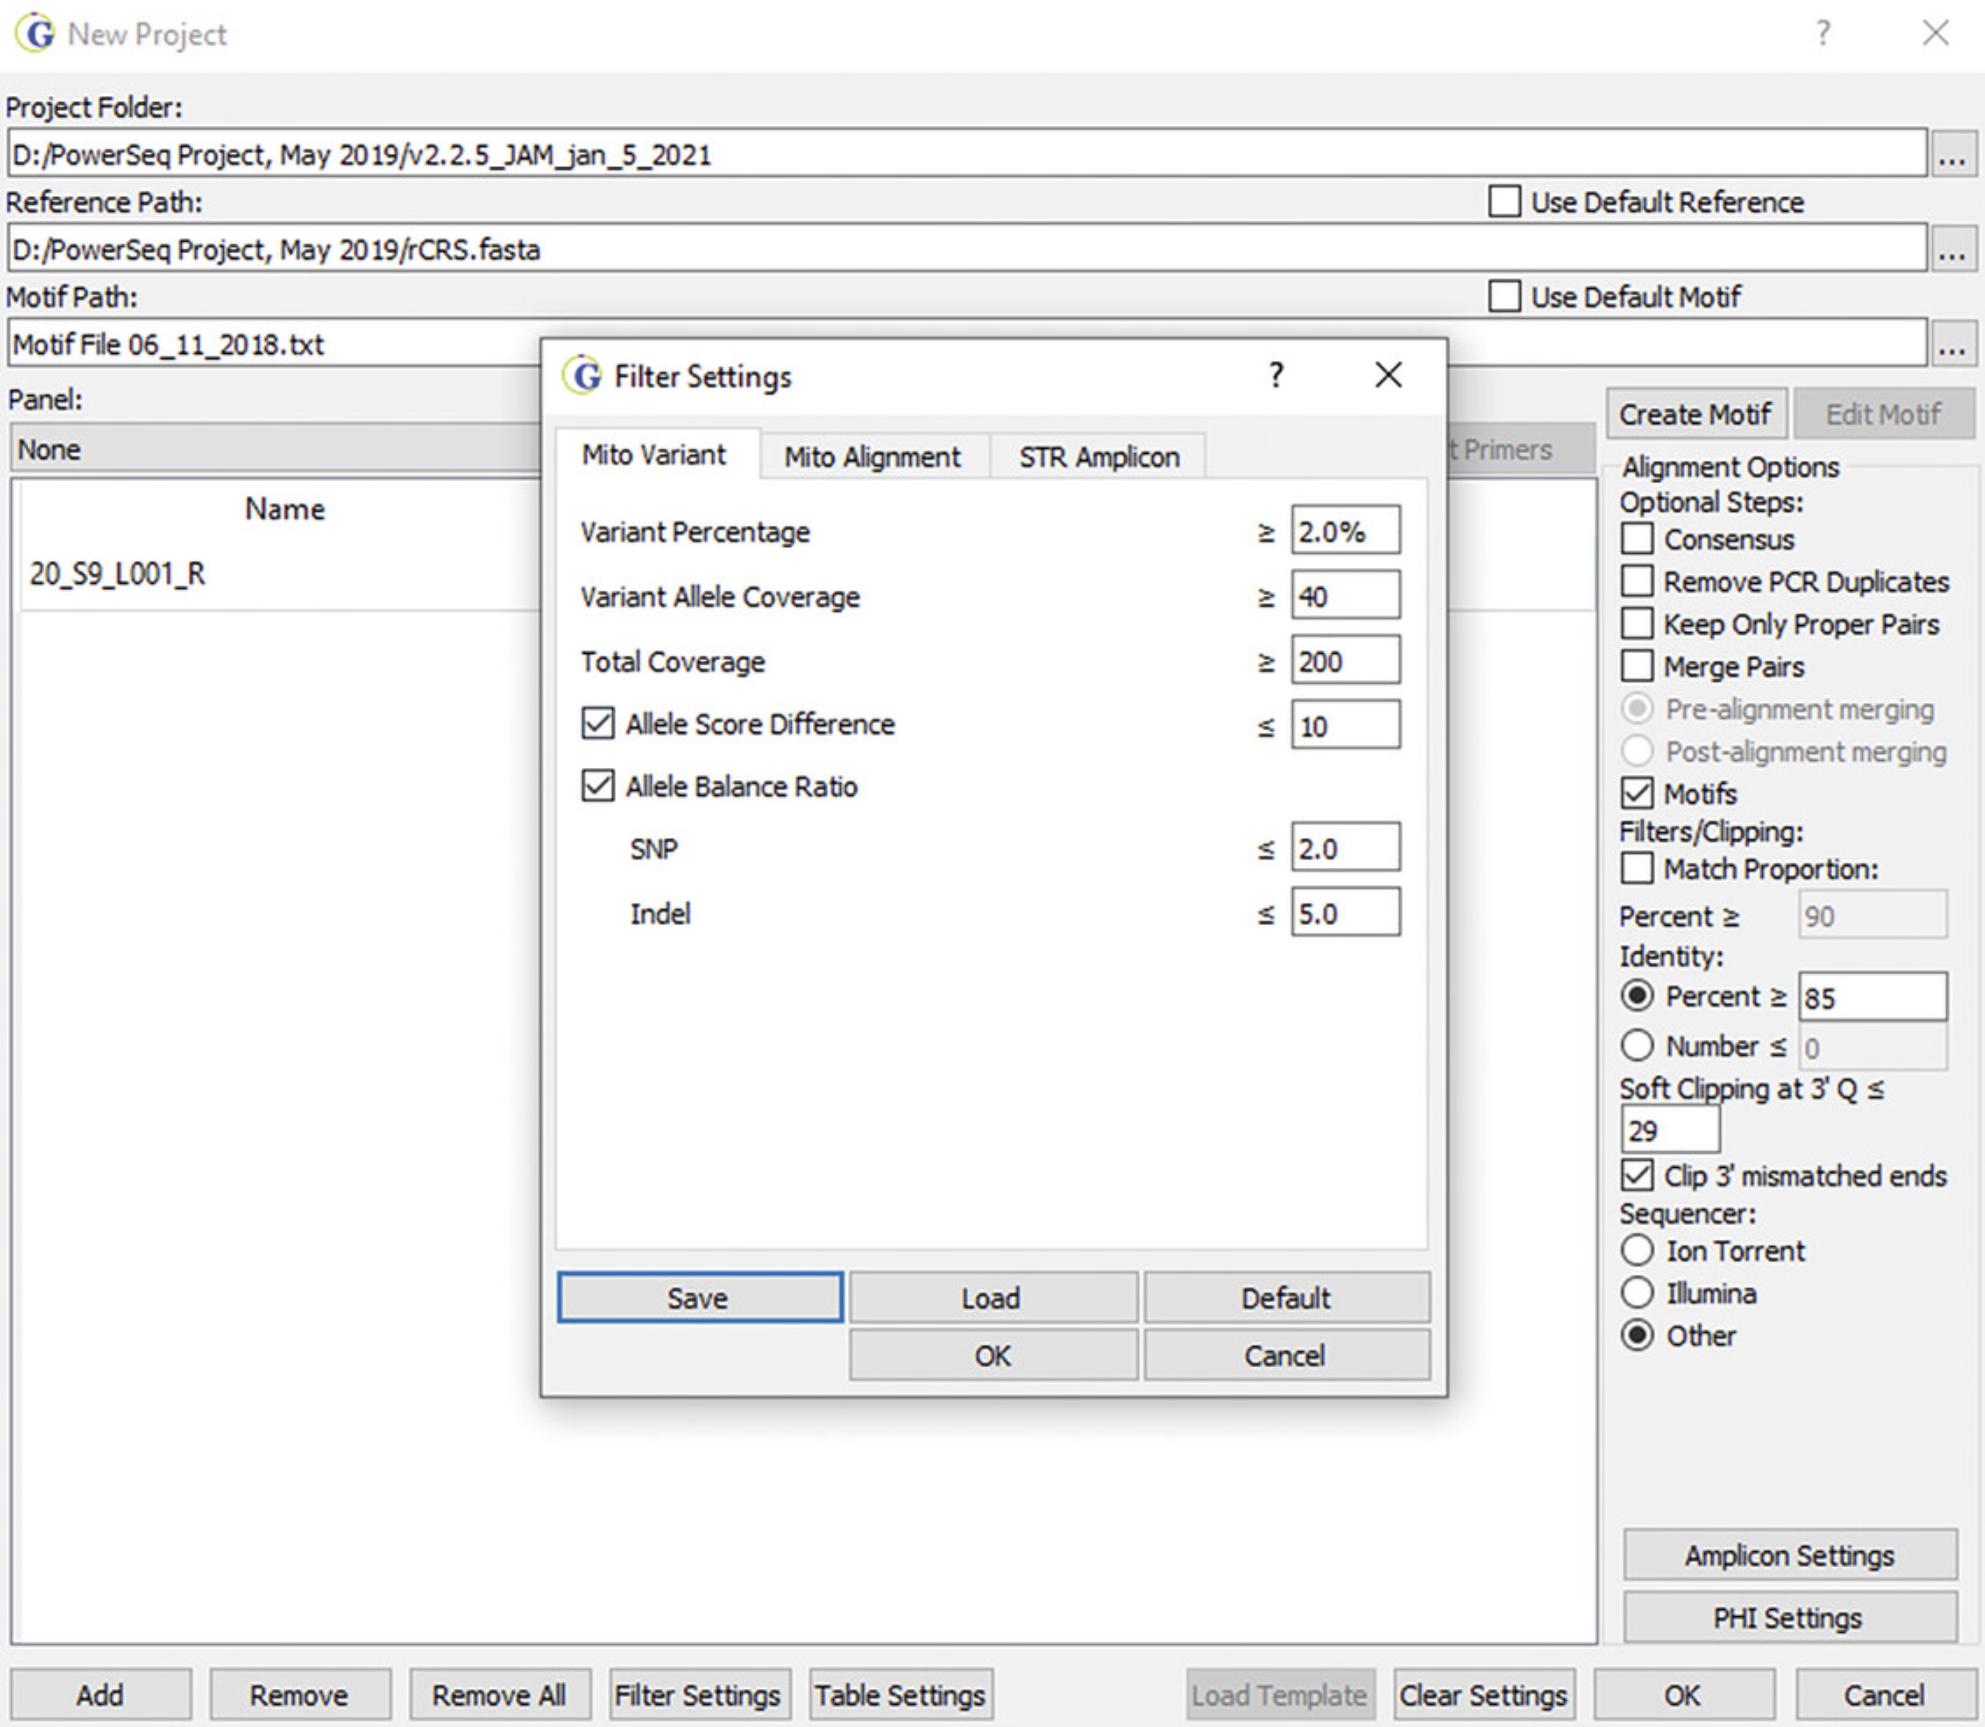
- g. Select default settings for Filter Settings or set the settings to the desired values:
- i. The Variant Percentage serves as a threshold for the reporting of minor sequence variants. If set at 2%, the value can be increased when performing data analysis. Setting the value higher does not allow for reduction of the value during data analysis.
- ii. The Variant Allele Coverage value serves as a threshold for the number of variant reads required to call a minor variant; it is set at 40 reads. At a 2% Variant Percentage threshold, this means that total coverage must be at least 2000 reads in order to report minor variants at 2% (40/2000 = 0.02).
- iii. The Total Coverage value is set at 200 reads to ensure that minor variants can always be reported at 20% or higher. However, this value can be set lower (10 to 50 reads) for haplotype assessment without analysis of minor variants.
- iv. The Allele Score Difference serves as a quality assessment filter and is set at 10. This filter relates to the quality score of the major SNP or insertion (note that deletions are treated differently, using the quality score of surrounding nucleotide positions) compared to the quality score for a minor variant. If the difference between the two scores is greater than 10, the minor variant will not be reported. This limits the reporting of low-quality variants.
- v. The Allele Balance Ratio serves as a quality assessment filter and is set at 2 for SNPs and 5 for INDELs. The ratio for total reads (Read 1 vs. Read 2, low/high number of reads) is compared to the ratio for reads for a specific reported allele or variant (Total vs. Variant). If the ratio is greater than the threshold, then the variant is not reported; for example, if a SNP balance ratio is more than twice the ratio of total reads, then the variant is not reported. This filter guards against strand bias associated with noise in the data.
Custom filter settings that allow for routine analysis of mitogenome sequences when using the Promega PowerSeq WMG kit can be found in Figure 3.
3.Select the portion of the mitogenome that has been sequenced.
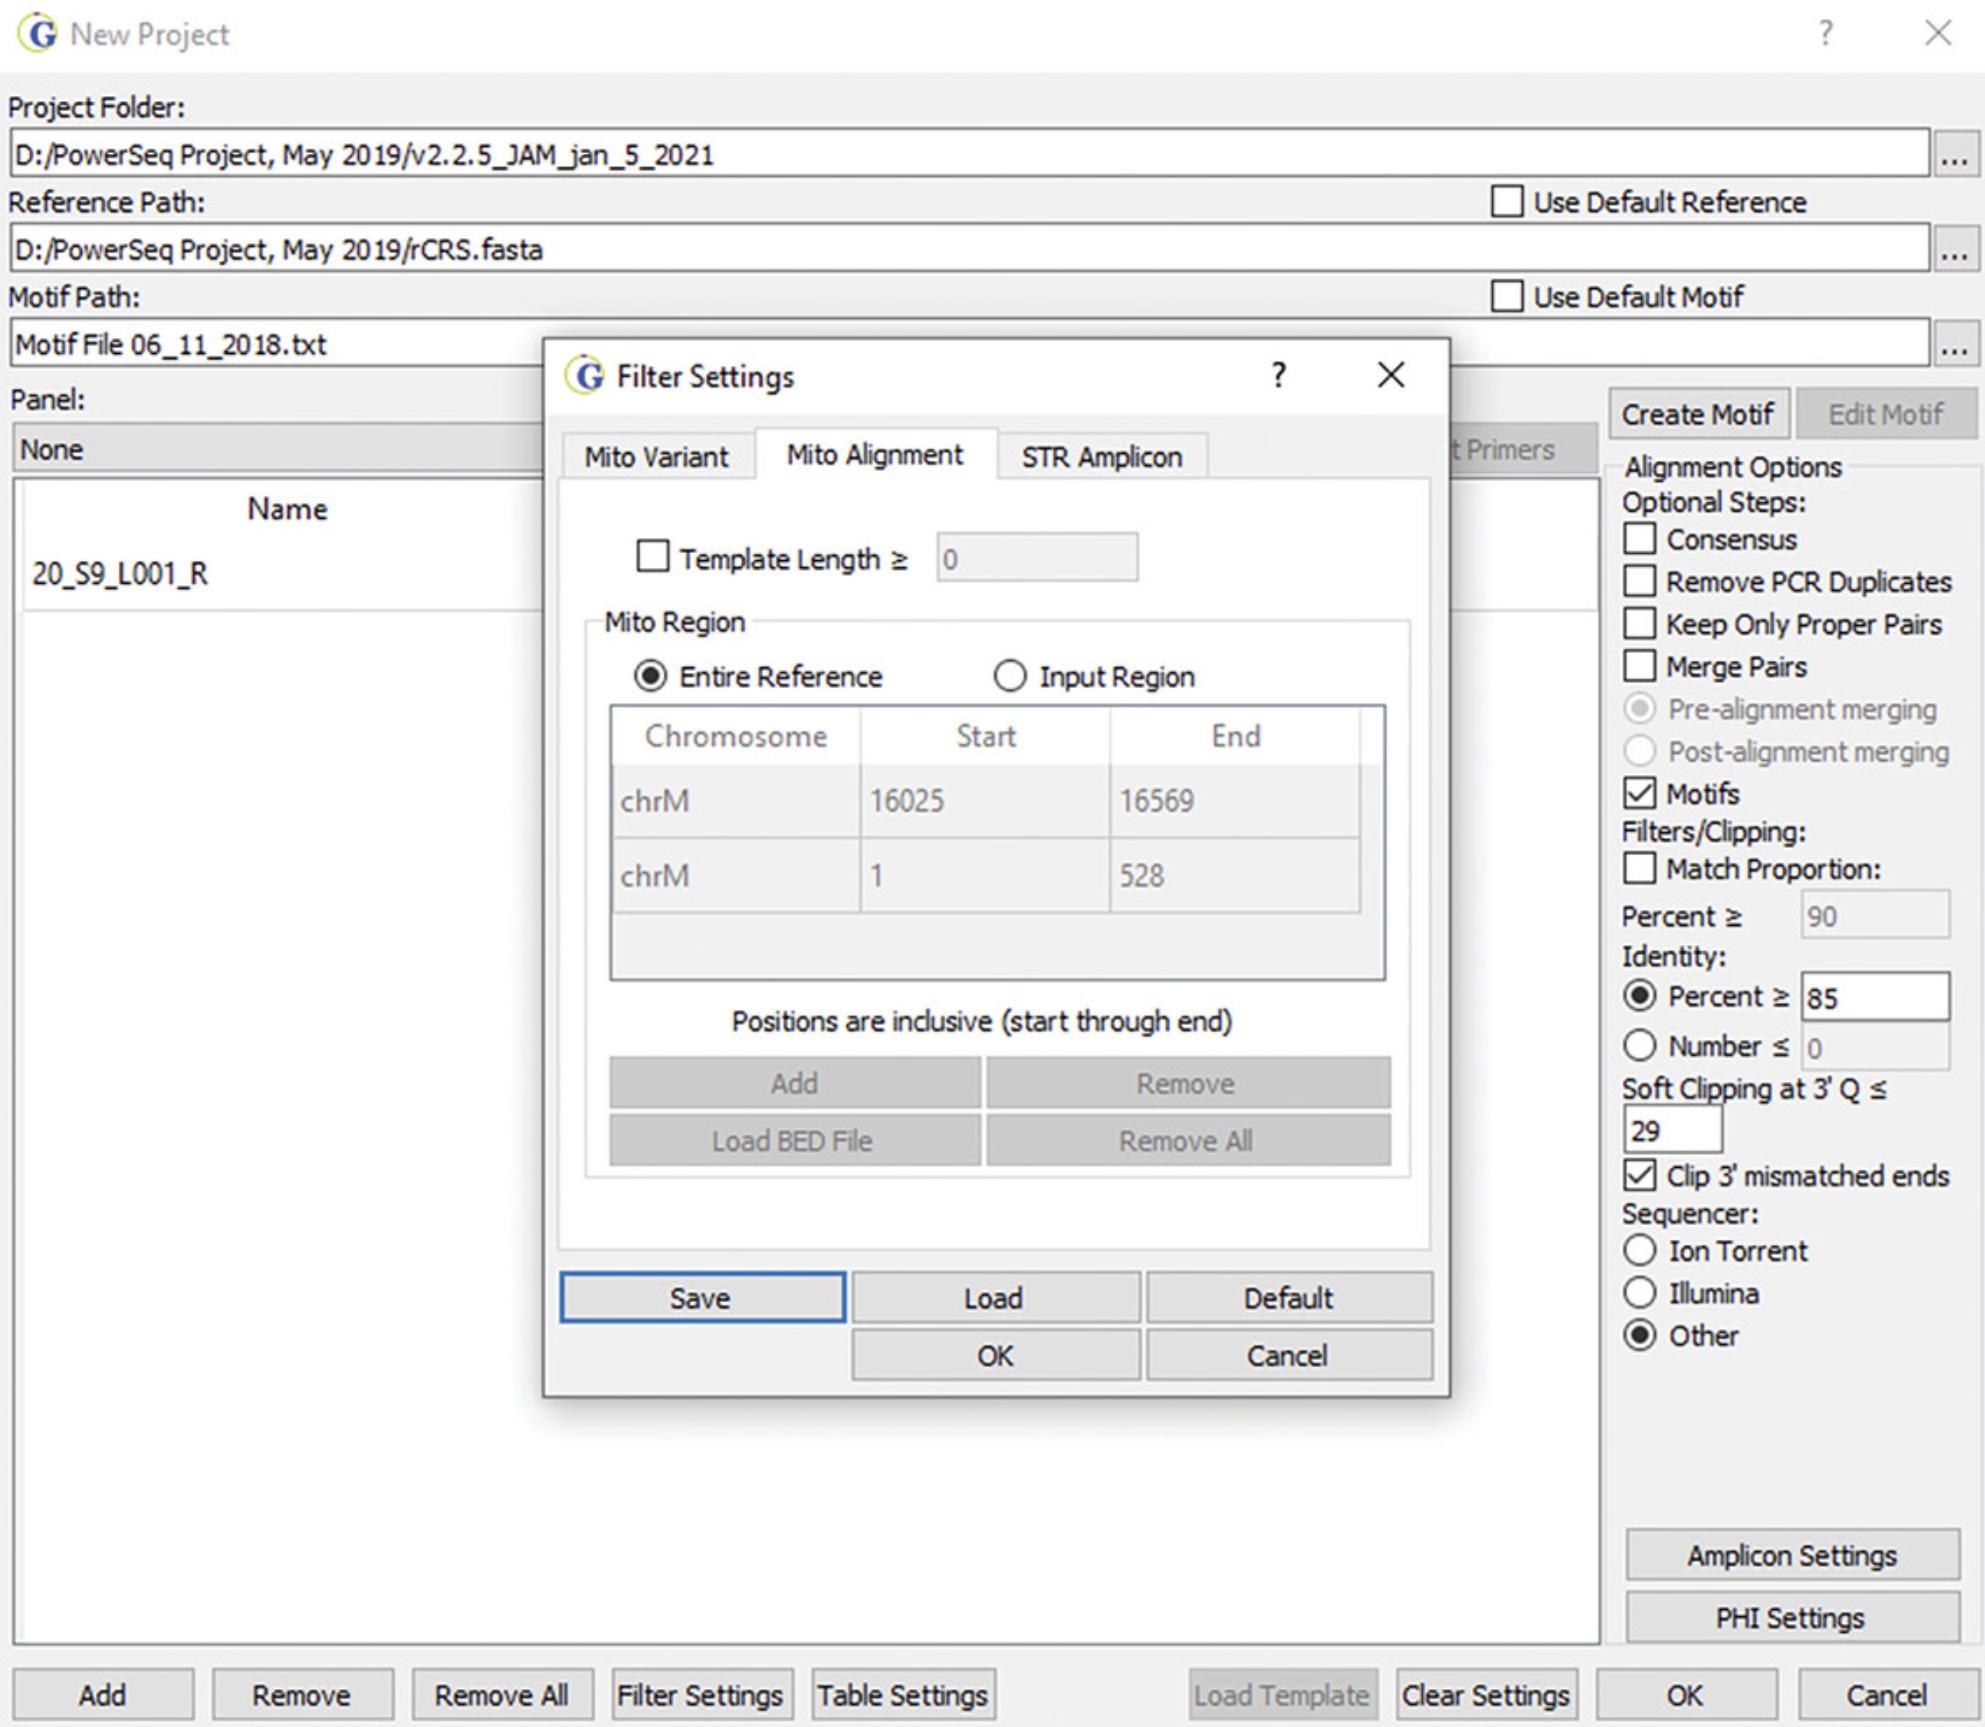
4.Perform soft clipping by selecting the Percent Identity (for example, 85%) and quality score requirements (for example, ≤29) for the last three nucleotides on the end of reads.
5.Select OK.
6.Open the GeneMarker® HTS software. To open a completed project file, select Open and navigate to the file.
7.Assess the following items for each sample:
-
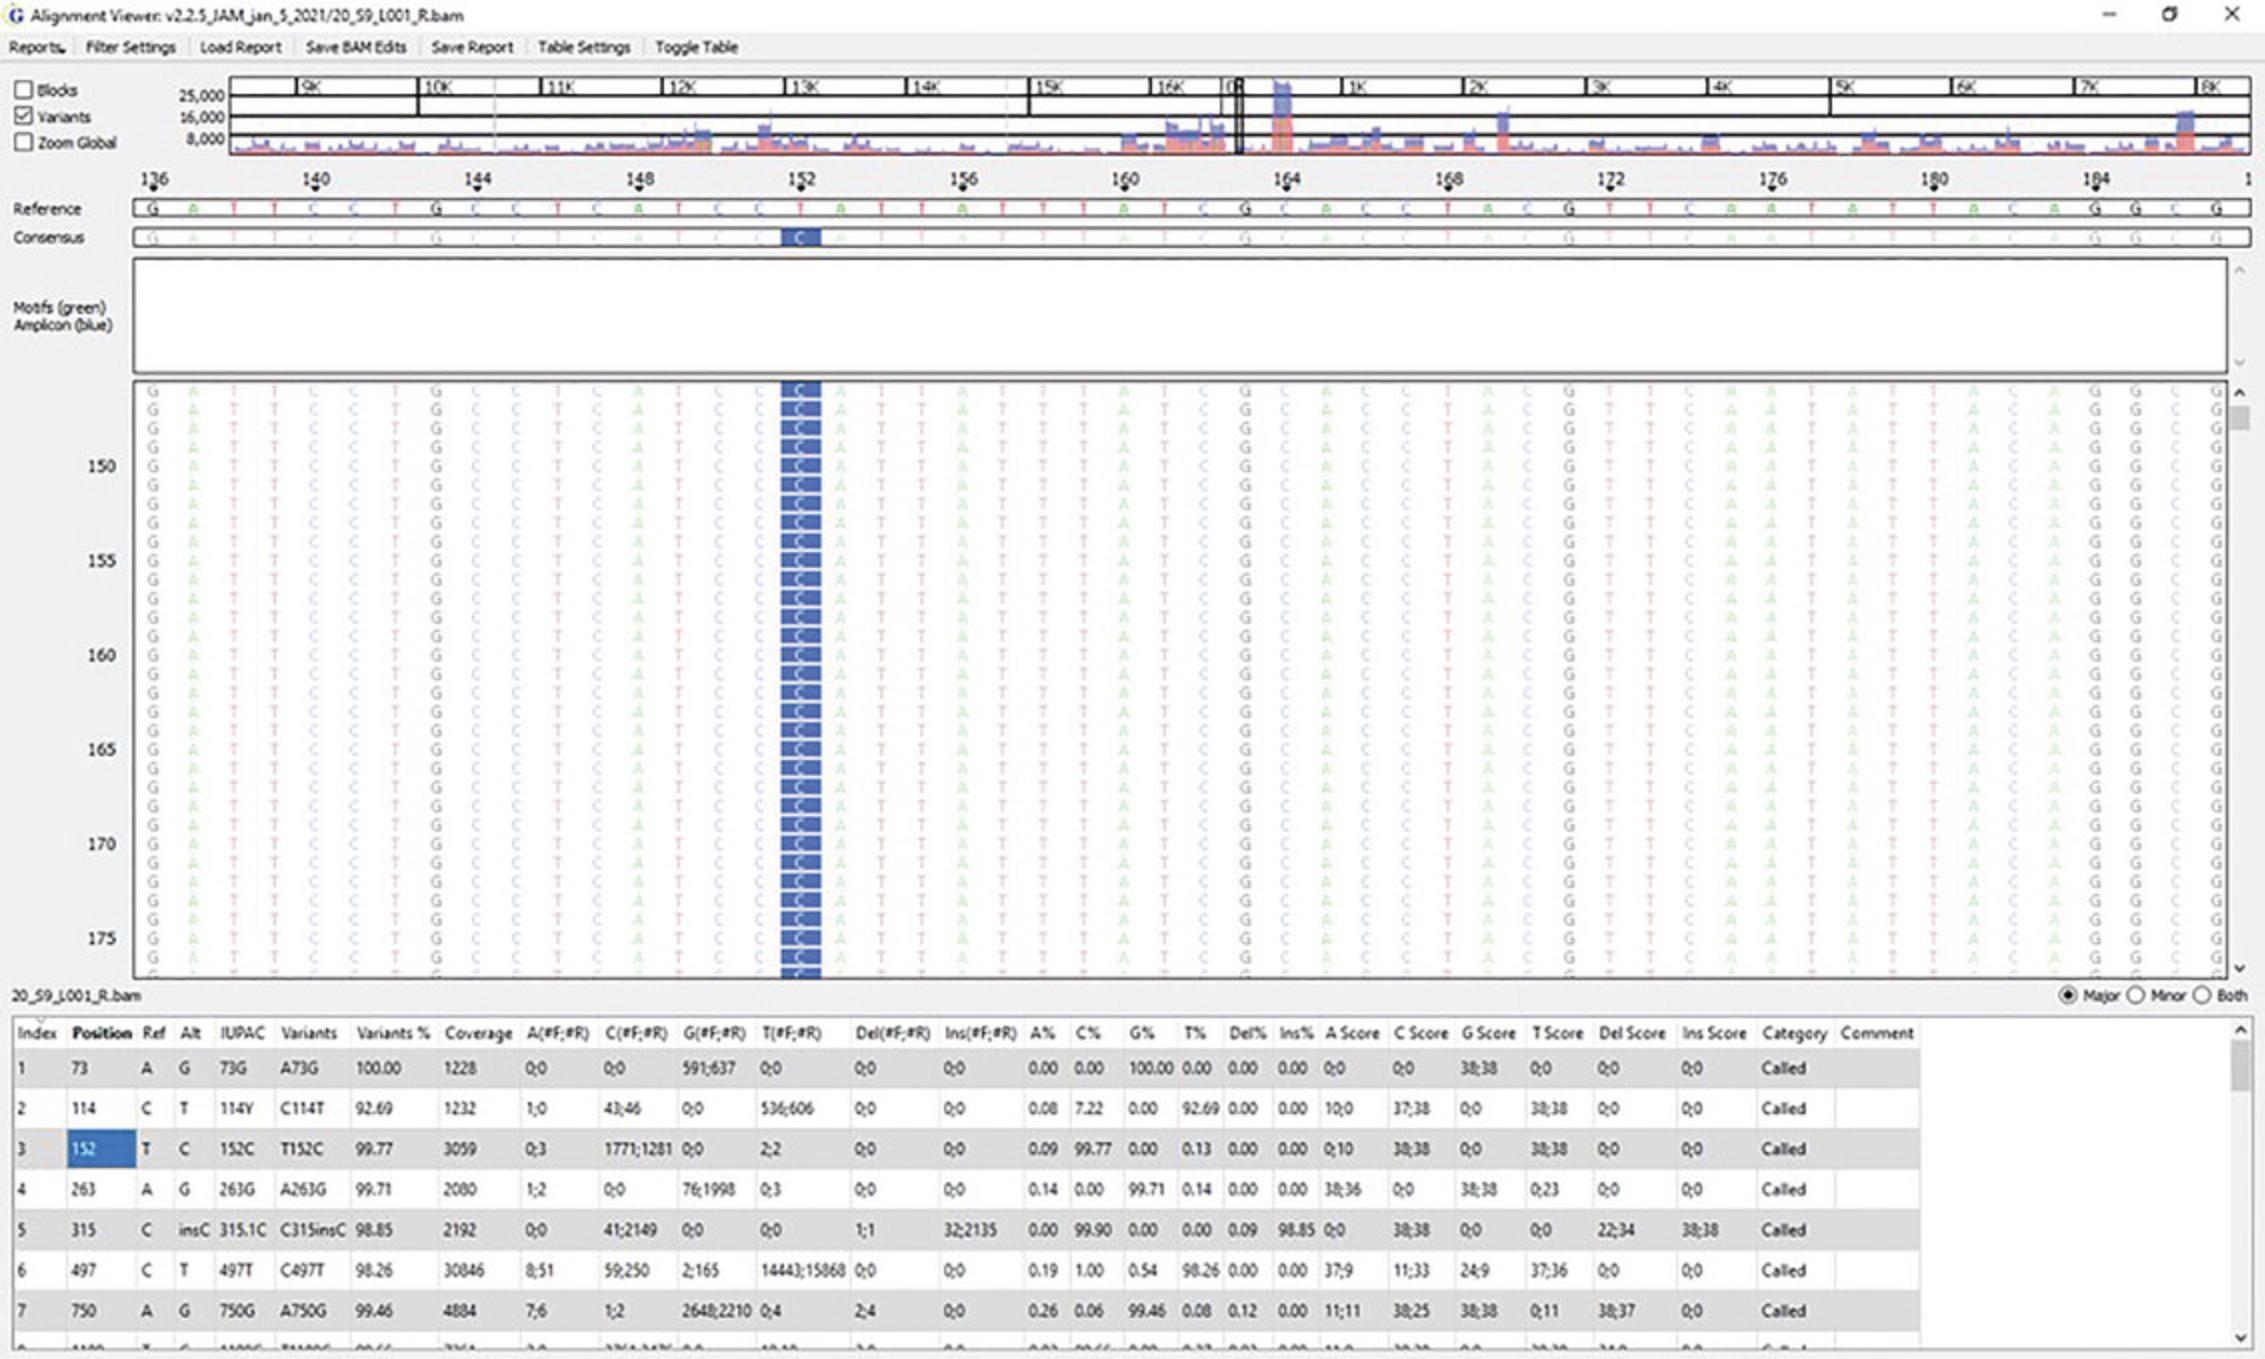
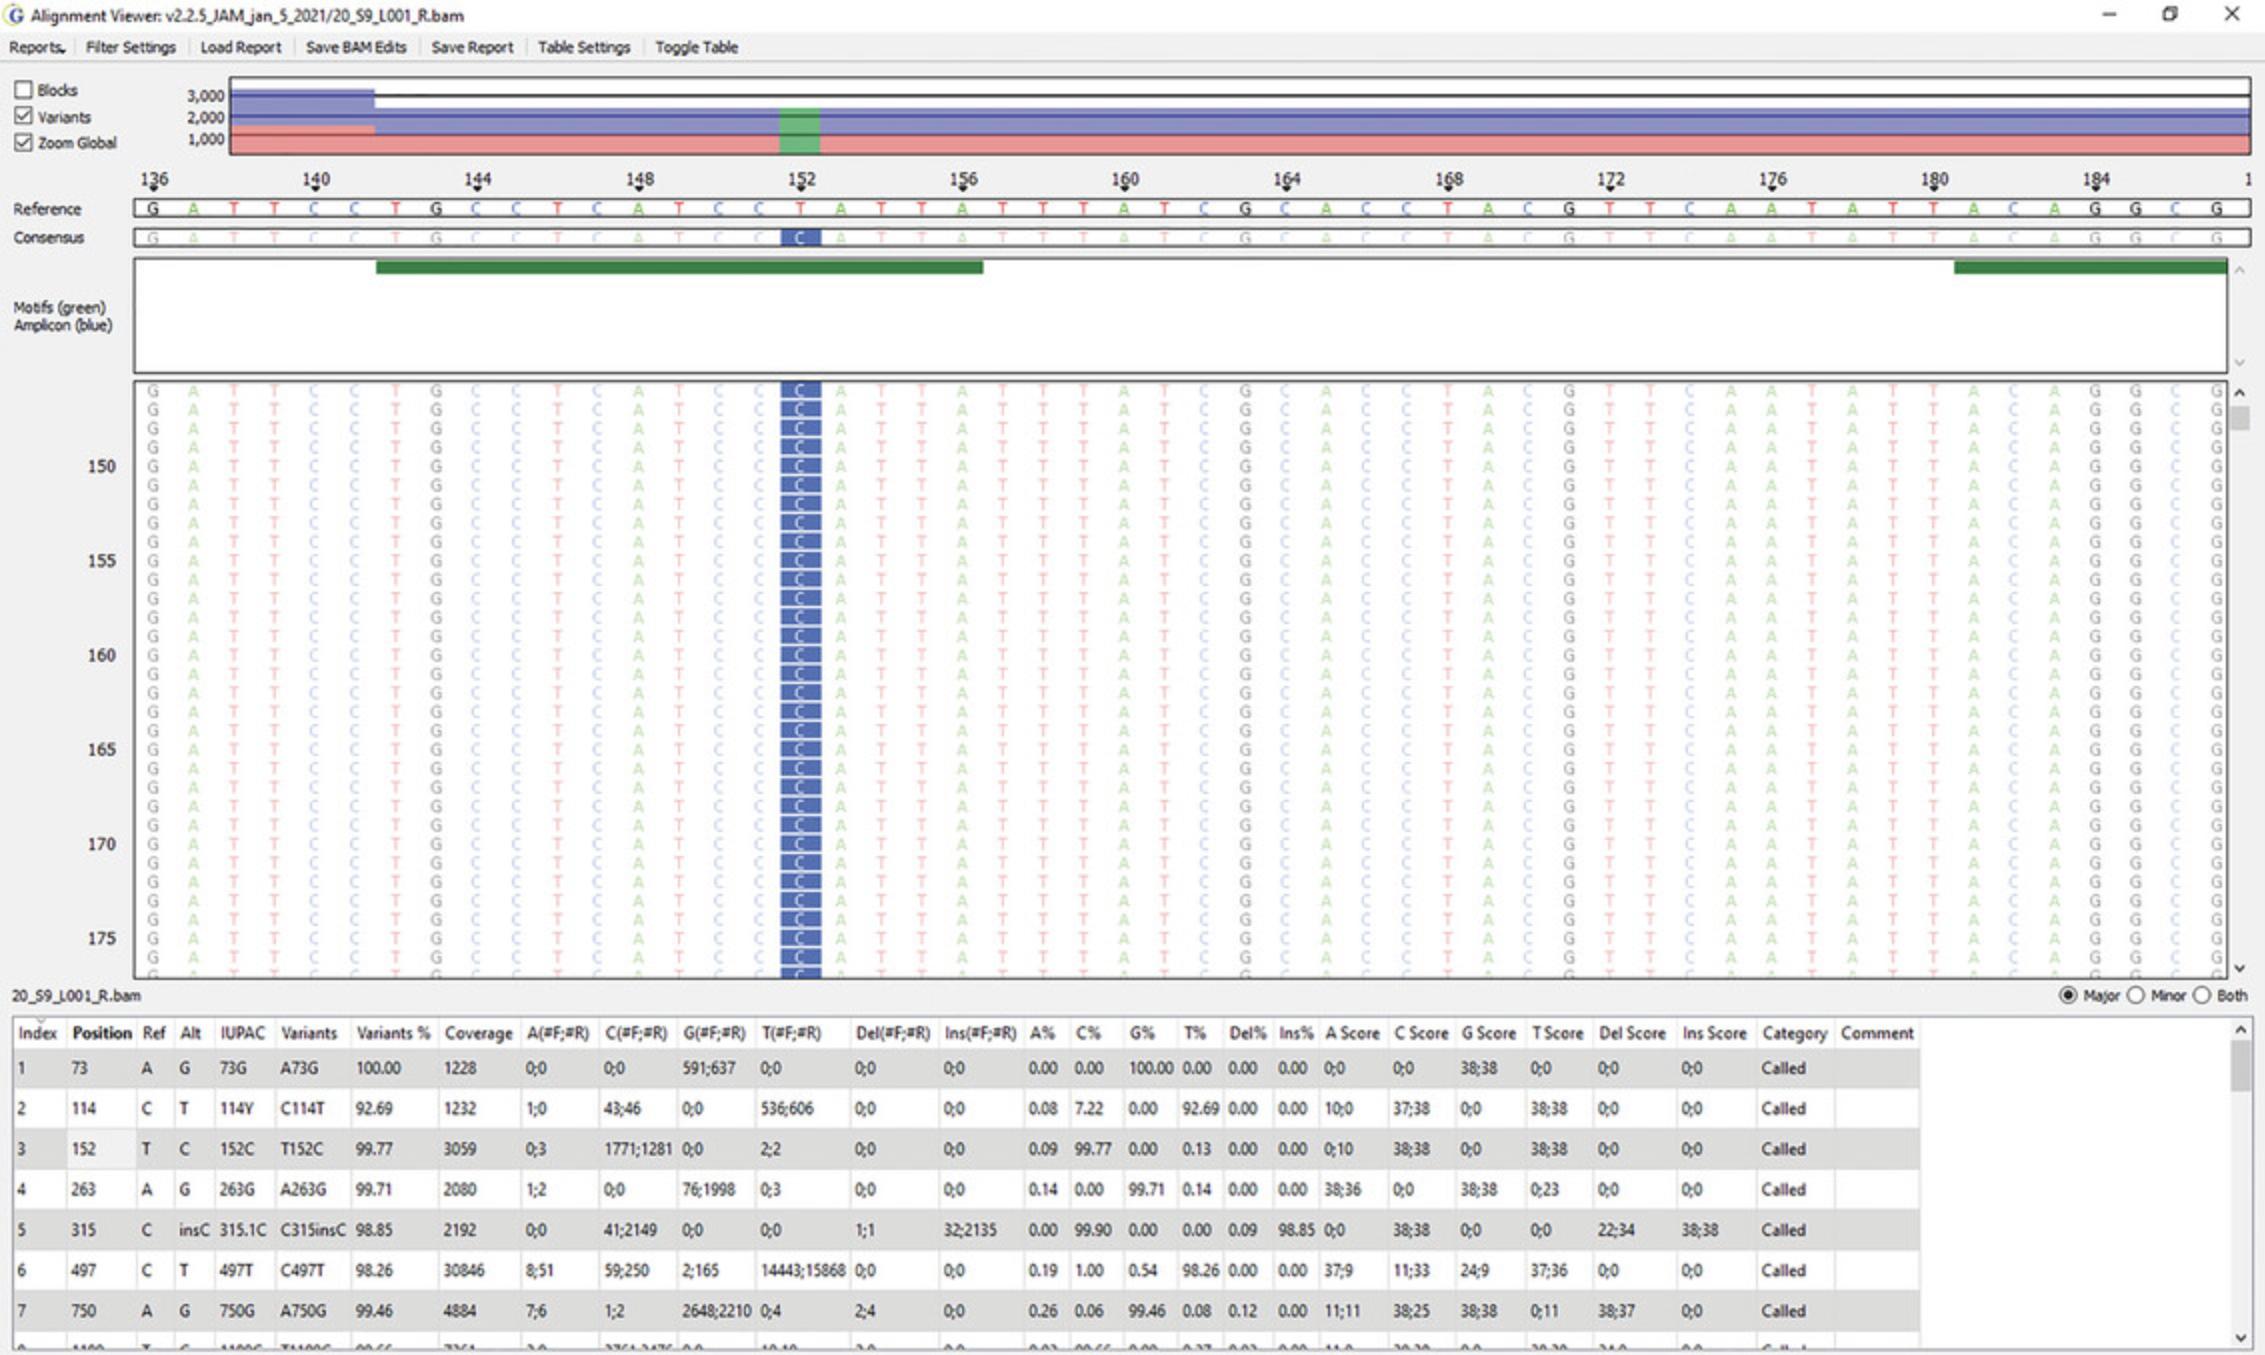
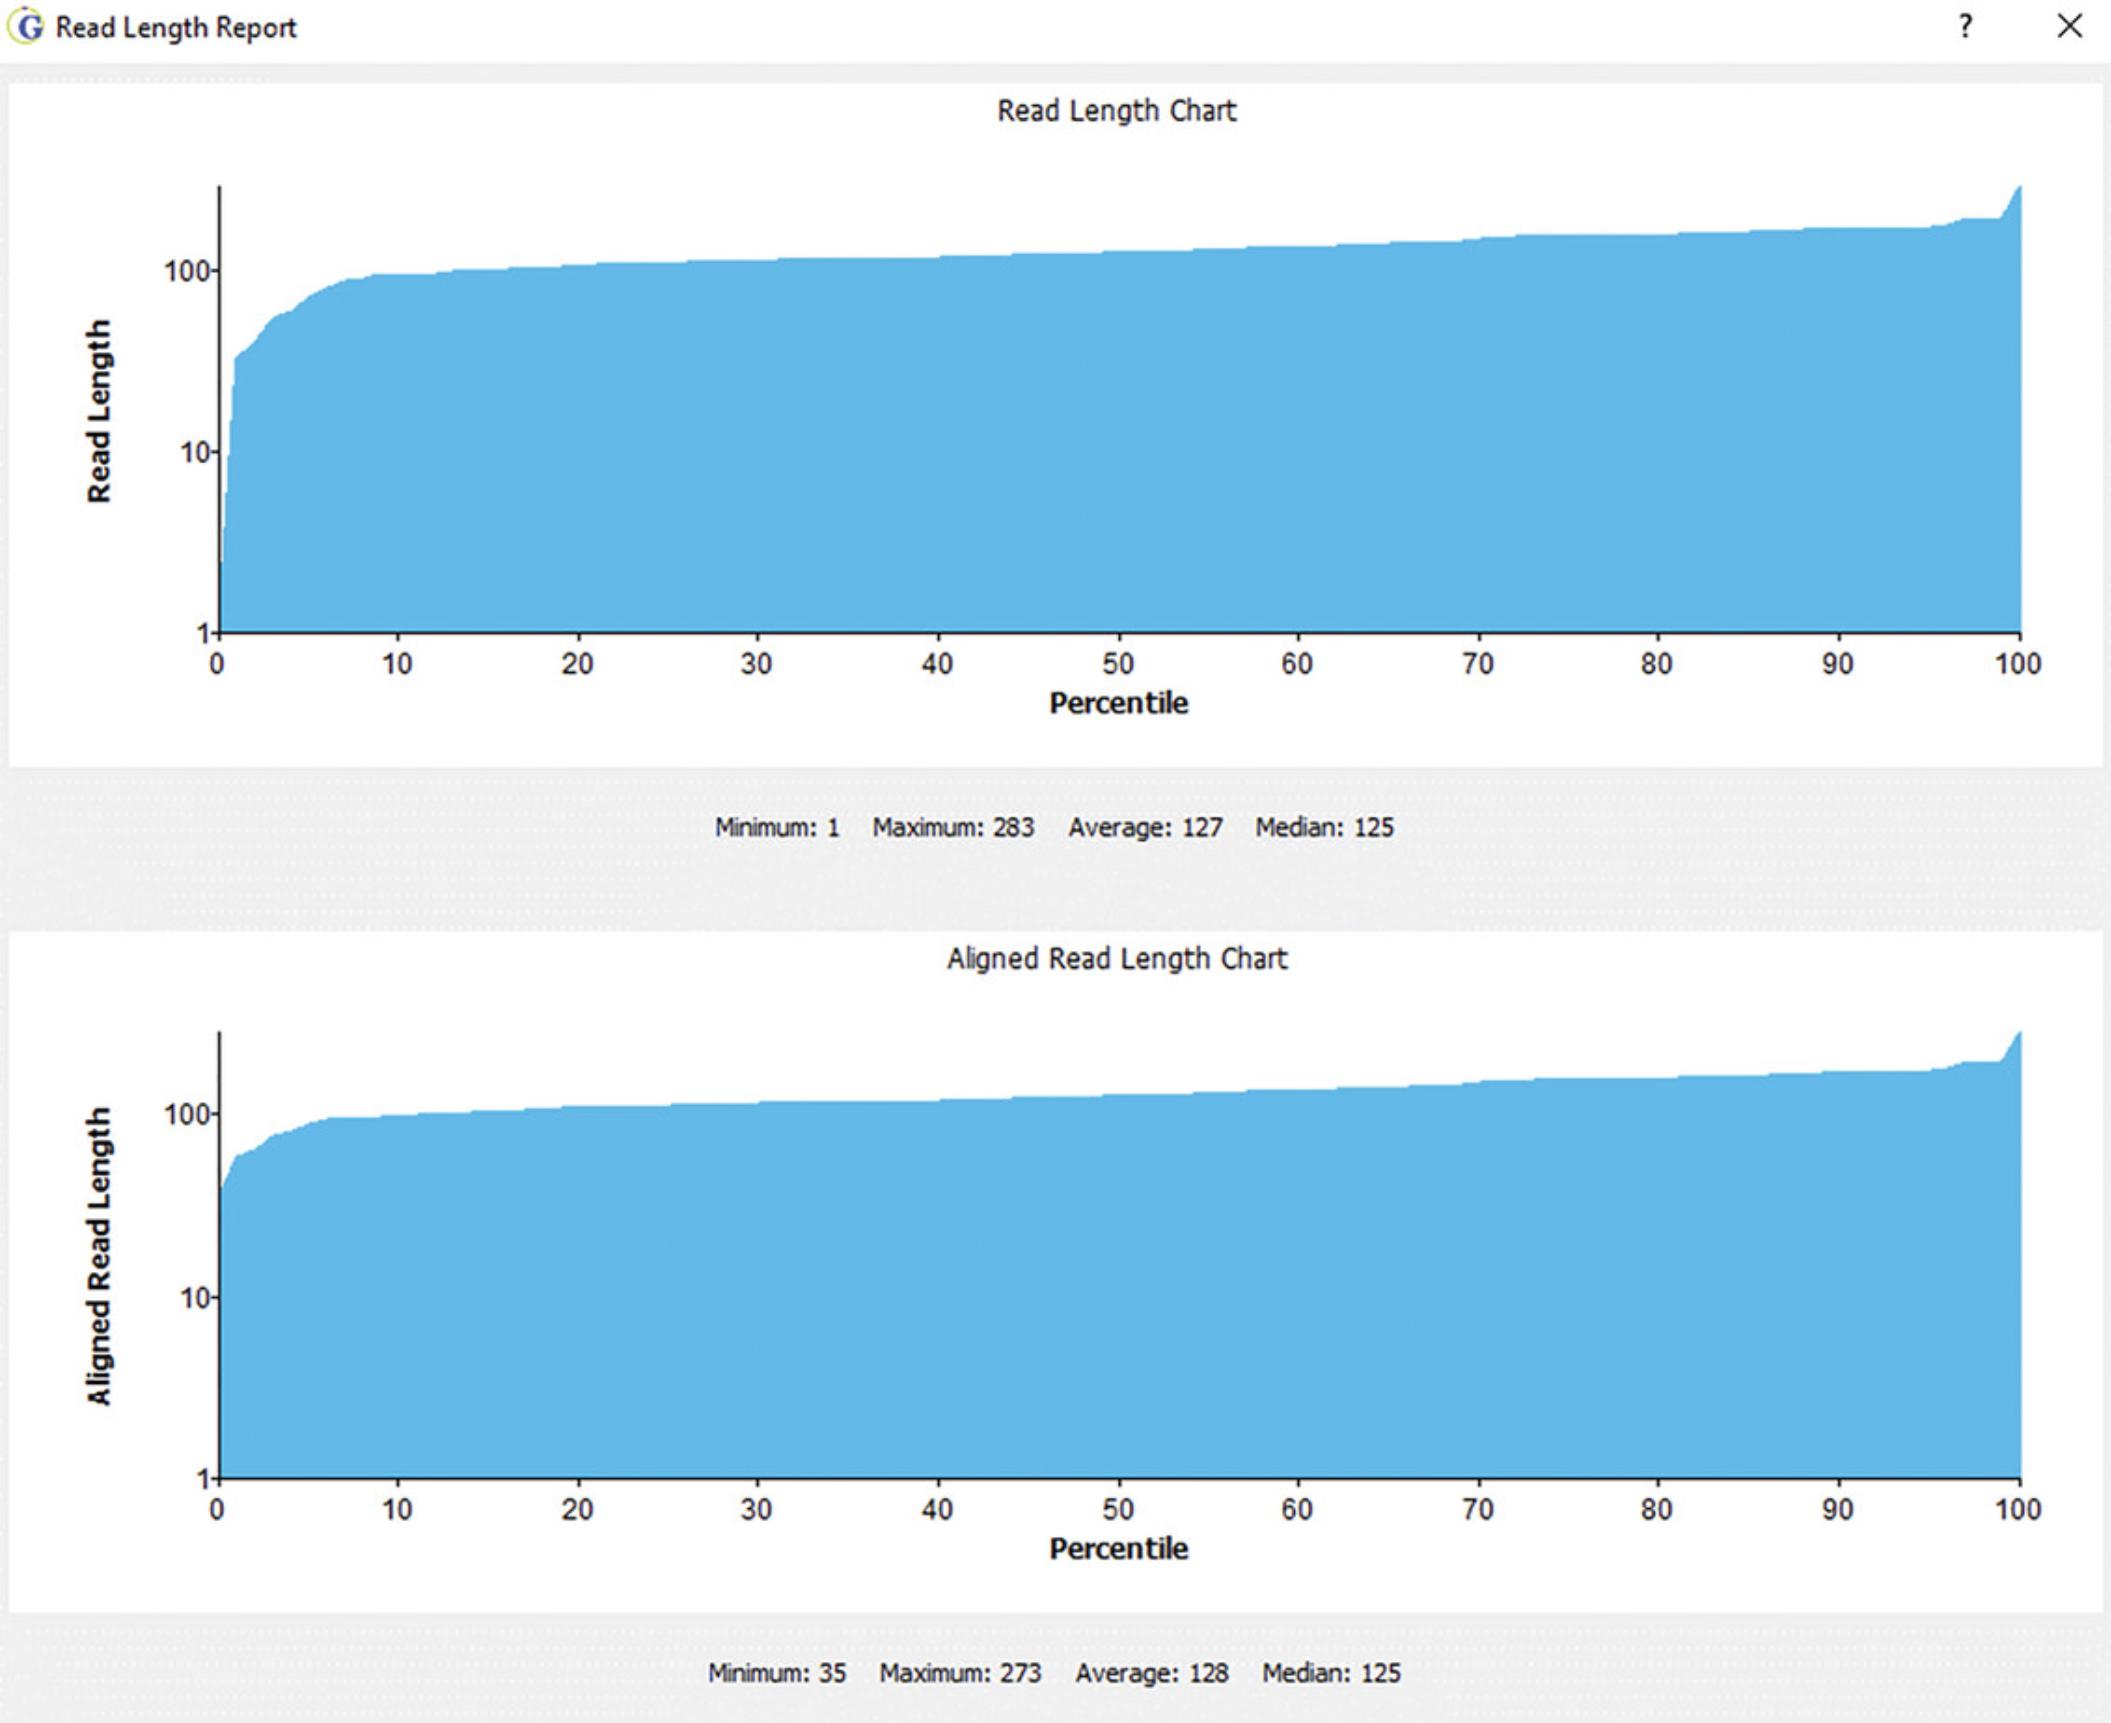
The distribution of reads across the mitogenome: The top panel in Figures6and7reflects the read density (y-axis) and the nucleotide position of the mitogenome (x-axis). This can be viewed on a global (Fig.6) or local (Fig.7) level.
-
Individual nucleotide positions in the haplotype: Figure7is a zoomed-in version of nucleotide positions 136 to 187. A SNP can be seen at position 152 (T-to-C transition). The Reference sequence (rCRS) can be seen along the top of the pileup, with the consensus sequence of the sample immediately below. The green bars reflect sequence motifs that help to properly align sequences to produce phylogenetically correct haplotypes. Standard motif files are provided with the software, which can be easily customized to capture newly identified haplotype motifs.
-
Major and minor variants: The table at the bottom of Figure7lists major and minor variant calls. Major variants reflect the reportable haplotype of the sample. Minor variants are assessed as possible instances of instrument noise, heteroplasmy, contamination, nuclear mtDNA inserts (NUMTs) (Marshall & Parson,2021), mixtures, and/or the result of DNA damage (Holland et al.,2021; McElhoe & Holland,2020;McElhoe et al., 2022).
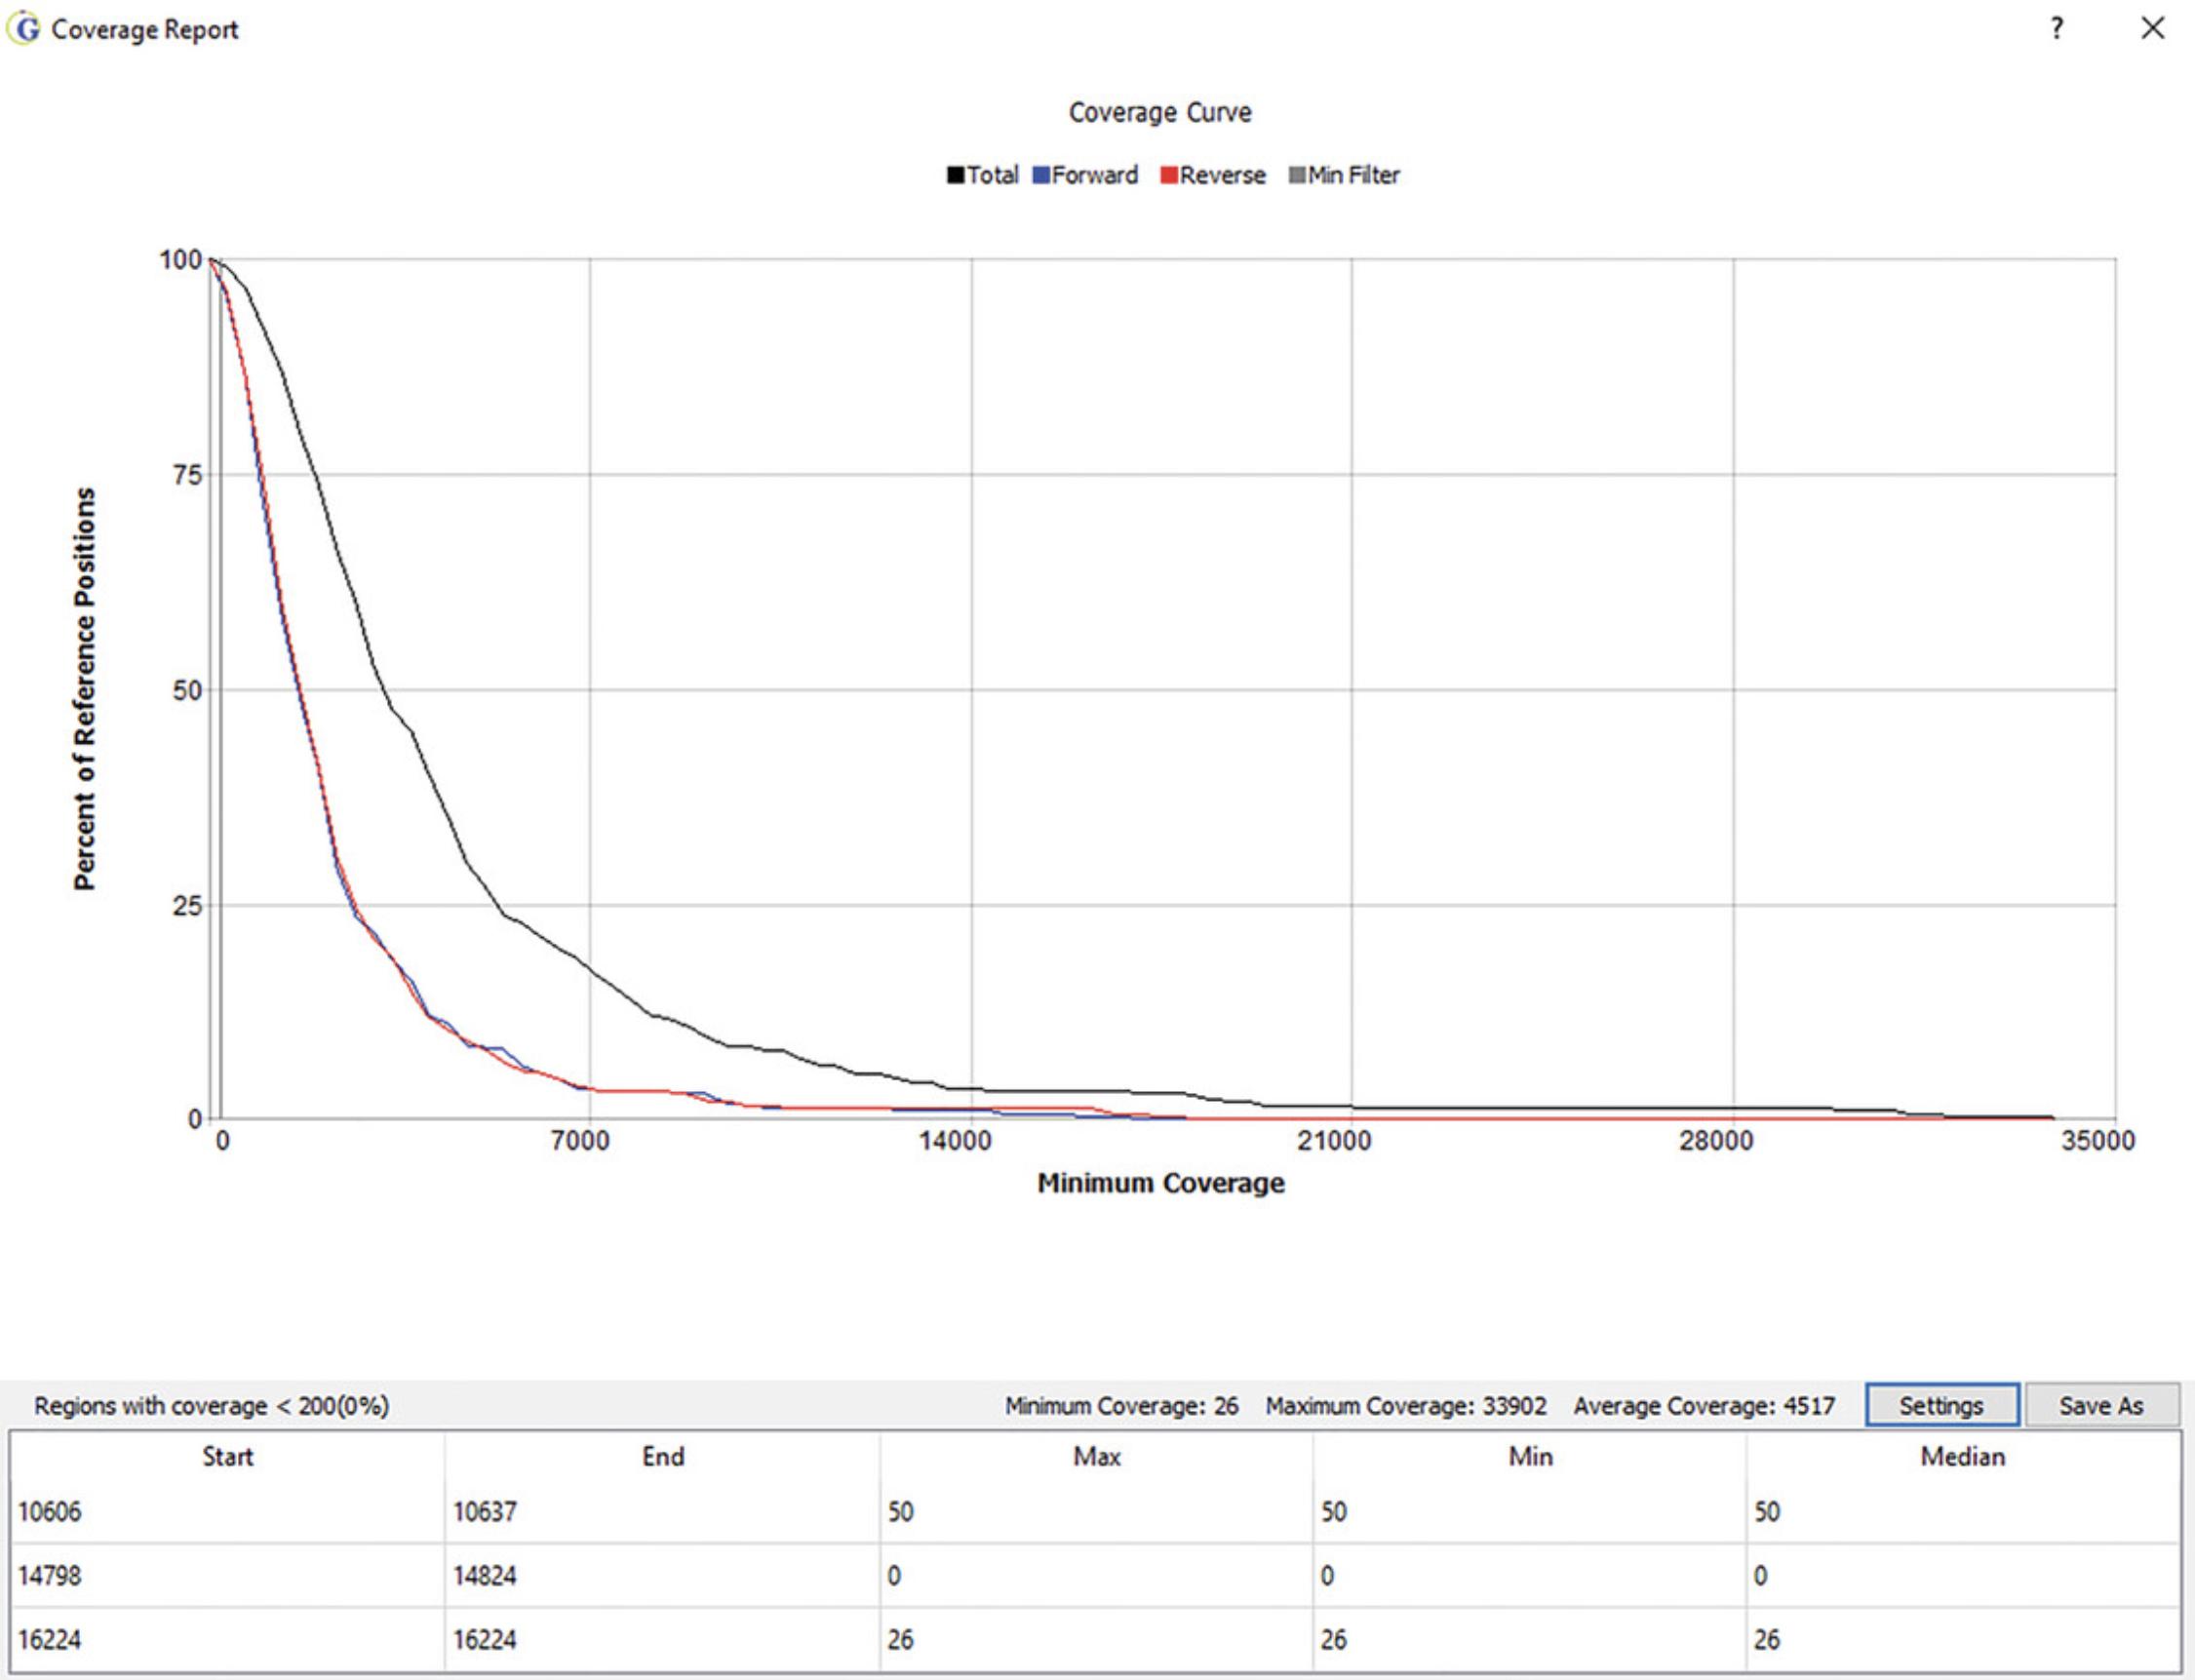
8.Generate reports for each sample.
9.Estimate haplogroup assignments and generate weight estimates associated with a match between forensic evidence and reference sequences by searching haplotypes generated from major variant calls in EMPOP (www.empop.online).
COMMENTARY
Background Information
Readers should refer to Canale et al. (2022) for research findings associated with mitogenome MPS analysis of small fragments of human hair shafts. Although hair shafts are a common evidence type in forensic cases, they are often excluded from DNA analysis due to their limited DNA quantity and quality. Sequencing of mtDNA is the method of choice when working with rootless hair shaft fragments due to the elevated copy number of mtDNA and the highly degraded nature of nuclear DNA (nDNA) (Brandhagen et al., 2018). Using an MPS approach, the impact of hair age (time since collection) and physical characteristics (hair diameter, medullary structure, and length of hair tested) was studied, focusing on mtDNA recovery and MPS data quality. Hair shaft cuttings of 1 and 5 mm from hairs from <5 to 27 years of age from 37 donors were characterized microscopically. Mitogenome sequences were then generated using the protocols described herein. Reproducible mitogenome sequences were obtained from all hairs, with ≥98% of the mitogenome reported. As the age of the hair increased, mtDNA yield decreased, mtDNA degradation increased, and mitogenome MPS data quality declined. In addition, hair diameter and medullary structure had minimal impact on yield and data quality. These findings support that MPS is a robust and reliable method for routinely generating mitogenome sequences from 1 to 5 mm of hair shaft up to 27 years of age. A summary of the findings is provided below.
See Basic Protocol 1 for extraction of DNA from hair shafts and Basic Protocol 2 for quantification of mtDNA copies per microliter of DNA extract. The recovery of mtDNA from hair shafts decreased significantly with age and length (Fig. 10). Boxplots for the comparison of mtDNA quantity for each age group (Recent = <5 years; Old = 5 to 27 years old) and length (n = 74; Recent = 26, Old = 48) illustrate comparisons with significant p -values (p < .05). The “x” annotations represent the mean, and the line represents the median.
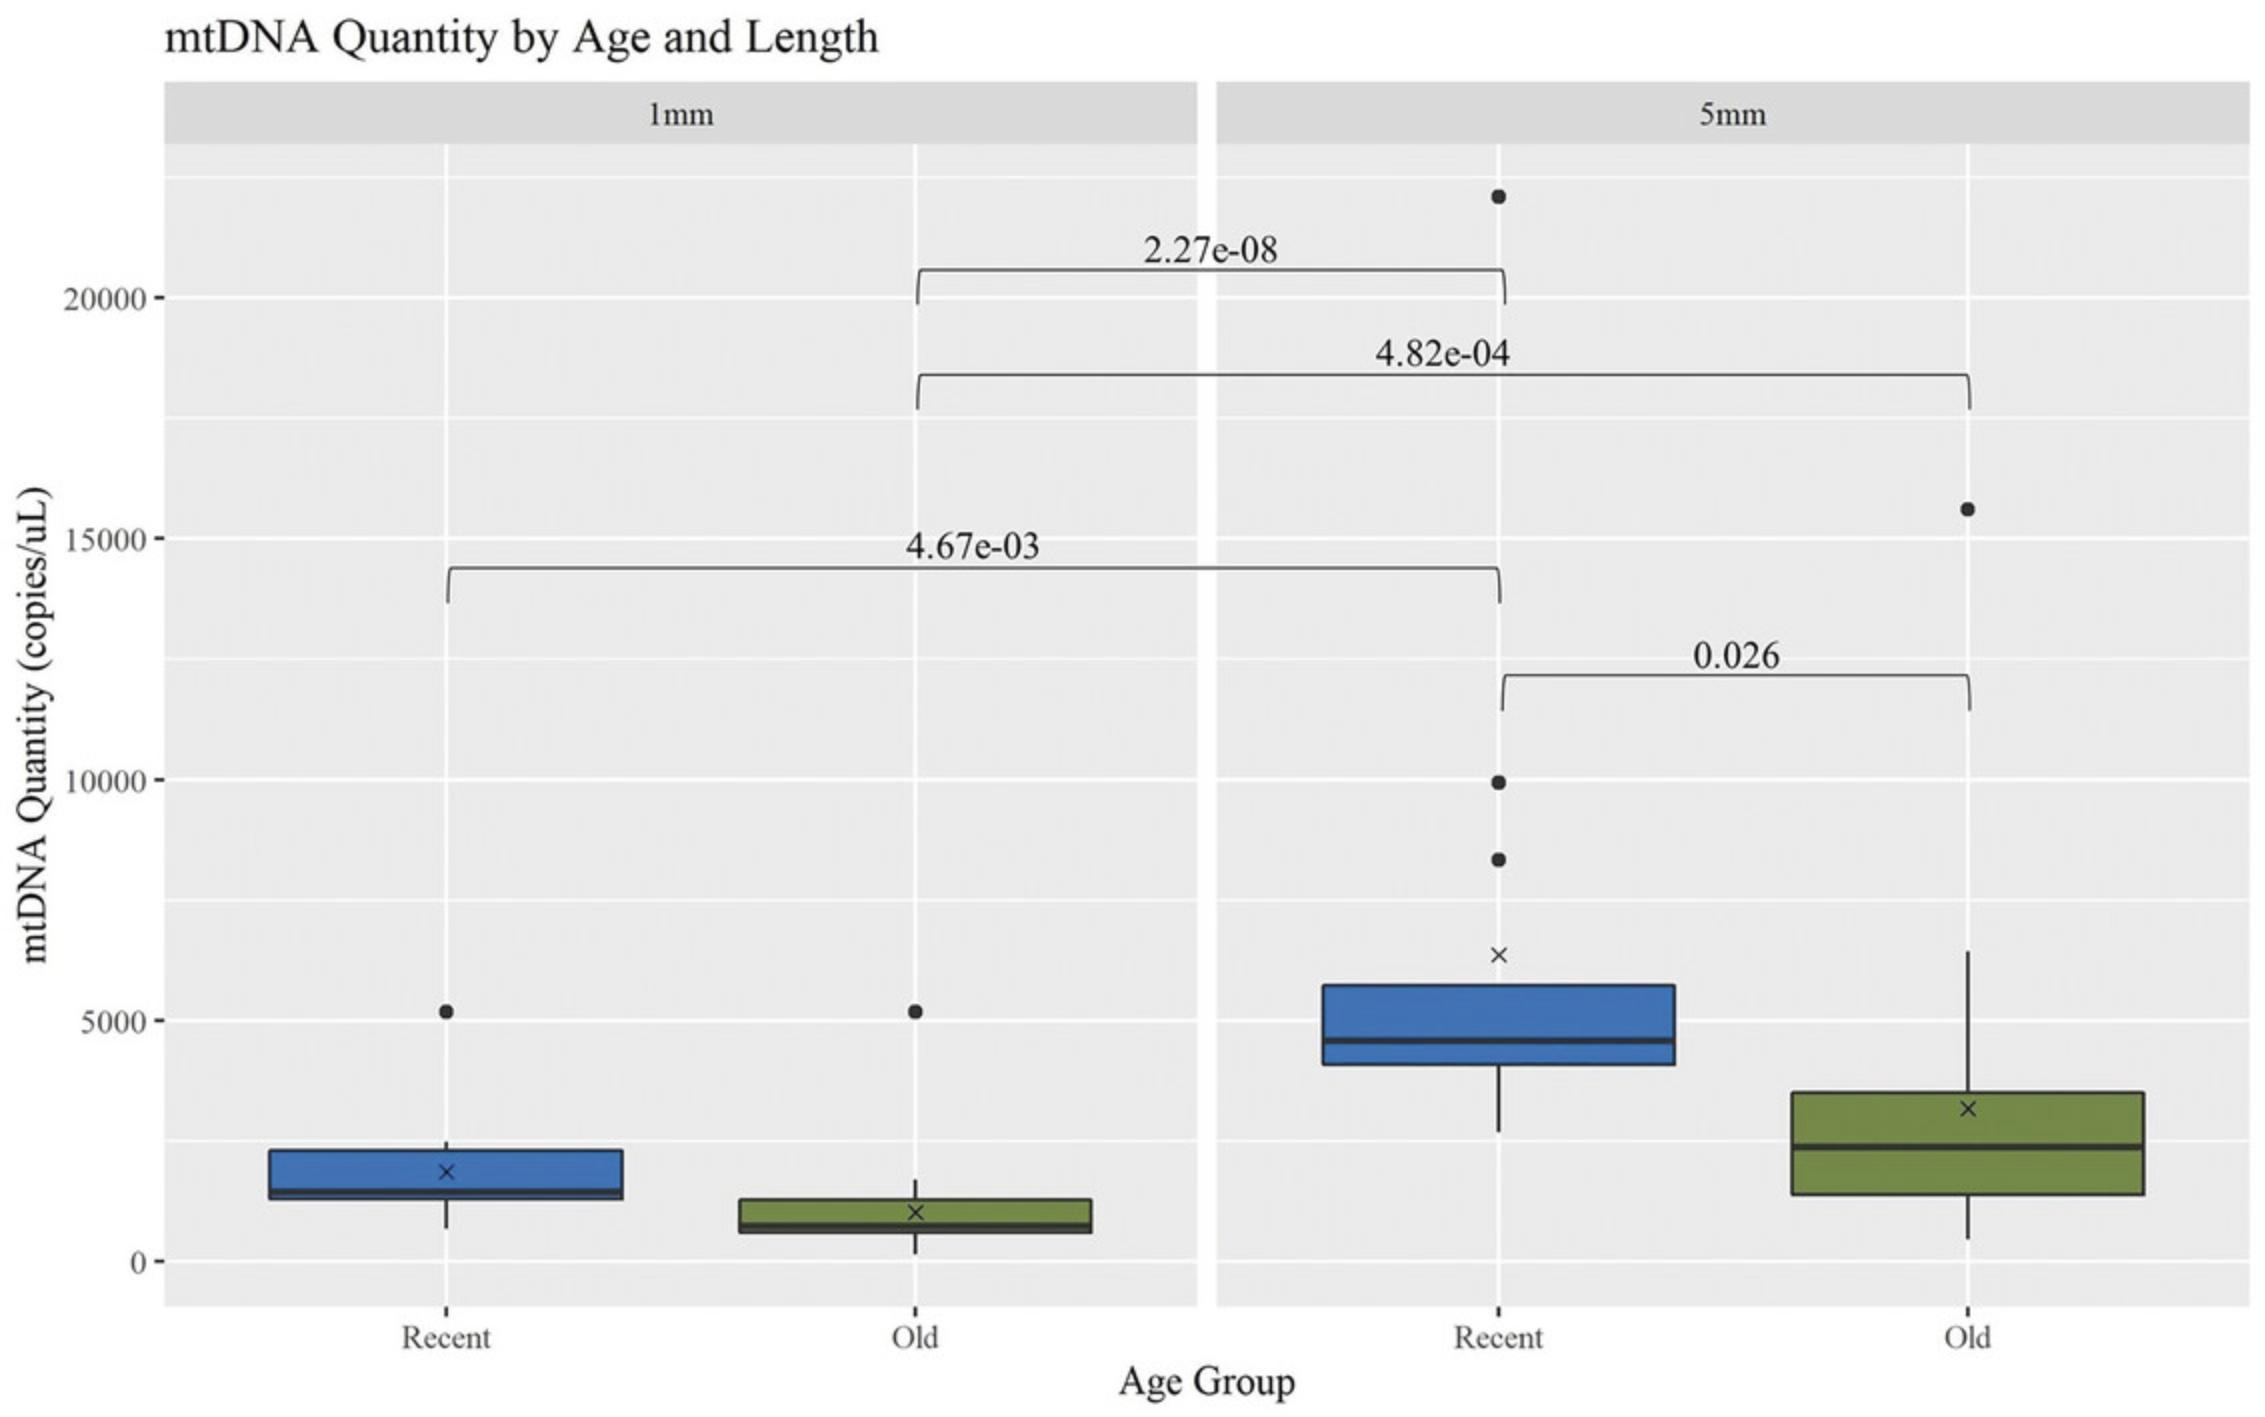
When considering the 5-mm hair cuttings, the Recent hairs had significantly more mtDNA recovered, with a p -value of .026. Comparing across the lengths, the Recent 5-mm hair extracts had significantly more mtDNA than all of the 1-mm extracts, with p -values of 4.67 × 10⁻³ for Recent hairs and 2.27 × 10⁻⁸ for Old hairs. The Old 5-mm hair extracts also had a significantly higher mtDNA yield than the Old 1-mm extracts, with a p -value of 4.82 × 10⁻⁴. This was consistent with the expectation that as more hair is extracted, more mtDNA is recovered, and as samples age, less DNA is available due to factors such as degradation and damage (Melton et al., 2005).
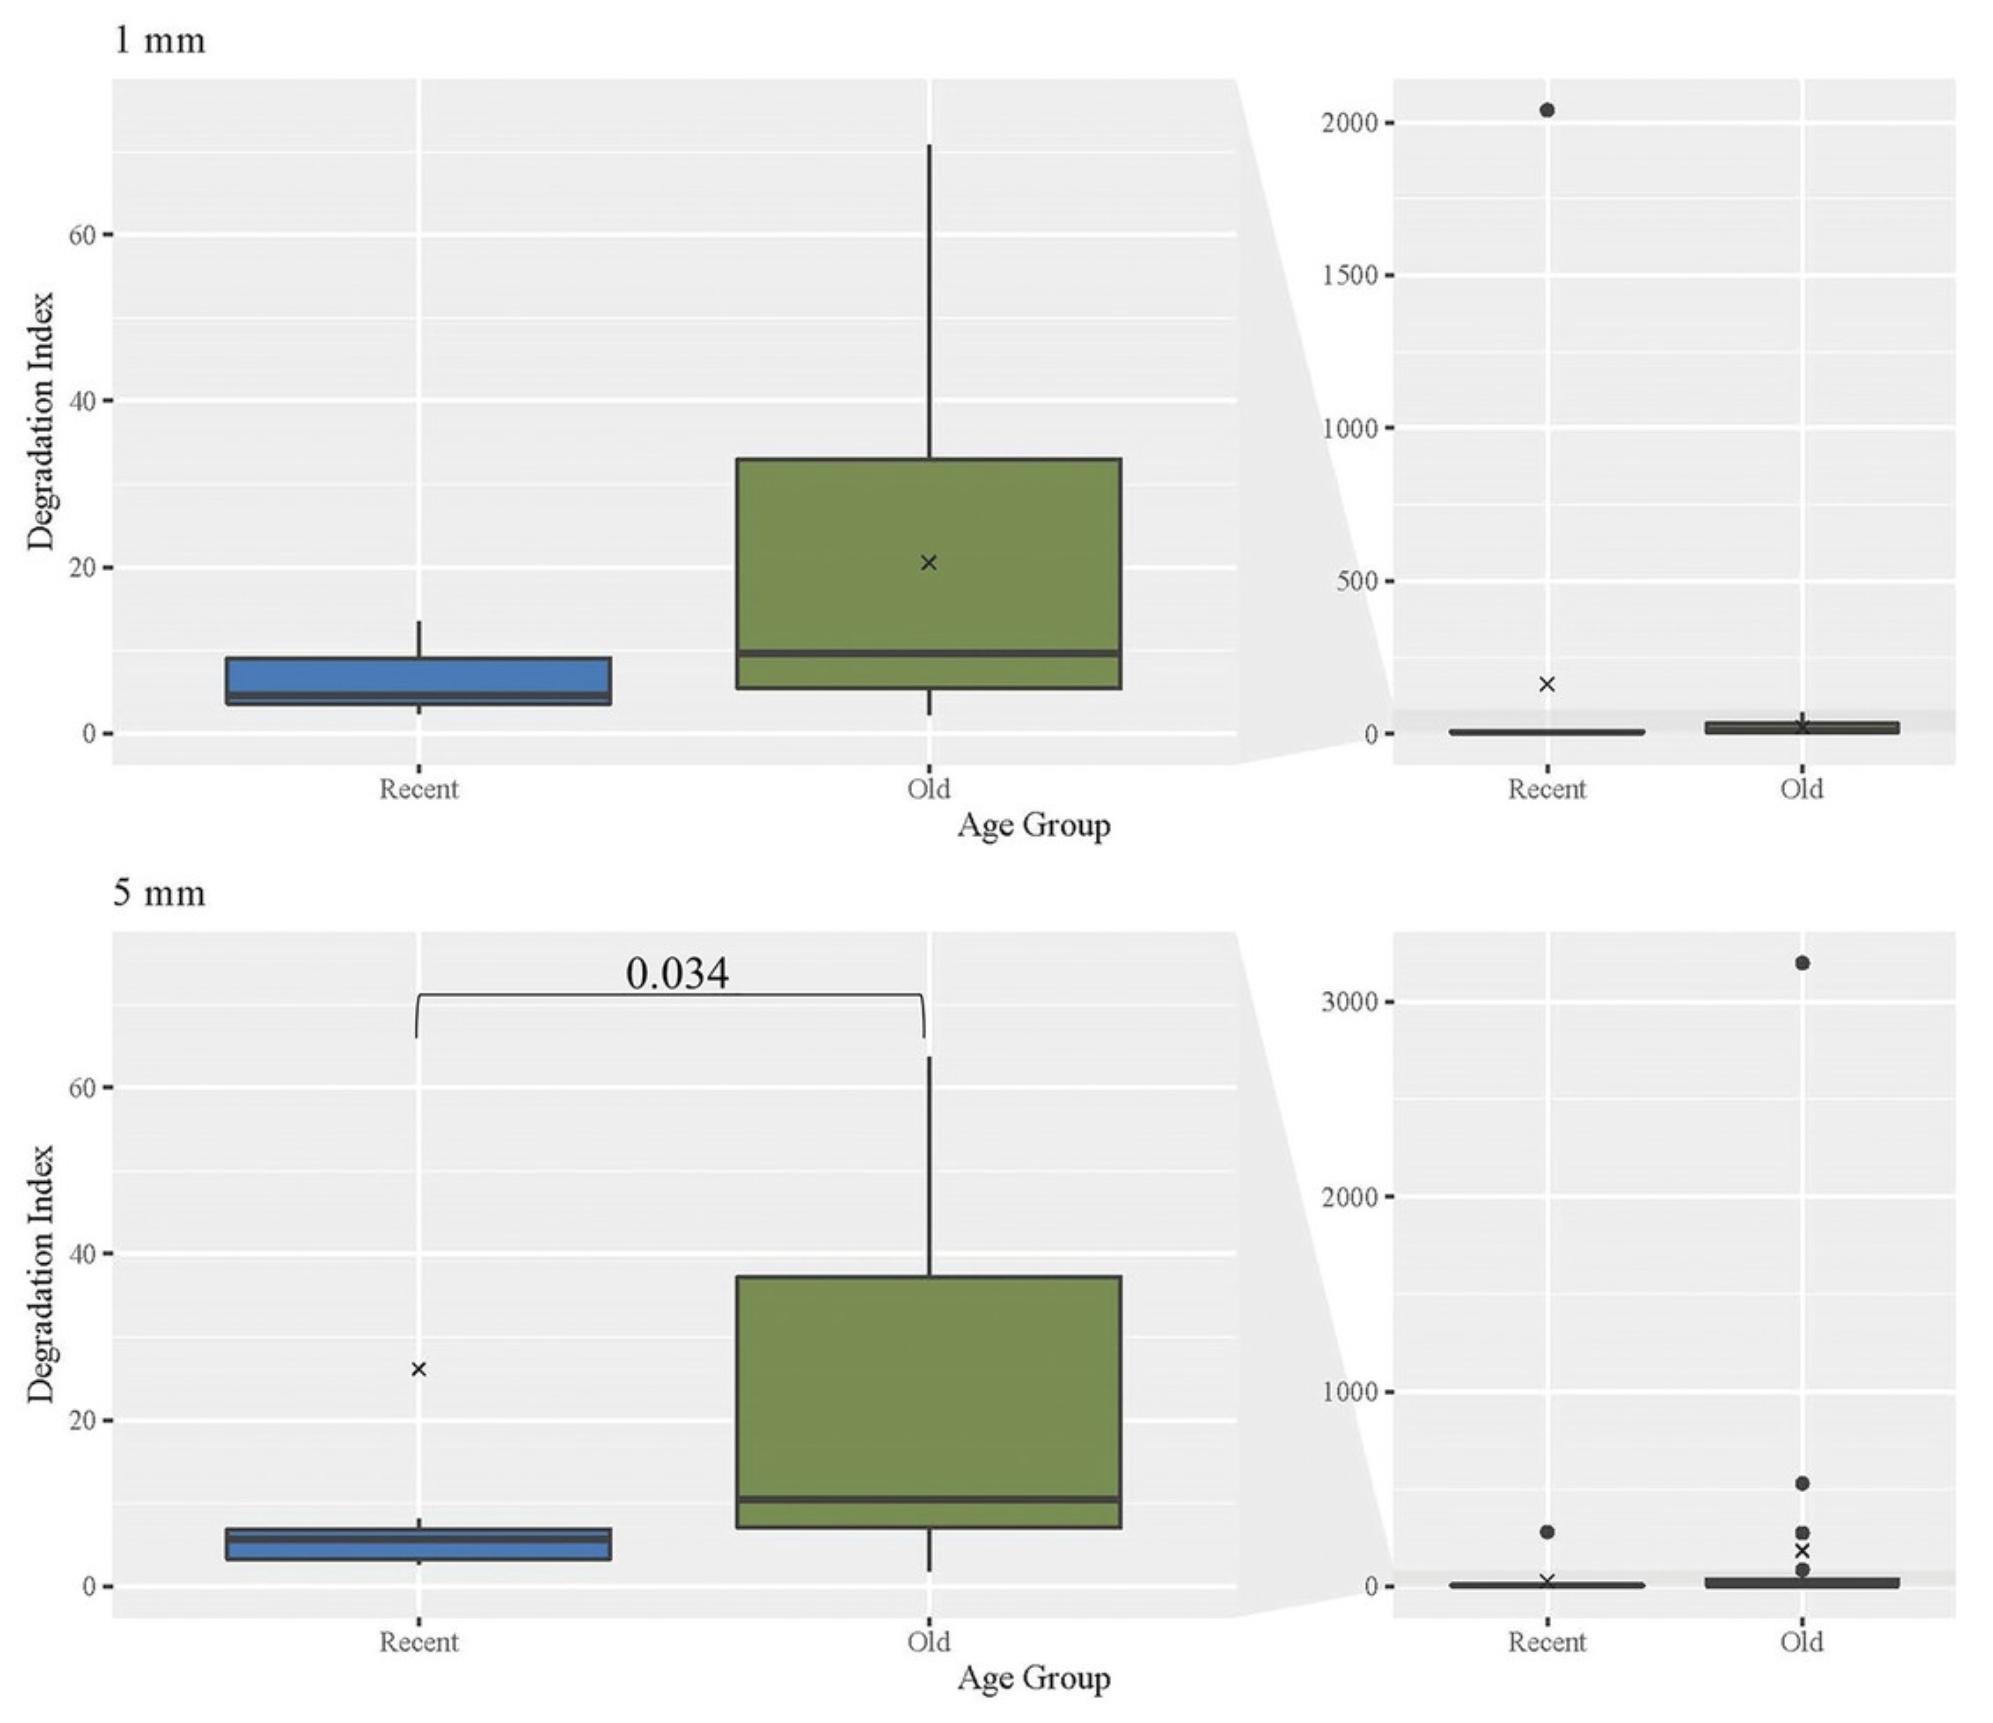
DNA damage can lead to degradation and the inability of targets of interest to be amplified (Holland et al., 2021). The DI for hair extracts is determined by calculating the ratio of the small to the large quantities of DNA (see Basic Protocol 2). For samples where the large target value is undetermined, the quantity value can be artificially set to the lowest datapoint in the standard curve (10 copies/μl) to allow a DI to be calculated. As expected, DIs increased significantly with age (Fig. 11). The Old hairs had a significantly higher DI than the Recent hairs of the same length, with a p -value of .034 for Recent 5-mm hairs. However, no other comparisons regarding age or length were significant. Of particular note, the Old hairs had relatively low average DIs, suggesting that hairs up to 27 years of age do not generally experience significant mtDNA degradation. As before, boxplots are provided for the comparison of DIs for each age group and length (n = 74; Recent = 26, Old = 48).
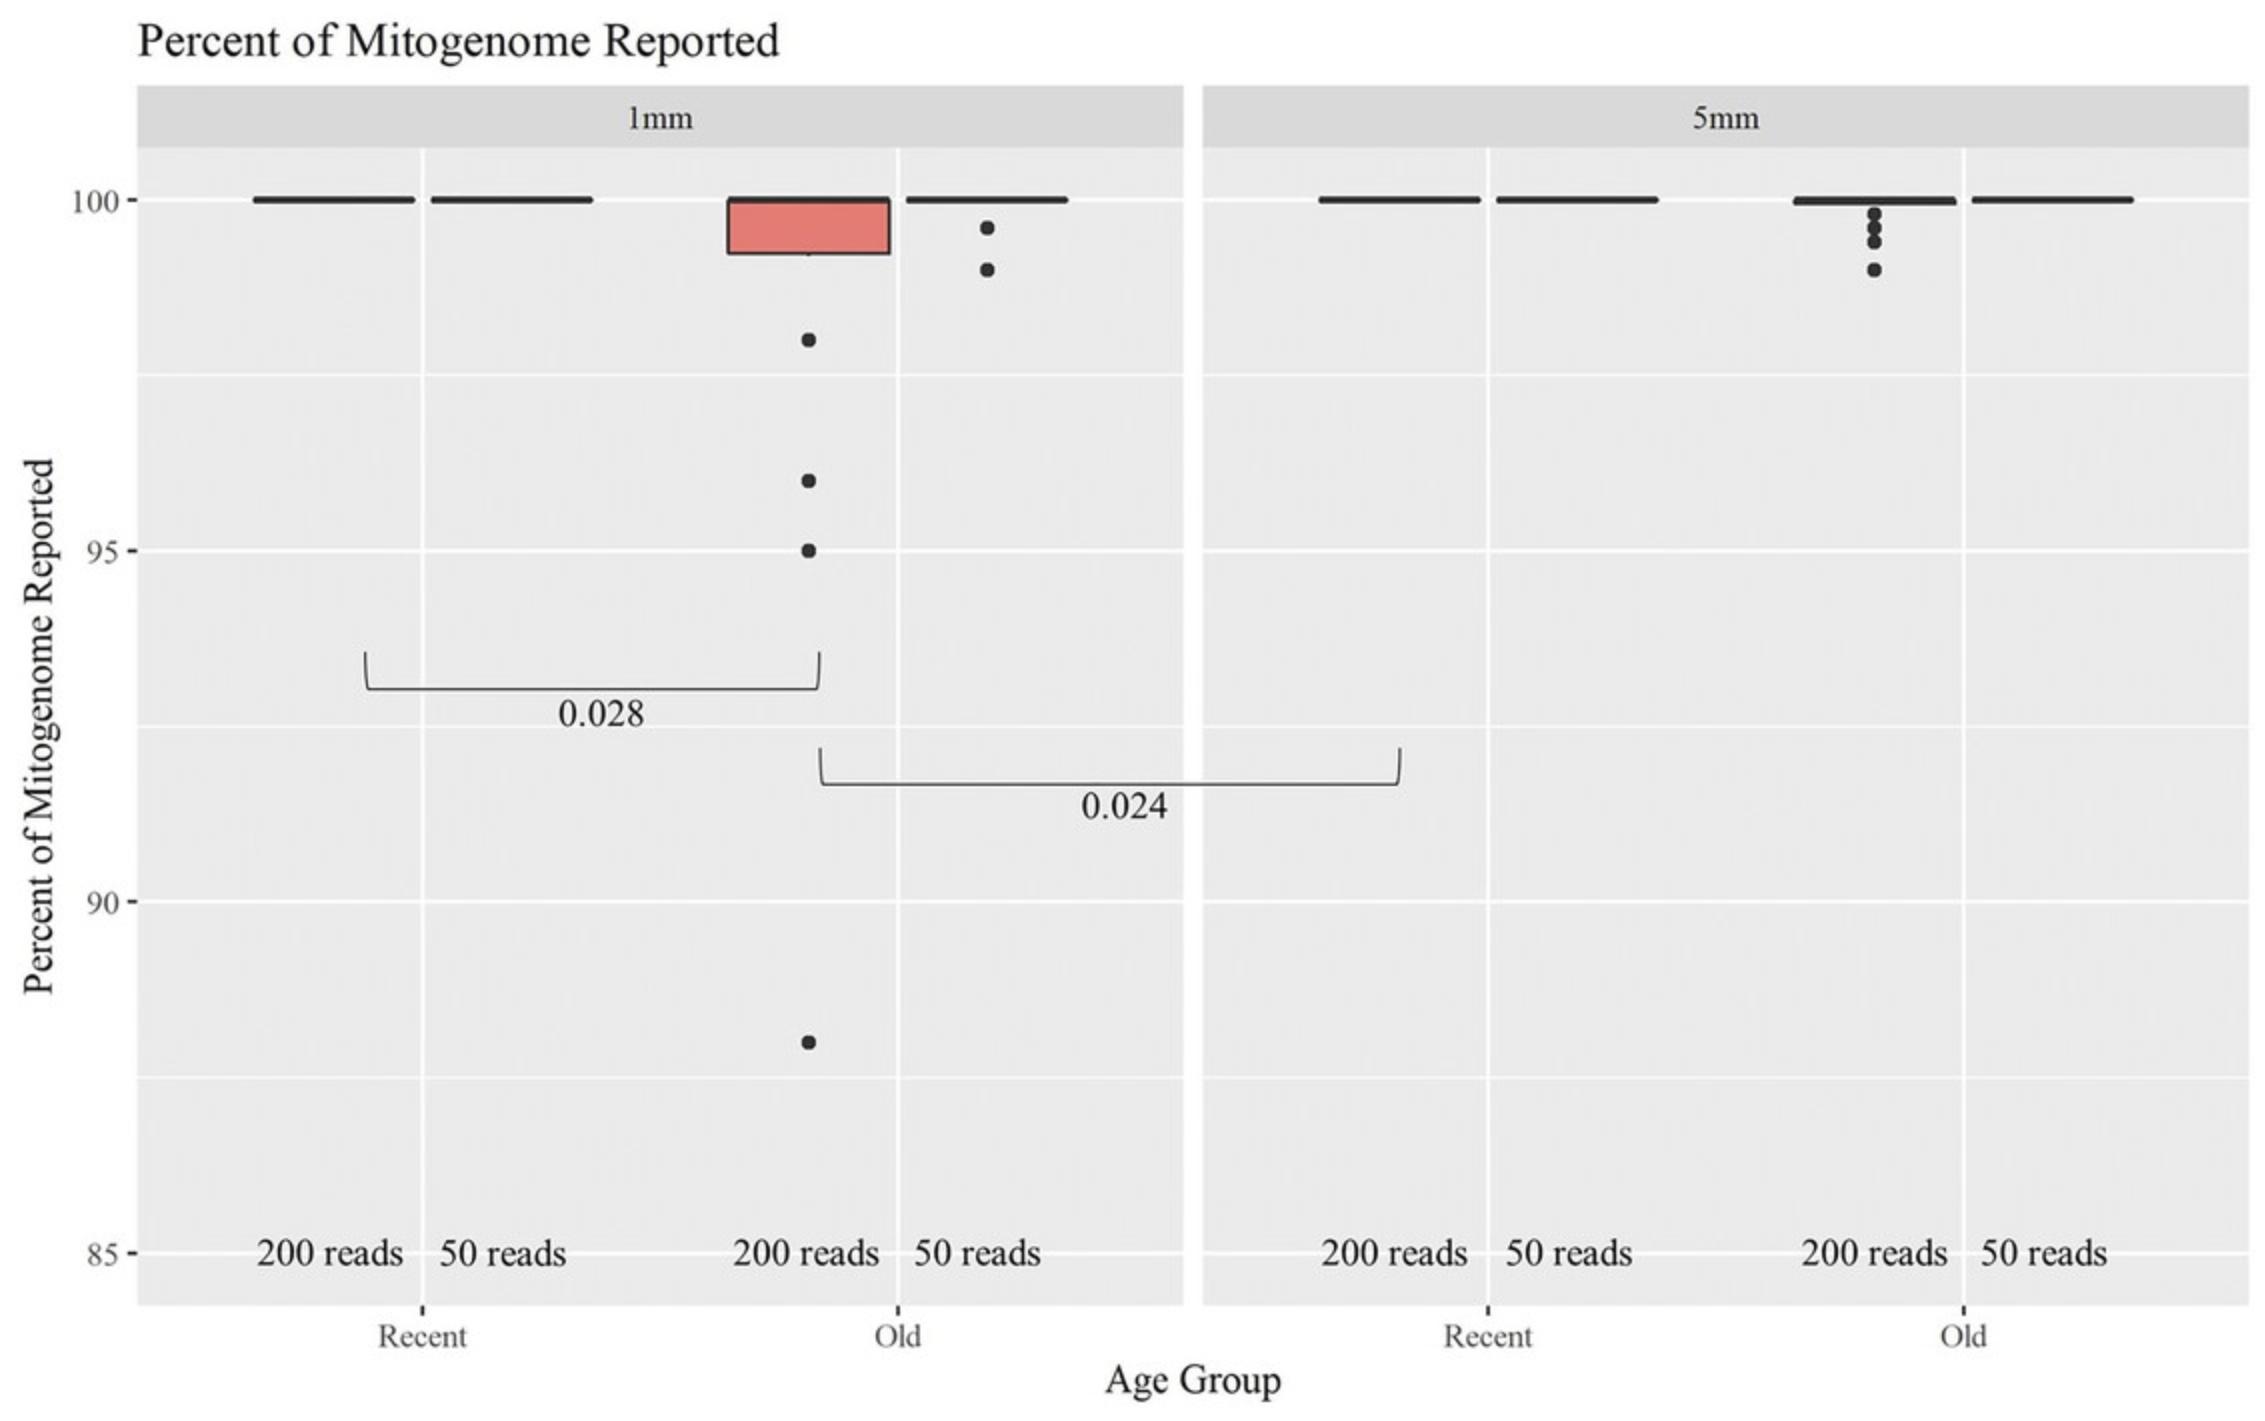
As the age of hairs increased, the percentage of the mitogenome reported at a read depth of >200 reads per nucleotide position decreased significantly (Fig. 12). Of the 48 Old samples, 44 yielded full or almost full mitogenome sequences (98% to 100%). When the required read depth was lowered to 50, all 48 Old hairs reached the 98% to 100% threshold, resulting in no significant differences due to age or length. At a read depth of 200, a higher percentage of the mitogenome was reported for the Recent hairs compared to the Old hairs when considering 1-mm cuttings (p -value of .028). The Old 1-mm hairs also had a significantly lower percentage reported than the Recent 5-mm hairs (p -value of .024). Overall, hair length did not appear to significantly impact the percentage of the mitogenome reported as much as age. Hairs of the same age but different lengths did not significantly differ in the percentage of the mitogenome reported. On average, >99.5% of the mitogenome was reported at a read depth of >200 reads per nucleotide position when working with as little as 1 mm of hair. That average increased to 99.9% for a read depth of >50 reads. Note that the haplotype does not change; it simply becomes more complete due to dropout occurring when setting the filter to 200 reads. Therefore, crime laboratories can use a less stringent filter when reporting a haplotype if the profile is not complete. Although these data follow the trend of older samples not having as high of a success rate, full whole-mitogenome profiles were still produced from almost all of the Old 1-mm hairs. This supports the idea that the MPS method is robust and can generate mitogenome sequences on a routine basis from as little as 1 mm of hair shafts up to 27 years of age.
The PowerSeq® Whole Mito System from Promega has been validated by the FBI Laboratory (Brandhagen et al., 2020). The method has been tested for sensitivity and reproducibility (Table 2; Promega data and unpub. observ.). Varying input amounts of the positive-control 2800 M DNA were analyzed using the PowerSeq® Whole Mito System, the MiSeq® instrument and sequencing reagents, and GeneMarker® HTS software; see Basic Protocols 3, 4, and 5, respectively. Template inputs of 8 to 5000 pg genomic DNA were amplified. Assuming ∼500 copies of mtDNA per cell and ∼6.6 pg genomic DNA per cell, this translates to ∼600 to ∼380,000 copies of mtDNA. This is a broad range of template amounts that produced quality results, reflecting the forgiving nature of the amplification process. Each template amount was sequenced in duplicate, and 22 libraries were pooled in a single run. Table 2 provides the percentage of the major variants reported and the minimum and average coverage across the mitogenome. Overall, the vast majority of samples produced 100% of the reportable data, with the lowest percentage reported at 98%. Given that the basic protocols herein produce upward of 500 to 4000 copies of mtDNA per microliter of extract from 1 to 5 mm of rootless hair, this further supports the robustness of the collection of methods. Although the PowerSeq® Whole Mito System produces quality, reliable results, there are other systems that can be employed for analysis of forensic samples (for example, Fendt et al., 2009; Parson et al., 2015; Woerner et al., 2018; Cihlar et al., 2020).
Critical Parameters and Troubleshooting
The success of extracting DNA from hair shafts relies on using a method that releases as much DNA into the lysate solution as possible and effectively purifies the DNA from potential inhibitors. Basic Protocol 1 provides such a method. The ability to fully dissolve the hair shaft cutting as quickly as possible provides for the highest DNA yield while limiting the impact of lengthy incubation periods often required by other methods. Gallimore et al. (2018) provide clear evidence for the superior nature of the extraction method in Basic Protocol 1. The data in Figure 13 illustrate the significantly higher yields of mtDNA when compared to two methods commonly used in the forensic community.
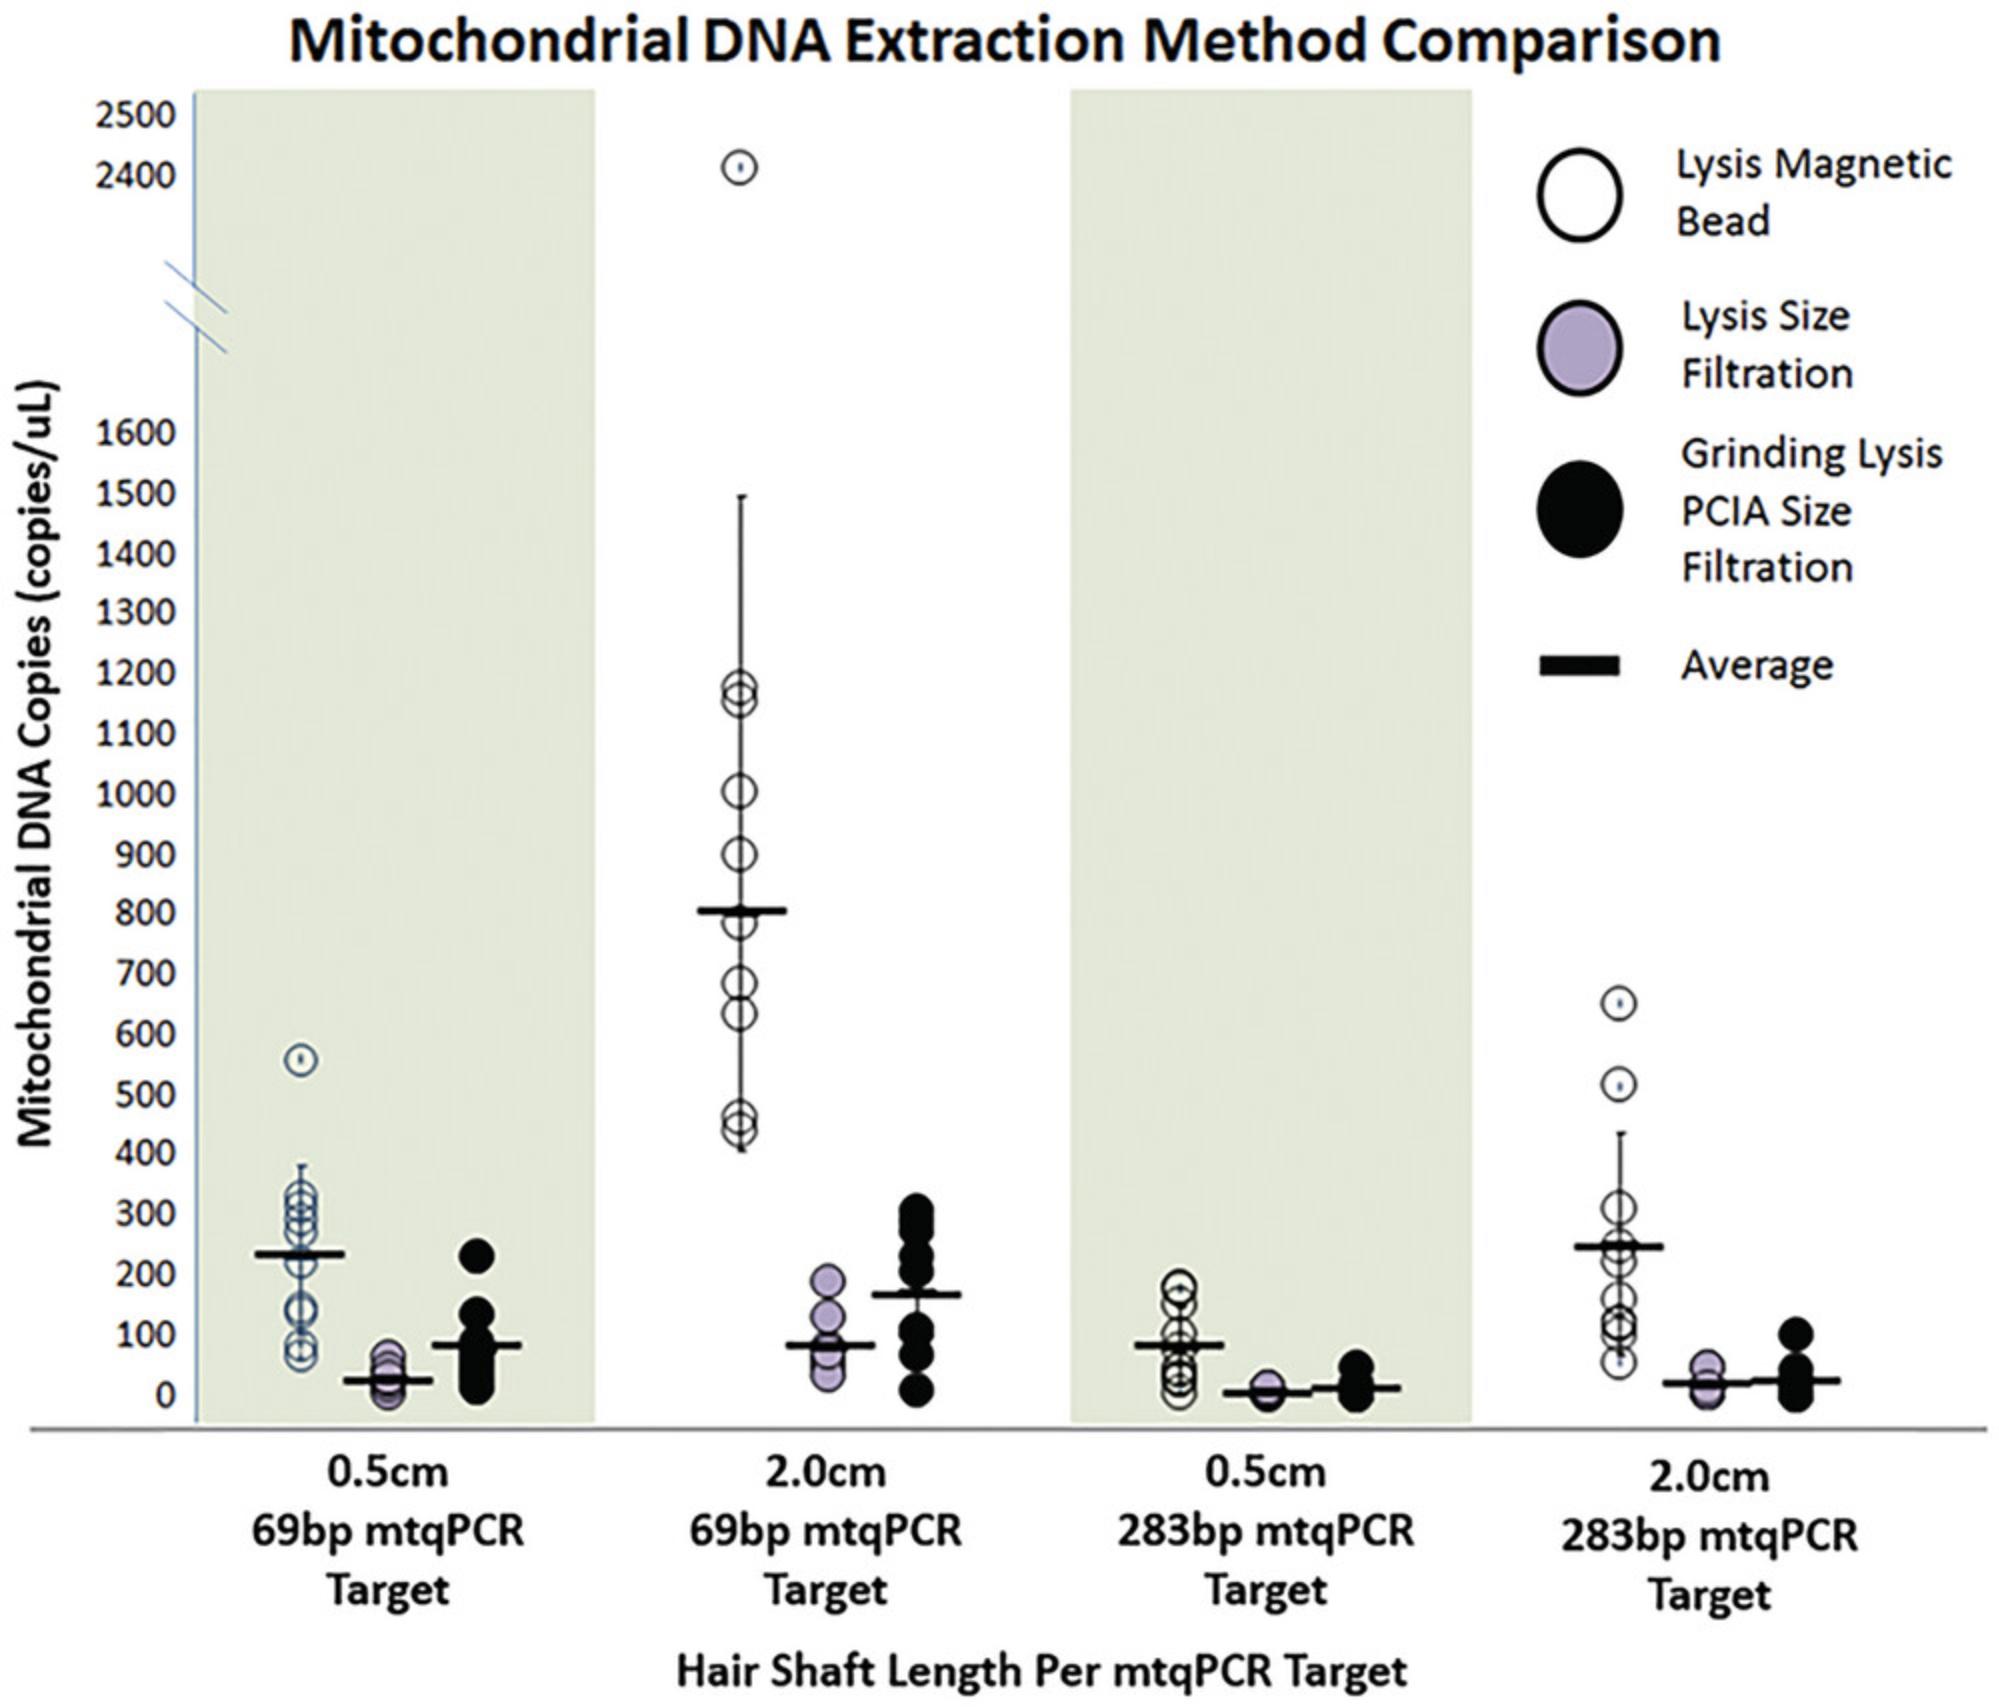
Basic Protocol 1 uses heat and agitation (thermomixing) to rapidly drive the hair shaft into solution. The other two methods involve lysis in DTT without heat or agitation, with one of the two using a grinding method to facilitate the dissolving process. Improvements in Basic Protocol 1 (described in Canale et al., 2022) have increased mtDNA yields to an even higher level.
A benefit of mtDNA sequence analysis is the ability to amplify a broad range of template input amounts. The range can span 500 to 300,000 copies of mtDNA, with lower amounts providing partial sequence data and higher amounts potentially contributing to inhibition or the co-amplification of nuclear inserts of mtDNA (NUMTs). The latter concern is typically mitigated in hair shafts as nDNA is highly degraded (Brandhagen et al., 2018) and will not be amplified with targets averaging more than 100 bp in length.
Depending on the desired outcome, fewer hair samples can be run at one time, as high-read-depth sequencing data allow for the analysis of low-level heteroplasmy (McElhoe & Holland, 2020; Holland et al., 2021), with typically 2 to 25 samples per run. At least 2000 reads per nucleotide position allows for the analysis of minor variants down to a 2% threshold, with 40 or more copies of the minor variants. When applied, analysis of heteroplasmy is an effective tool for differentiating between maternal relatives (Holland et al., 2018) and will enhance the discrimination potential of mtDNA sequence analysis (McElhoe et al., 2020). If haplotypes are the desired outcome, more hairs can be run at one time (for example, more than 100 samples). Areas of low read density across the mitogenome will limit throughput, and lowering thresholds for reporting sequence information helps mitigate those effects.
Understanding Results
The analysis of hair shaft cuttings from 1 mm to >2 cm in length is now a routine method. Expected results are a full-length mitogenome sequence when performing the basic protocols outlined herein. However, when working with cuttings on the lower end of the range (1 mm), it is expected that yields of mtDNA will be lower and that the quality of sequence data will decline. This will be further impacted by the age of a hair sample from the time of collection or deposition, and it is possible that different types of hair treatment will damage the mtDNA available in a hair sample. Overall, it is anticipated that as hair cutting length decreases, the age of the sample increases, and damage to the mtDNA found in the hair cutting increases, the quality of the mitogenome sequence data will decrease. For hairs >50 years of age, this may result in a considerable reduction in the quantity and quality of sequence data.
Time Considerations
When working with a set of 20 hairs, the total time to complete all five protocols is at least five standard workdays. Basic Protocols 1 and 2 can be completed together in one workday. Basic Protocol 1 takes approximately 6 to 7 hr to complete, including cutting the hairs; sampling the hair fragments can also be done prior to the rest of the protocol on a separate day. The plate setup for Basic Protocol 2 takes approximately 30 to 60 min, and the qPCR runs for ∼1.5 hr. Due to the stopping points built into Basic Protocol 4, Basic Protocol 3 and half of Basic Protocol 4 can be completed together in one workday. The setup of the amplification reaction in Basic Protocol 3 takes ∼40 min to complete. This can vary depending on how many extracts from Basic Protocol 1 need to be diluted. The amplification reaction runs for ∼1 hr on the thermal cycler, for a total of close to 2 hr for Basic Protocol 3. Purification of the amplification products generated in Basic Protocol 3 takes approximately 1.5 to 2 hr, and preparing and purifying the DNA libraries takes about 2 to 3 hr. The plate setup for the quantification of the libraries during Basic Protocol 4 takes approximately 30 to 60 min, the protocol runs for about 45 min, and normalization and pooling of the libraries take ∼30 min. Thawing the reagent cartridge, preparing the pooled libraries for sequencing, loading the MiSeq, and starting the run take ∼2 hr. The MiSeq then runs for ∼60 hr. Excluding the run time for the MiSeq, Basic Protocol 4 takes approximately 7.5 to 10 hr to complete. For Basic Protocol 5, the initial software analysis of the FASTQ files and the project file generation done by HTS can take >6 hr if 20 hair samples and controls are analyzed in one project (23 total samples). The time to analyze the project files generated by HTS will vary based on the quality of the sequence data (i.e., dropout of amplicons, amount of noise, damage, NUMTs) but can take about 30 to 60 min per sample.
Acknowledgments
This work was supported in part by grant 2019-DU-BX-0045 from the National Institute of Justice (NIJ). The points of view in this document are those of the authors and do not represent the official position or policies of the U.S. Department of Justice. We acknowledge the Forensic Science Program, Department of Biochemistry & Molecular Biology, Eberly College of Science at Penn State for their support and the Penn State Genomics Core Facility for performing the MiSeq runs.
Author Contributions
Jade T. Korber : writing original draft, writing – review and editing. Lauren C. Canale : writing – original draft, writing – review and editing. Mitchell M. Holland : conceptualization, funding acquisition, project administration, resources, supervision, writing – original draft, writing – review and editing.
Conflict of Interest
The authors have no conflicts of interest.
Open Research
Data Availability Statement
Data sharing is not applicable to this article as no new data were created or analyzed for these protocols.
Literature Cited
- Bandelt, H. J., & Parson, W. (2008). Consistent treatment of length variants in the human mtDNA control region: A reappraisal. International Journal of Legal Medicine , 122(1), 11–21. https://doi.org/10.1007/s00414-006-0151-5
- Brandhagen, M. D., Just, R. S., & Irwin, J. A. (2020). Validation of NGS for mitochondrial DNA casework at the FBI Laboratory. Forensic Science International: Genetics , 44, 102151. https://doi.org/10.1016/j.fsigen.2019.102151
- Brandhagen, M. D., Loreille, O., & Irwin, J. A. (2018). Fragmented nuclear DNA is the predominant genetic material in human hair shafts. Genes , 9(12), 8–12. https://doi.org/10.3390/genes9120640
- Canale, L. C., McElhoe, J. A., Dimick, G., DeHeer, K. M, Beckert, J., & Holland, M. M. (2022). Routine mitogenome MPS analysis from 1 and 5 mm of rootless human hair. Genes , 13(11), 2144. https://doi.org/10.3390/genes13112144
- Canale, L. C., Parson, W., & Holland, M. M. (2021). The time is now for ubiquitous forensic mtMPS analysis. Wiley Interdisciplinary Reviews: Forensic Science , 4(1), e1431. https://doi.org/10.1002/wfs2.1431
- Cihlar, J. C., Amory, C., Lagac, R., Roth, C., Parson, W., & Budowle, B. (2020). Developmental validation of a MPS workflow with a PCR-Based short amplicon whole mitochondrial genome panel. Genes , 11(11), 1345. https://doi.org/10.3390/genes11111345
- Fendt, L., Zimmermann, B., Daniaux, M., & Parson, W. (2009). Sequencing strategy for the whole mitochondrial genome resulting in high quality sequences. BMC Genomics , 10, 1–11. https://doi.org/10.1186/1471-2164-10-139
- Gallimore, J. M., McElhoe, J. A., & Holland, M. M. (2018). Assessing heteroplasmic variant drift in the mtDNA control region of human hairs using an MPS approach. Forensic Science International: Genetics , 32, 7–17. https://doi.org/10.1016/j.fsigen.2017.09.013
- Holland, C. A., McElhoe, J. A., Gaston-Sanchez, S., & Holland, M. M. (2021). Damage patterns observed in mtDNA control region MPS data for a range of template concentrations and when using different amplification approaches. International Journal of Legal Medicine , 135, 91–106. https://doi.org/10.1007/s00414-020-02410-0
- Holland, M. M., Makova, K. D., & McElhoe, J. A. (2018). Deep-coverage MPS analysis of heteroplasmic variants within the mtGenome allows for frequent differentiation of maternal relatives. Genes , 9, 124. https://doi.org/10.3390/genes9030124
- Holland, M. M., Pack, E. D., & McElhoe, J. A. (2017). Evaluation of GeneMarker® HTS for improved alignment of mtDNA MPS data, haplotype determination, and heteroplasmy assessment. Forensic Science International: Genetics , 28, 90–98. https://doi.org/10.1016/j.fsigen.2017.01.016
- Huber, N., Parson, W., & Dür, A. (2018). Next generation database search algorithm for forensic mitogenome analyses. Forensic Science International: Genetics , 37, 204–214. https://doi.org/10.1016/j.fsigen.2018.09.001
- Liu, Y. Y., & Harbison, S. A. (2018). A review of bioinformatic methods for forensic DNA analyses. Forensic Science International: Genetics , 33, 117–128. https://doi.org/10.1016/j.fsigen.2017.12.005
- Marshall, C., & Parson, W. (2021). Interpreting NUMTs in forensic genetics: Seeing the forest for the trees. In Forensic Science International: Genetics (Vol. 53, p. 102497). Elsevier Ireland Ltd. https://doi.org/10.1016/j.fsigen.2021.102497
- McElhoe, J. A., & Holland, M. M. (2020). Characterization of background noise in MiSeq MPS data when sequencing human mitochondrial DNA from various sample sources and library preparation methods. Mitochondrion , 52, 40–55. https://doi.org/10.1016/j.mito.2020.02.005
- McElhoe, J. A., Wilton, P. R., Parson, W., & Holland, M. M. (2022). Exploring weight estimates of mitochondrial DNA matches involving heteroplasmy. International Journal of Legal Medicine , 136, 671–685. https://doi.org/10.1007/s00414-022-02774-5
- Melton, T., Dimick, G., Higgins, B., Lindstrom, L., & Nelson, K. (2005). Forensic mitochondrial DNA analysis of 691 casework hairs. Journal of Forensic Sciences , 50(1), 1–8. https://doi.org/10.1520/JFS2004230
- Niederstätter, H., Köchl, S., Grubwieser, P., Pavlic, M., Steinlechner, M., & Parson, W. (2007). A modular real-time PCR concept for determining the quantity and quality of human nuclear and mitochondrial DNA. Forensic Science International: Genetics , 1(1), 29–34. https://doi.org/10.1016/j.fsigen.2006.10.007
- Parson, W., Gusmão, L., Hares, D. R., Irwin, J. A., Mayr, W. R., Morling, N., Pokorak, E., Prinz, M., Salas, A., Schneider, P. M., & Parsons, T. J. (2014). DNA commission of the international society for forensic genetics: Revised and extended guidelines for mitochondrial DNA typing. Forensic Science International: Genetics , 13, 134–142. https://doi.org/10.1016/j.fsigen.2014.07.010
- Parson, W., Huber, G., Moreno, L., Madel, M. B., Brandhagen, M. D., Nagl, S., Xavier, C., Eduardoff, M., Callaghan, T. C., & Irwin, J. A. (2015). Massively parallel sequencing of complete mitochondrial genomes from hair shaft samples. Forensic Science International: Genetics , 15, 8–15. https://doi.org/10.1016/j.fsigen.2014.11.009
- SWGDAM Guidelines (2019). Interpretation guidelines for mitochondrial DNA analysis by forensic DNA testing laboratories. Approved 04/23/2019.
- Timken, M. D., Swango, K. L., Orrego, C., & Buoncristiani, M. R. (2005). A duplex real-time qPCR assay for the quantification of human nuclear and mitochondrial DNA in forensic samples: Implications for quantifying DNA in degraded samples. Journal of Forensic Sciences , 50(5), 1044–1060. https://doi.org/10.1520/JFS2004423
- Woerner, A. E., Ambers, A., Wendt, F. R., King, J. L., Moura-Neto, R. S., Silva, R., & Budowle, B. (2018). Evaluation of the precision ID mtDNA whole genome panel on two massively parallel sequencing systems. Forensic Science International: Genetics , 36, 213–224. https://doi.org/10.1016/j.fsigen.2018.07.015

