Analysis framework and experimental design for evaluating synergy-driving gene expression
Nadine Schrode, Carina Seah, P. J. Michael Deans, Gabriel Hoffman, Kristen J. Brennand


Extended
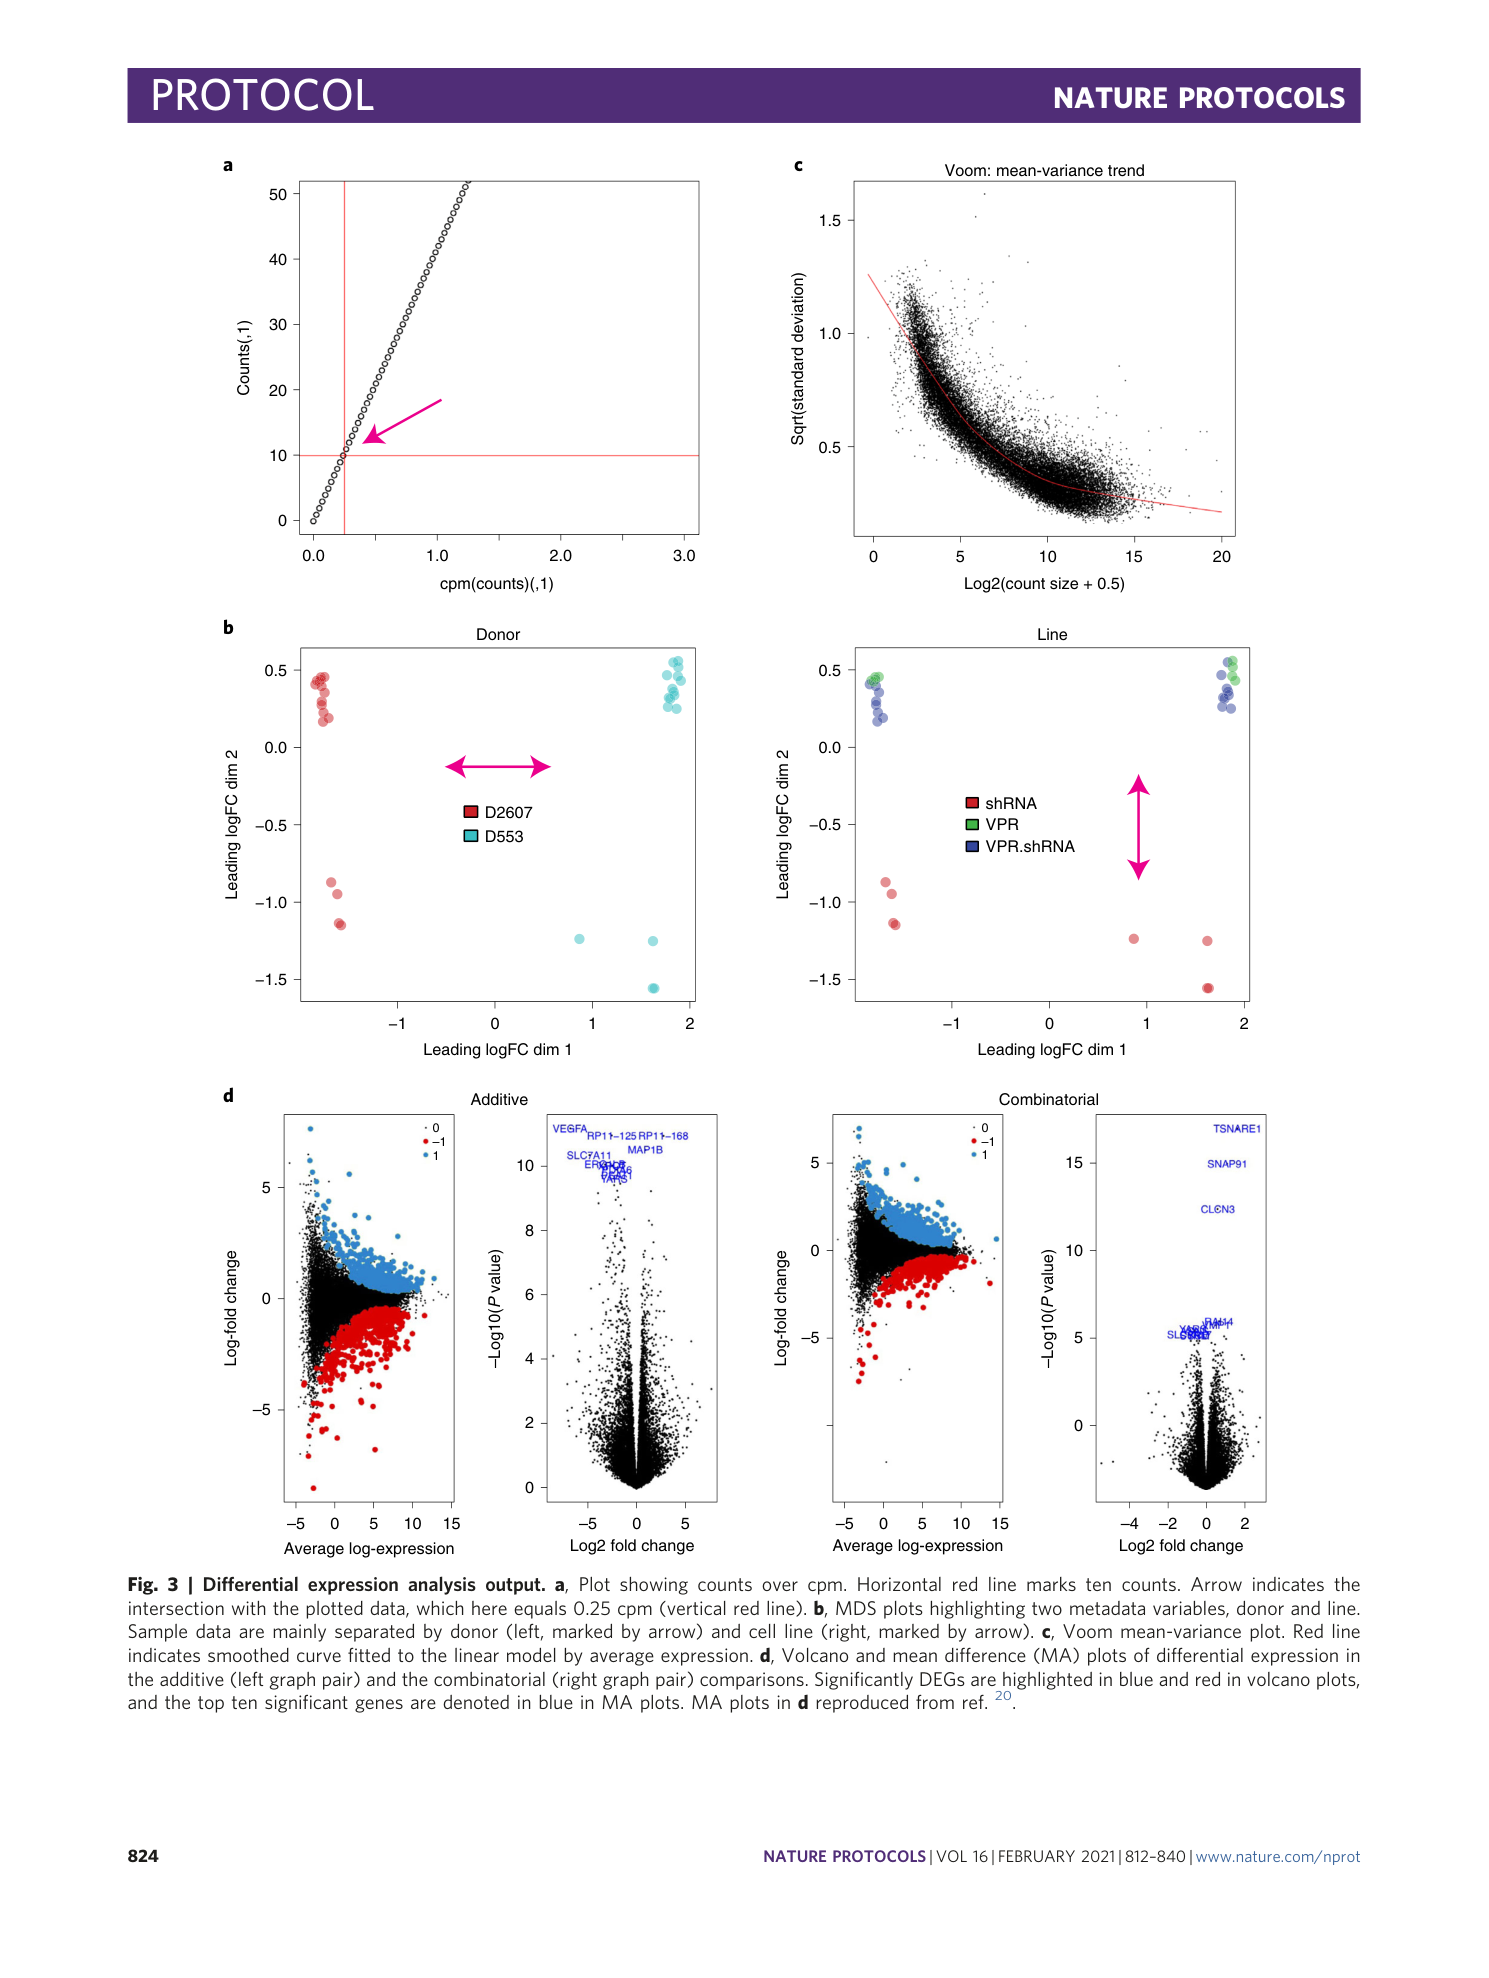
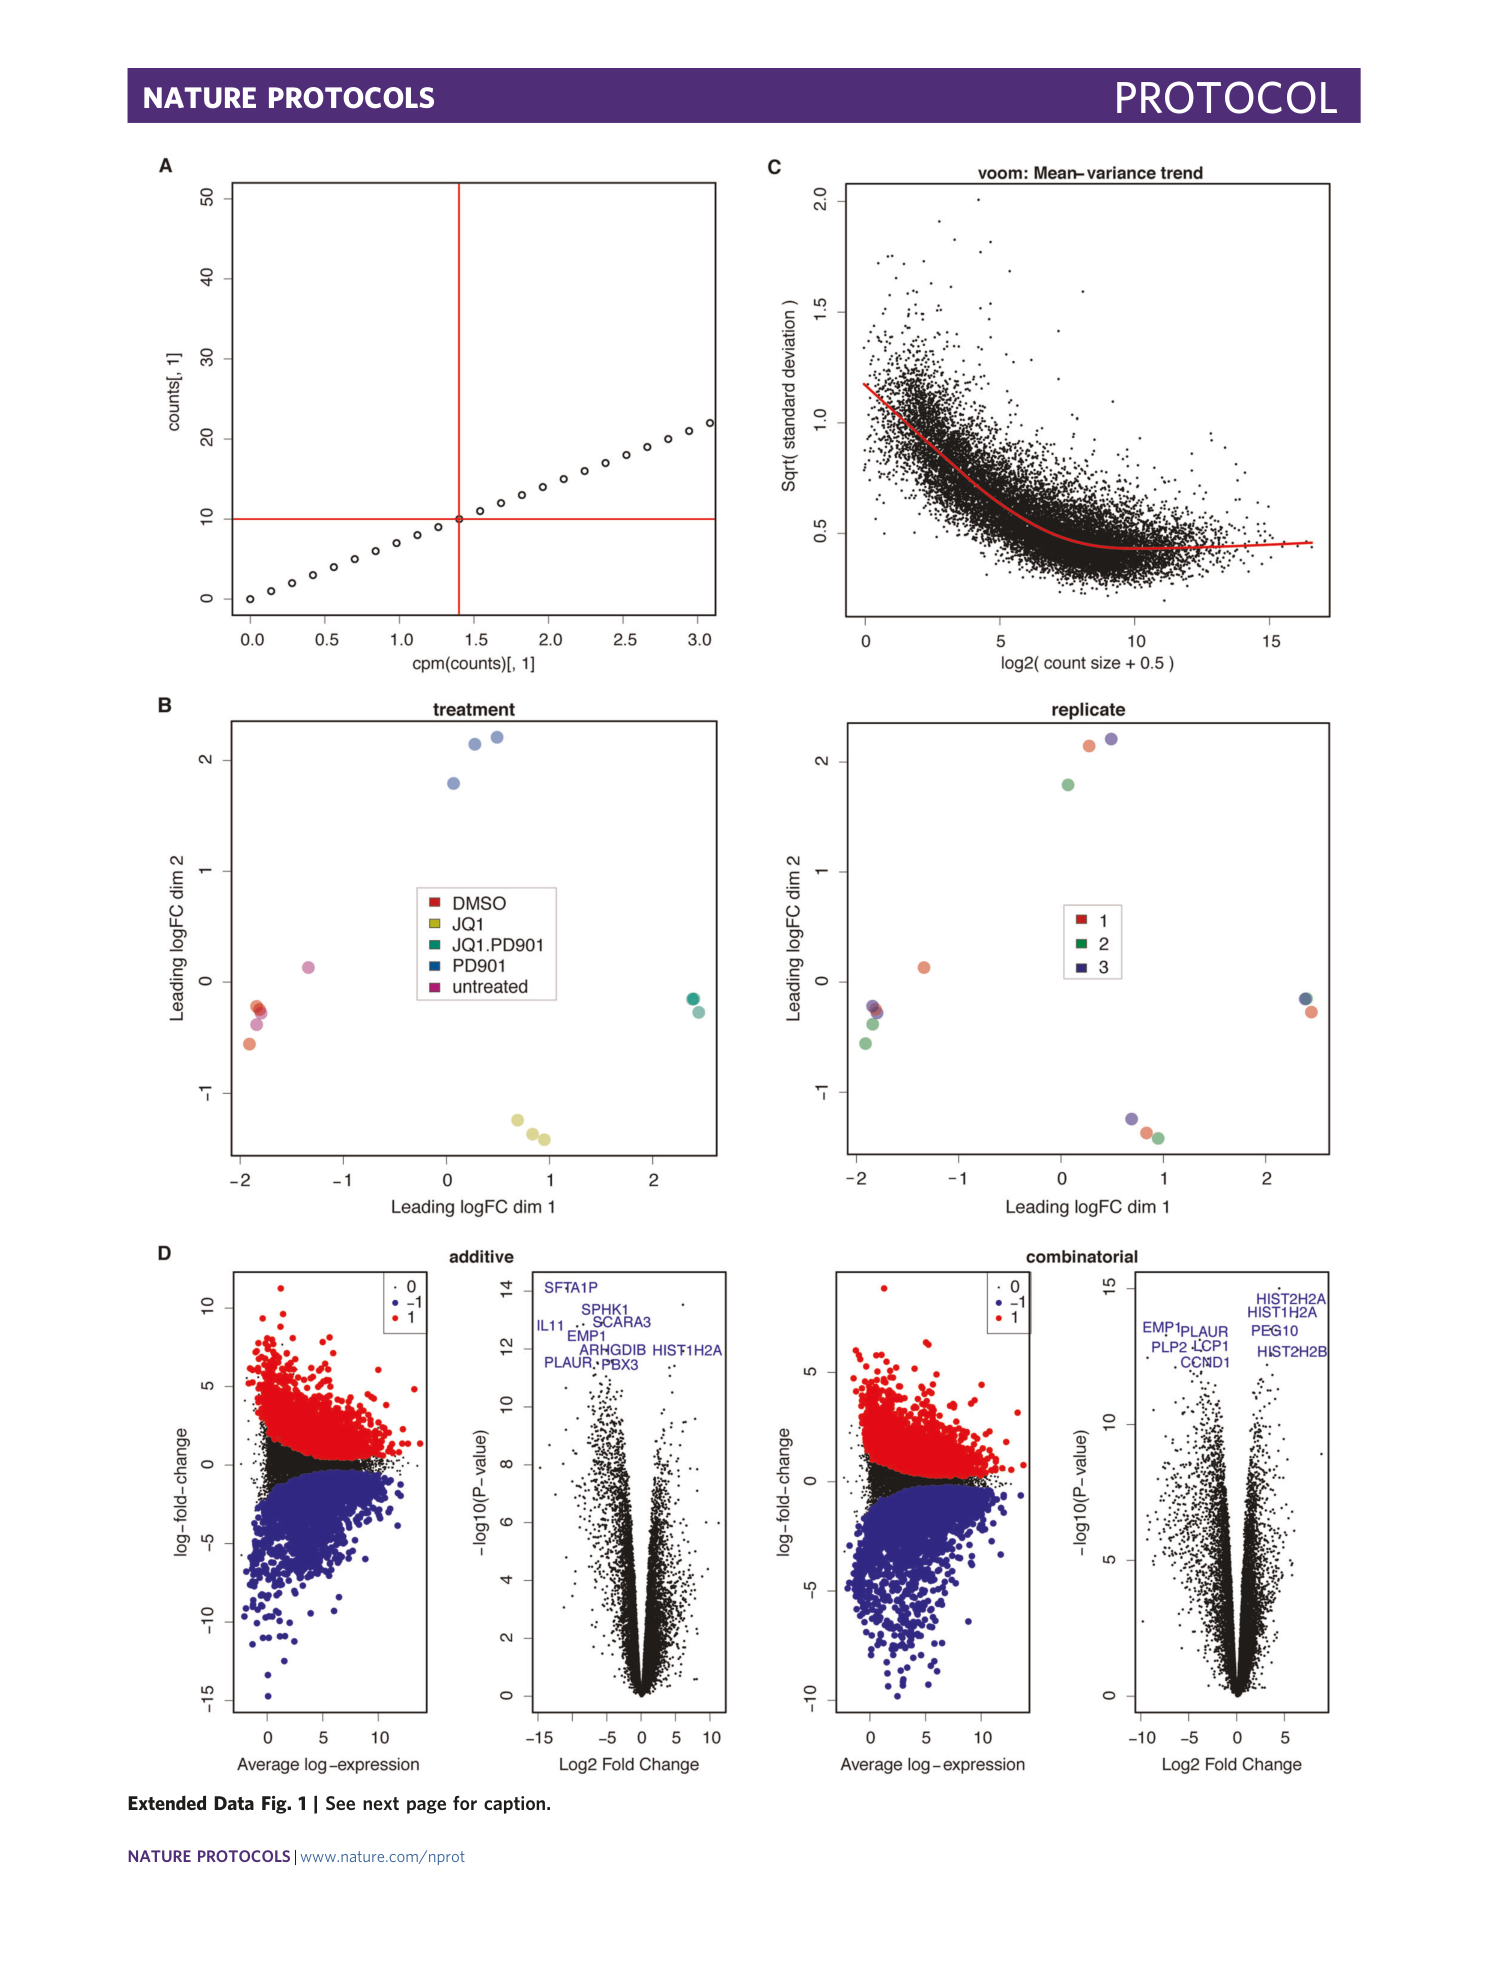
[ Extended Data Fig. 1 Differential expression analysis output, related to Fig. 3 . ](https://www.nature.com/articles/s41596-020-00436-7/figures/7)
a) Plot showing counts over cpm. Horizontal red line marks 10 counts. Arrow indicates the intersection with the plotted data, which here equals 1.4 cpm (vertical red line). b) MDS plots highlighting two metadata variables respectively. Sample data are separated by treatment (left), but not by replicate (right). c) Voom mean-variance plot. d) Volcano and mean difference (MA) plots of differential expression in the additive (left) and the combinatorial (right) comparisons. Significantly differentially expressed genes are highlighted in blue and red (Volcano plot) and the top 10 significant genes are denoted in blue (MA plot).
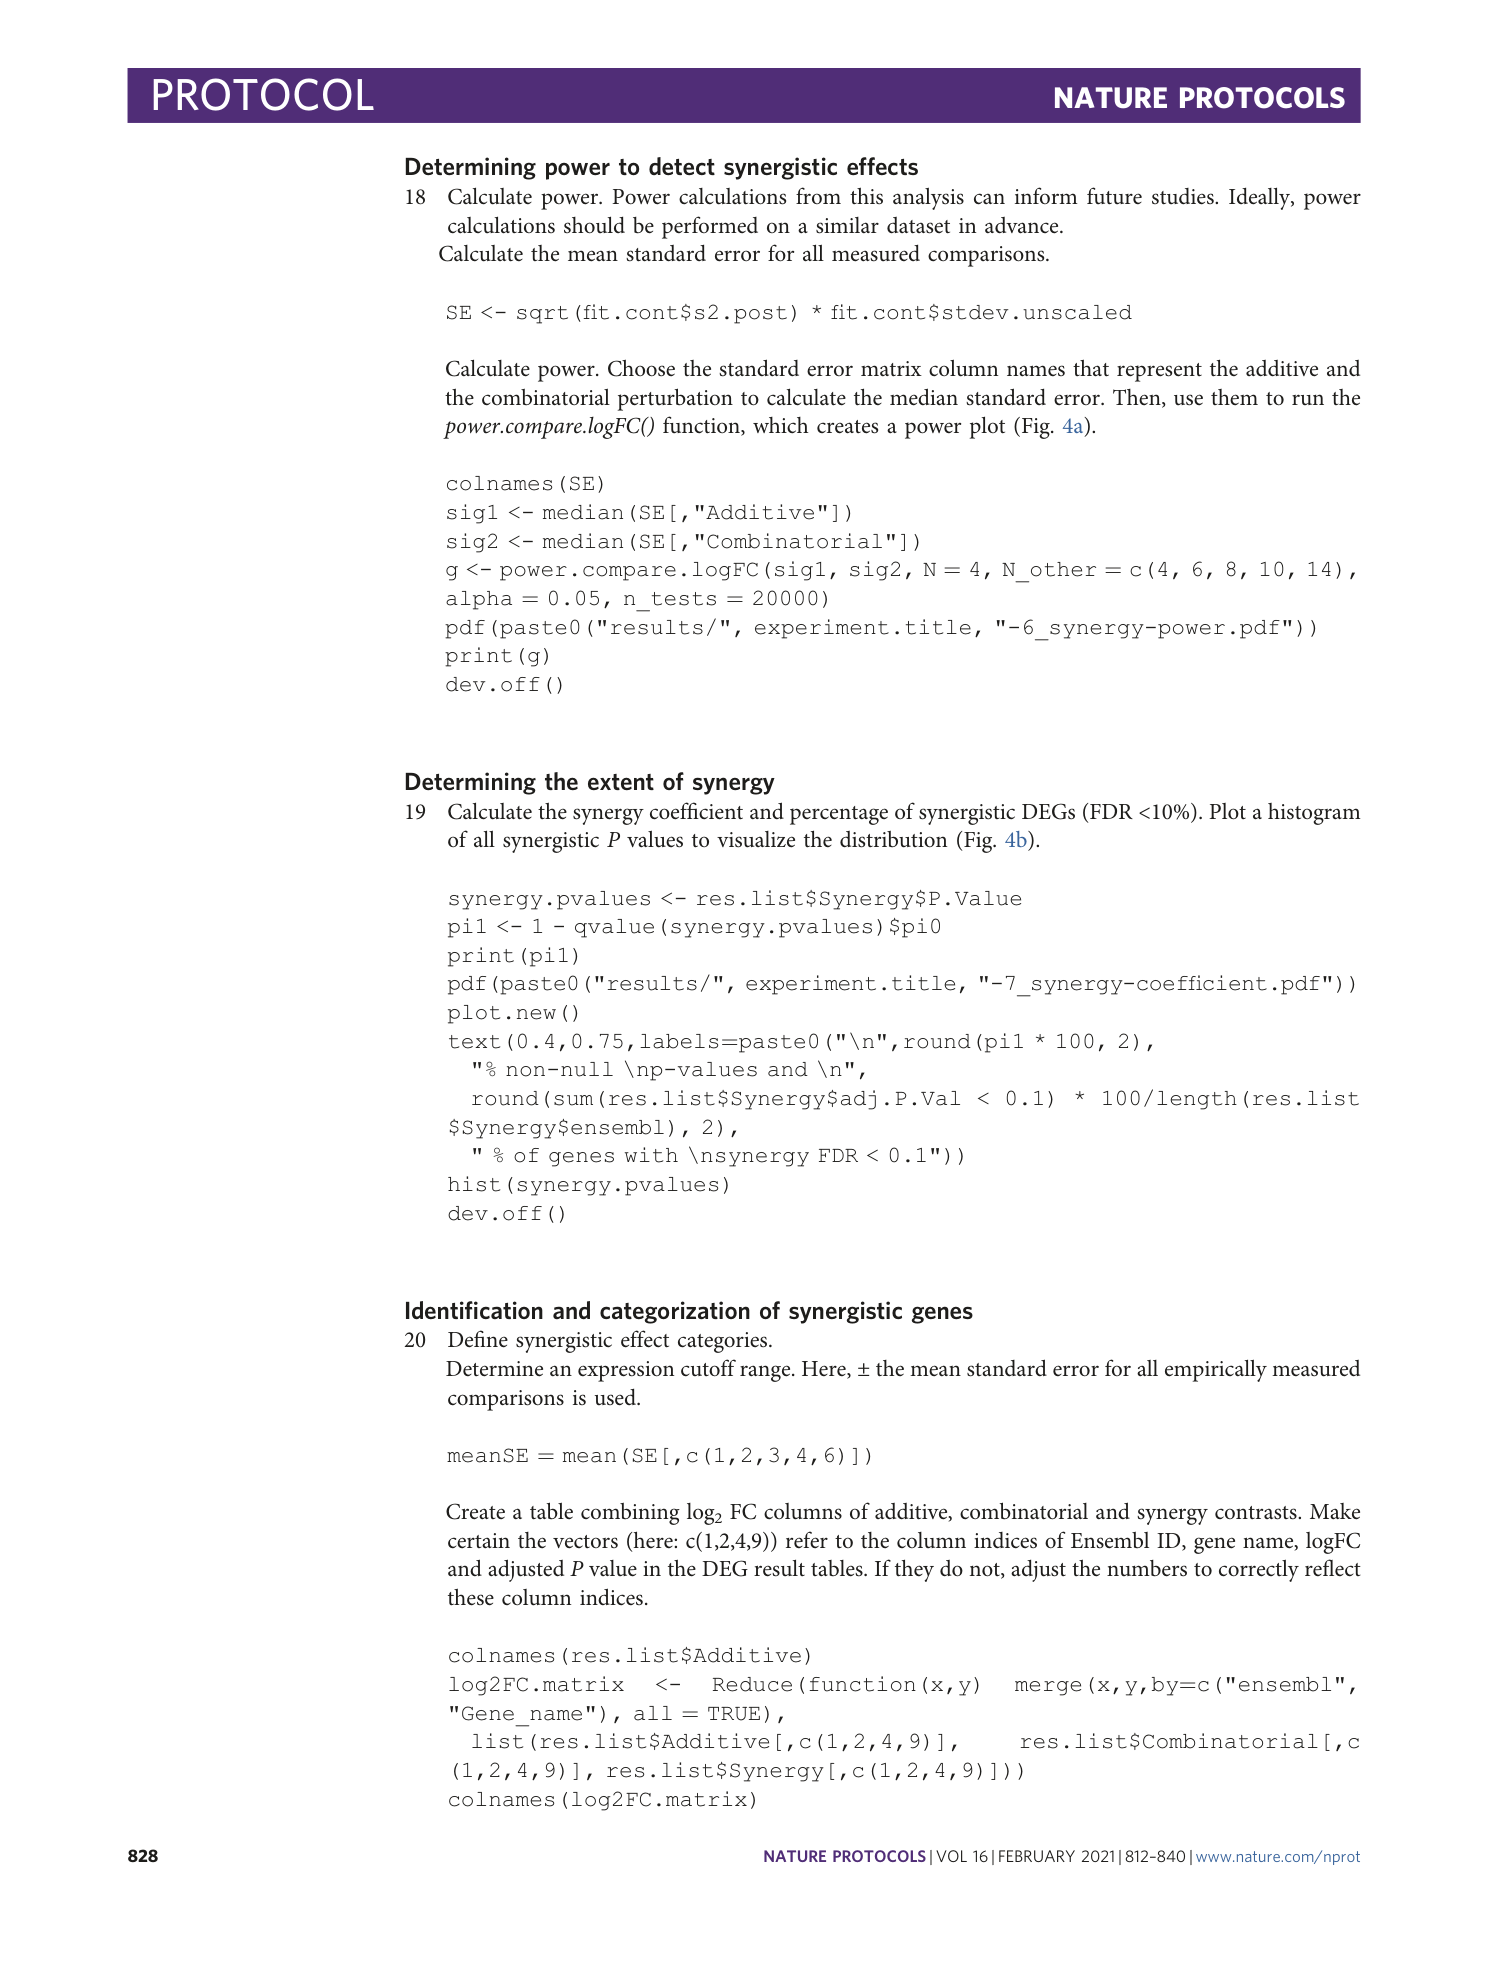
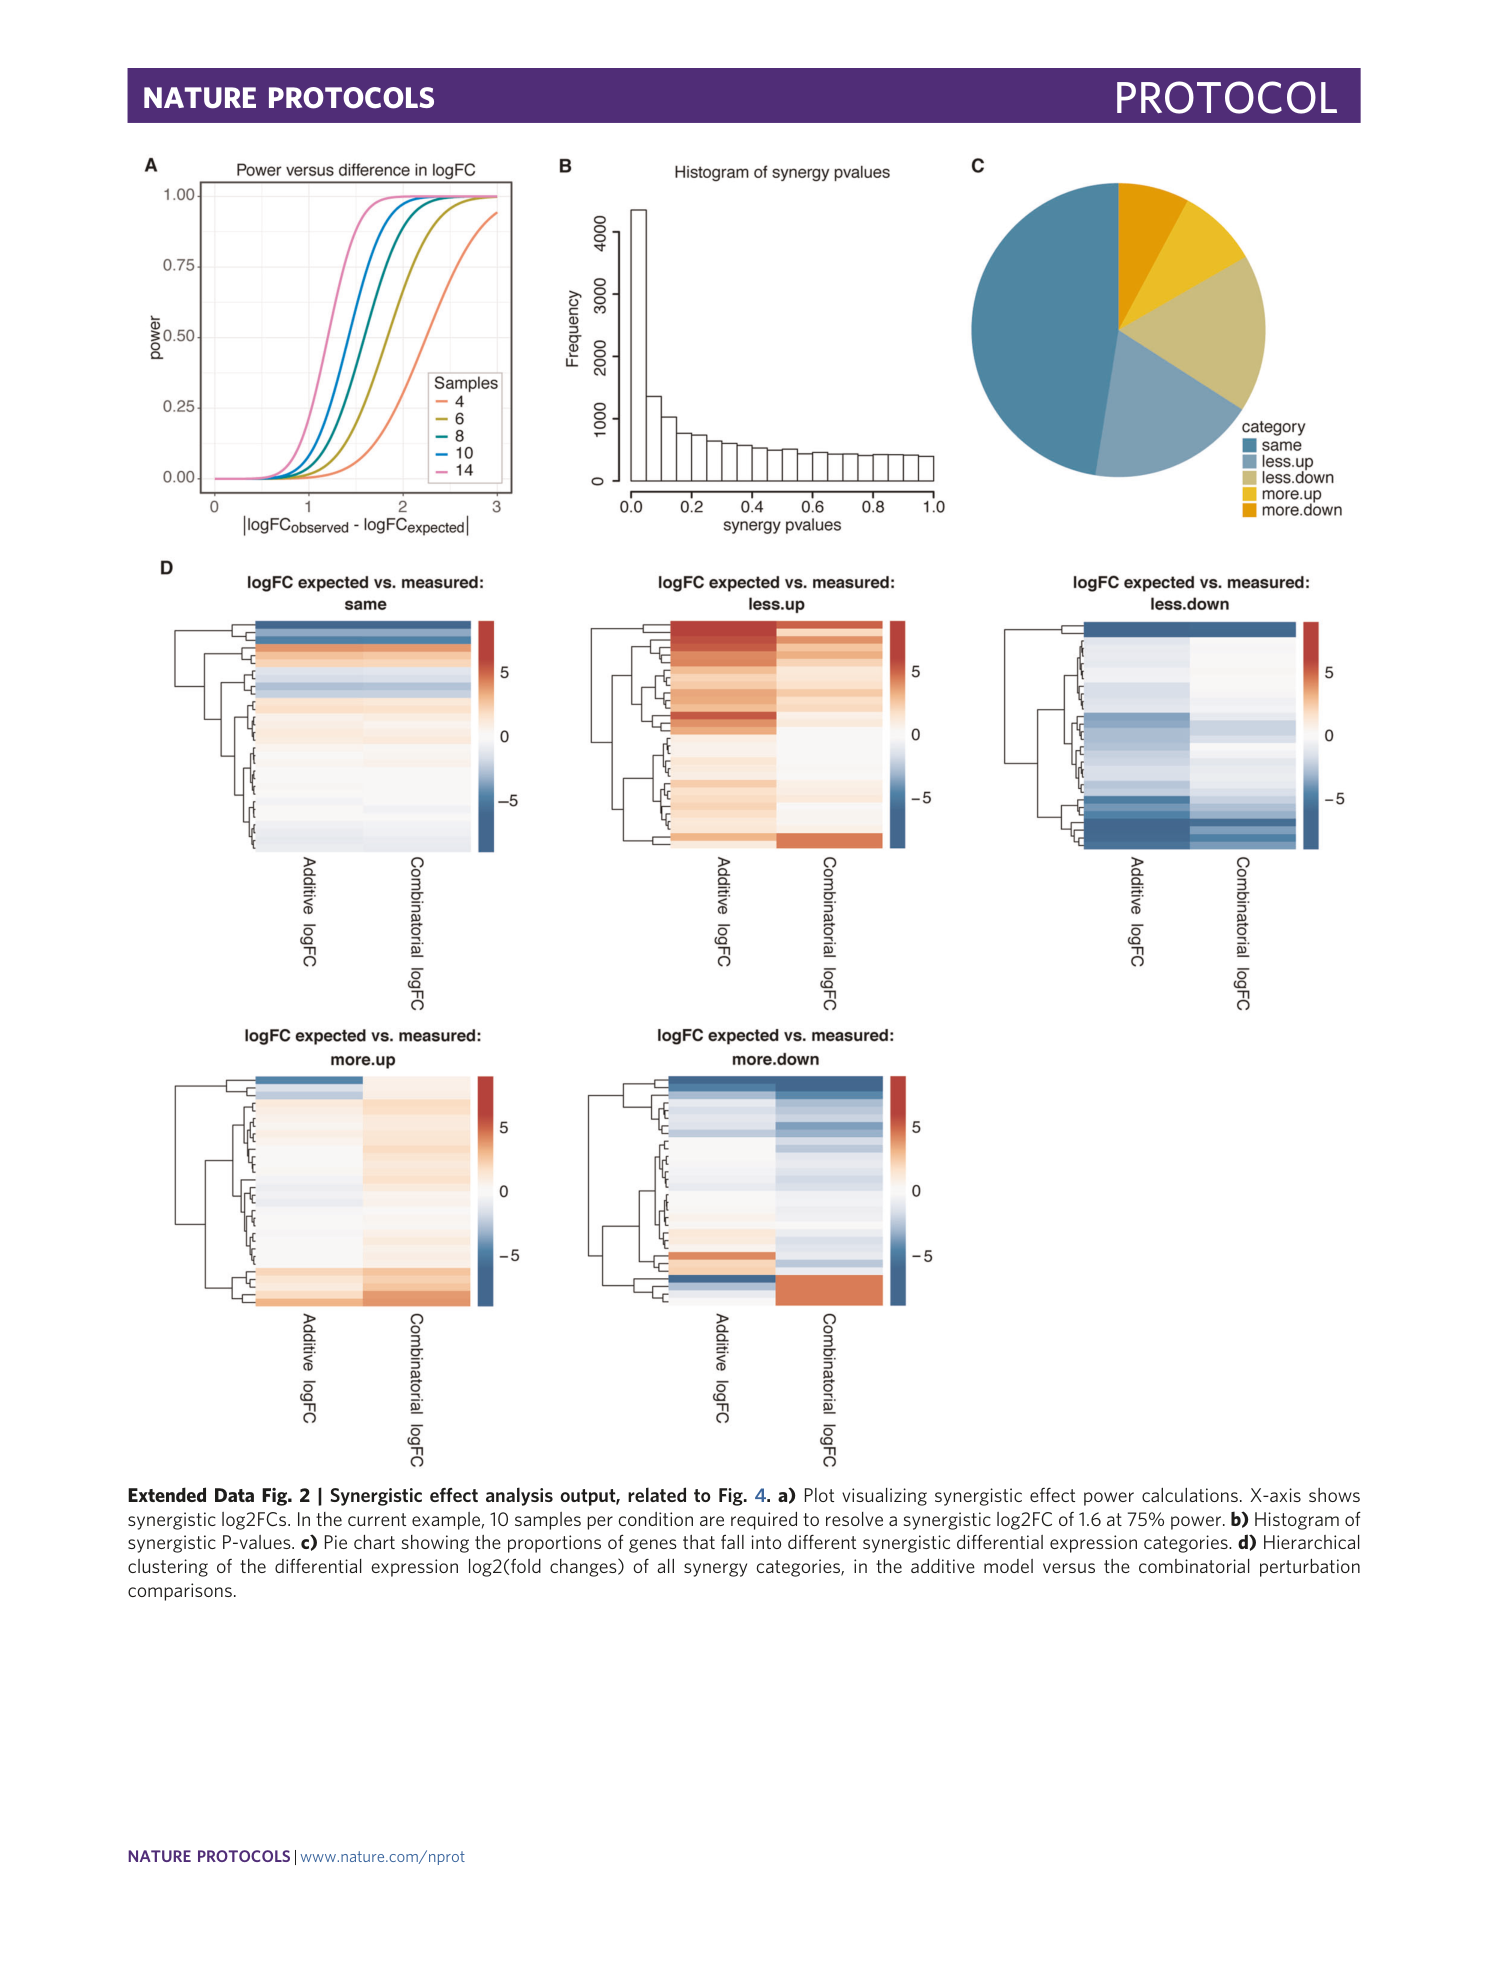
[ Extended Data Fig. 2 Synergistic effect analysis output, related to Fig. 4 . ](https://www.nature.com/articles/s41596-020-00436-7/figures/8)
a) Plot visualizing synergistic effect power calculations. X-axis shows synergistic log2FCs. In the current example, 10 samples per condition are required to resolve a synergistic log2FC of 1.6 at 75% power. b) Histogram of synergistic P-values. c) Pie chart showing the proportions of genes that fall into different synergistic differential expression categories. d) Hierarchical clustering of the differential expression log2(fold changes) of all synergy categories, in the additive model versus the combinatorial perturbation comparisons.
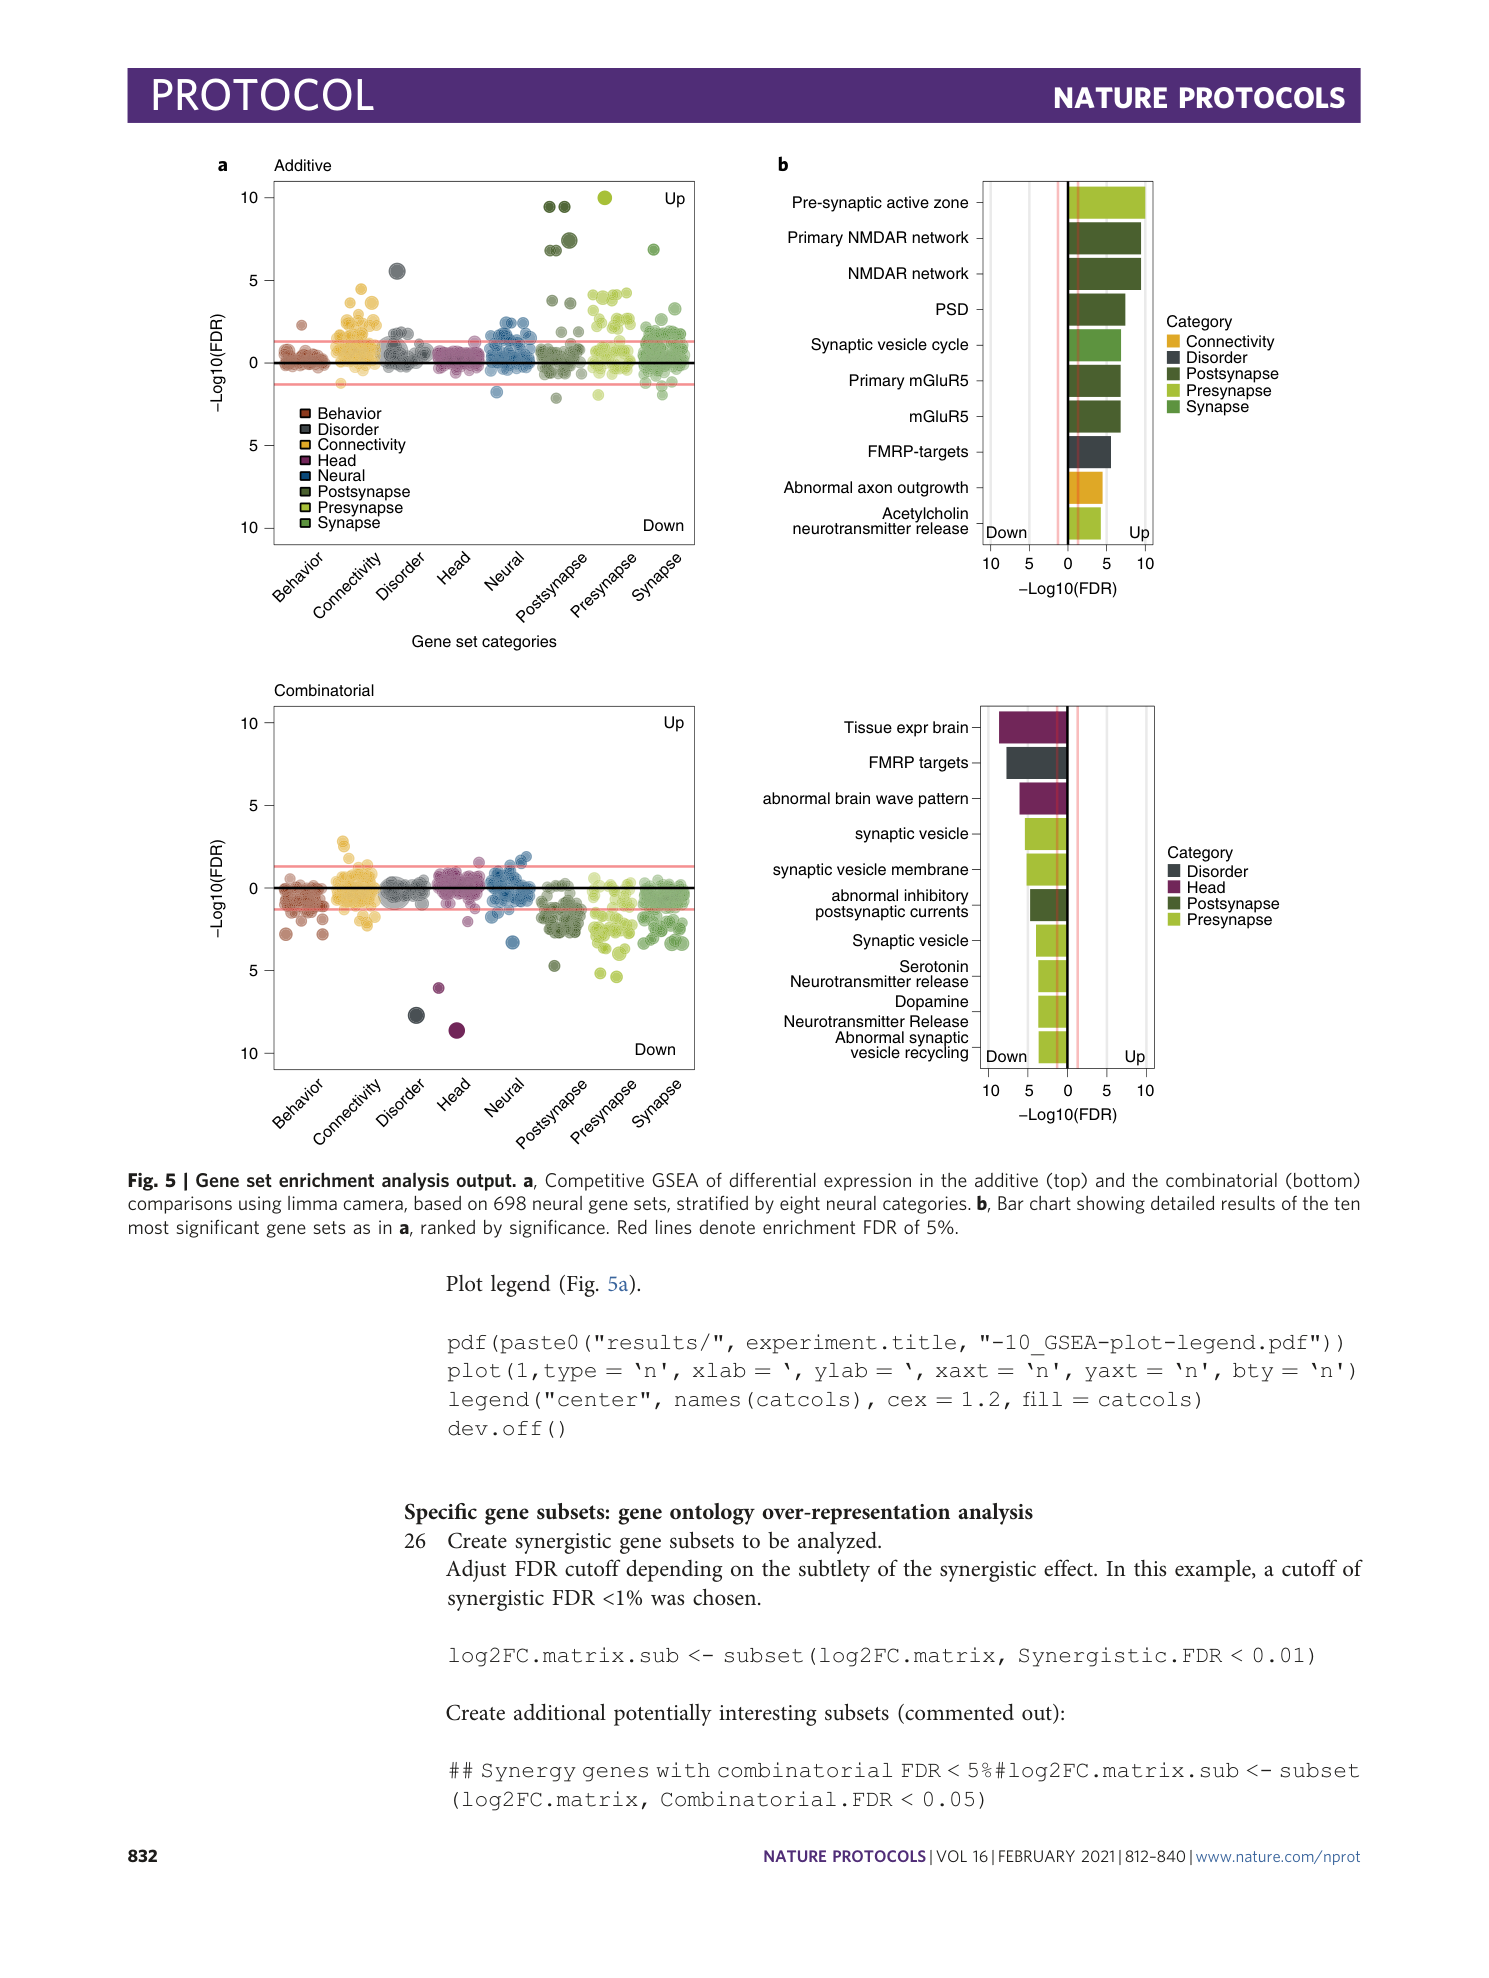
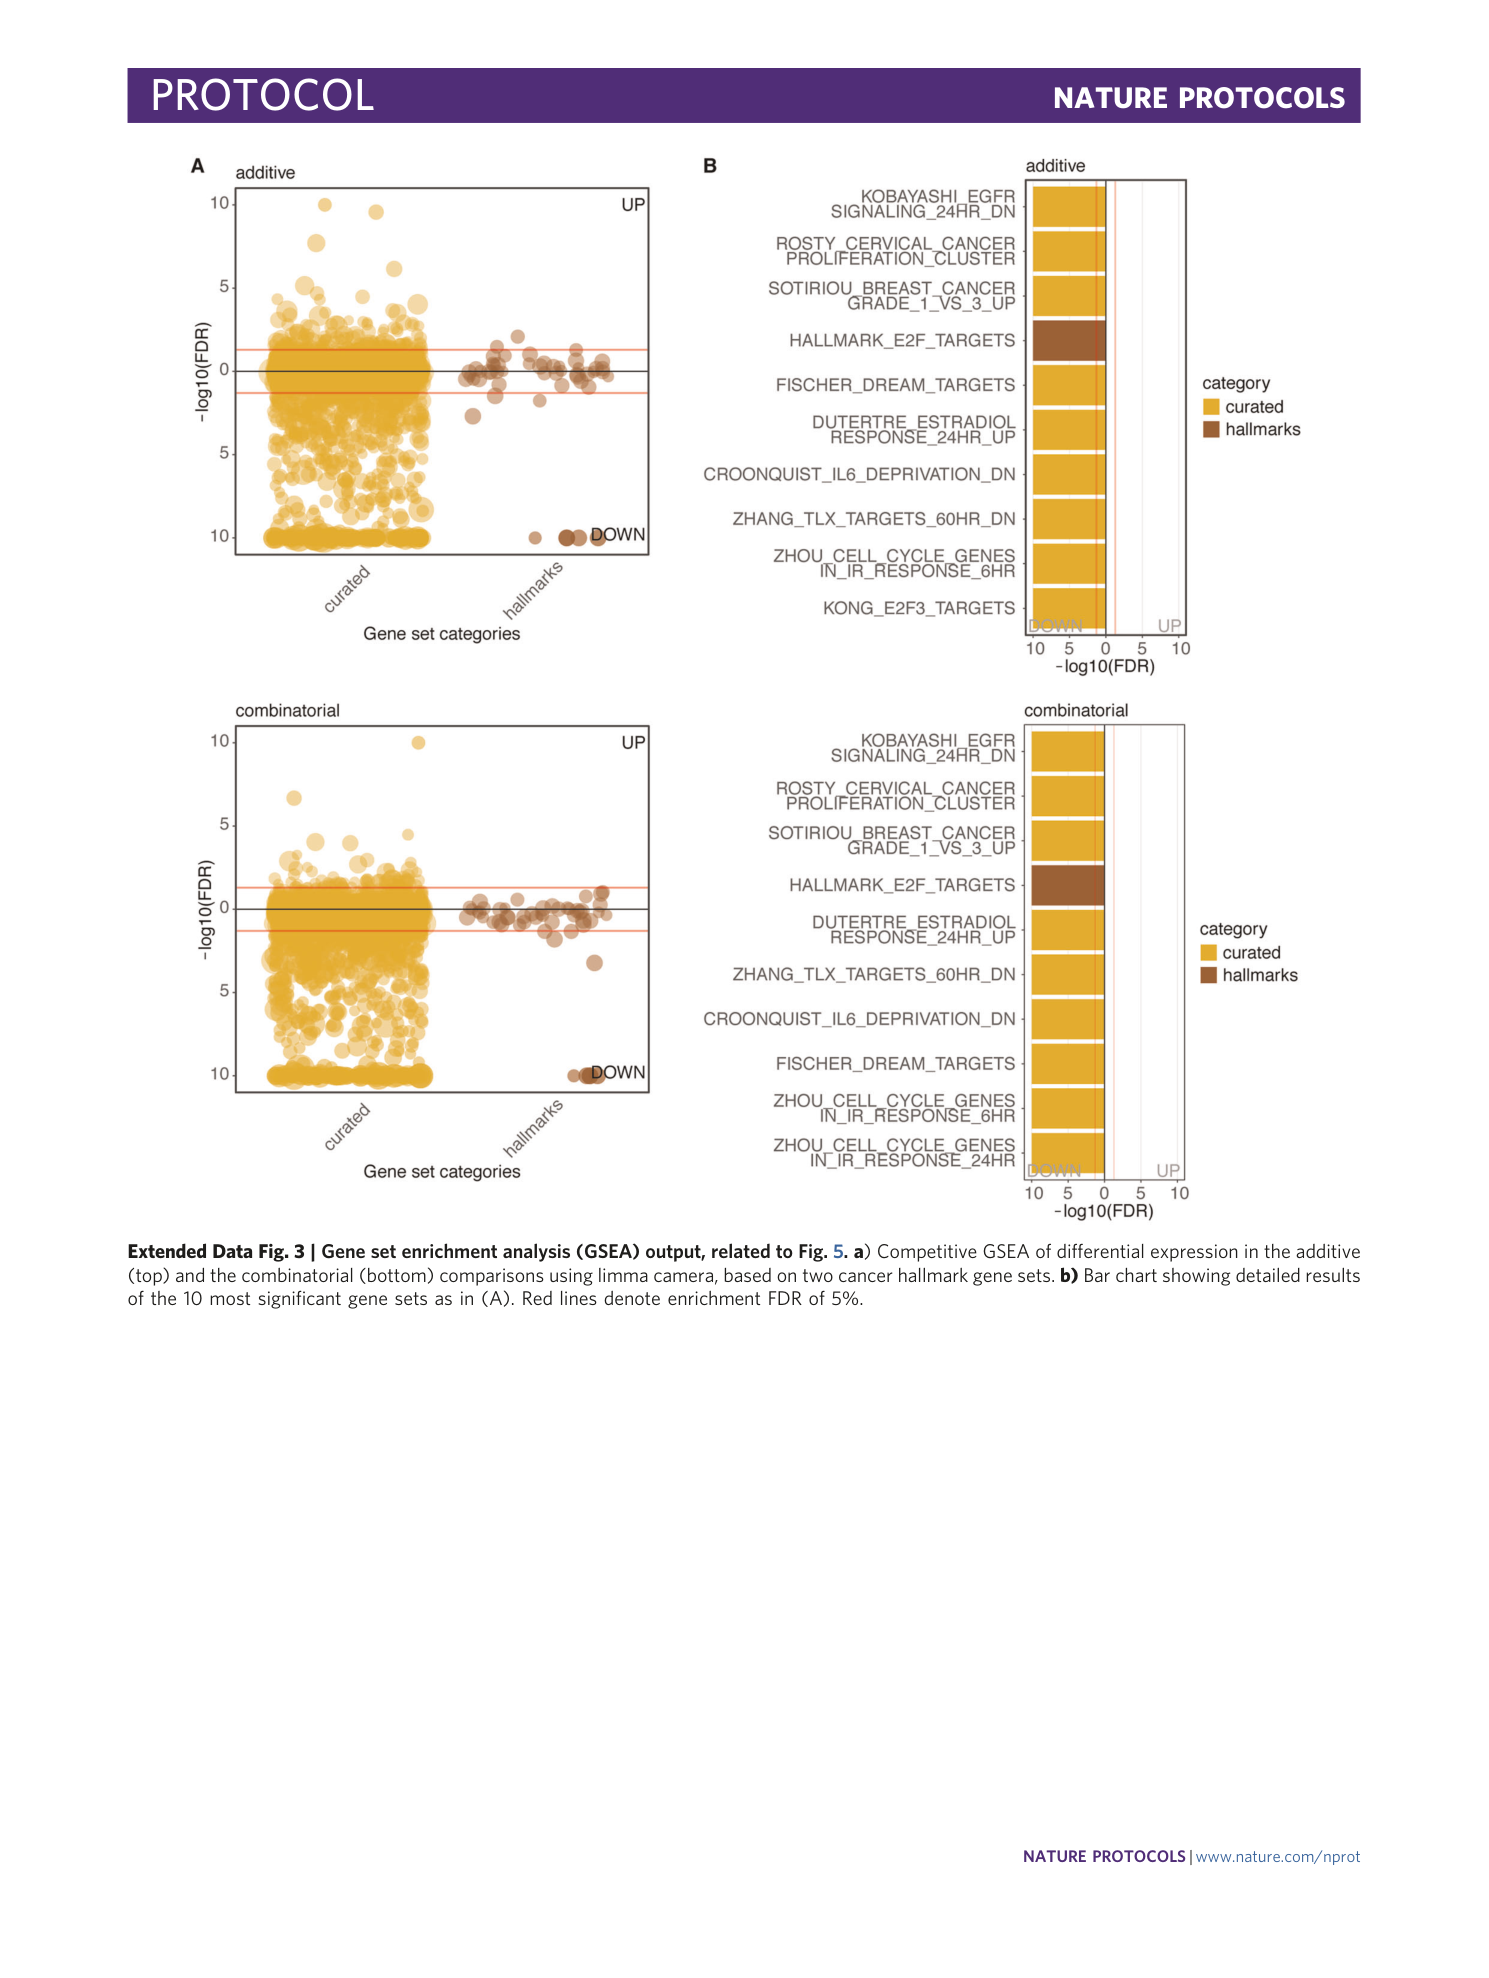
[ Extended Data Fig. 3 Gene set enrichment analysis (GSEA) output, related to Fig. 5 . ](https://www.nature.com/articles/s41596-020-00436-7/figures/9)
a ) Competitive GSEA of differential expression in the additive (top) and the combinatorial (bottom) comparisons using limma camera, based on two cancer hallmark gene sets. b) Bar chart showing detailed results of the 10 most significant gene sets as in (A). Red lines denote enrichment FDR of 5%.
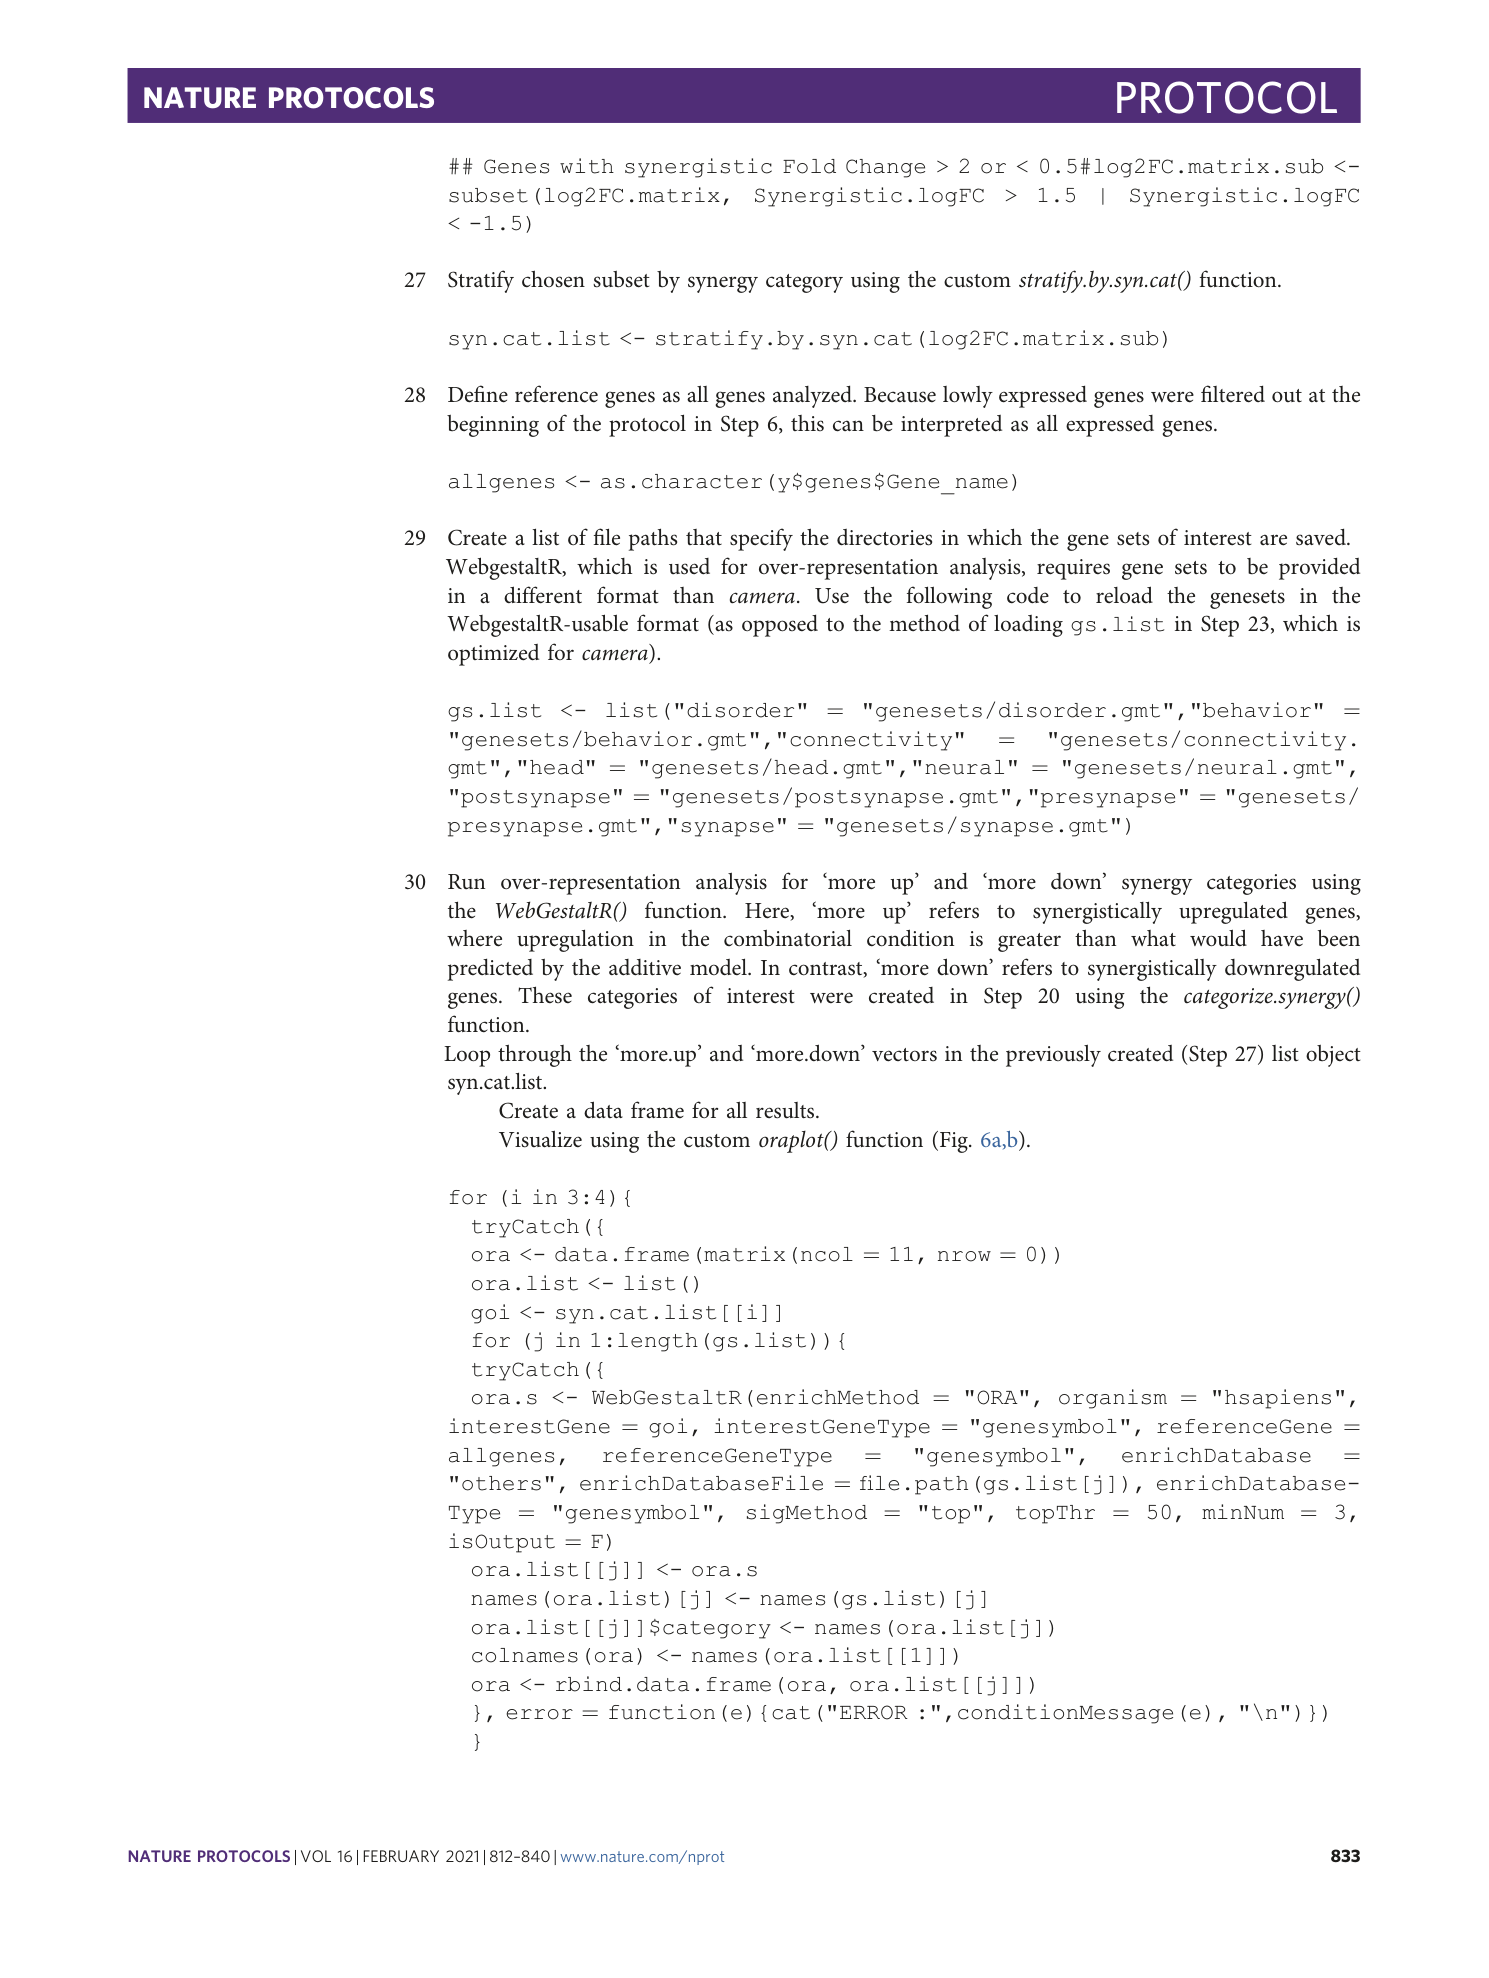
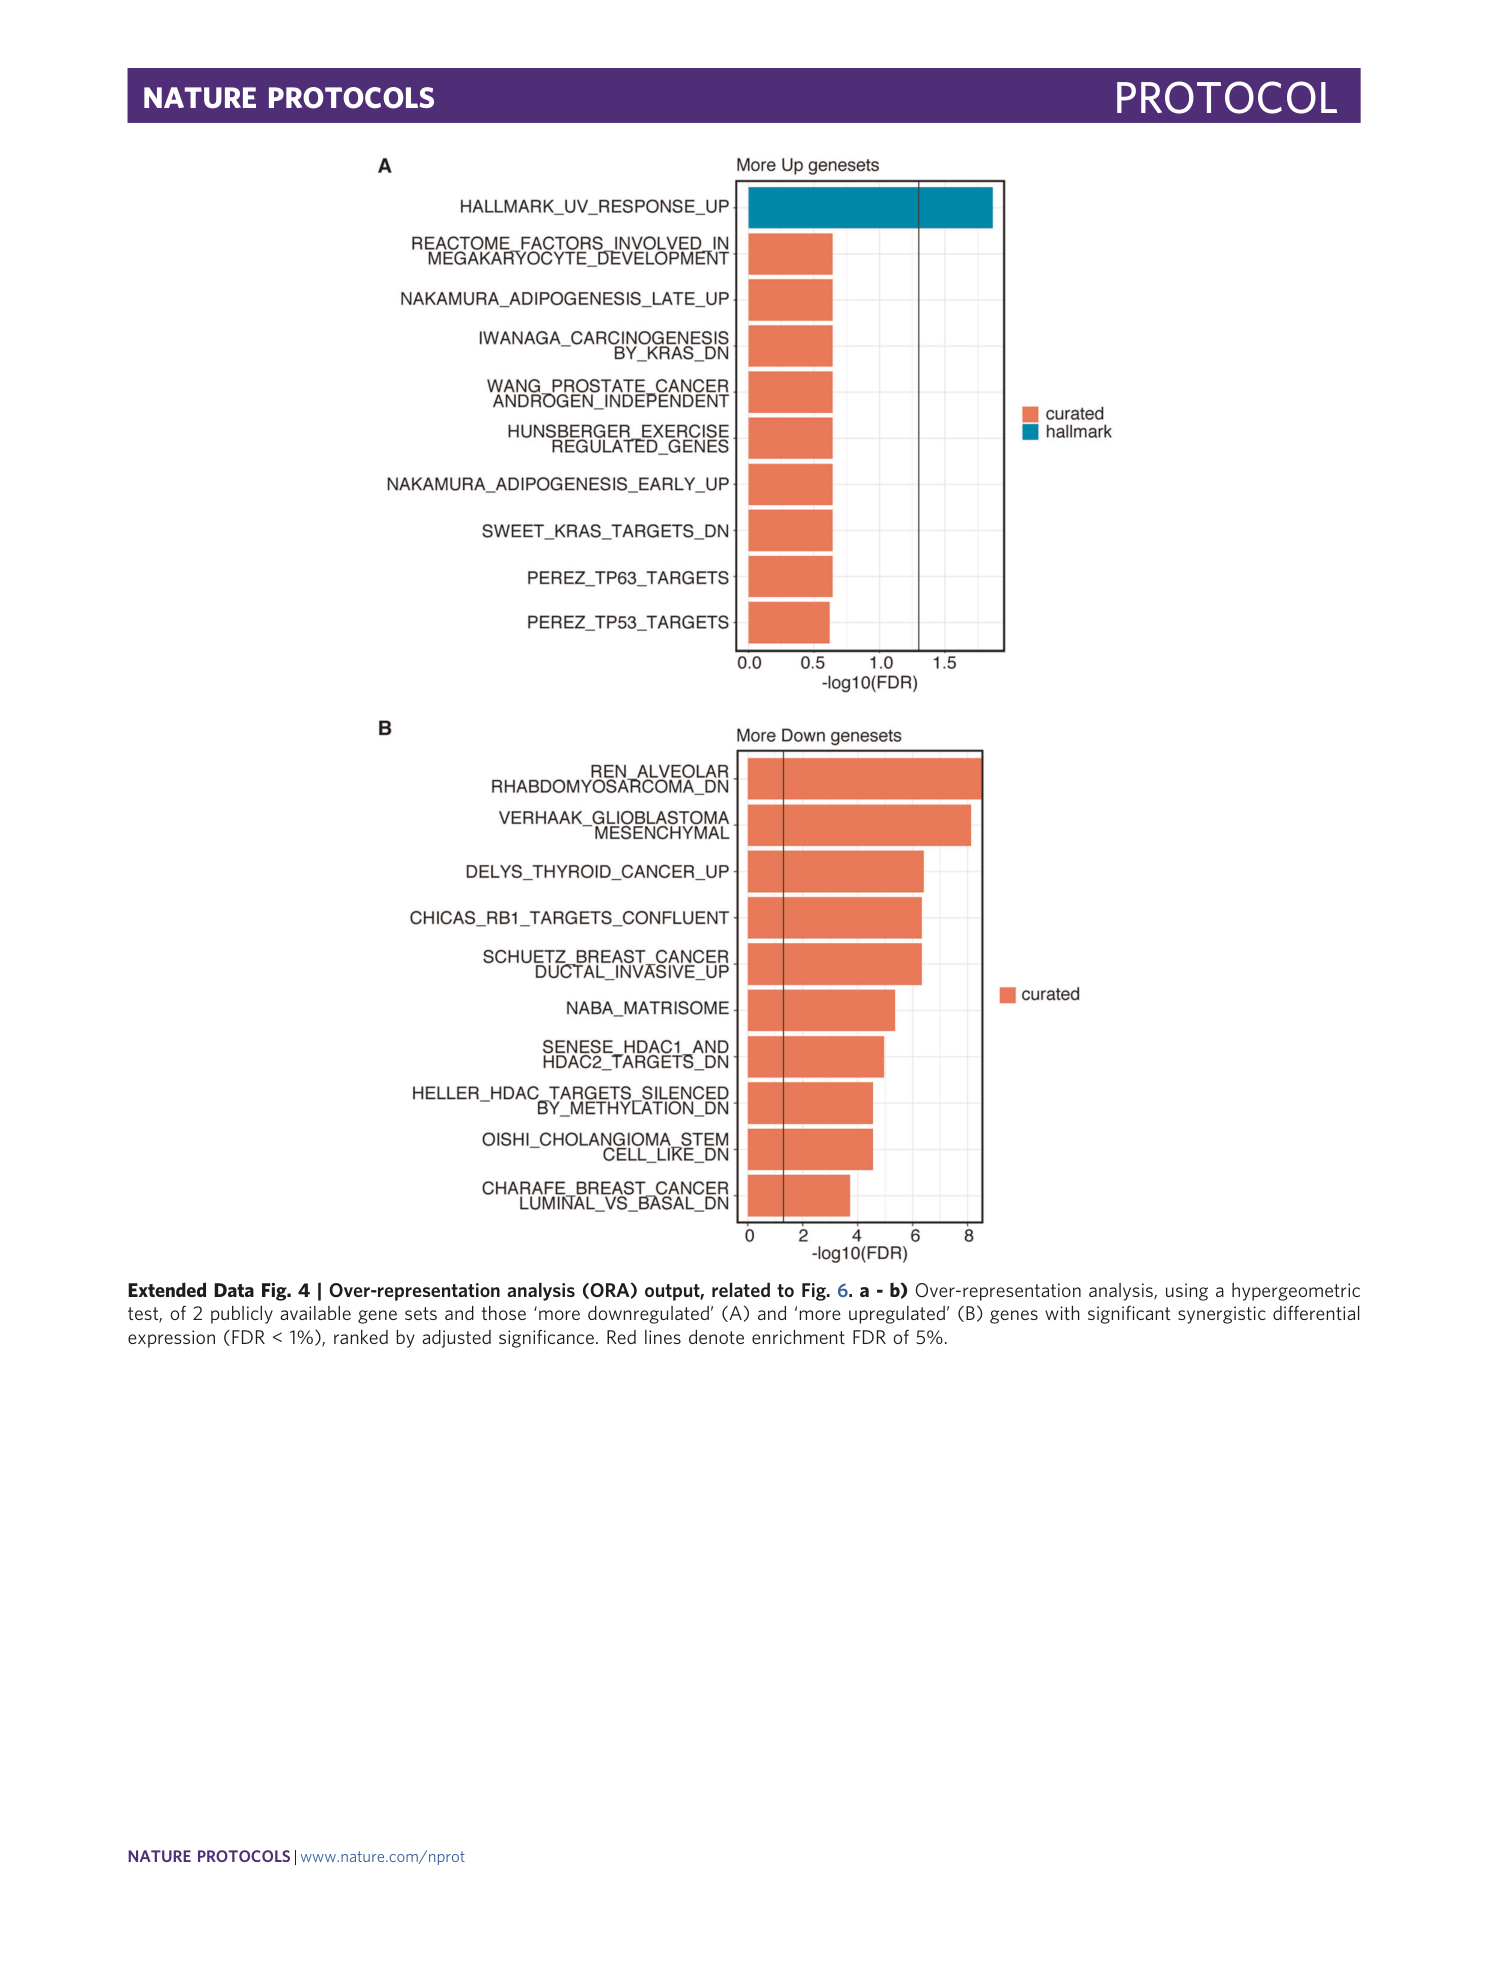
[ Extended Data Fig. 4 Over-representation analysis (ORA) output, related to Fig. 6 . ](https://www.nature.com/articles/s41596-020-00436-7/figures/10)
a - b) Over-representation analysis, using a hypergeometric test, of 2 publicly available gene sets and those ‘more downregulated’ (A) and ‘more upregulated’ (B) genes with significant synergistic differential expression (FDR < 1%), ranked by adjusted significance. Red lines denote enrichment FDR of 5%.
Supplementary information
Reporting Summary
Supplementary Data 1
R code, count matrix, metadata file and gene annotation file for analysis used in ref. 20.
Supplementary Data 2
R code, count matrix, metadata file, gene annotation file and gene sets for supplementary analysis using data from ref. 44.
