Tutorial: guidelines for annotating single-cell transcriptomic maps using automated and manual methods
Tallulah S. Andrews, Zoe A. Clarke, Jawairia Atif, Delaram Pouyabahar, Brendan T. Innes, Sonya A. MacParland, Gary D. Bader
Published: 2021-05-23 DOI: 10.1038/s41596-021-00534-0
Extended
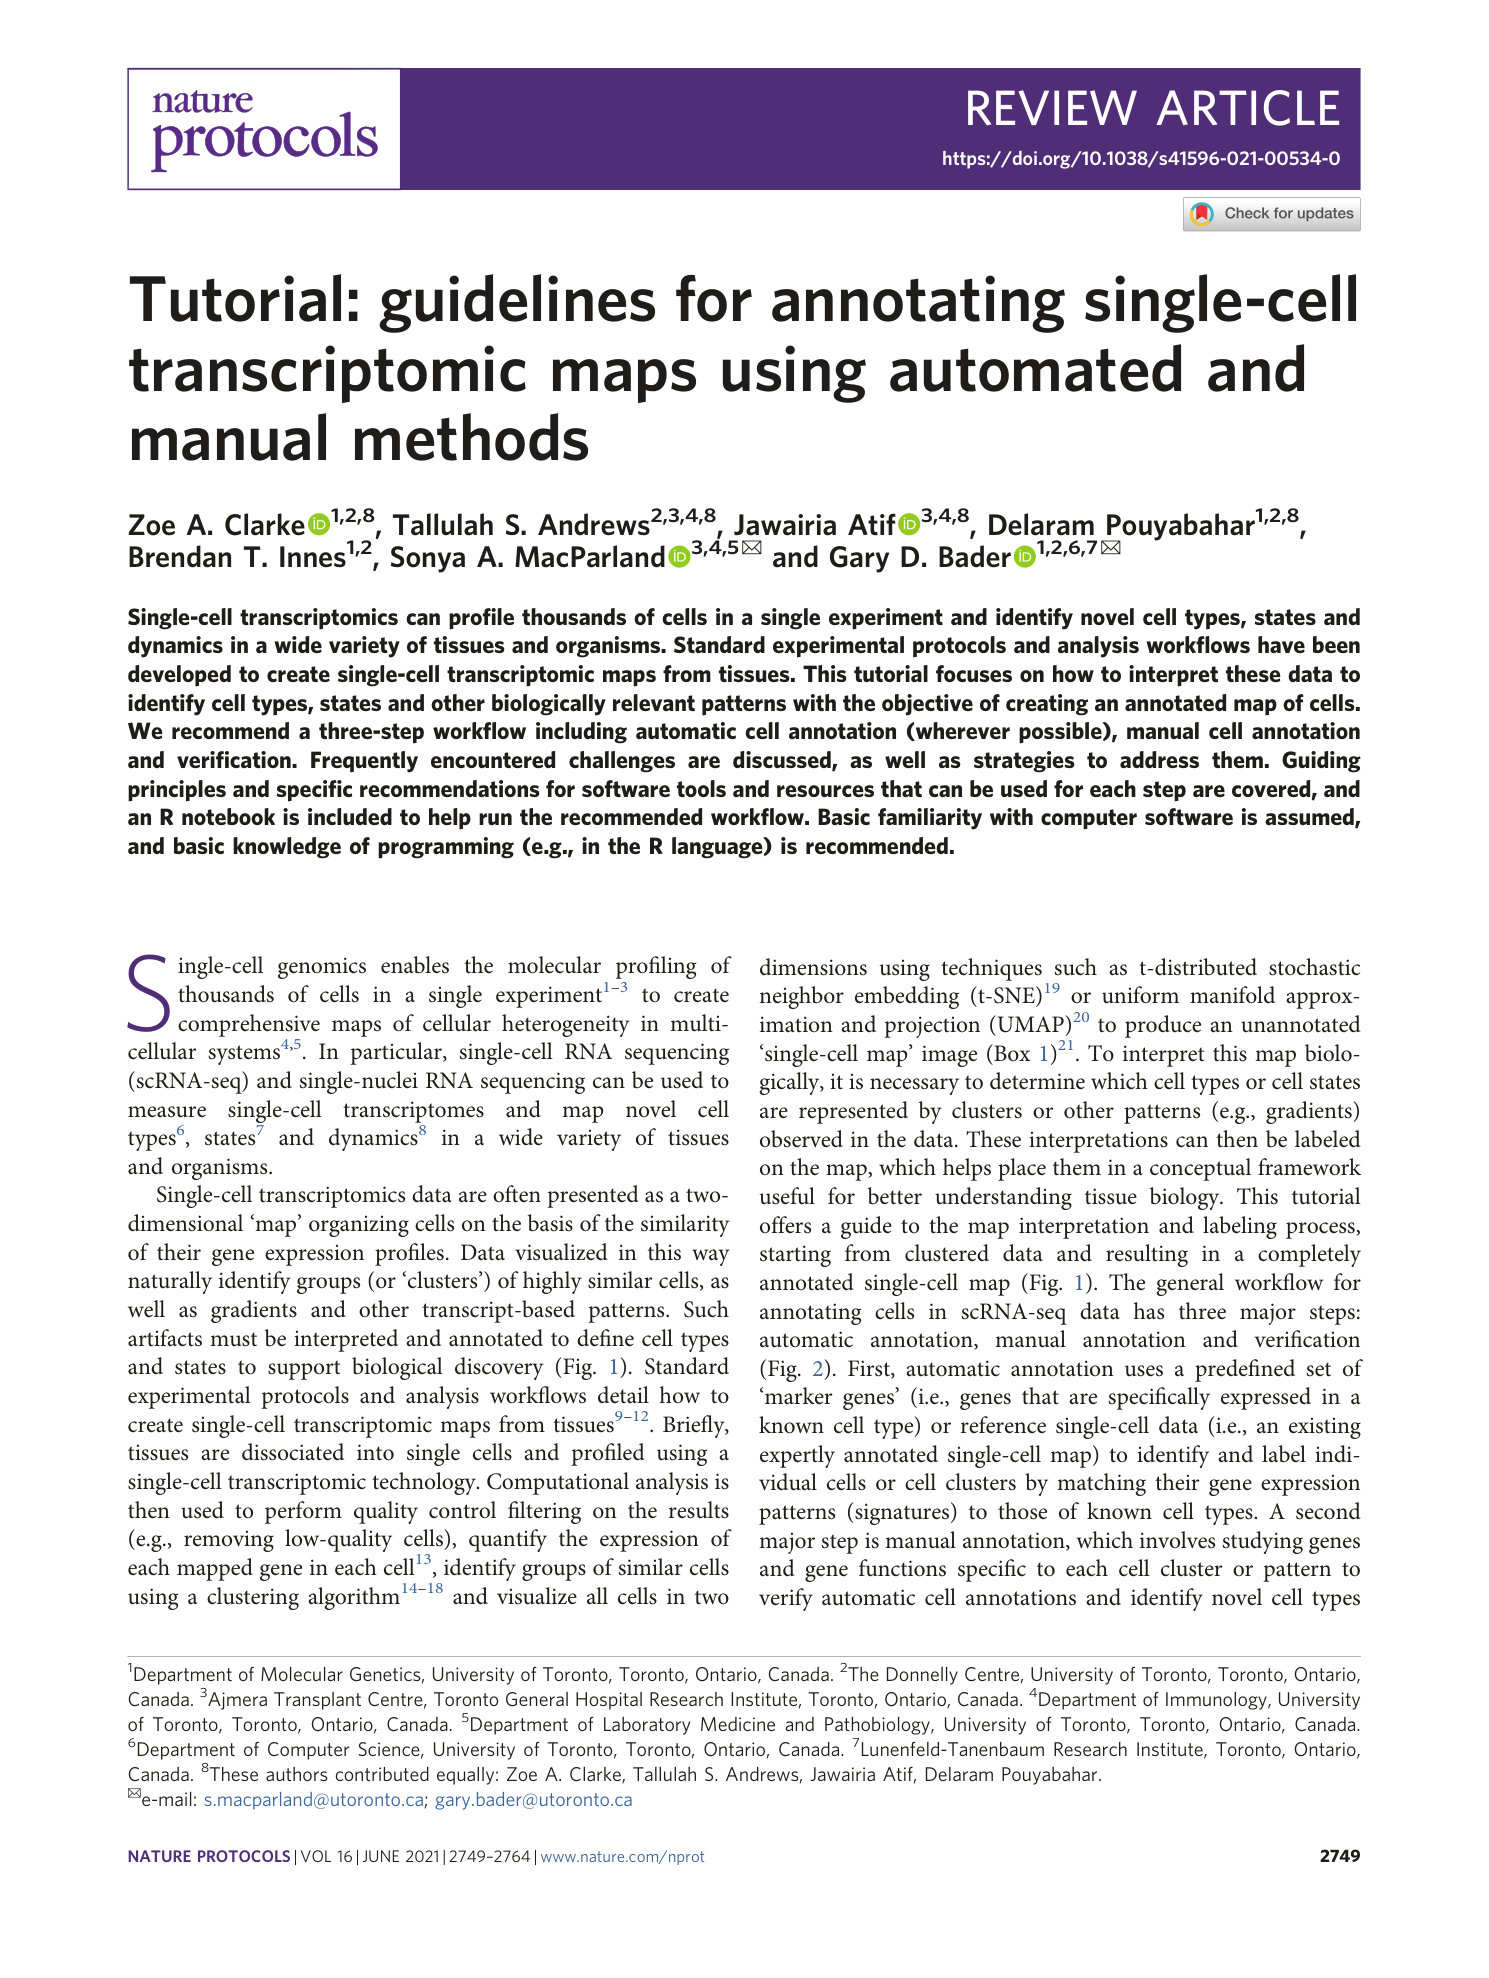
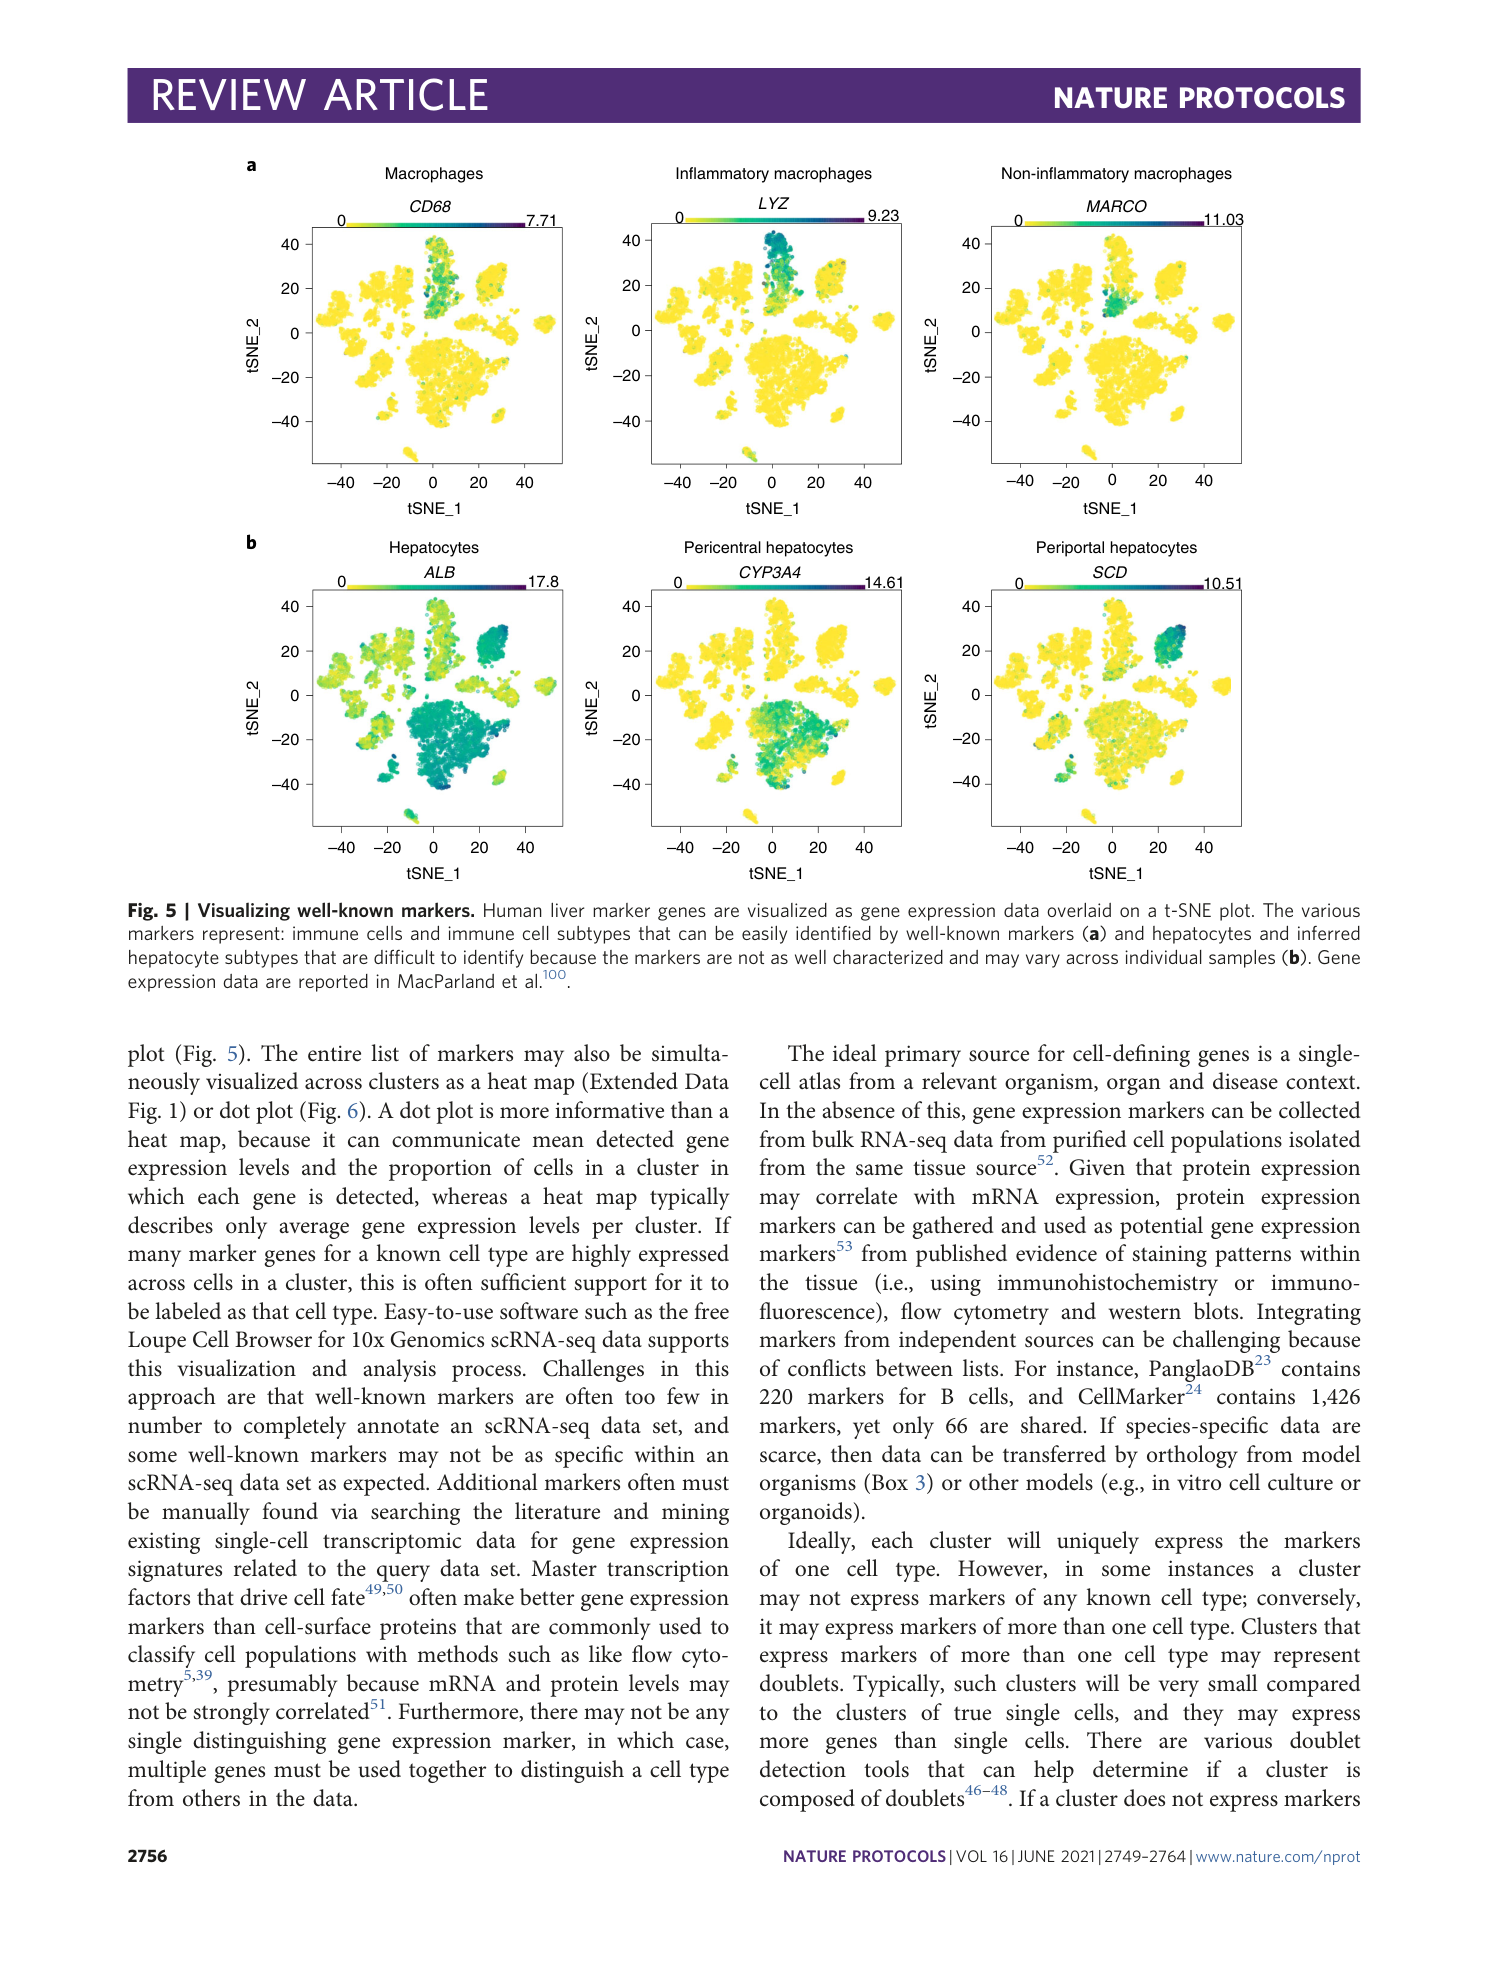
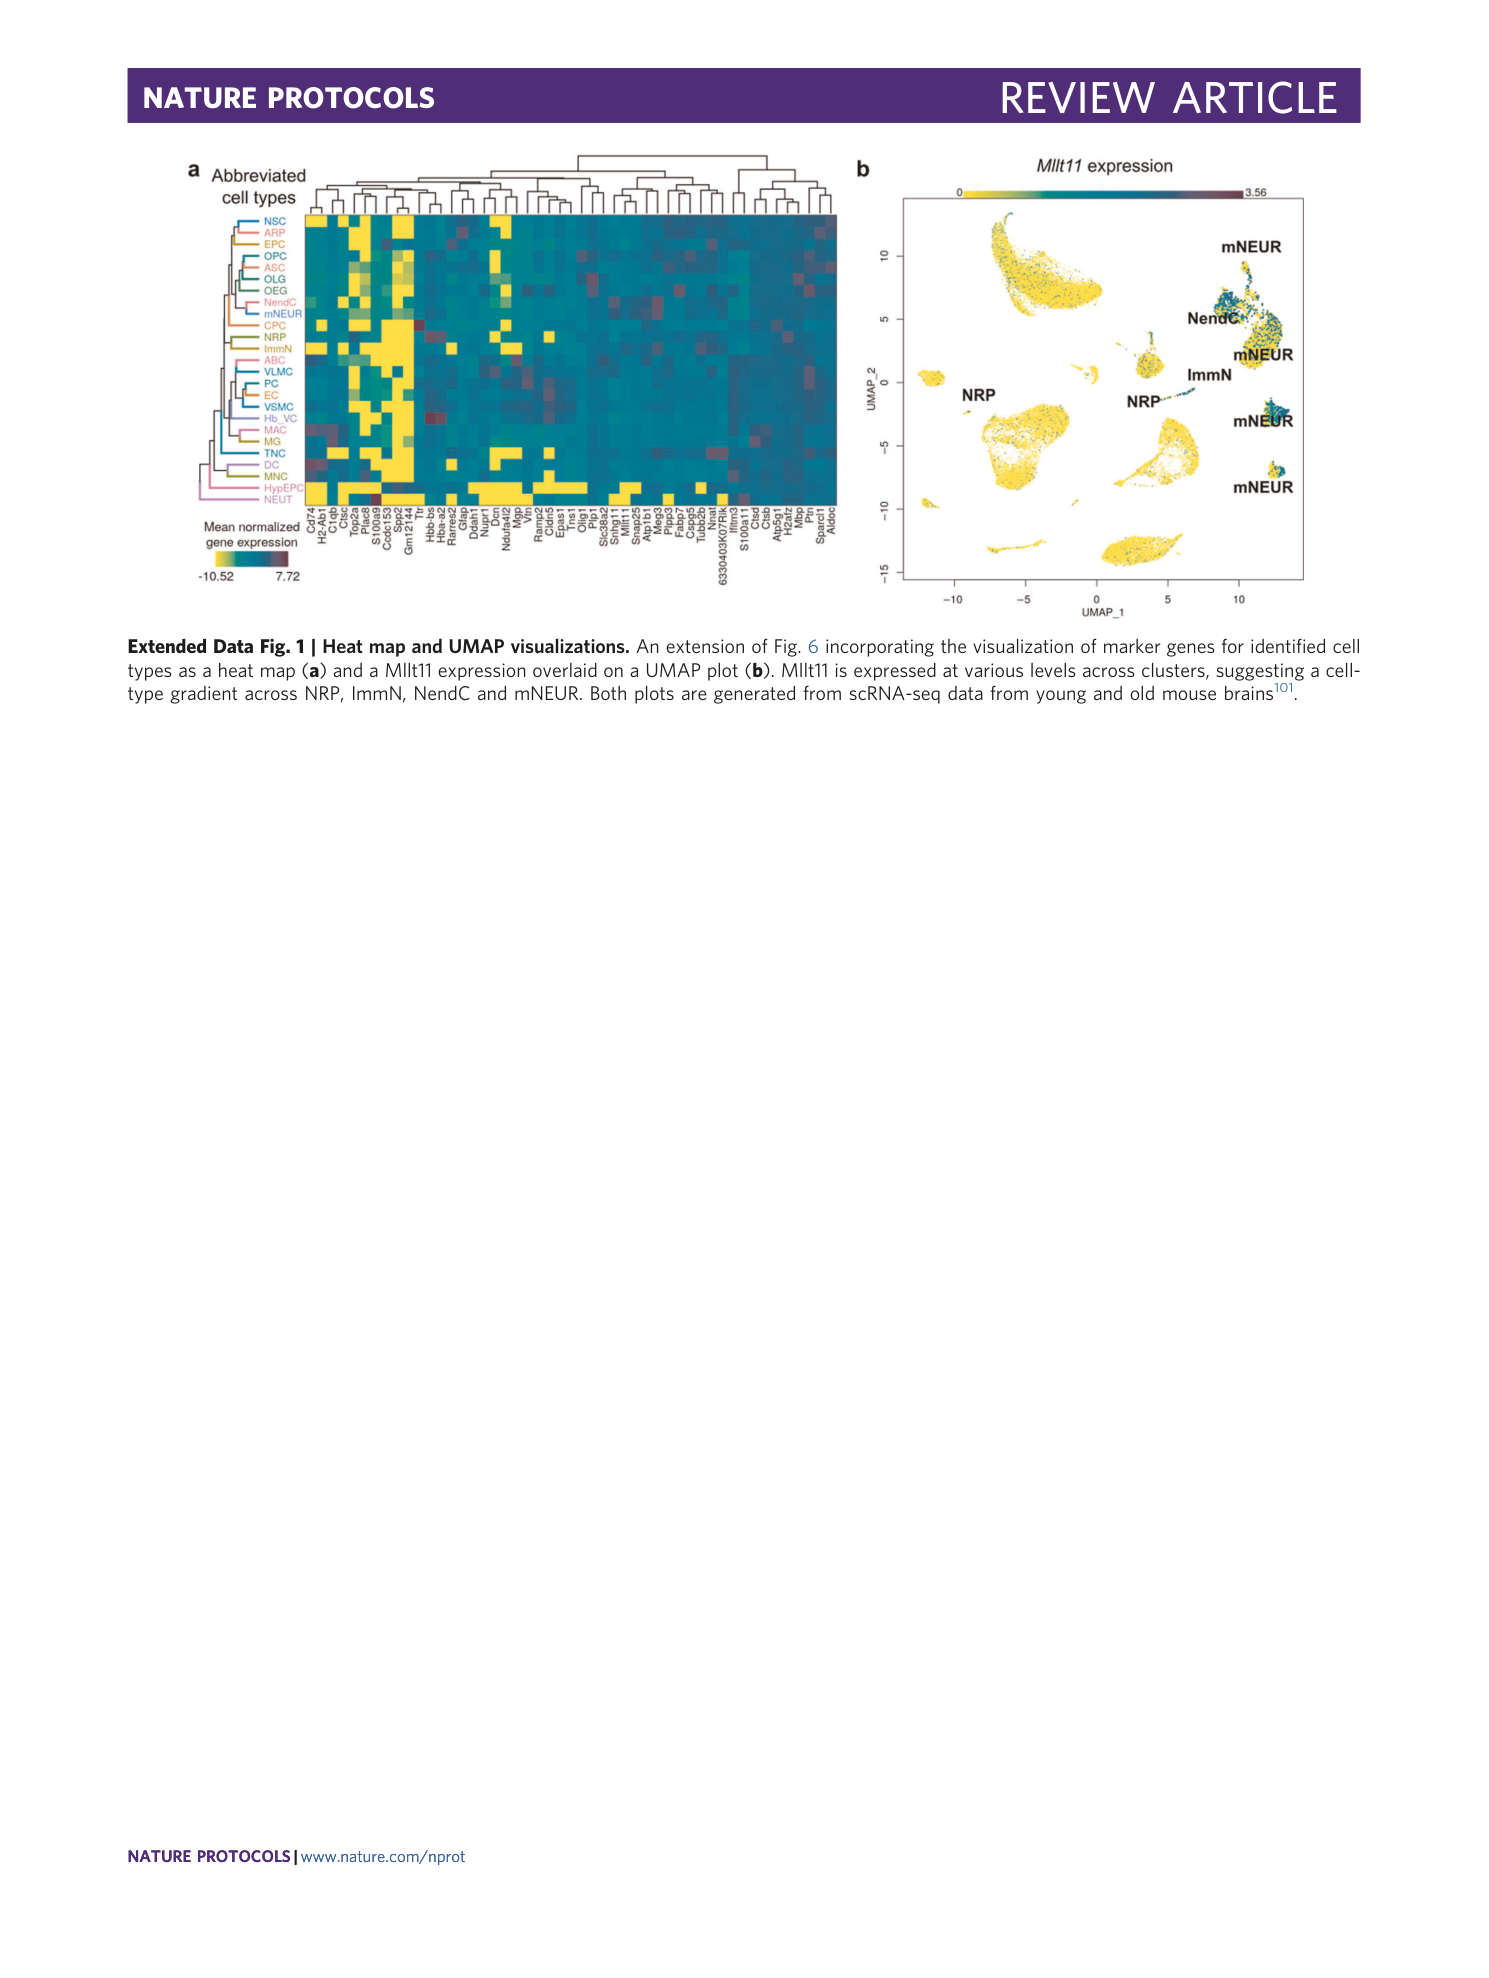
Extended Data Fig. 1 Heat map and UMAP visualizations.
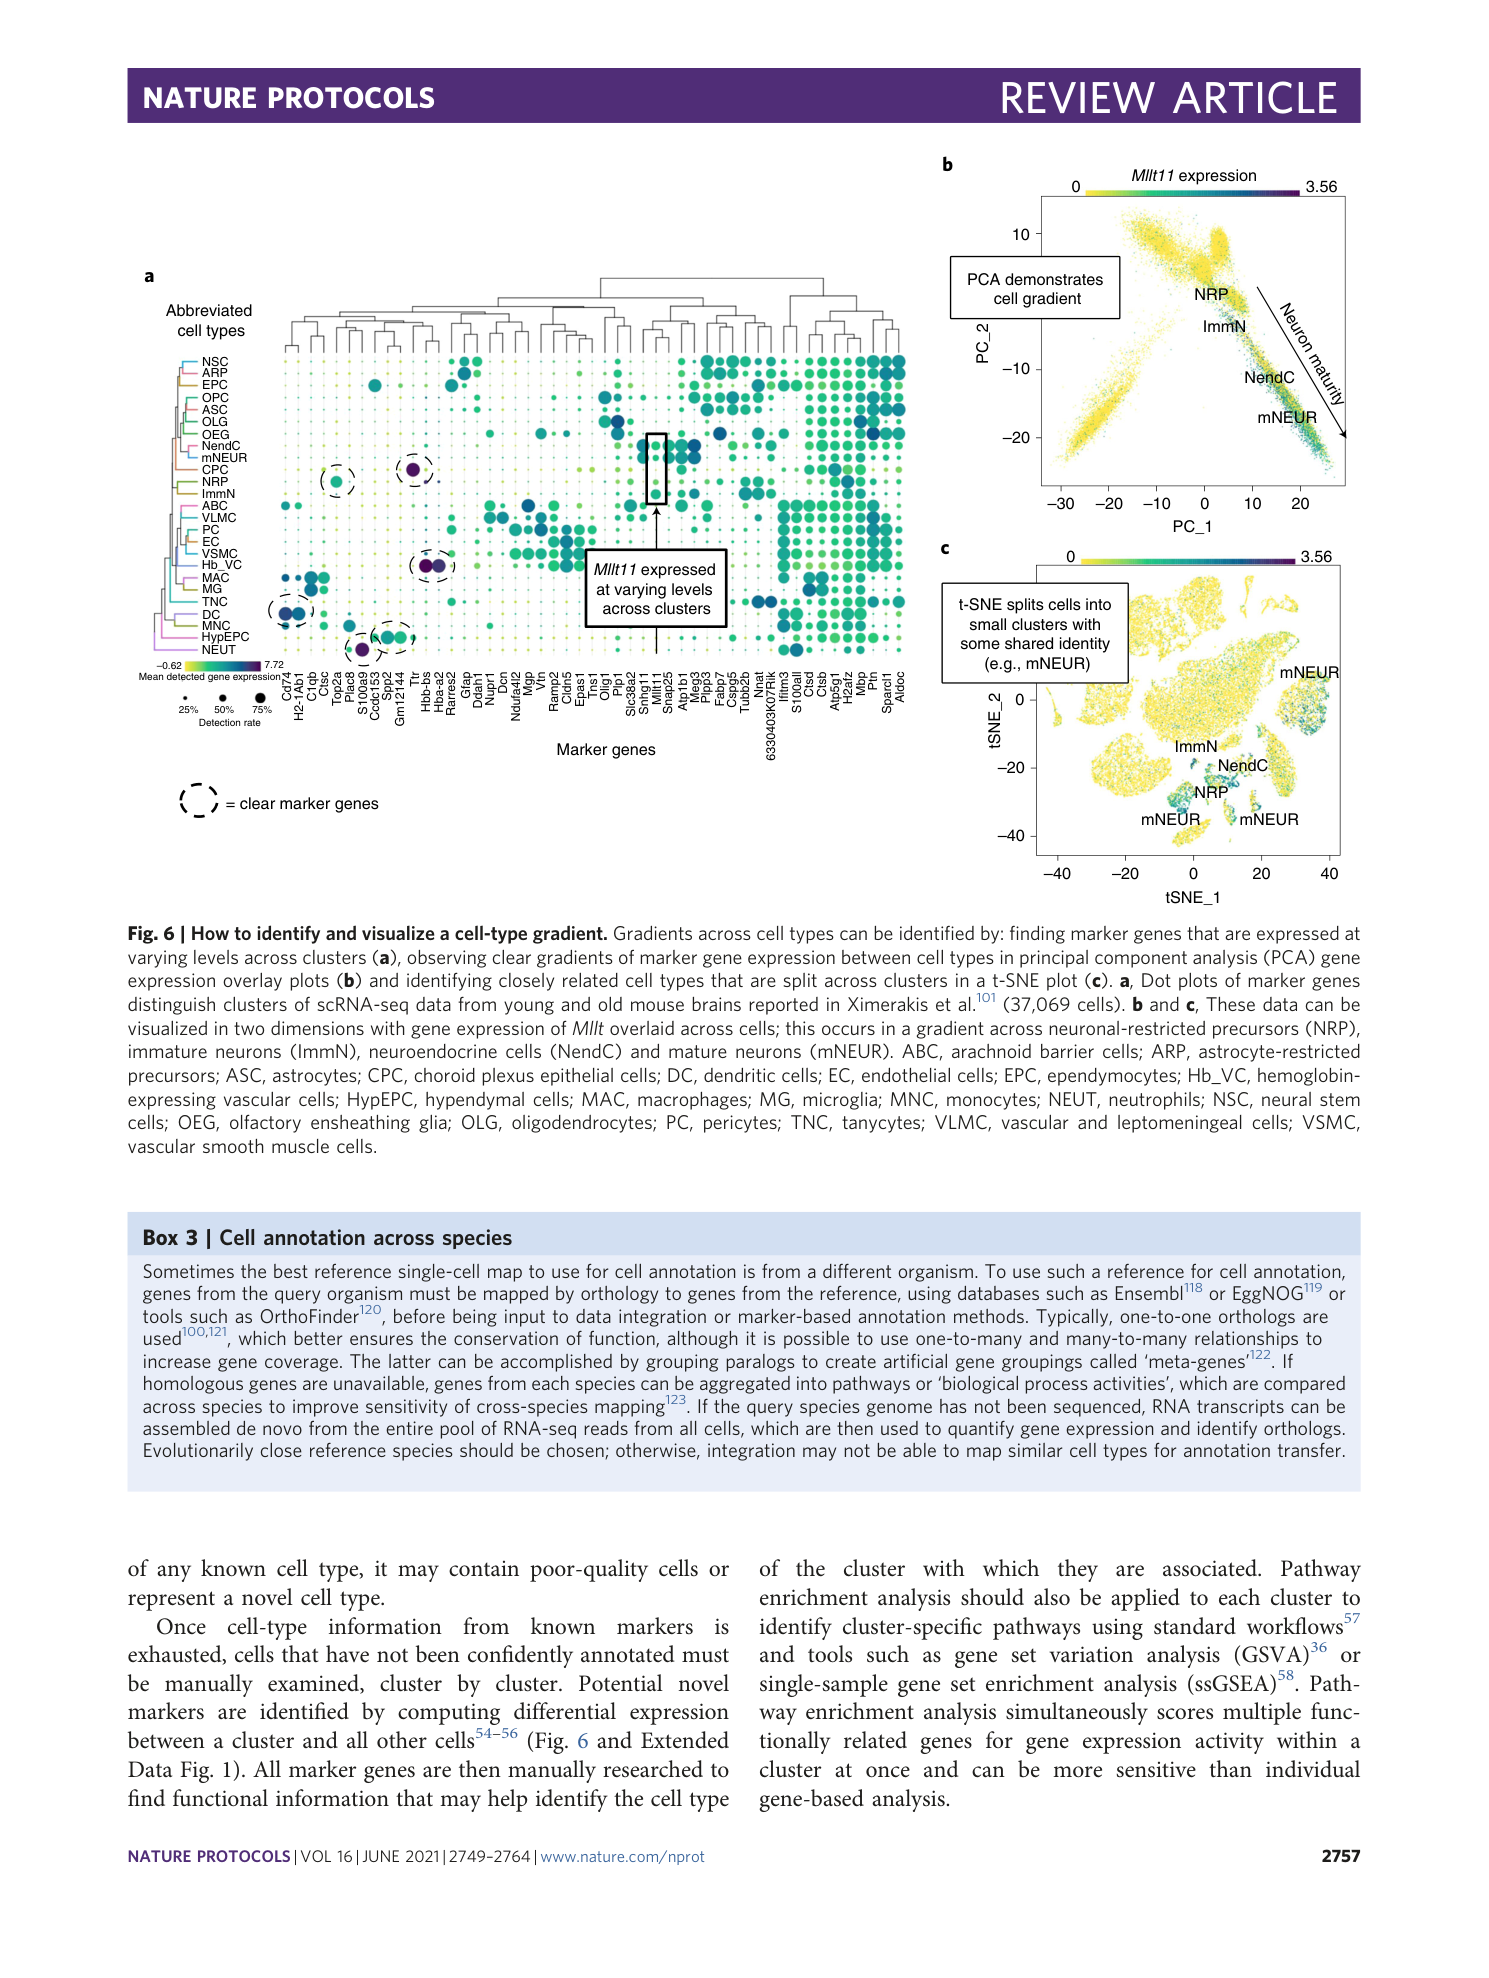
An extension of Fig. 6 incorporating the visualization of marker genes for identified cell types as a heat map ( a ) and a Mllt11 expression overlaid on a UMAP plot ( b ). Mllt11 is expressed at various levels across clusters, suggesting a cell-type gradient across NRP, ImmN, NendC and mNEUR. Both plots are generated from scRNA-seq data from young and old mouse brains 101 .
Supplementary information
Supplementary Information
Supplementary Table 1.
