Lagash Archaeological Survey and Recording System (LASRS) - Rectangular Survey Grid Creation with QGIS
Paul C. Zimmerman
Abstract
Tools available in the open-source GIS program QGIS can be used to create a rectangular grid for archaeological surveys within irregularly-shaped boundaries. This protocol describes the steps necessary for generating the grid, trimming it to the desired survey area, and uniquely labeling the nodes generated.
Steps
Create Your QGIS Project
Launch QGIS and select the New Empty Project template.
Click the project CRS button in the lower right of the window and select the appropriate EPSG with UTM coordinates for your survey.
- For most of Iraq, this will be WGS 84 / UTM zone 38N (EPSG:32638) .
Download background imagery.

Click the QuickMapServices button in the QGIS toolbar and choose the appropriate background map for your survey.
Save your QGIS project before proceeding.
Define the Survey Area
Zoom to your survey area.
Create a new shapefile layer.
Choose Layer > Create Layer > New Shapefile Layer… to open the New Shapefile Layer window.
Next to the File name field click the three dots button to choose the location where the new file will be saved. Name the new shapefile something sensible like Site Boundary or Survey Area .
From the Geometry type menu choose Polygon .
Verify that the CRS shown is the same as the project CRS, correcting this if it’s different.

Draw the outline of your study area.
In the Layers panel, double-click the newly-created polygon layer to open its Properties window.
Select the Symbology panel and click on the Simple Fill symbol layer.
From the Symbol layer type menu choose Outline: Simple Line .
Change the line color and stroke width to values that will show clearly on your background imagery.
 button then the Add Polygon Feature button.")
Left-click to place vertices that define the polygon bounding the survey area. Use the scroll wheel on your mouse to zoom in and out as necessary and the spacebar to pan. When finished, right-click to finish the polygon.
When it pops up, dismiss the Feature Attributes window by clicking OK, leaving the id null.
If necessary, use the Vertex Tool edit the newly-created survey boundary polygon by moving, adding, or removing its vertices.
Click the Toggle Editing button, and save your changes.
Save your QGIS project before proceeding.

Generate the Unlabeled Survey Grid
Create the base grid
Choose Vector > Geometry Tools > Centroids… to open the Centroids algorithm settings.
Choose Vector > Research Tools > Create Grid… to open the Create Grid algorithm settings.
Leave Grid type at Point .

Set Horizontal spacing and Vertical spacing to the intended spacing of your survey grid.
Set the Grid CRS to the same value as the project CRS.
Leave the other values at their defaults and click the Run button.
In the Layers pane, right-click on the newly-created Grid layer and select Open Attribute Table .
Click the Toggle editing mode (pencil) button in the upper left of the Attribute Table window to enable editing.
Click the Open field calculator (abacus) button to open the Field Calculator window.
Make sure that the Only update n selected feature(s) n selected feature(s) option is unchecked and that Create a new field is checked.
Set the Input Layer to the layer created in steps 5–9 .
Enter transect for the Output field name .
In the Expression field enter the following formula, then click the OK button.
(("left" - minimum("left")) / ceil((maximum("left") - minimum("left")) / count_distinct("left"))) + 1
Click the Toggle editing mode (pencil) button in the upper left of the Attribute Table window and then click Save to save the edits.
Leave the other values at their defaults and click the Run button.
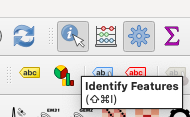
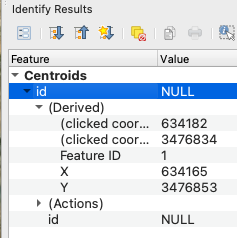
Use the Identify Features tool to get the coordinates of the centroid that you just created. Write these values down separately, as you will need to refer to them again later.
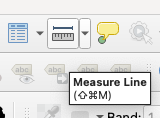
Use the Measure Line tool to find the distance from the centroid to the furthest edge of the survey area boundary created in steps 5–9 . This measurement doesn’t have to be exact, so round up to be sure that the entire boundary falls within the distance measured.
Choose Vector > Geoprocessing Tools > Buffer to open the Buffer algorithm settings.
Set the Input Layer to the Centroids layer.
Set the Distance to the value determined in step 10.5 .
Leave the other values at their defaults and click the Run button.
Rotate the grid to the alignment required by the survey.
In the Processing Toolbox find Vector geometry > Rotate and double-click it to open the Rotate algorithm settings.
Set the Input layer to the grid created in step 10 .
Set the Rotation (degrees clockwise) field to the appropriate value plus 270.
Set the Rotation anchor point field to the X and Y coordinates of the centroid, as recorded in step 10.4 , separated with a comma.

Remove points that lie outside the survey area.
Choose Vector > Geoprocessing Tools > Clip… to open the Clip algorithm settings.
Set the Input layer to the rotated grid created in step 11 .
Set the Overlay layer to the polygon created in step 6 .
Click the Run button.
In the Layers pane, select the grid layers created in steps 10 and 11 and remove them.
In the Layers pane, right-click on the newly-created Clipped layer and select Show Feature Count to reveal the number of grid nodes within the survey area, from which you can calculate the overall coverage and make estimations of project duration, cost, or any other pertinent constraints directly influenced by the number of survey units.
.")
Repeat steps 10–12 with different grid spacings and/or rotations to achieve the objectives of the survey. When done you can remove the Centroids and Buffered layers.
Create the Labeled Survey Grid
In order to easily identify the grid nodes, they should be given unique labels, which will be assigned in the QGIS Attribute Table for the layer.
In the Layers pane, right-click on the newly-created Clipped layer and select Open Attribute Table .
In the Layers pane, right-click on the Clipped layer and select Make Permanent…
From the Format menu, choose ESRI Shapefile .
Next to the File name field click the three dots button to choose the location where the new file will be saved. Name the new shapefile something sensible like Survey Grid , then click OK to save the shapefile.
In the Layers pane, right-click on the Clipped layer and select Rename Layer then type the name that you used in the previous step.

Save your QGIS project.
Click the Toggle editing mode (pencil) button in the upper left of the Attribute Table window to enable editing.
Click the Open field calculator (abacus) button to open the Field Calculator window.
Make sure that the Only update n selected feature(s) n selected feature(s) option is unchecked and that Create a new field is checked.
Enter node for the Output field name .
Set the Output field type to Text (string) .
In the Expression field enter the following formula, replacing
'<survey identifier>' || '/' || ("row" - minimum("row") + 1) || '-' || ("id" - minimum("id", "row") + 1)
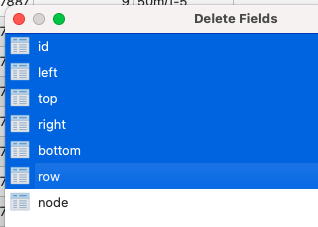
Click the Delete field button and remove all the fields except for the newly-created node field because they are no longer useful or accurate.

Click the Toggle editing mode (pencil) button in the upper left of the Attribute Table window and then click Save to save the edits.
Next Steps
Depending on the intended use of survey grid created, one may wish to alter the point symbology, or add labels (using the node field generated in step 14 ).
Finally, when you are satisfied that the grid meets the project’s needs, find the Survey Grid shapefile and zip all its components together to upload to ArcGIS Online (see the Creating Collection Forms with ArcGIS Field Maps protocol).
