Interrogating in vivo T-cell metabolism in mice using stable isotope labeling metabolomics and rapid cell sorting
Ryan D. Sheldon, Eric H. Ma, Lisa M. DeCamp, Kelsey S. Williams, Russell G. Jones
Supplementary information
Reporting Summary
Supplementary Table 1
Compound list using the described HILIC LC/MS method. Important: Retention times will vary from lab to lab and should be confirmed by chemical standards.
Supplementary Table 2
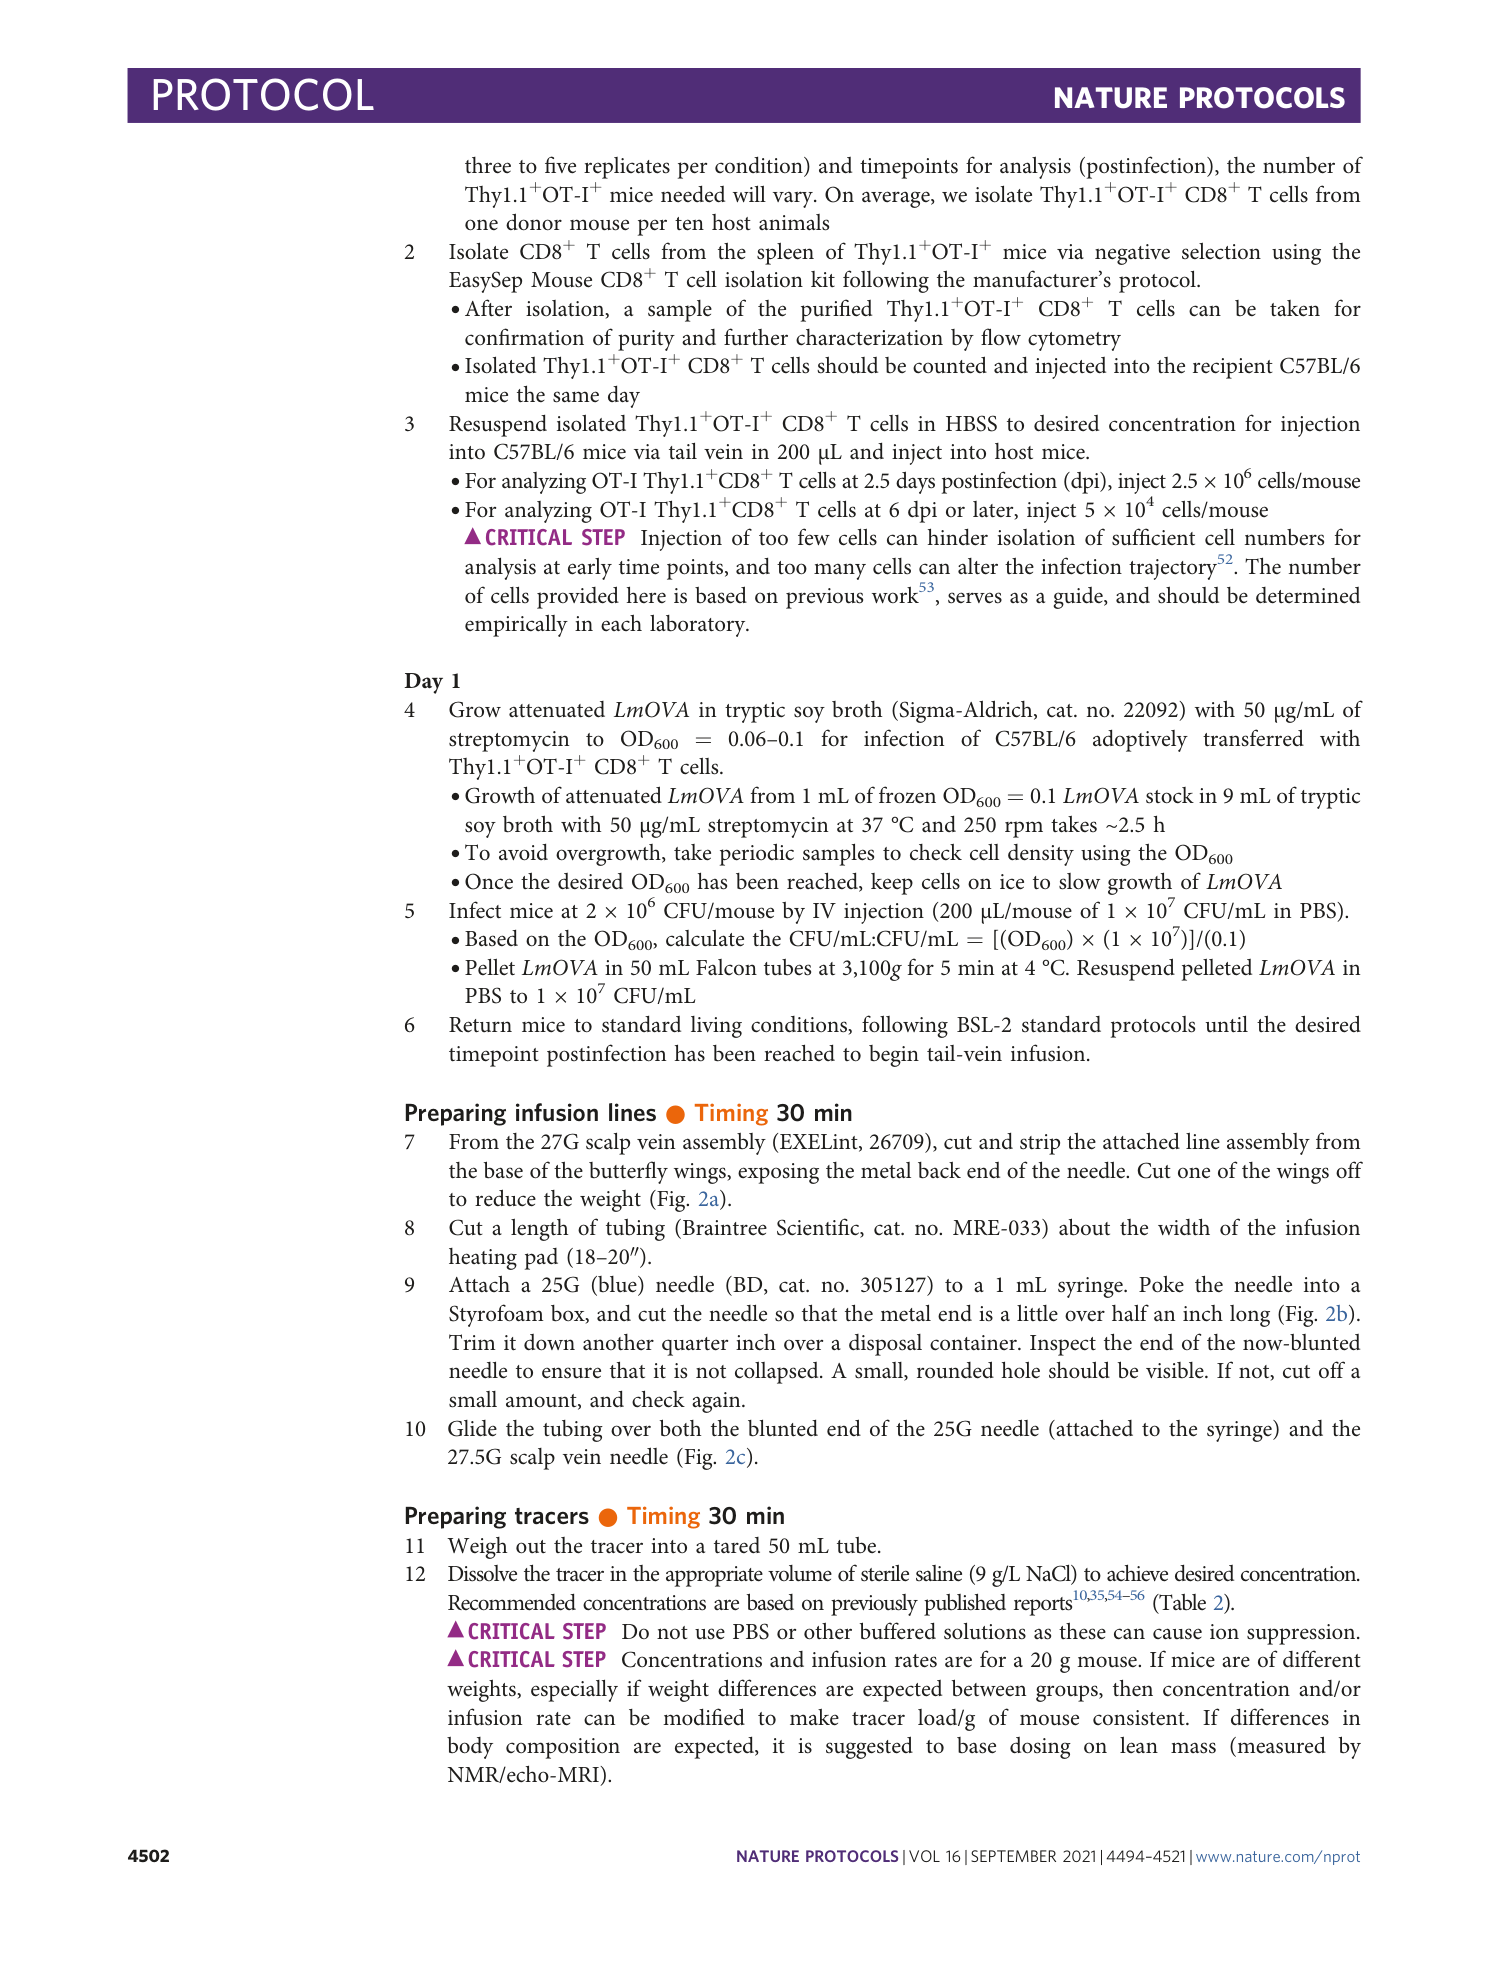
Compound list using the described GC/MS method. The quantifier ion is a molecular ion that can be used for isotope analysis. The qualifier ion should have the same retention and is used to improve confidence in compound identification. Important: Retention times will vary from lab to lab and should be confirmed by chemical standards.
Supplementary Table 3
This Excel document contains three tabs. The “Raw Tracing Data” tab contains raw peak areas and natural abundance corrected values and fractional enrichment for each compound. The “T cells total 13C-enrichment” contains the total fractional enrichment of 13C carbon in each compound. These data have been filtered to include only compounds with at least 5% enrichment on average in at least one group. The “Subset >5% enrichment” contains this filtered data. In each tab, sample identifiers are as follows: Phenformin group: S1-00, S1-01, S1-30; Vehicle group: S2-03, S2-10, S2-30.
