In vivo and ex vivo electrophysiological study of the mouse heart to characterize the cardiac conduction system, including atrial and ventricular vulnerability
Konstantin Hennis, René D. Rötzer, Julia Rilling, Yakun Wu, Stefan B. Thalhammer, Martin Biel, Christian Wahl-Schott, Stefanie Fenske


Extended
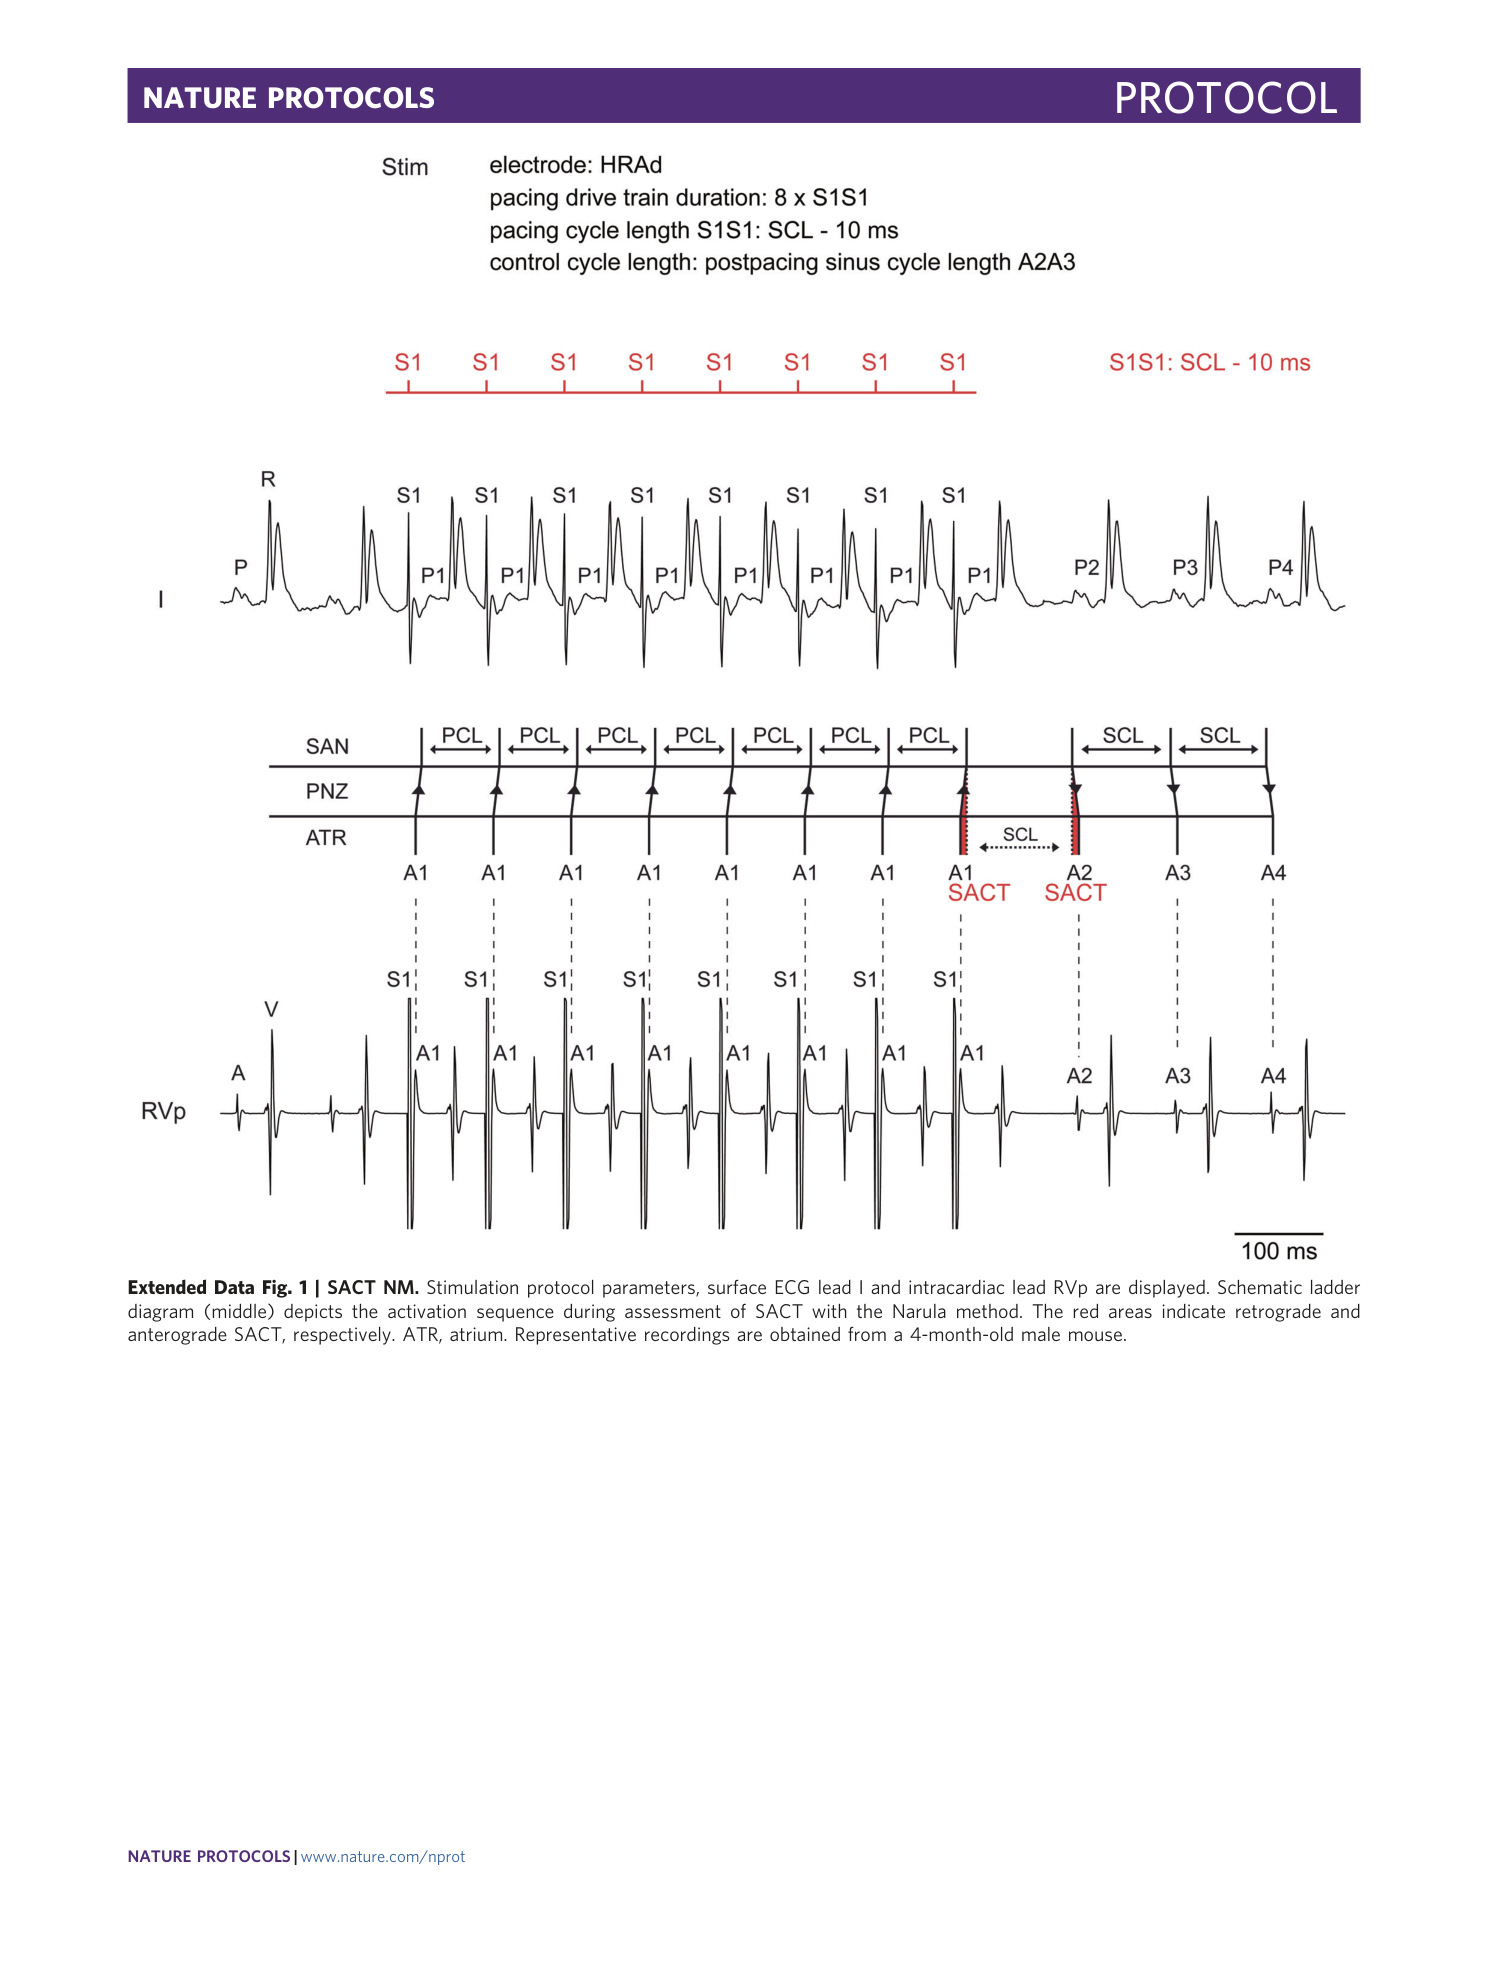
Extended Data Fig. 1 SACT NM.
Stimulation protocol parameters, surface ECG lead I and intracardiac lead RVp are displayed. Schematic ladder diagram (middle) depicts the activation sequence during assessment of SACT with the Narula method. The red areas indicate retrograde and anterograde SACT, respectively. ATR, atrium. Representative recordings are obtained from a 4-month-old male mouse.
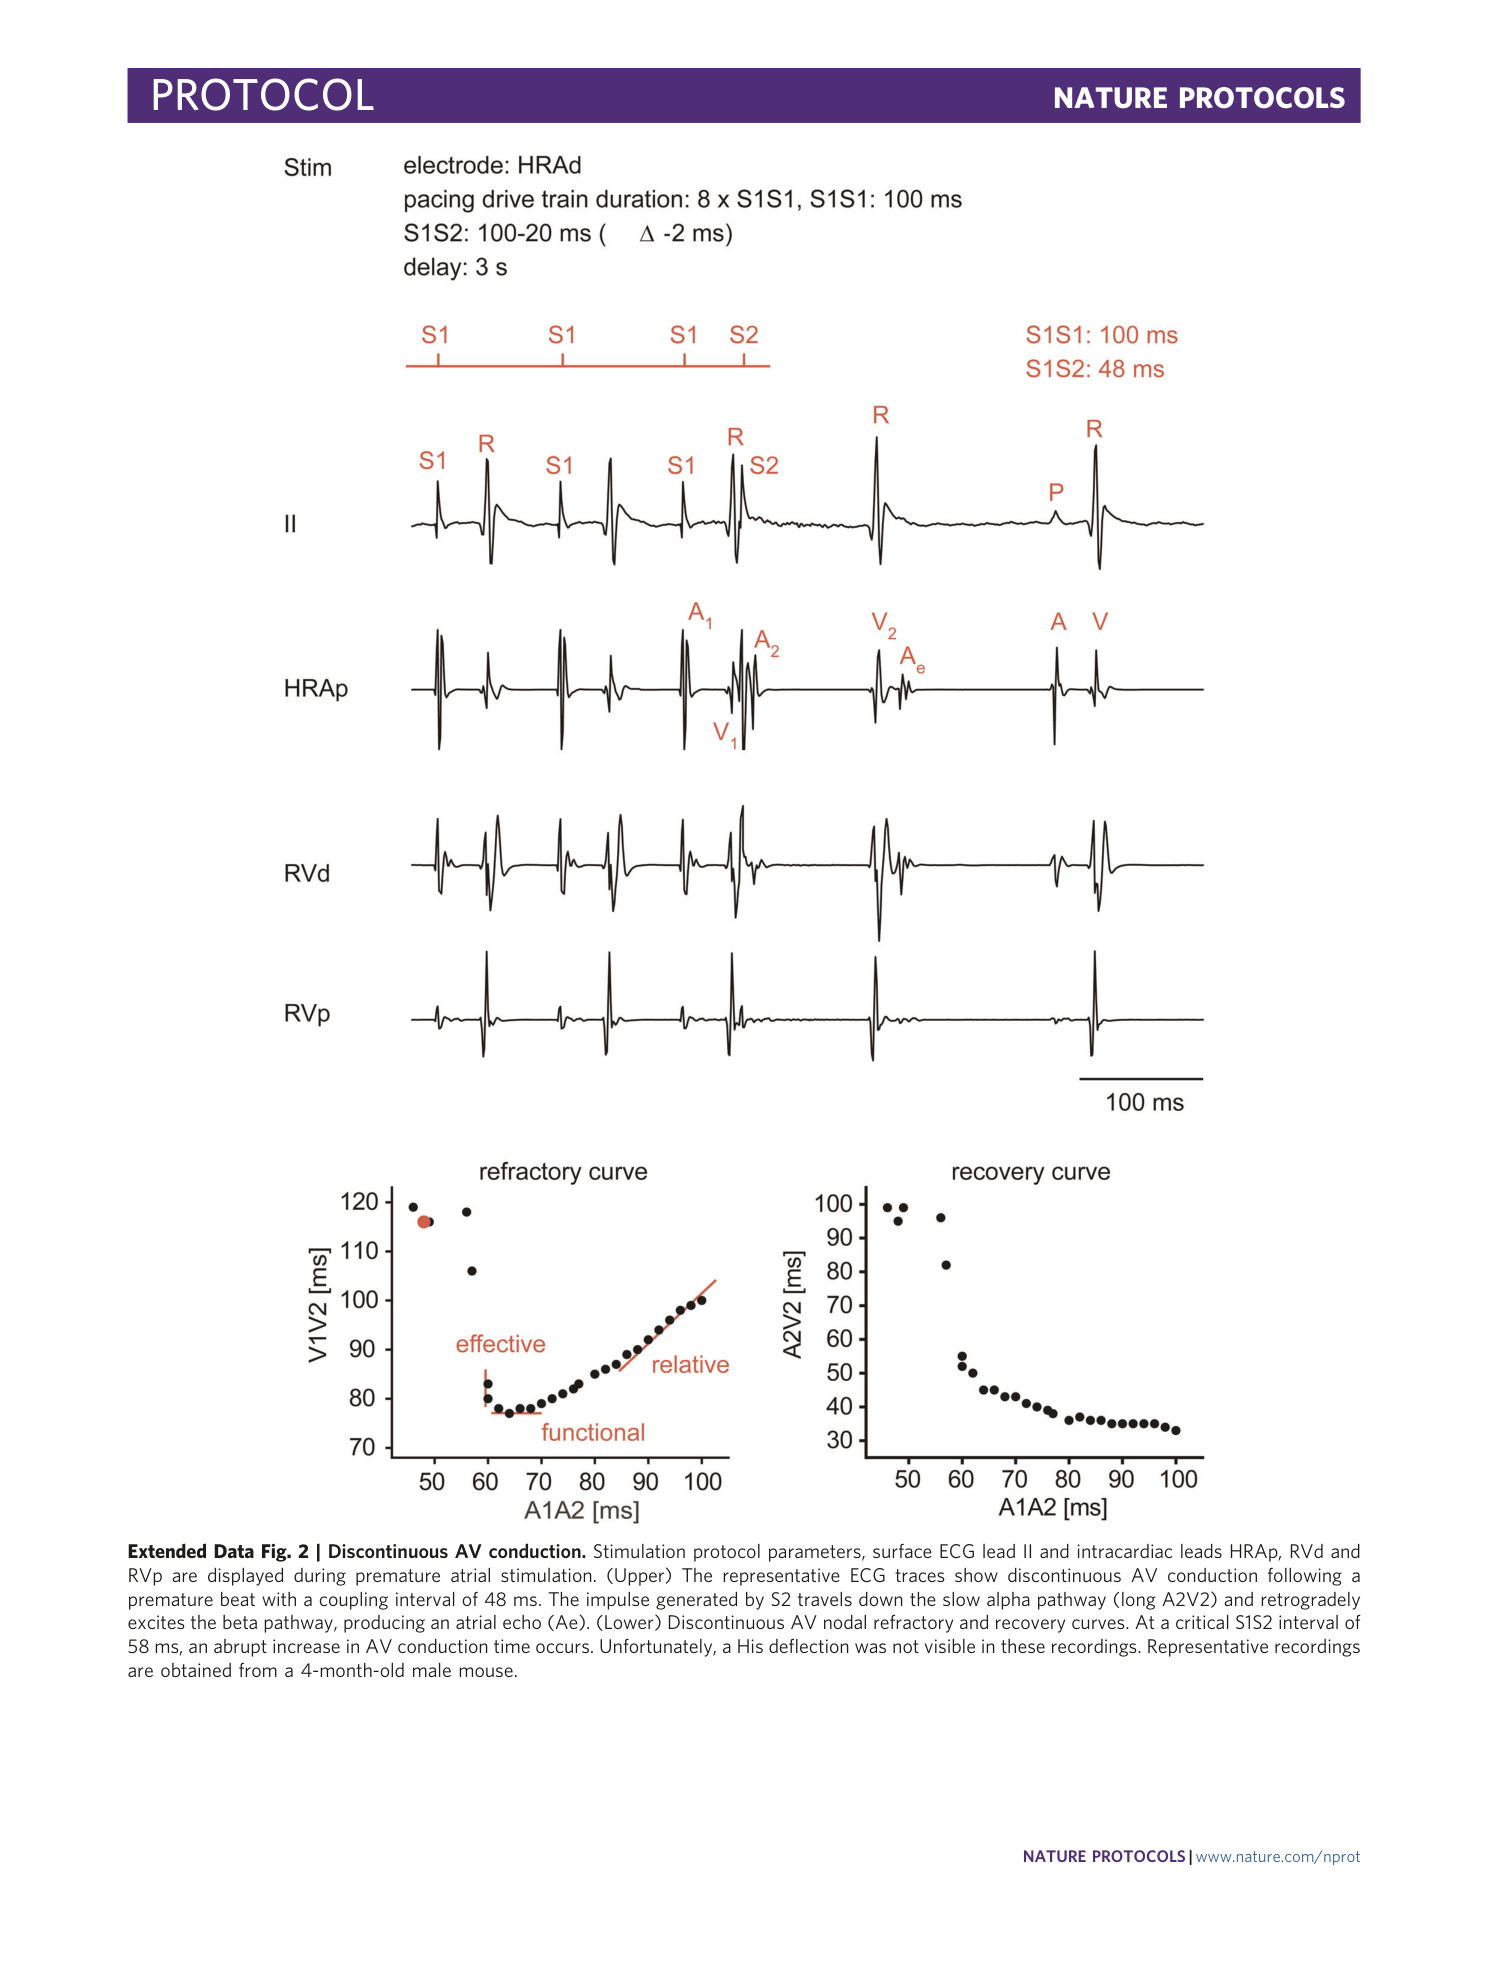
Extended Data Fig. 2 Discontinuous AV conduction.
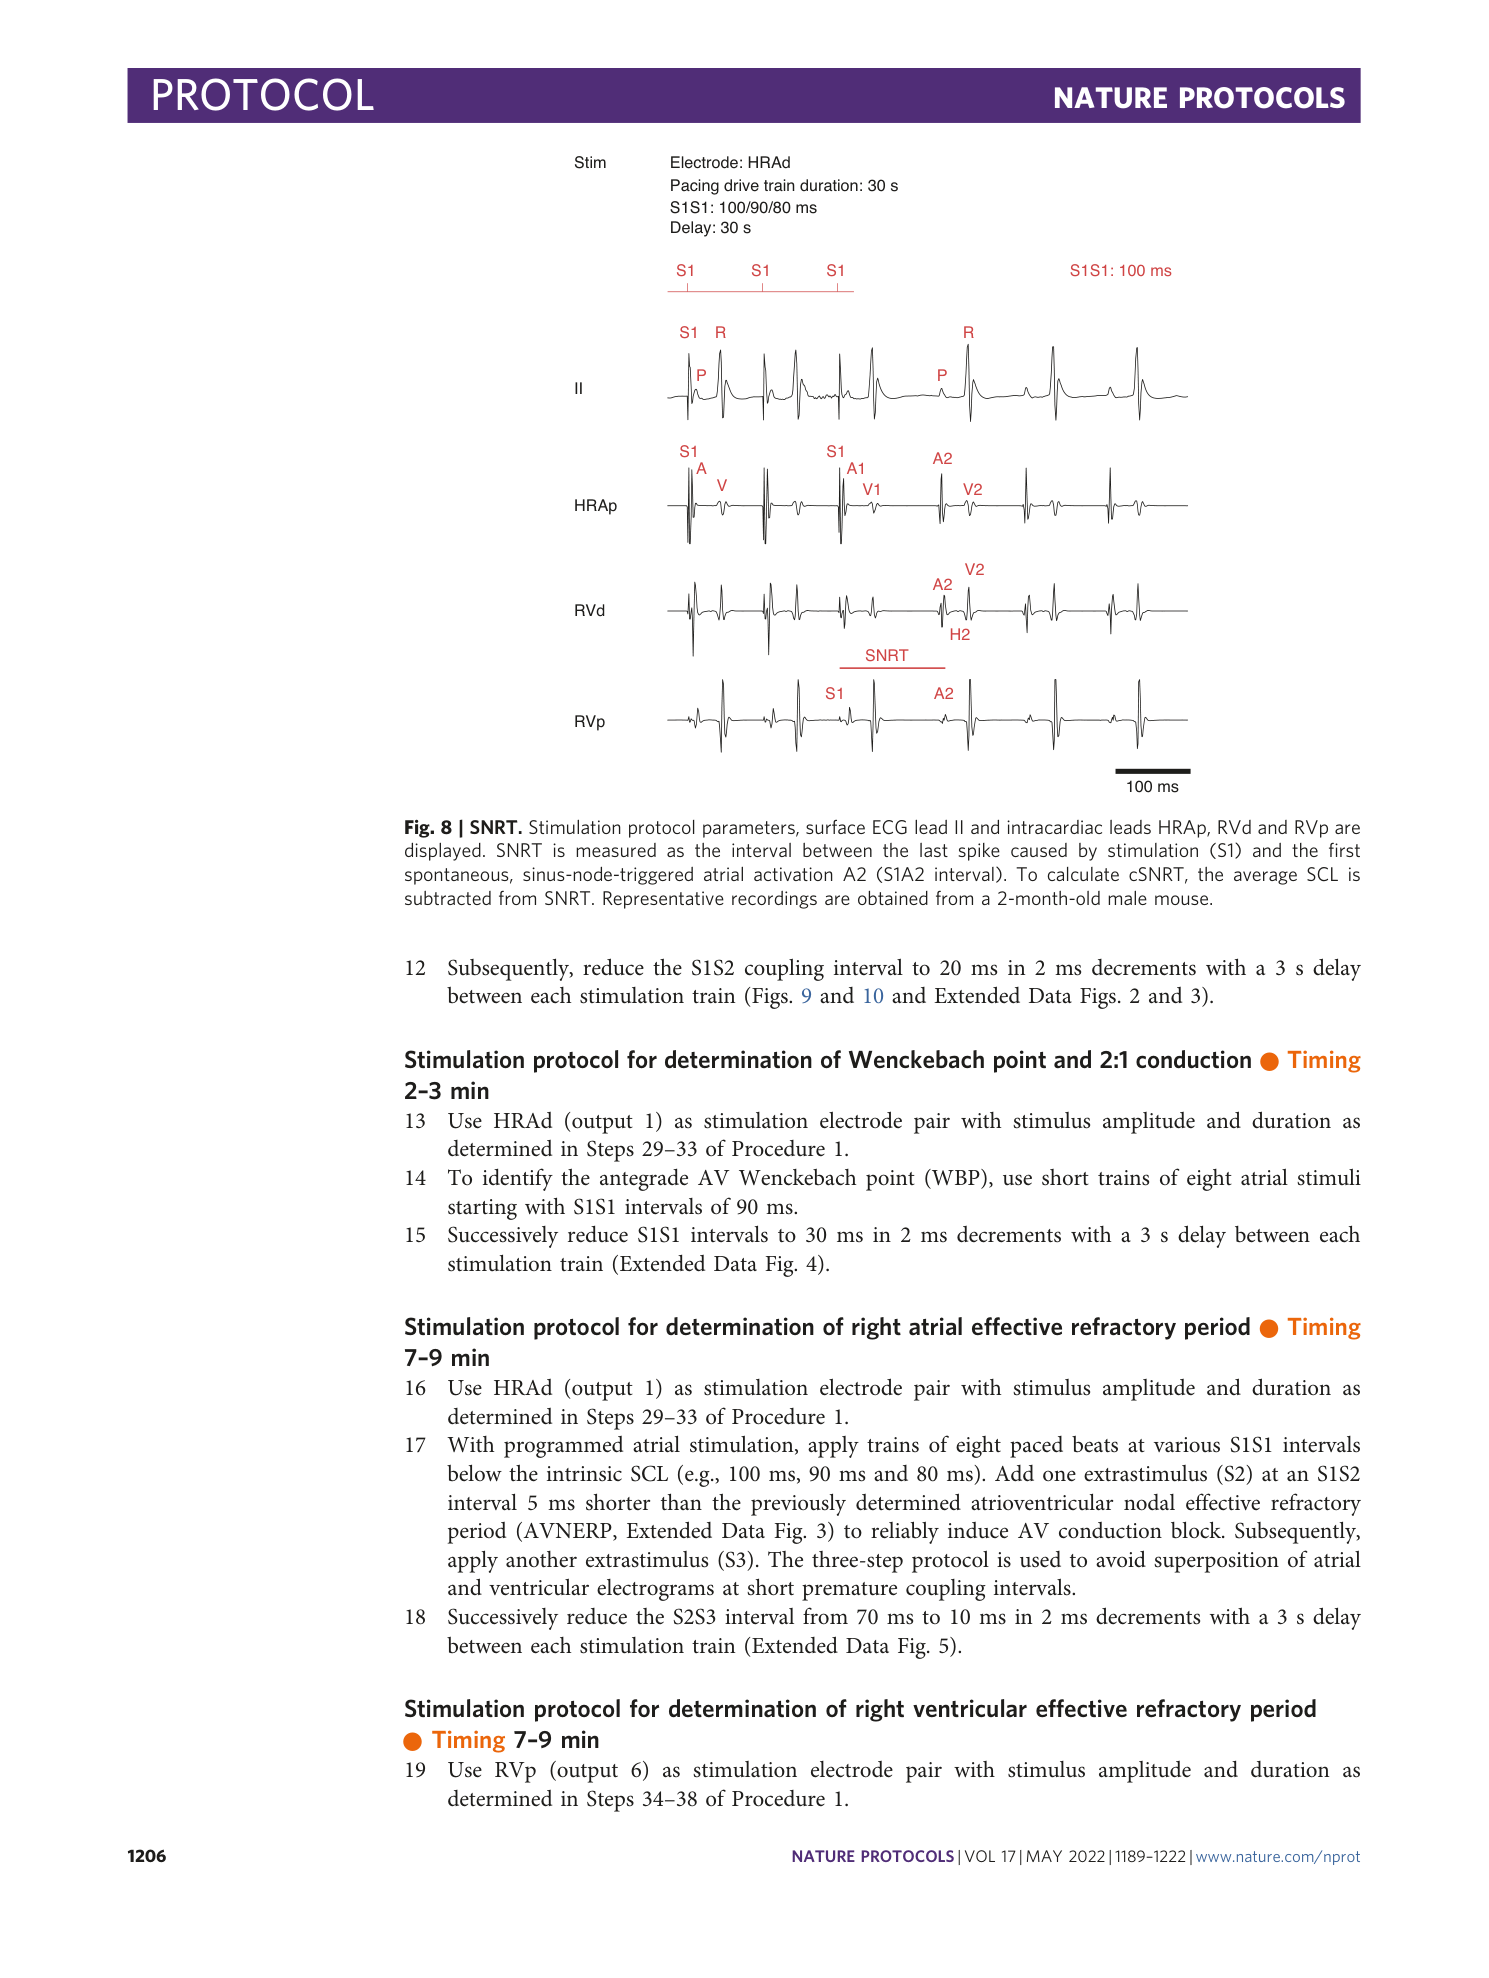
Stimulation protocol parameters, surface ECG lead II and intracardiac leads HRAp, RVd and RVp are displayed during premature atrial stimulation. (Upper) The representative ECG traces show discontinuous AV conduction following a premature beat with a coupling interval of 48 ms. The impulse generated by S2 travels down the slow alpha pathway (long A2V2) and retrogradely excites the beta pathway, producing an atrial echo (Ae). (Lower) Discontinuous AV nodal refractory and recovery curves. At a critical S1S2 interval of 58 ms, an abrupt increase in AV conduction time occurs. Unfortunately, a His deflection was not visible in these recordings. Representative recordings are obtained from a 4-month-old male mouse.
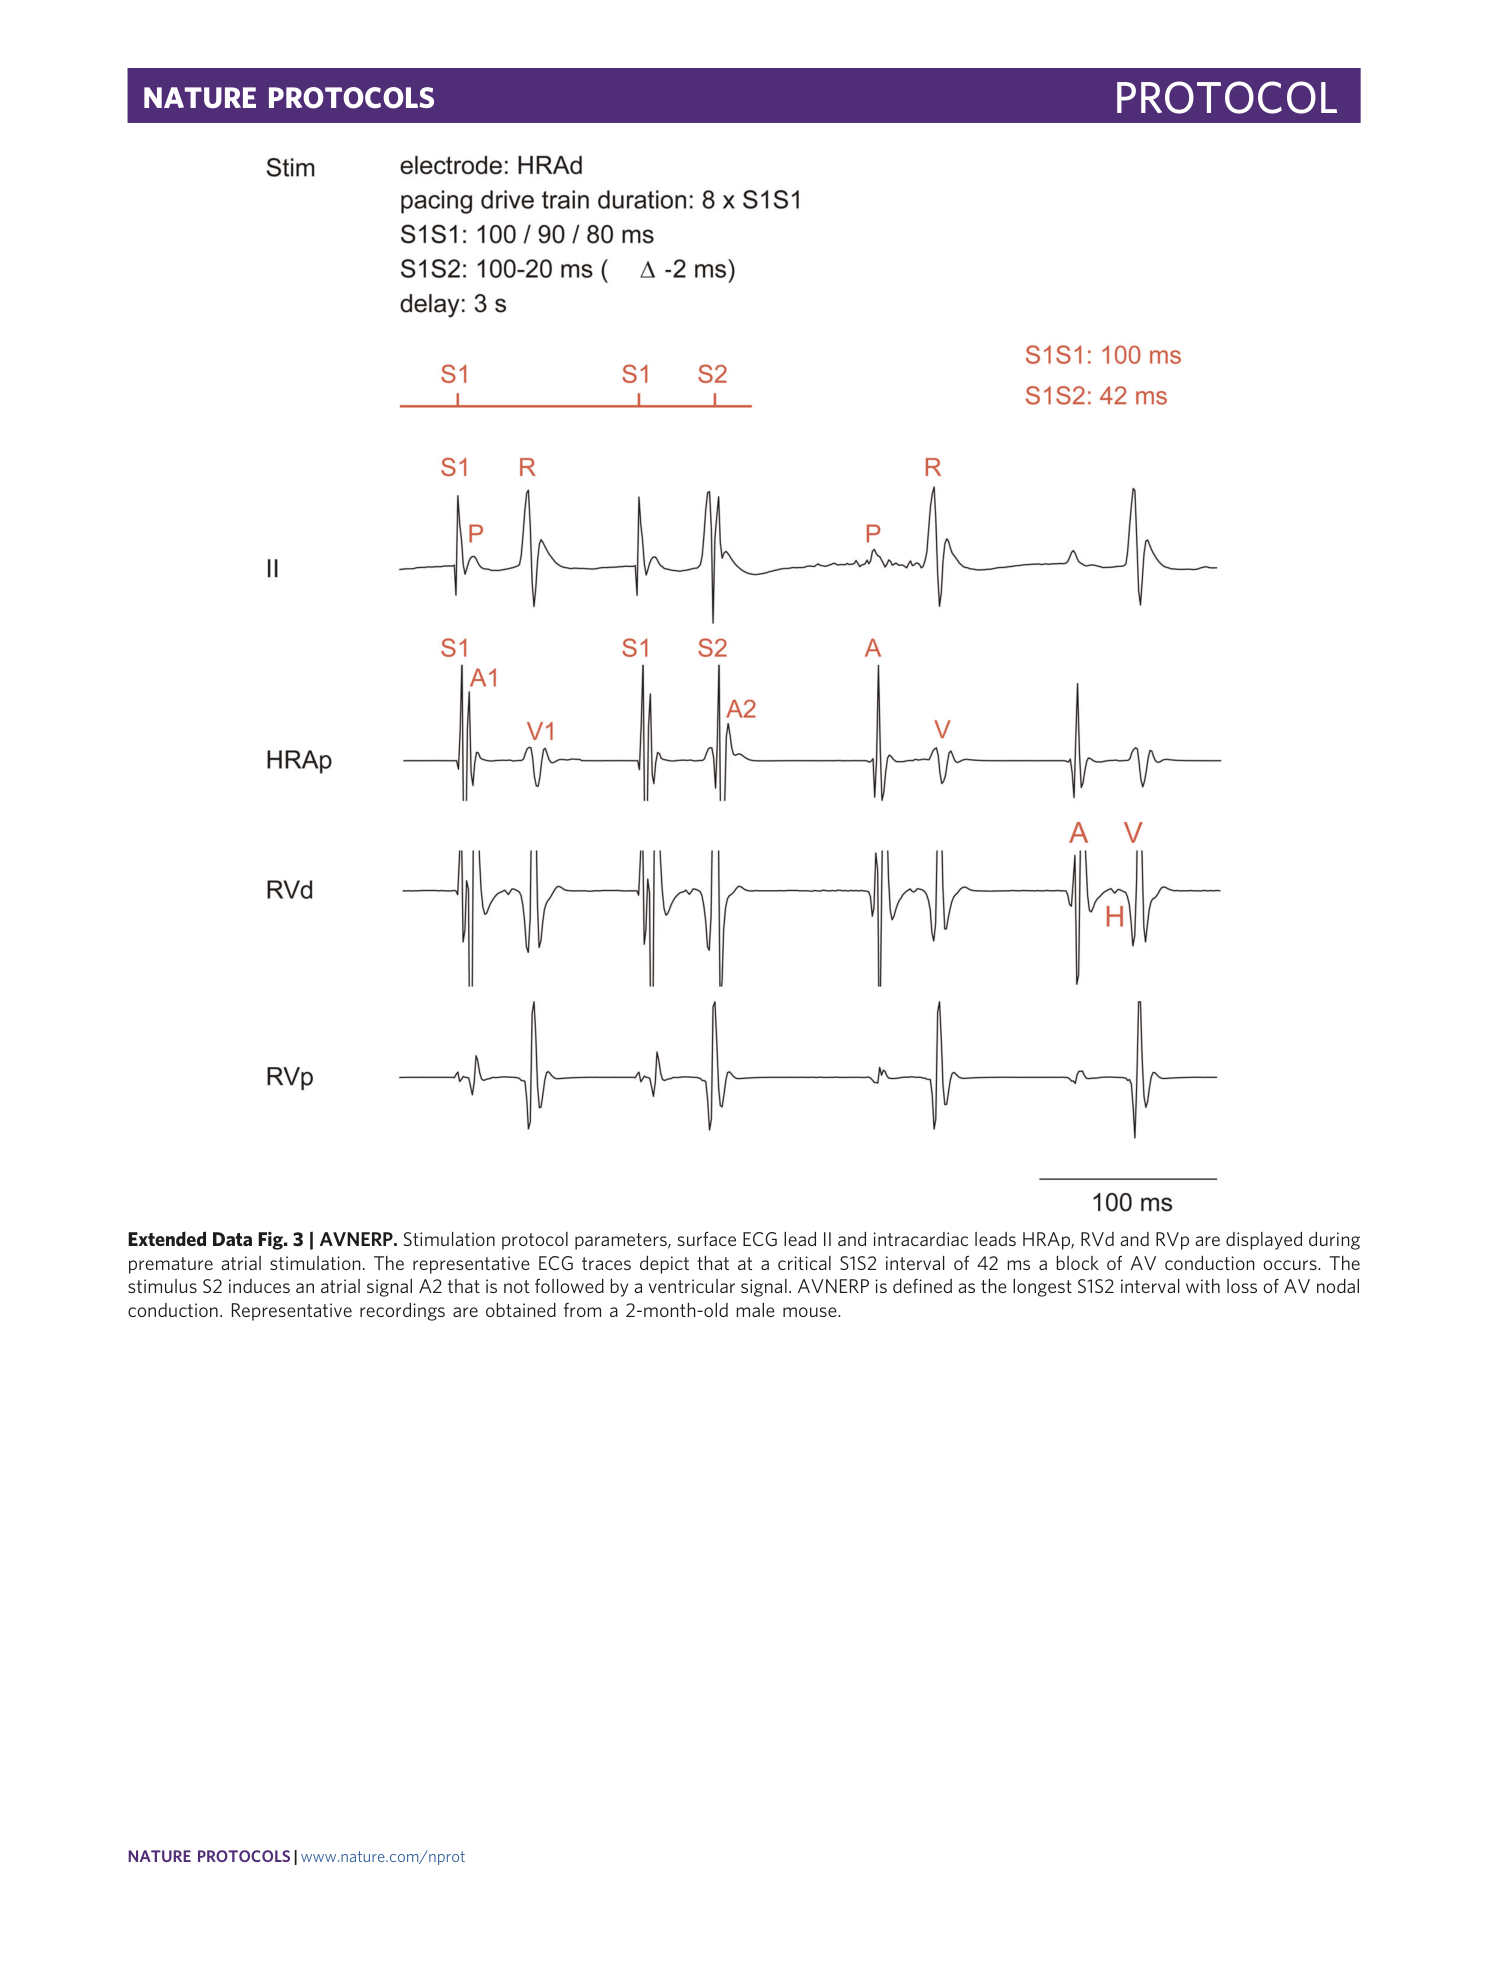
Extended Data Fig. 3 AVNERP.
Stimulation protocol parameters, surface ECG lead II and intracardiac leads HRAp, RVd and RVp are displayed during premature atrial stimulation. The representative ECG traces depict that at a critical S1S2 interval of 42 ms a block of AV conduction occurs. The stimulus S2 induces an atrial signal A2 that is not followed by a ventricular signal. AVNERP is defined as the longest S1S2 interval with loss of AV nodal conduction. Representative recordings are obtained from a 2-month-old male mouse.
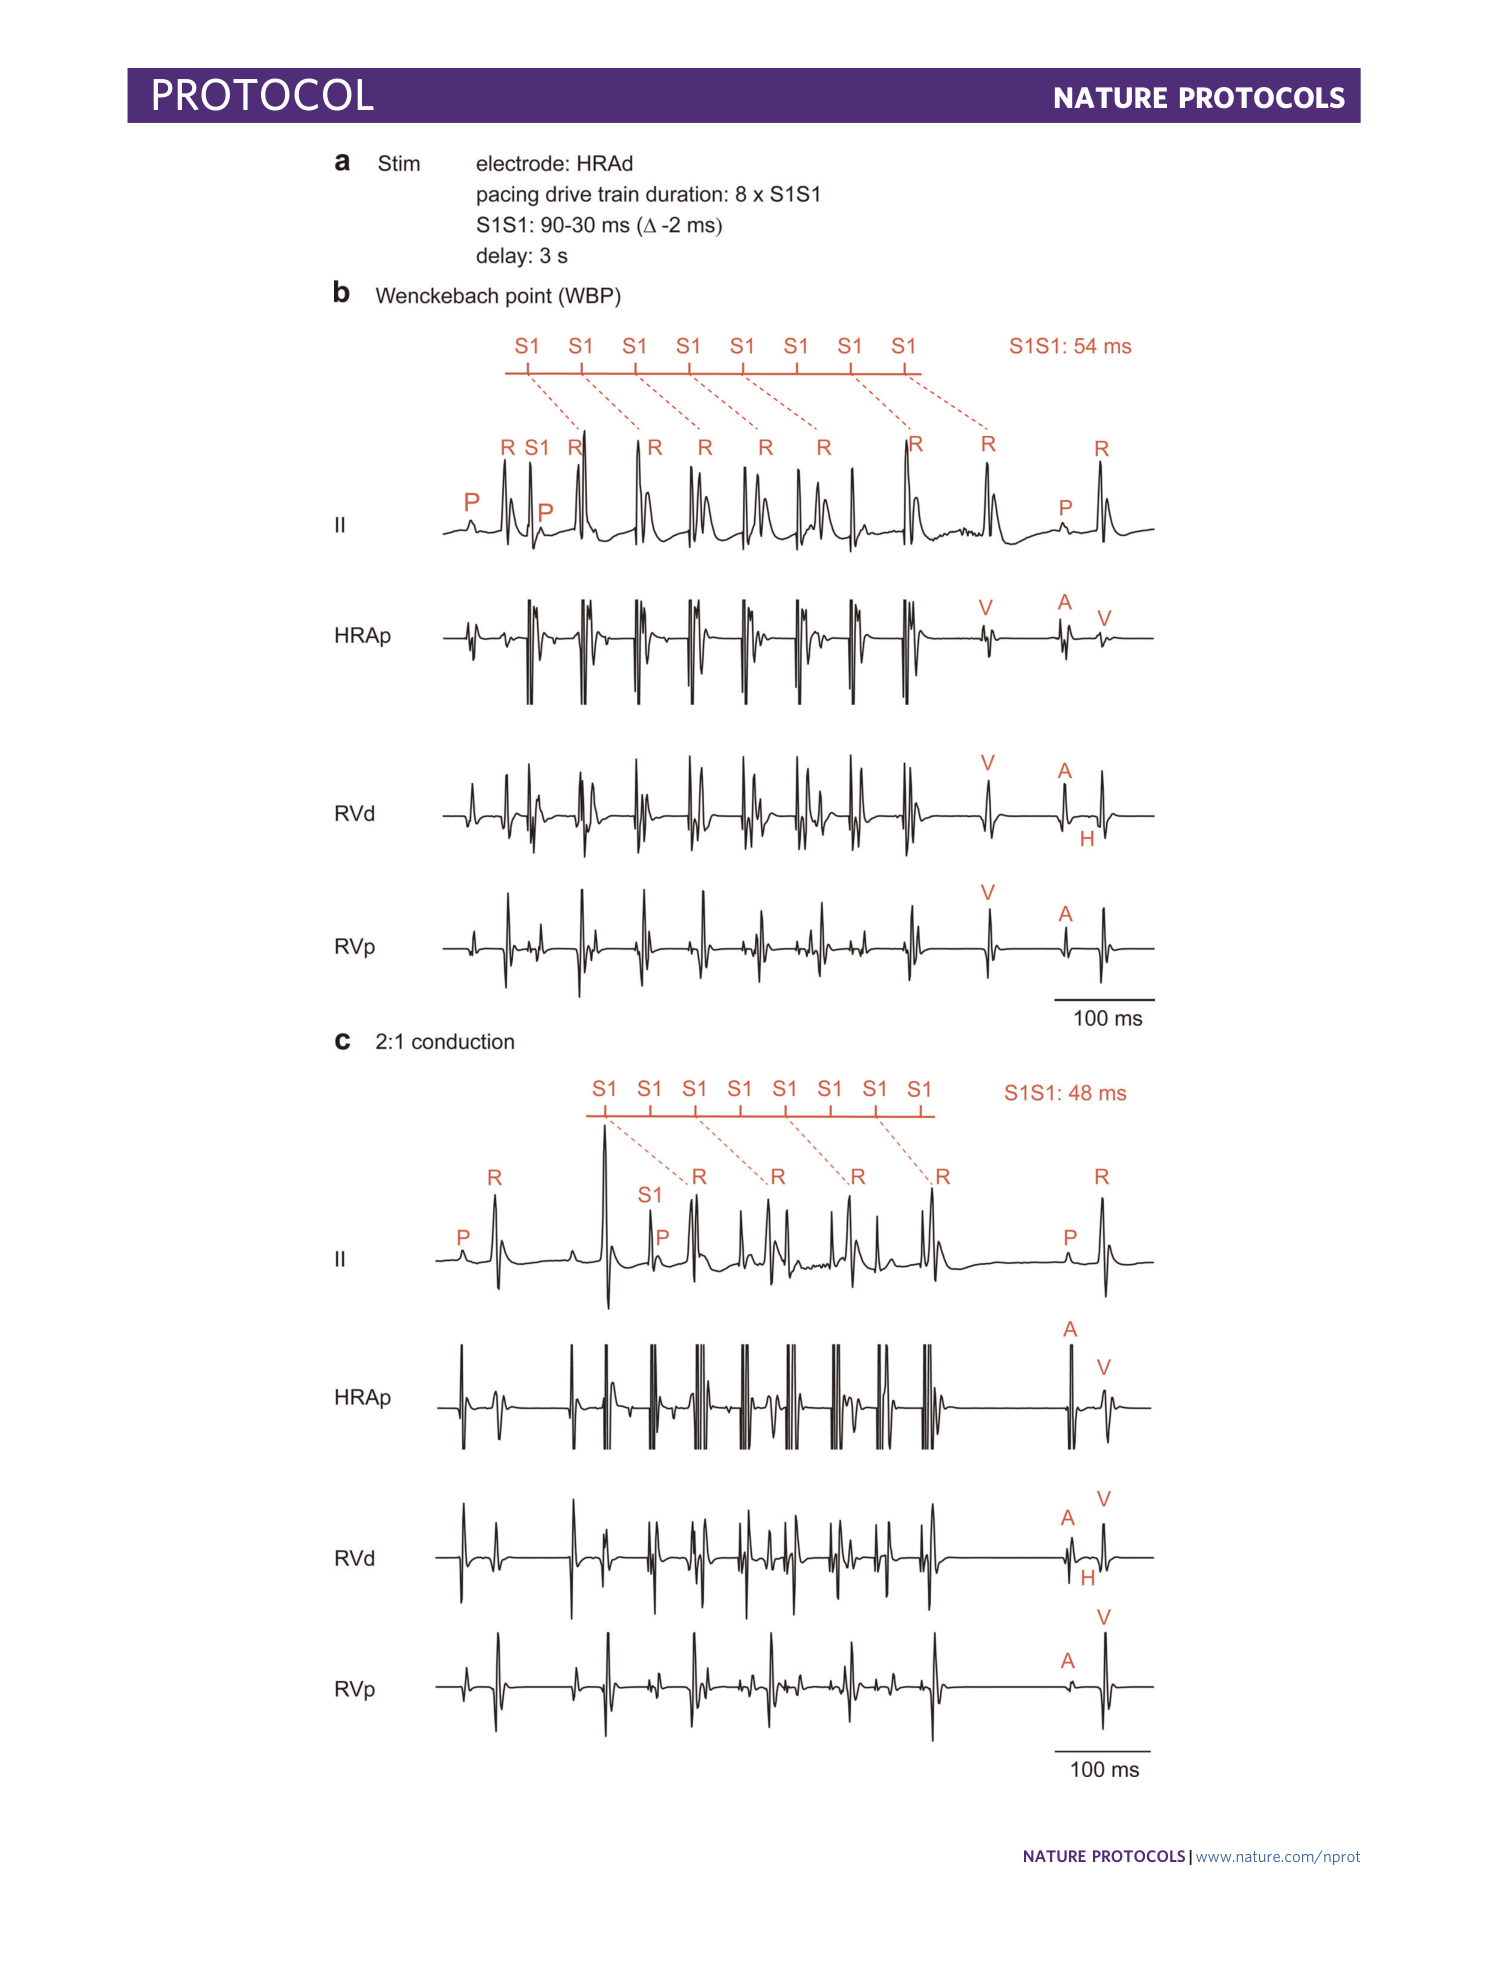
Extended Data Fig. 4 WBP and 2:1 conduction.
a , Stimulation protocol parameters to identify the anterograde WBP and 2:1 cycle length. b , Determination of WBP. Surface ECG lead II and intracardiac leads HRAp, RVd and RVp are displayed during atrial stimulation. At a critical S1S1 interval of 54 ms, the first AV block occurs. The sixth stimulus is not conducted from the atria to the ventricles. c , Determination of 2:1 conduction. Surface ECG lead II and intracardiac leads HRAp, RVd and RVp are displayed during atrial stimulation. At a critical S1S1 interval of 48 ms, 2:1 conduction occurs. Every second atrial activation is conducted to the ventricles. For clarity, the timepoints of stimulus application in b and c are connected to the corresponding R peaks in the surface ECG. Representative recordings are obtained from a 2-month-old male mouse.
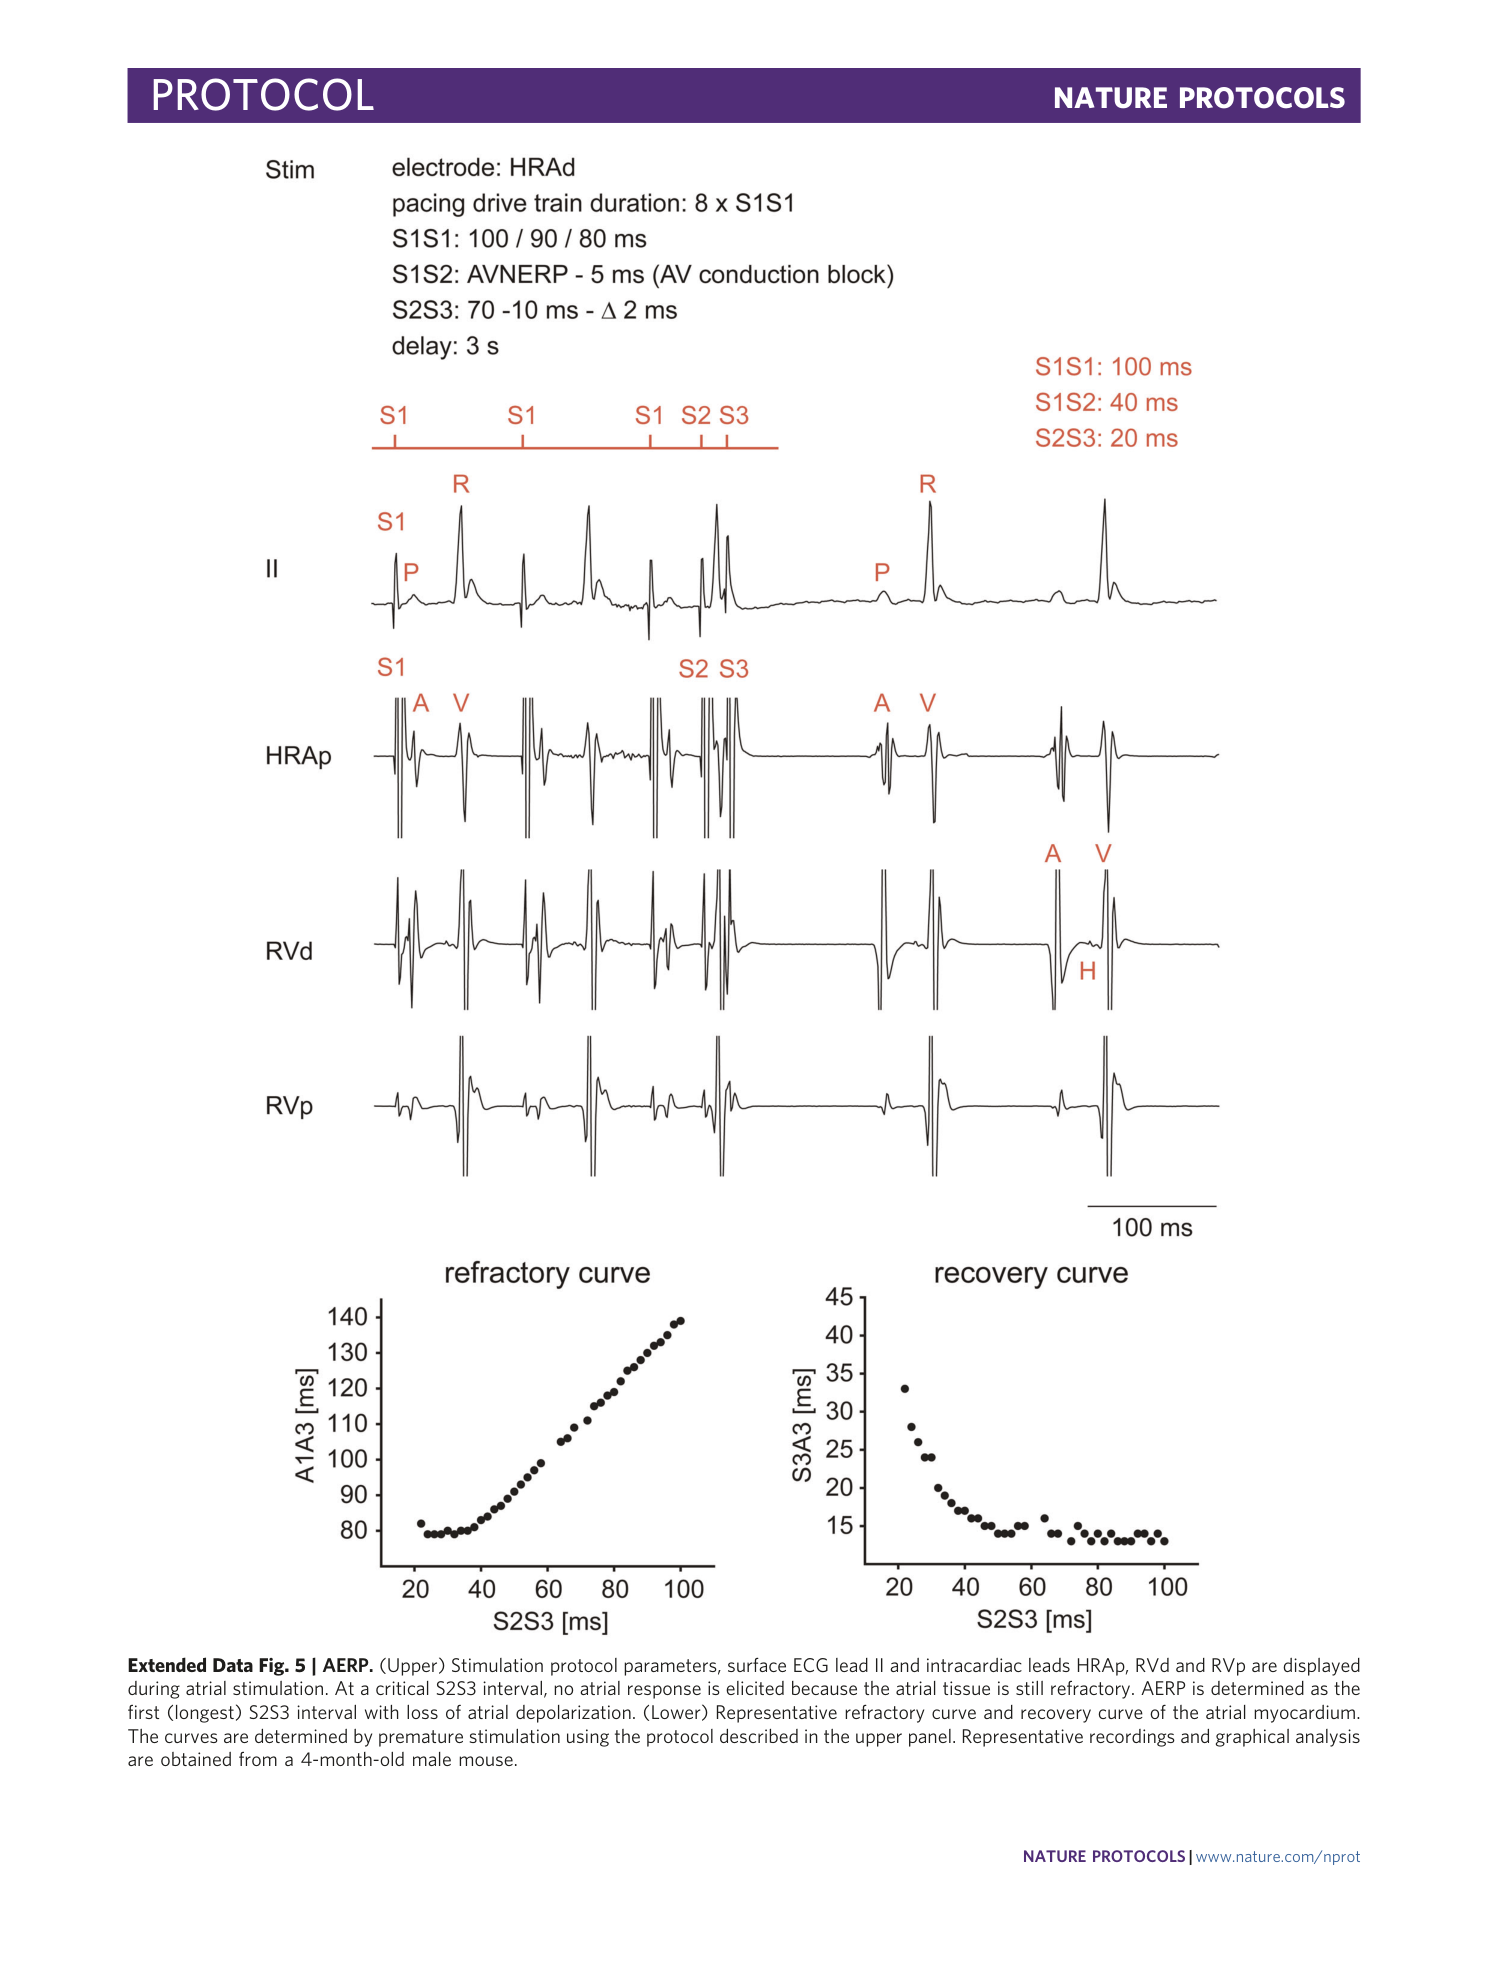
Extended Data Fig. 5 AERP.
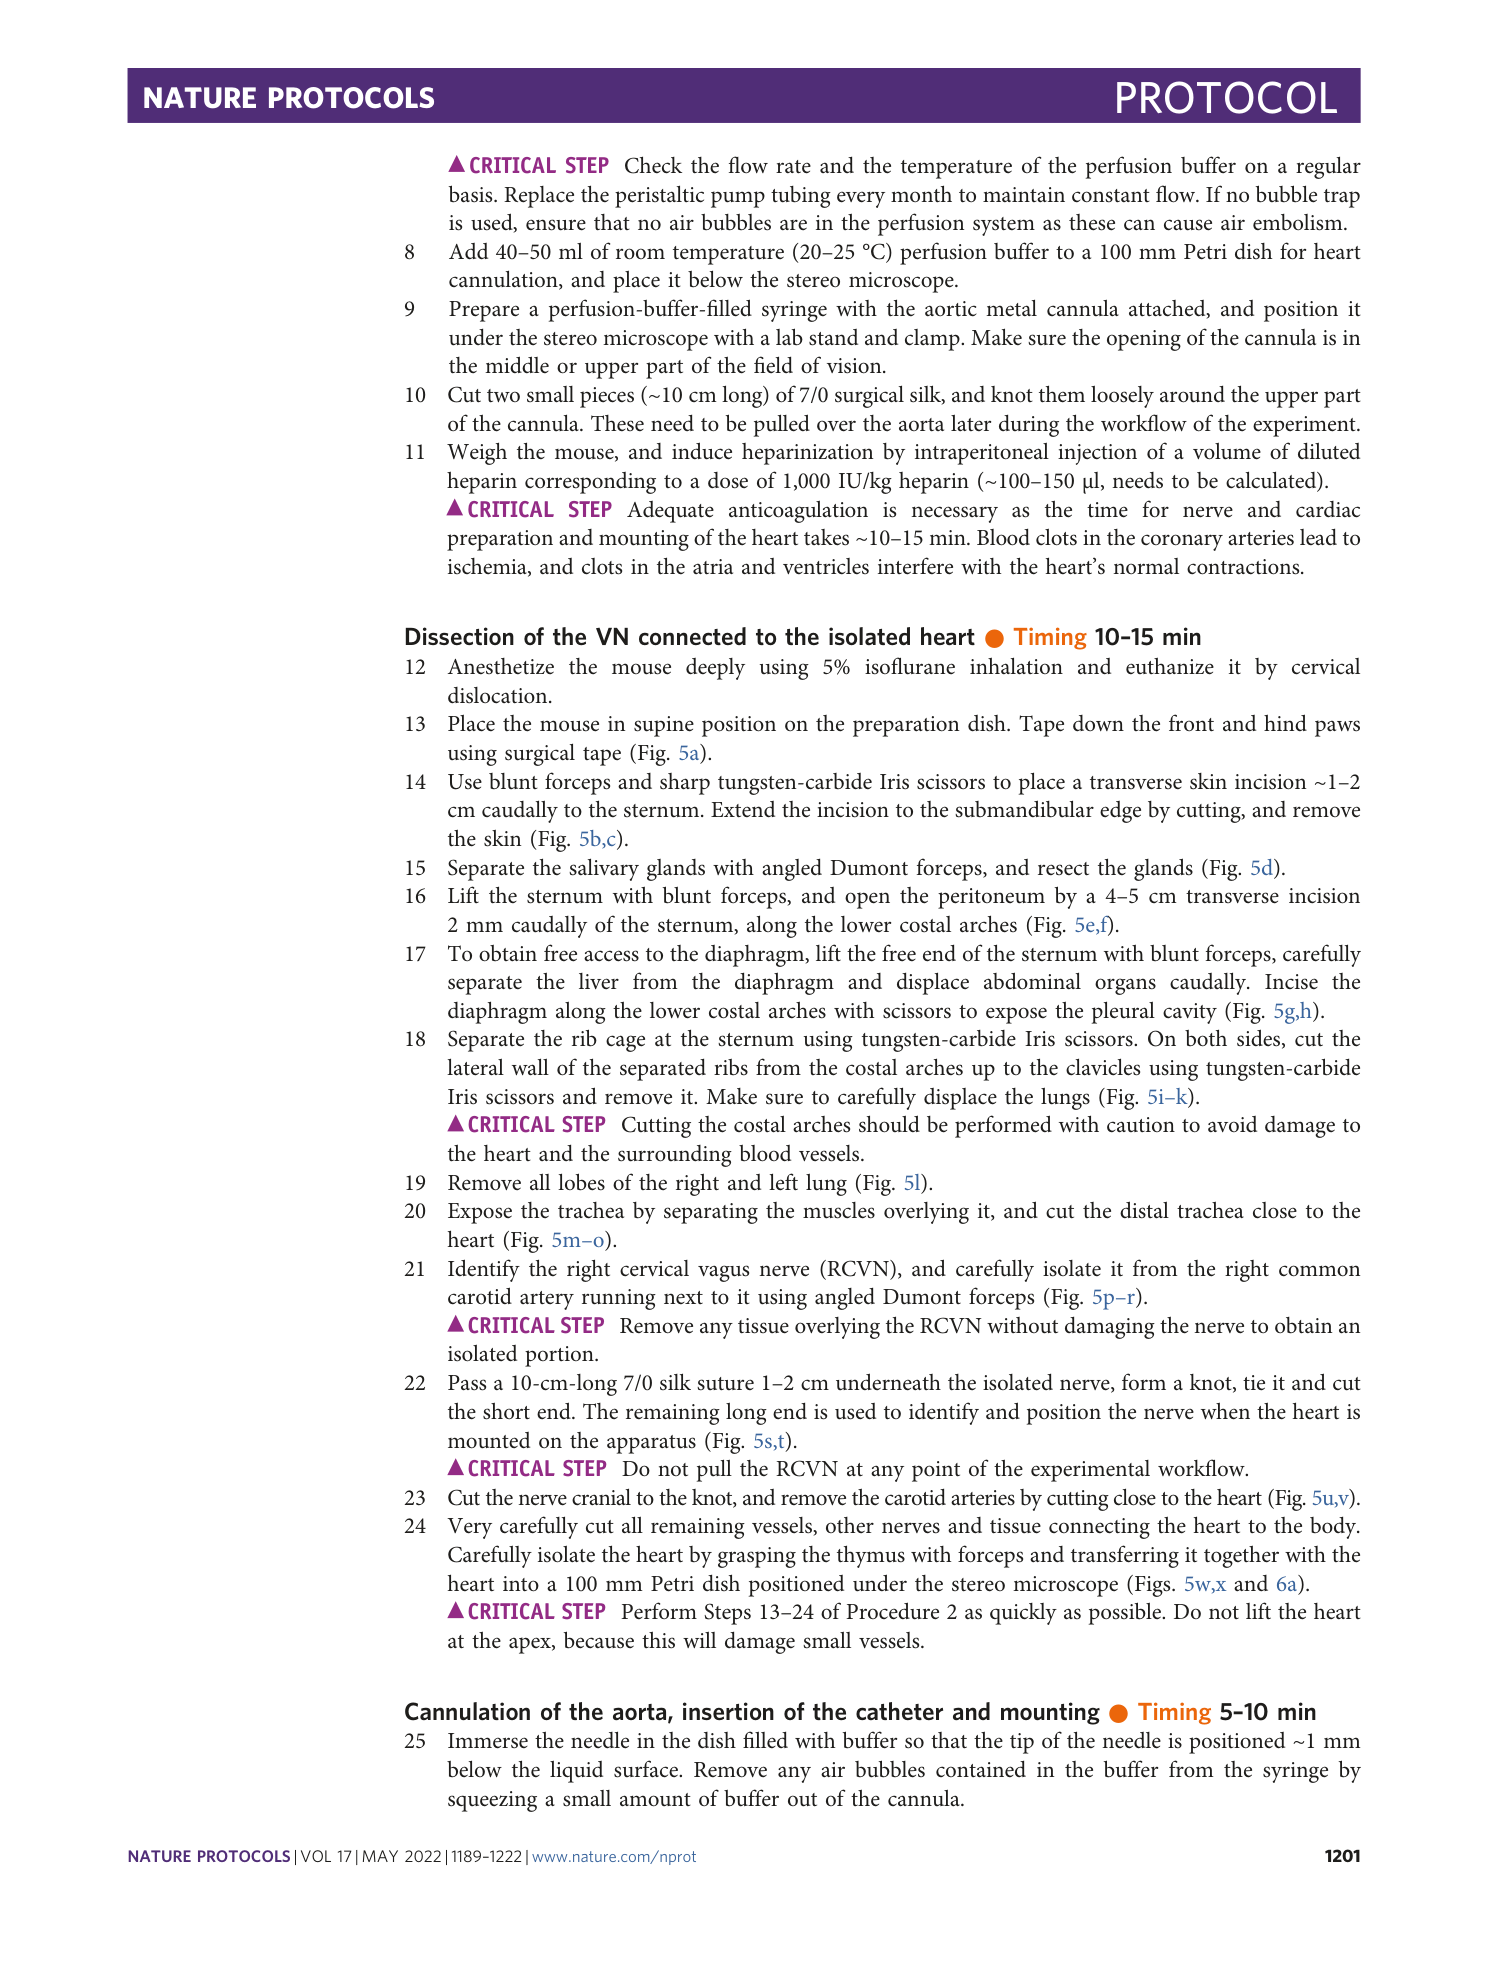
(Upper) Stimulation protocol parameters, surface ECG lead II and intracardiac leads HRAp, RVd and RVp are displayed during atrial stimulation. At a critical S2S3 interval, no atrial response is elicited because the atrial tissue is still refractory. AERP is determined as the first (longest) S2S3 interval with loss of atrial depolarization. (Lower) Representative refractory curve and recovery curve of the atrial myocardium. The curves are determined by premature stimulation using the protocol described in the upper panel. Representative recordings and graphical analysis are obtained from a 4-month-old male mouse.
Extended Data Fig. 6 VERP.
(Upper) Stimulation protocol parameters, surface ECG lead II and intracardiac leads HRAp, RVd and RVp are displayed during ventricular stimulation. At a critical S1S2 interval, no ventricular response is elicited because the ventricular tissue is still refractory. VERP is determined as the first (longest) S1S2 interval with loss of ventricular depolarization. (Lower) Representative refractory curve and recovery curve of the ventricular myocardium. The curves are determined by premature stimulation using the protocol described in the upper panel. Representative recordings are obtained from a 4-month-old male mouse. Representative graphical analysis is derived from a 4-month-old male mouse.
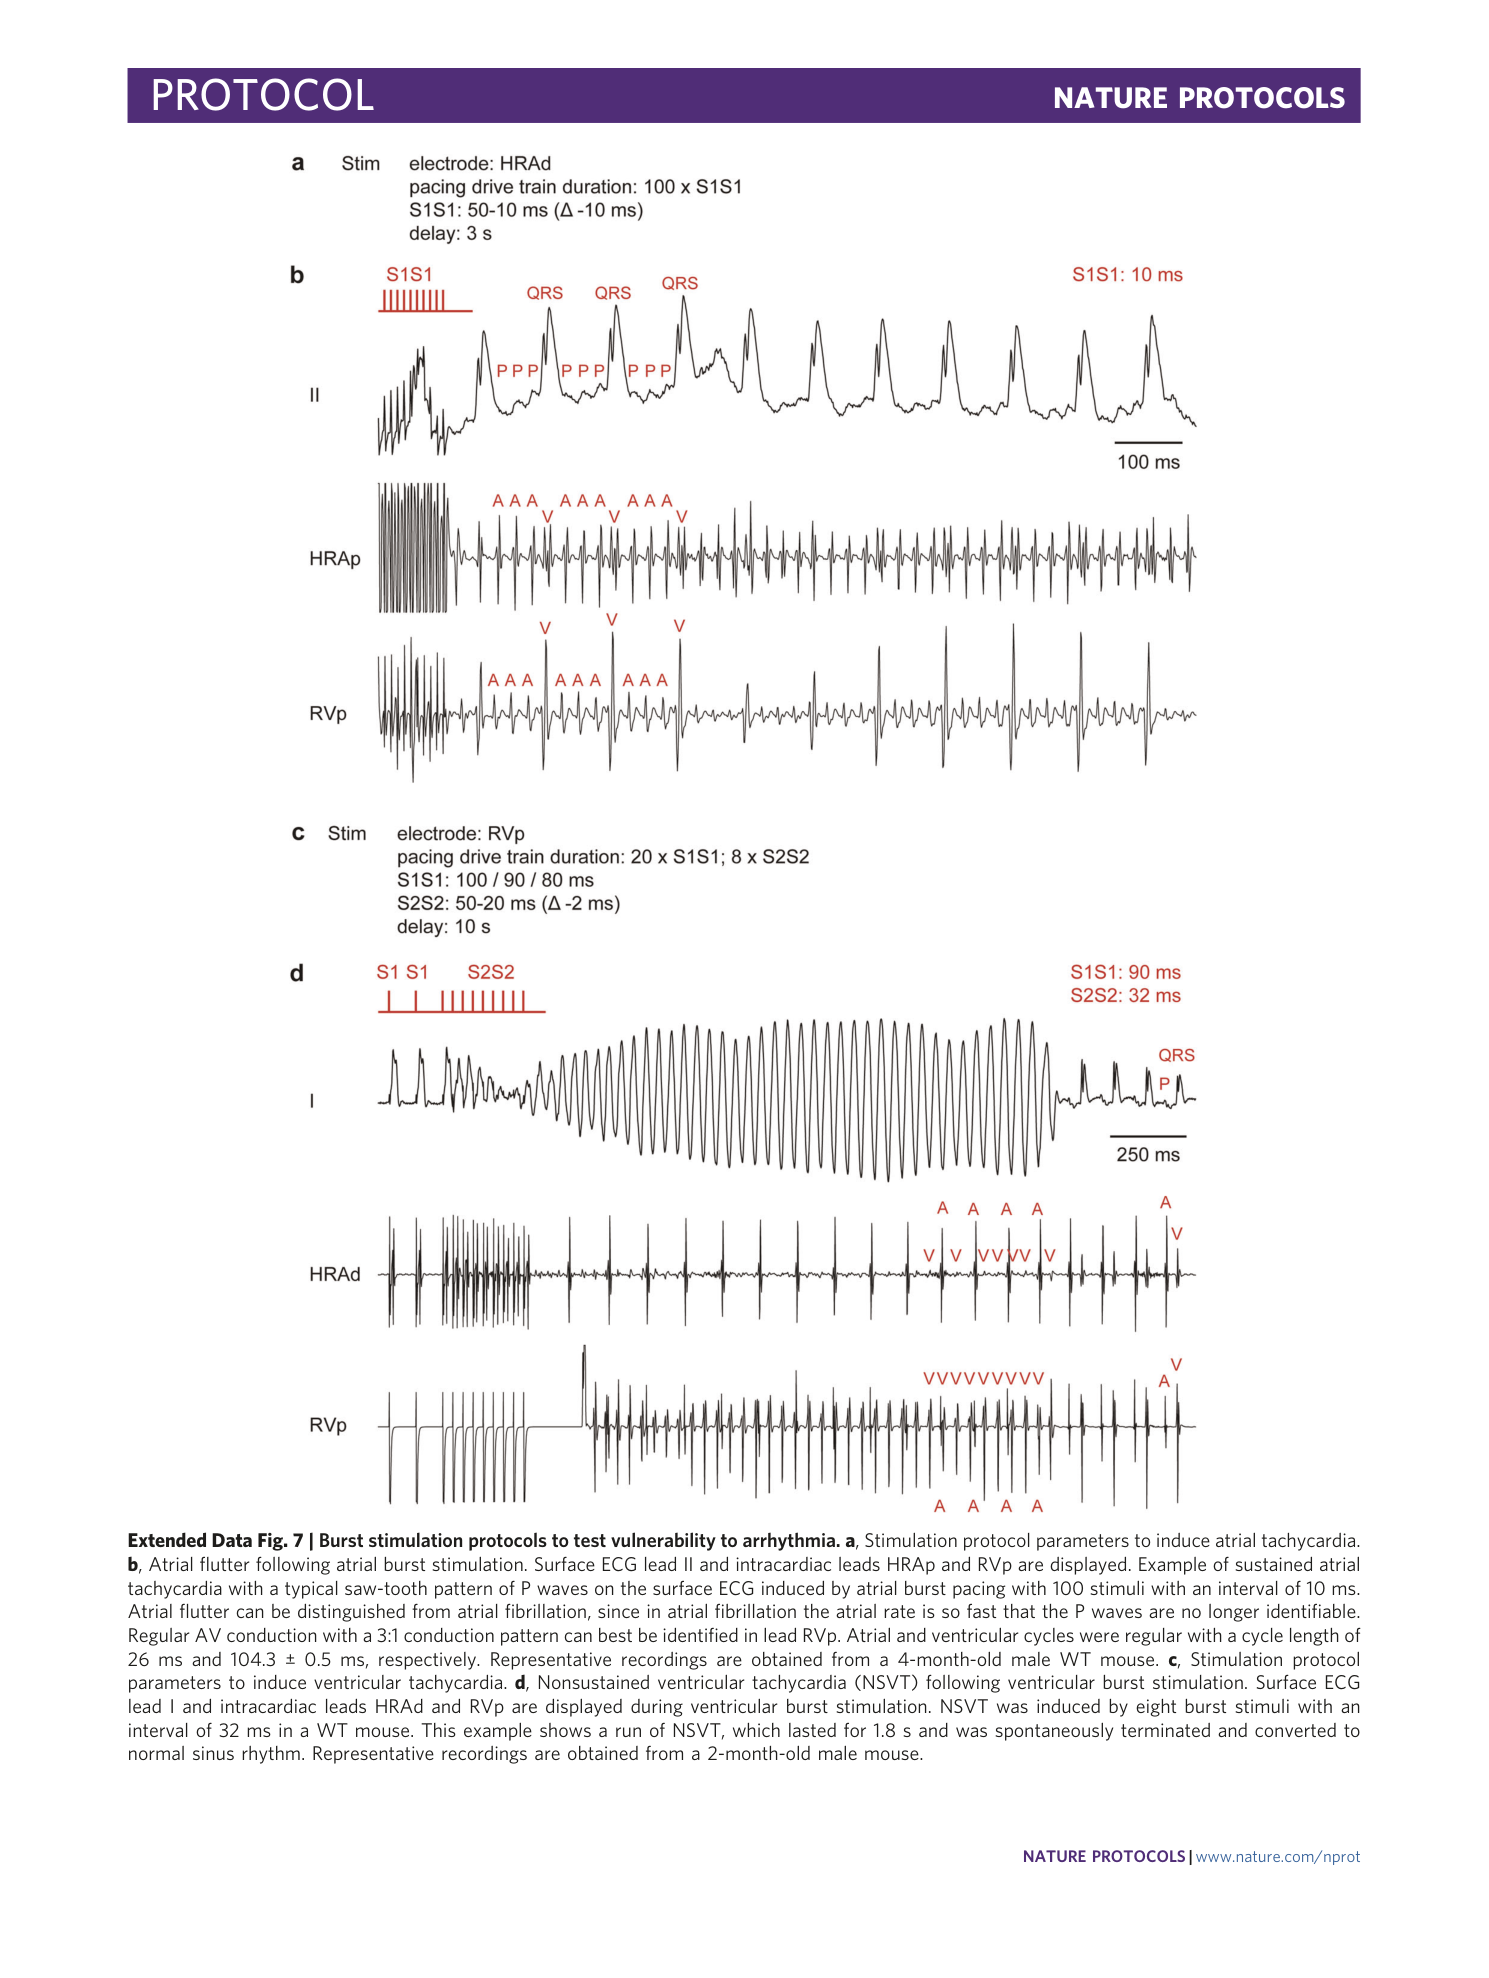
Extended Data Fig. 7 Burst stimulation protocols to test vulnerability to arrhythmia.
a , Stimulation protocol parameters to induce atrial tachycardia. b , Atrial flutter following atrial burst stimulation. Surface ECG lead II and intracardiac leads HRAp and RVp are displayed. Example of sustained atrial tachycardia with a typical saw-tooth pattern of P waves on the surface ECG induced by atrial burst pacing with 100 stimuli with an interval of 10 ms. Atrial flutter can be distinguished from atrial fibrillation, since in atrial fibrillation the atrial rate is so fast that the P waves are no longer identifiable. Regular AV conduction with a 3:1 conduction pattern can best be identified in lead RVp. Atrial and ventricular cycles were regular with a cycle length of 26 ms and 104.3 ± 0.5 ms, respectively. Representative recordings are obtained from a 4-month-old male WT mouse. c , Stimulation protocol parameters to induce ventricular tachycardia. d , Nonsustained ventricular tachycardia (NSVT) following ventricular burst stimulation. Surface ECG lead I and intracardiac leads HRAd and RVp are displayed during ventricular burst stimulation. NSVT was induced by eight burst stimuli with an interval of 32 ms in a WT mouse. This example shows a run of NSVT, which lasted for 1.8 s and was spontaneously terminated and converted to normal sinus rhythm. Representative recordings are obtained from a 2-month-old male mouse.
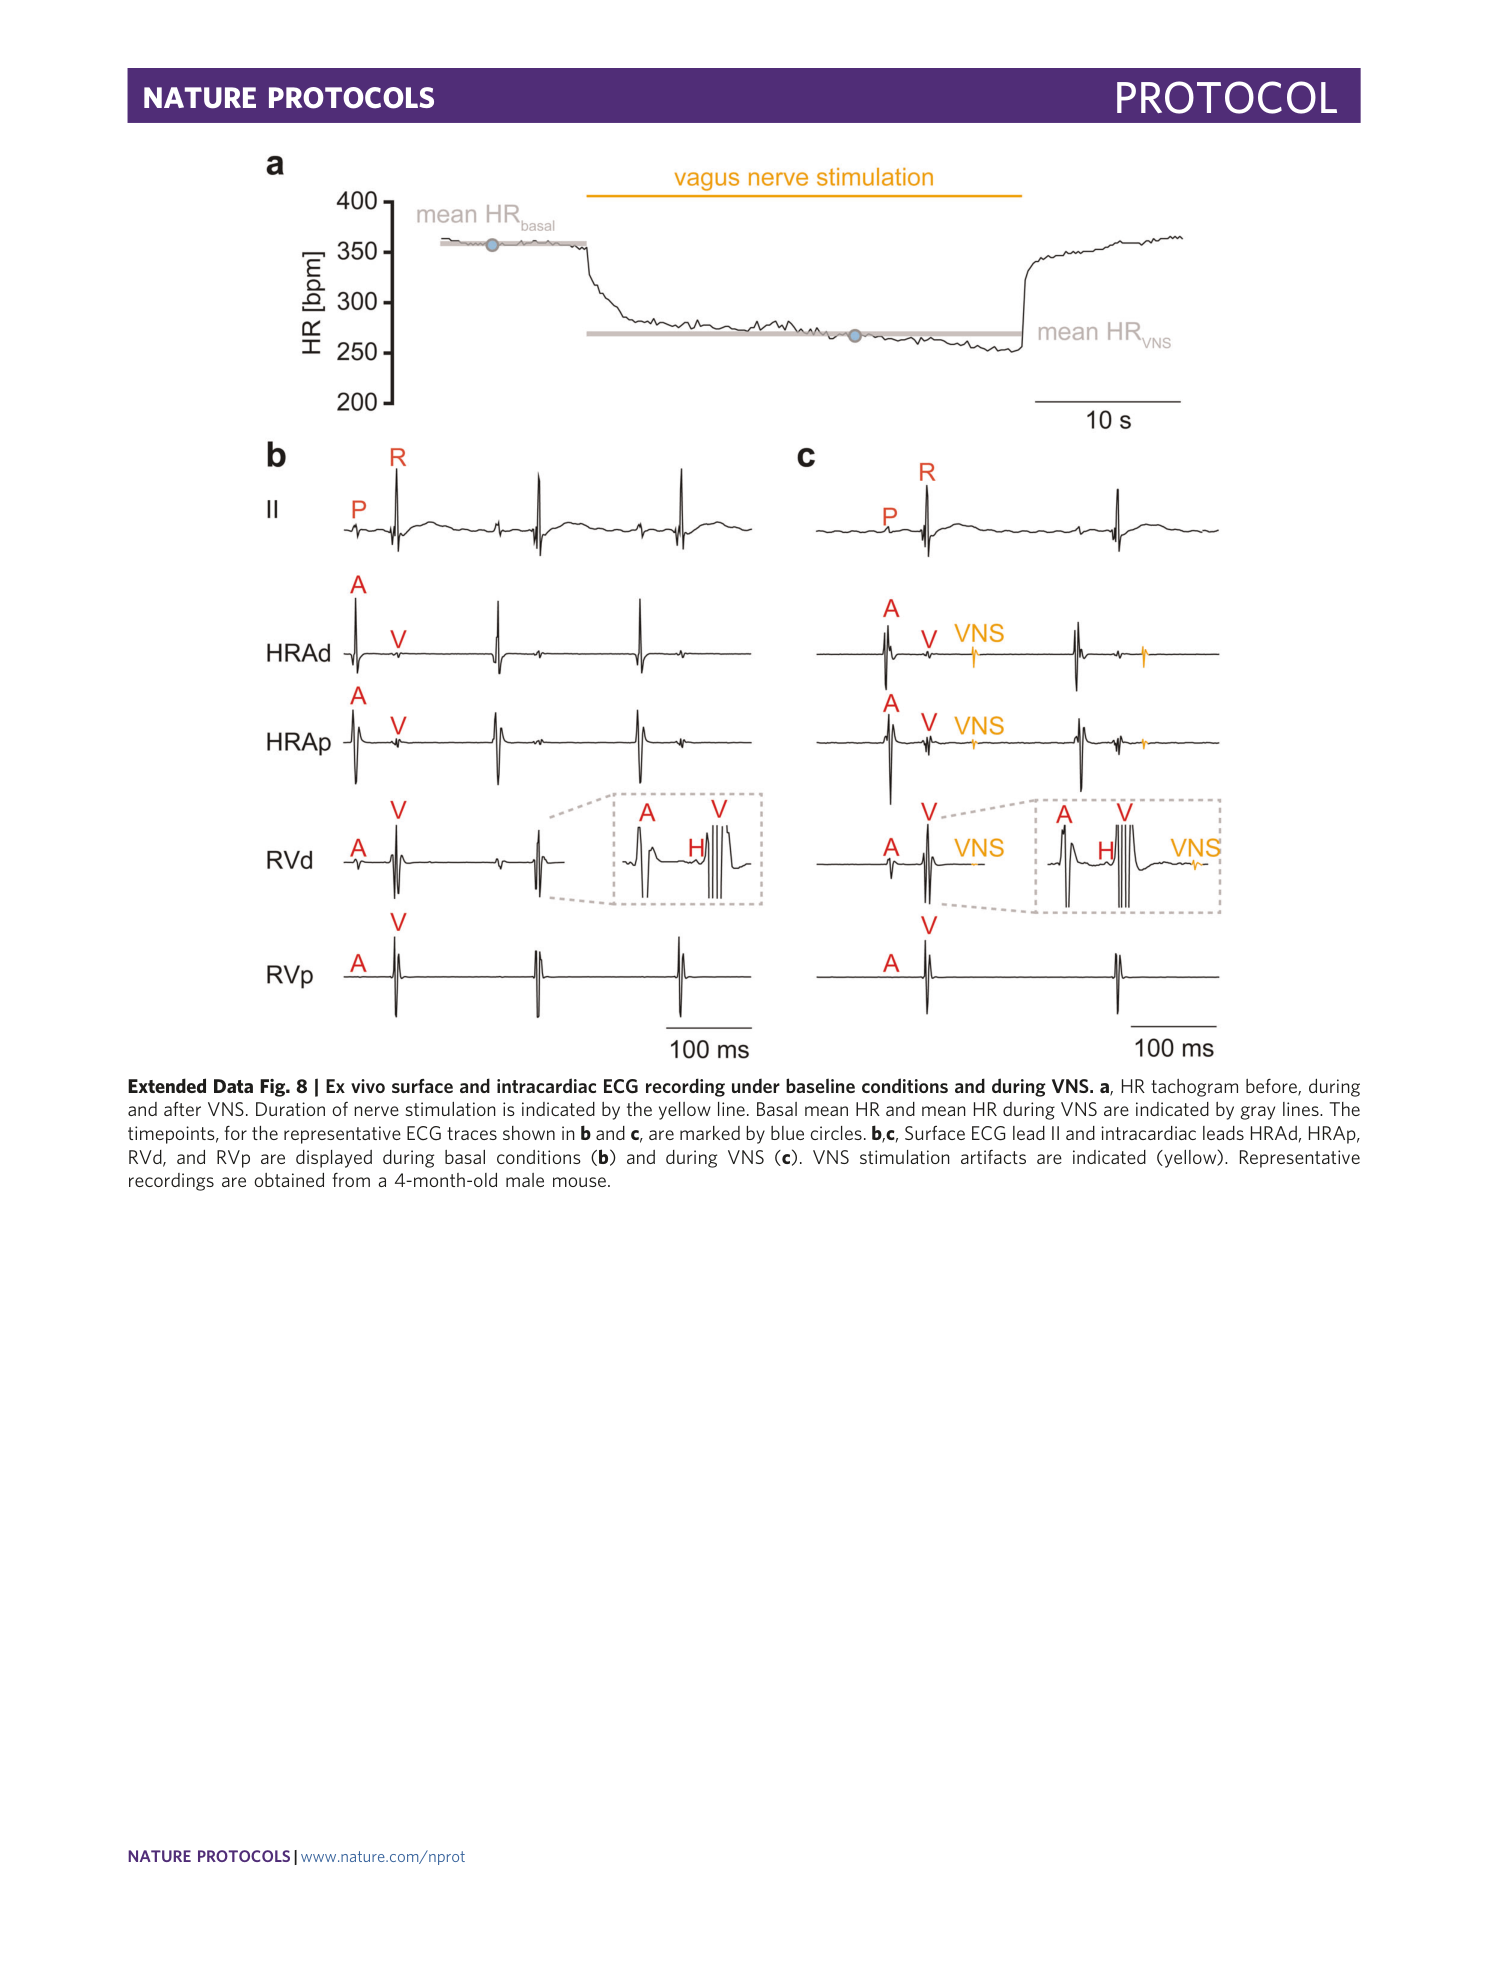
Extended Data Fig. 8 Ex vivo surface and intracardiac ECG recording under baseline conditions and during VNS.
a , HR tachogram before, during and after VNS. Duration of nerve stimulation is indicated by the yellow line. Basal mean HR and mean HR during VNS are indicated by gray lines. The timepoints, for the representative ECG traces shown in b and c , are marked by blue circles. b , c , Surface ECG lead II and intracardiac leads HRAd, HRAp, RVd, and RVp are displayed during basal conditions ( b ) and during VNS ( c ). VNS stimulation artifacts are indicated (yellow). Representative recordings are obtained from a 4-month-old male mouse.
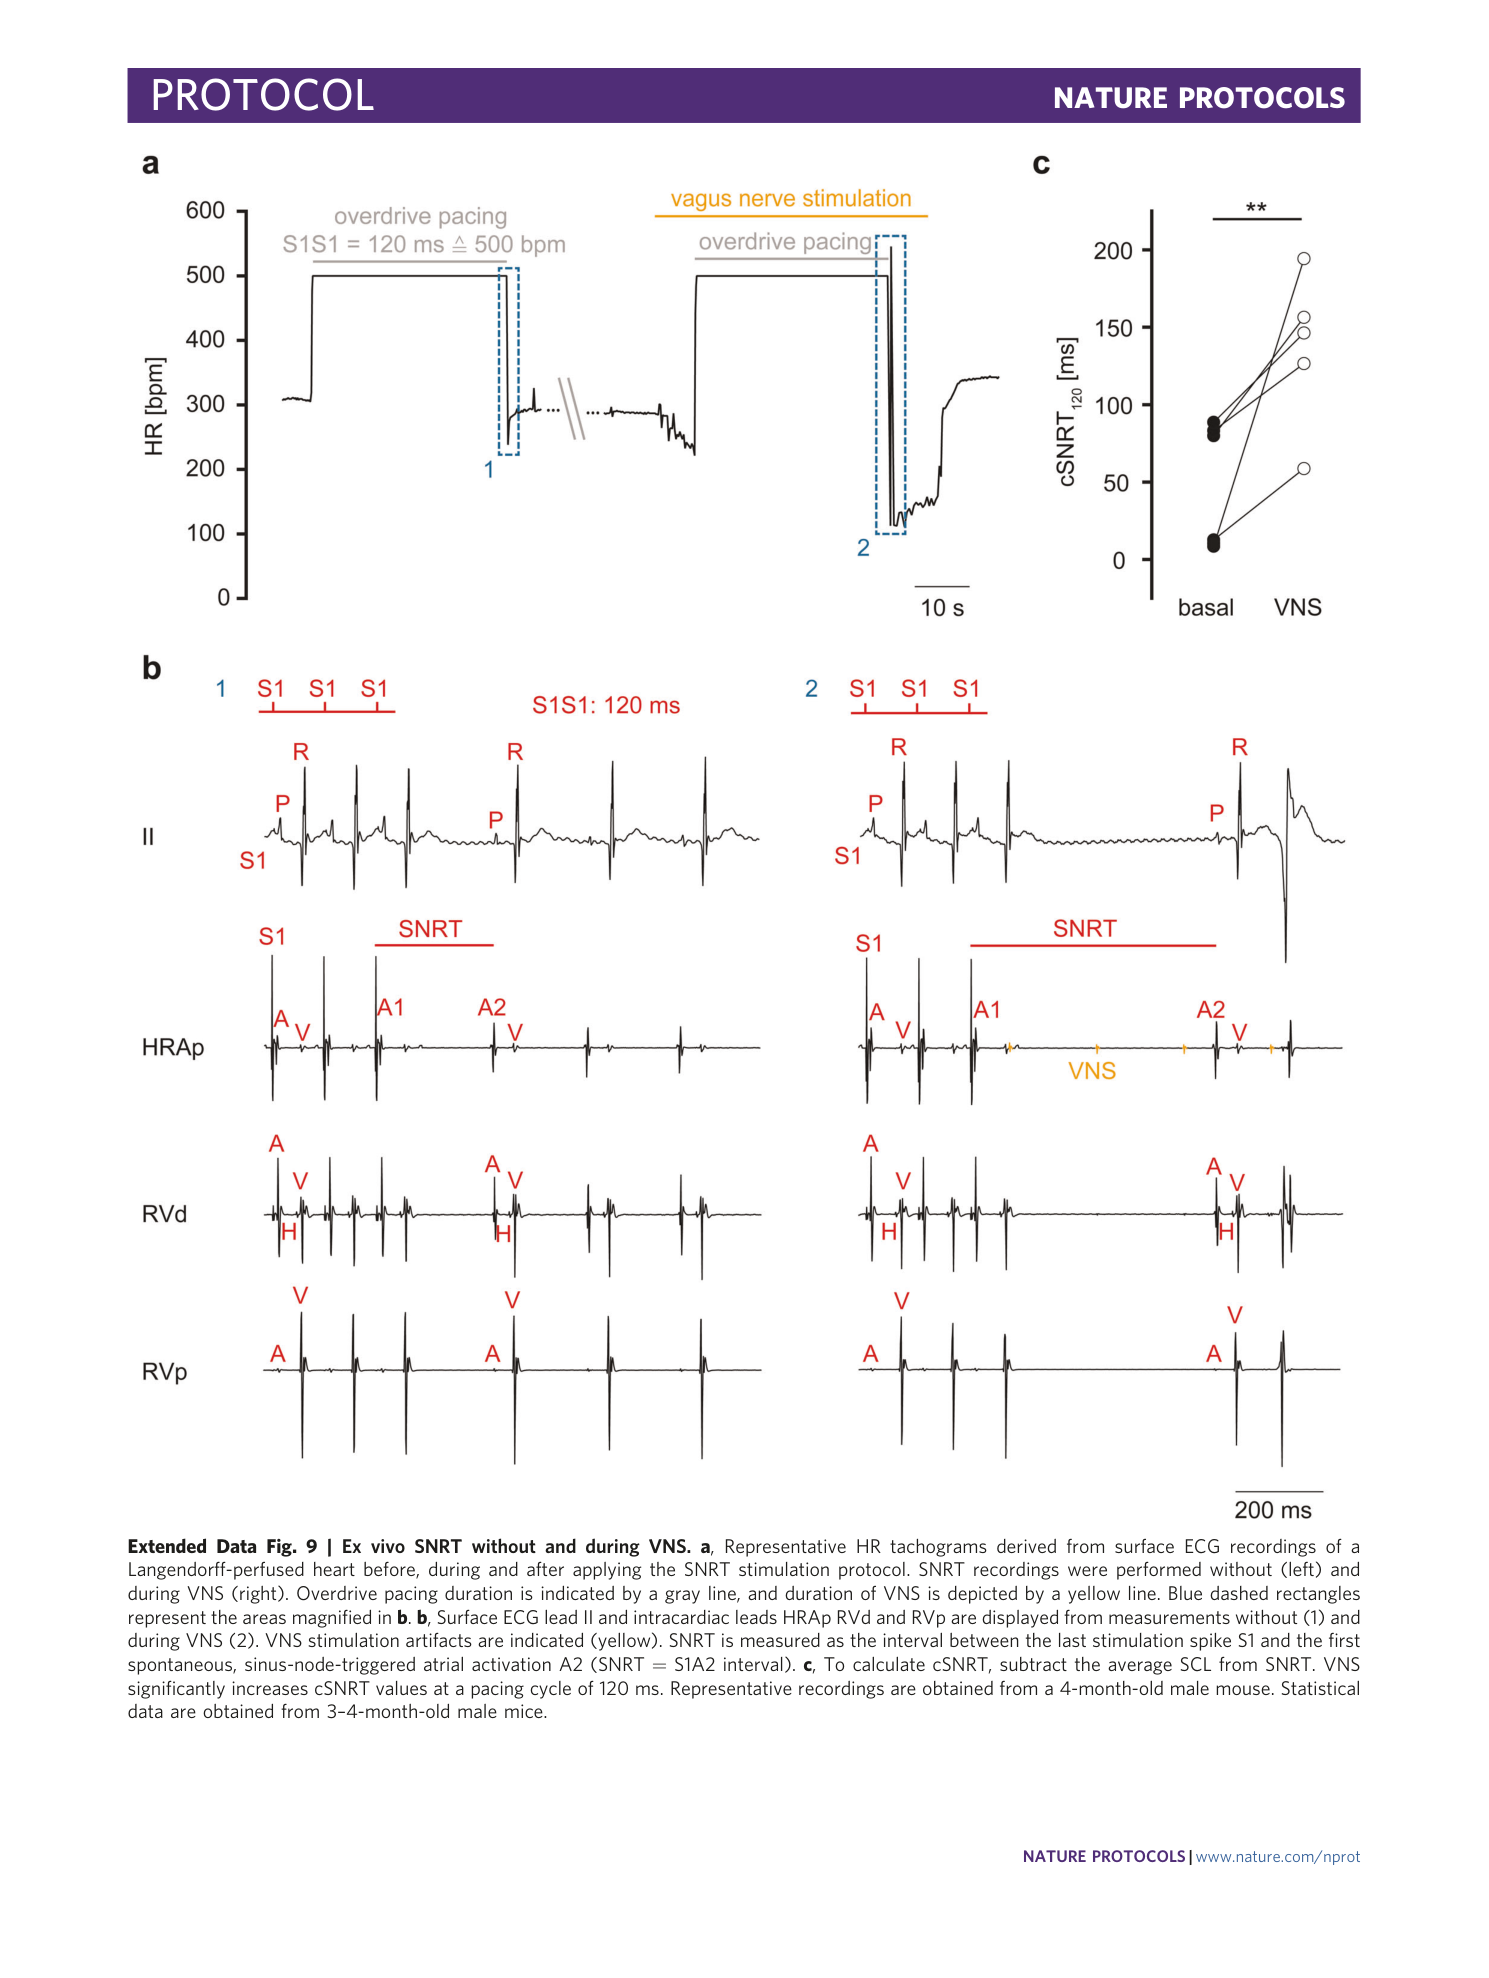
Extended Data Fig. 9 Ex vivo SNRT without and during VNS.
a , Representative HR tachograms derived from surface ECG recordings of a Langendorff-perfused heart before, during and after applying the SNRT stimulation protocol. SNRT recordings were performed without (left) and during VNS (right). Overdrive pacing duration is indicated by a gray line, and duration of VNS is depicted by a yellow line. Blue dashed rectangles represent the areas magnified in b . b , Surface ECG lead II and intracardiac leads HRAp RVd and RVp are displayed from measurements without (1) and during VNS (2). VNS stimulation artifacts are indicated (yellow). SNRT is measured as the interval between the last stimulation spike S1 and the first spontaneous, sinus-node-triggered atrial activation A2 (SNRT = S1A2 interval). c , To calculate cSNRT, subtract the average SCL from SNRT. VNS significantly increases cSNRT values at a pacing cycle of 120 ms. Representative recordings are obtained from a 4-month-old male mouse. Statistical data are obtained from 3–4-month-old male mice.
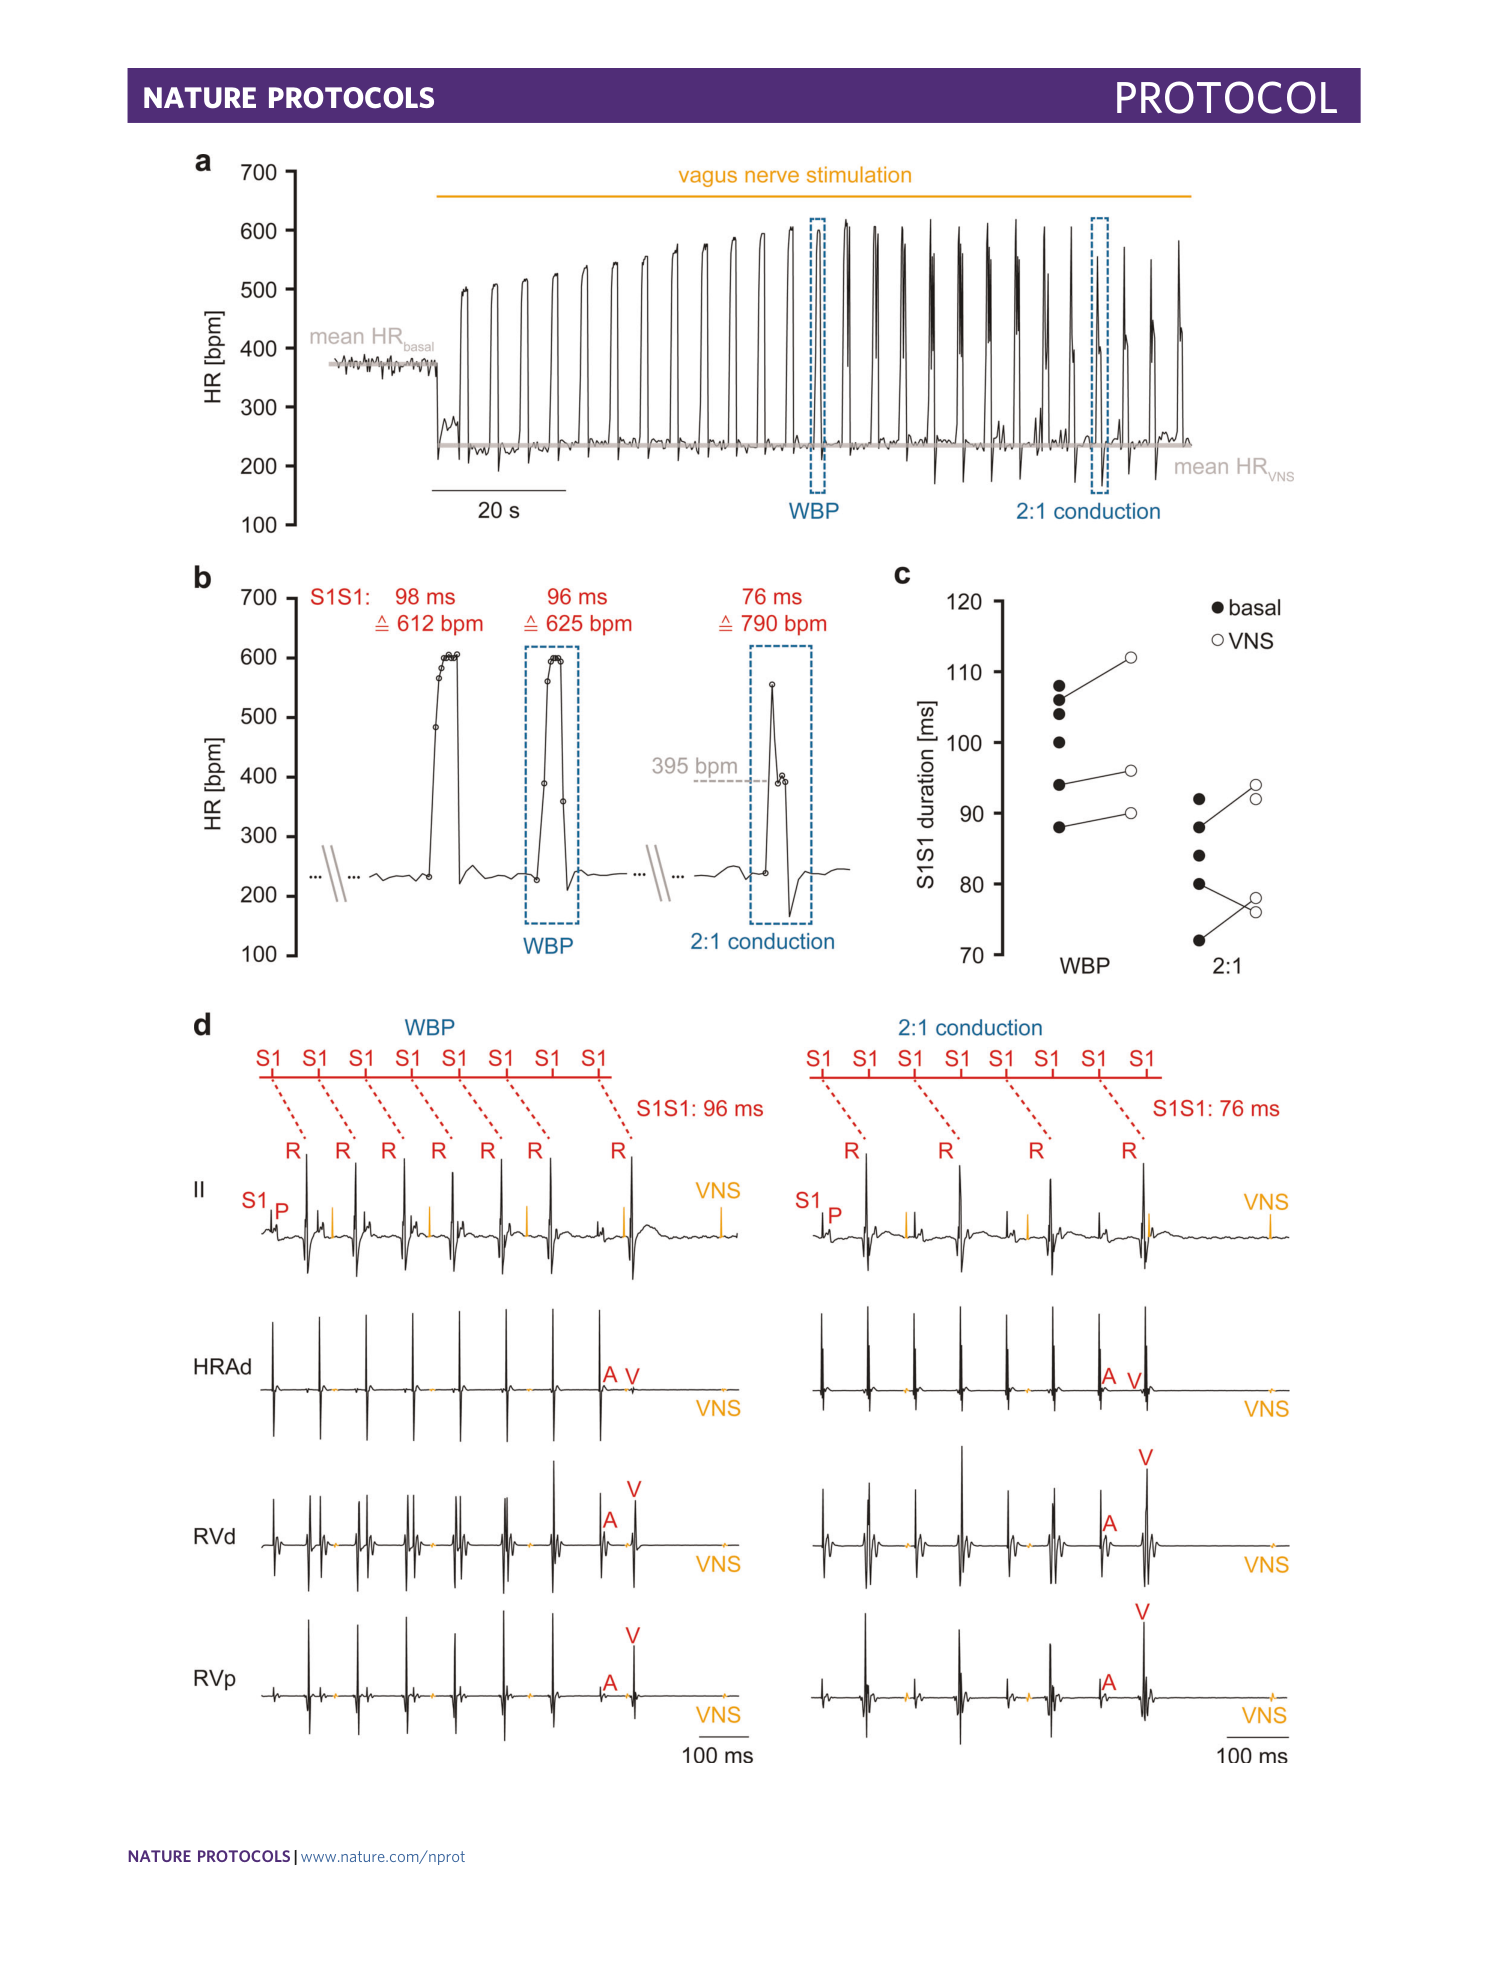
Extended Data Fig. 10 Ex vivo WBP and 2:1 conduction during VNS.
a , Representative HR tachogram derived from the surface ECG recording during VNS. Blue dashed squares indicate pacing cycles at which the WBP or the first 2:1 conduction occur. The duration of the VNS is depicted by a yellow line. The basal mean HR and mean HR under VNS are presented by gray lines. b , Magnification of the timepoints indicated in a . Data points are shown with circles. WBP is reflected in a shortened/unstable paced HR in the HR tachogram, and 2:1 conduction shows a paced HR reduced by half. c , Duration of S1S1 coupling intervals where the WBP and first 2:1 conduction occurred under basal and VNS condition. d , Detailed surface and intracardiac ECG of the WBP (left) and 2:1 conduction (right) from the recording shown in a . Representative recordings are obtained from a 3-month-old male mouse. Statistical data are obtained from 3–4-month-old male mice.
Supplementary information
Supplementary Information
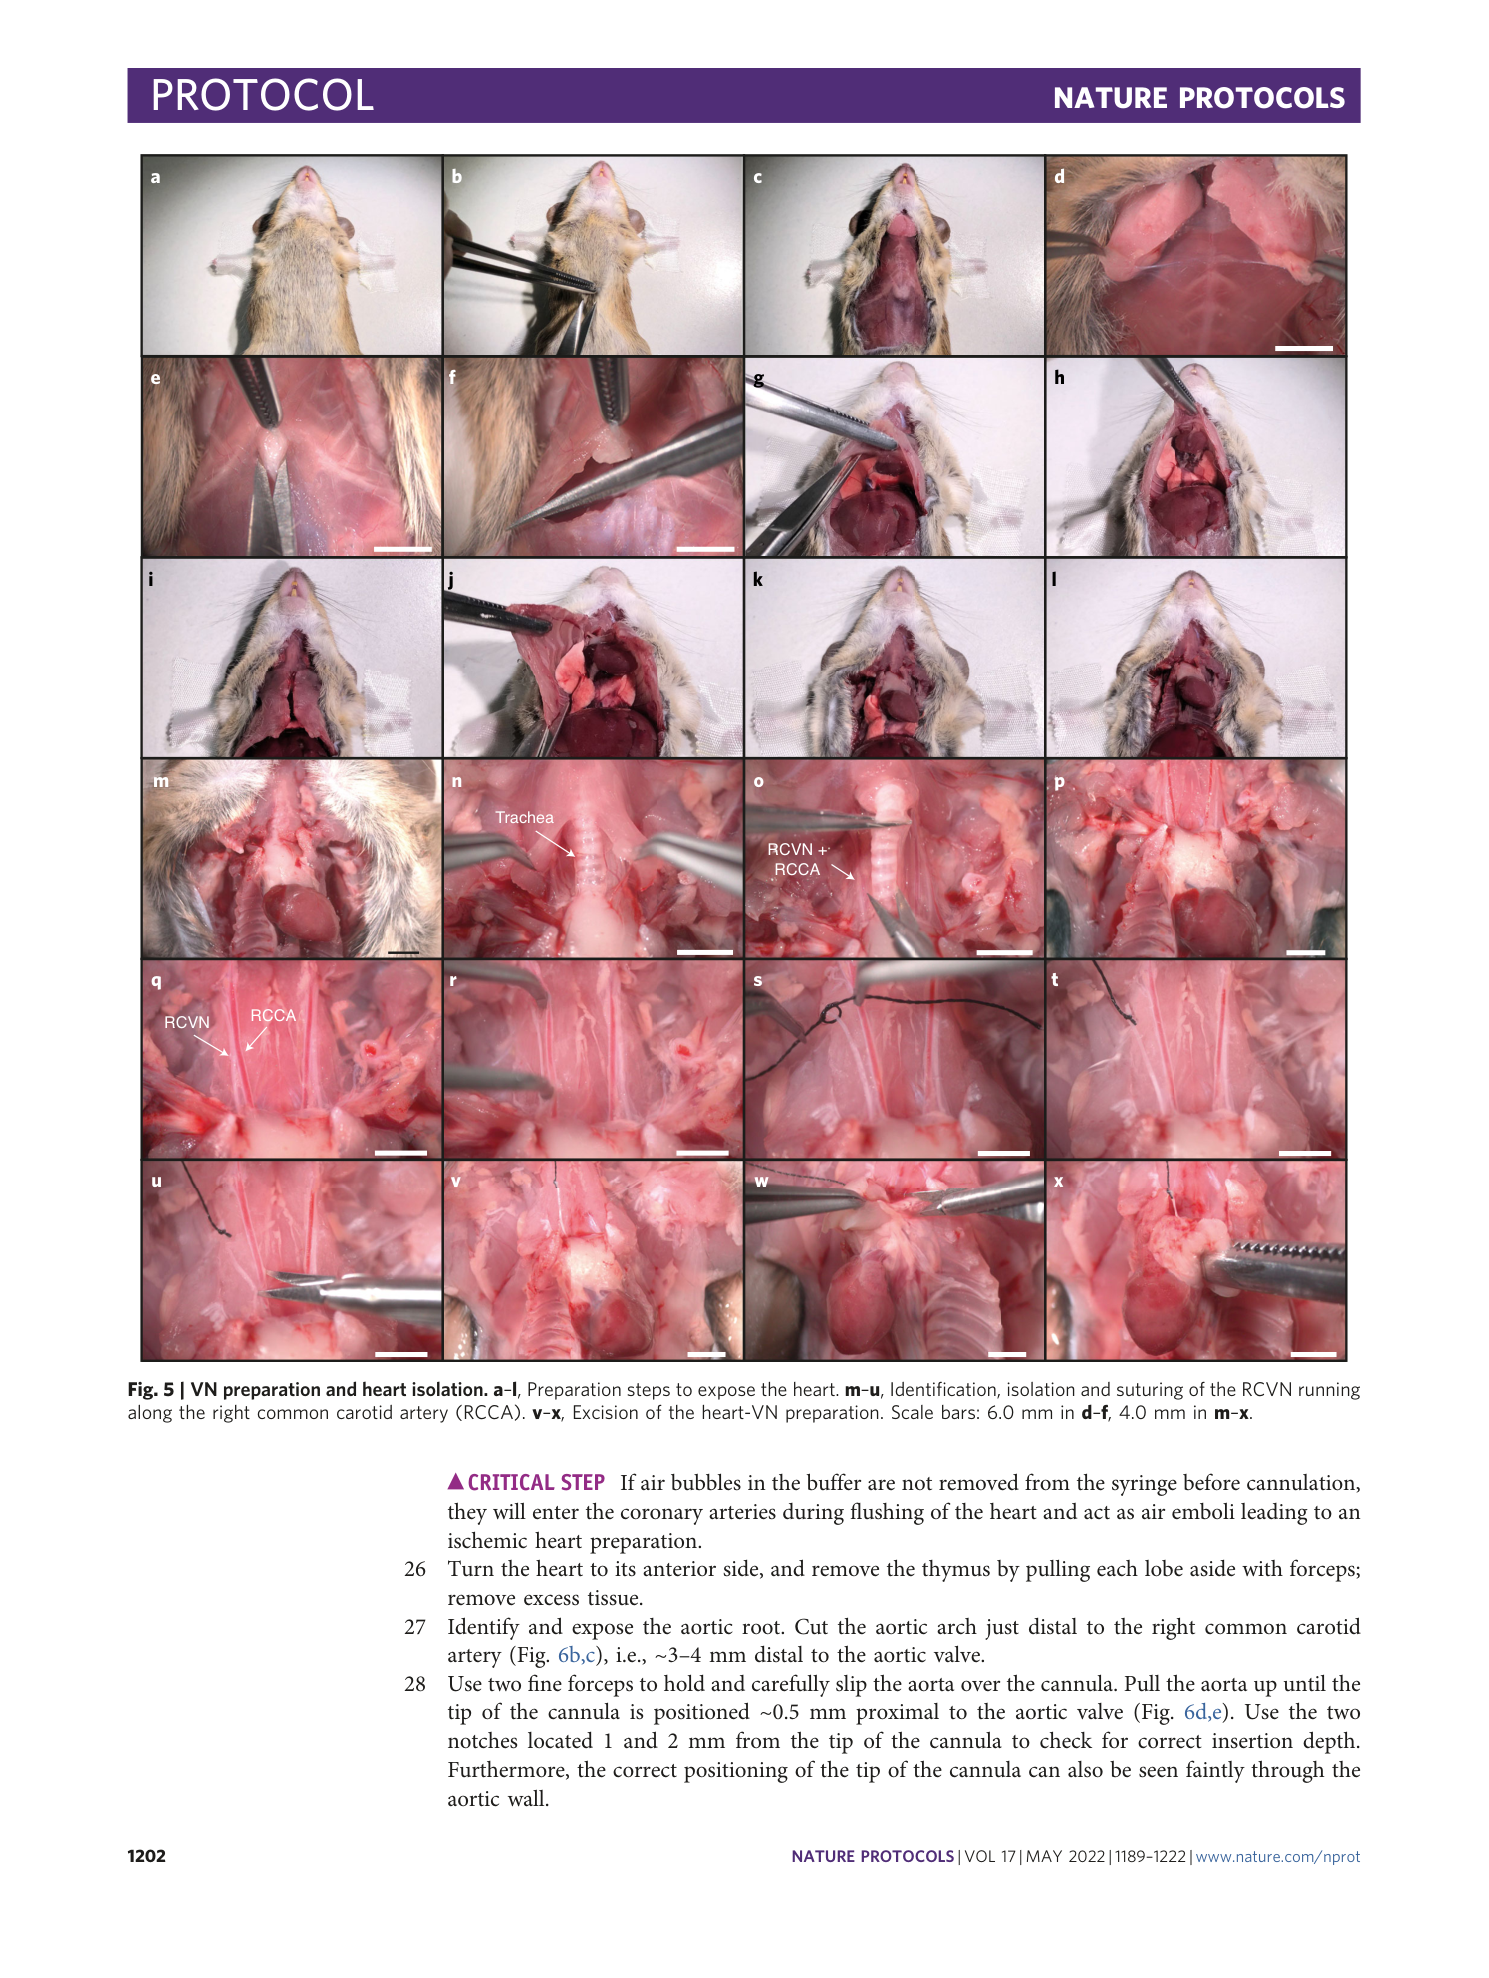
Supplementary Figs. 1–4.
Reporting Summary
Supplementary Video1
Video recording of the surgical procedure required for performing in vivo EPS.
Supplementary Data 1
Statistical source data for Table 1.
Supplementary Data 2
Statistical source data for Table 2.
Supplementary Data 3
Statistical source data for Table 3.
Supplementary Data 4
Statistical source data for Table 4.
