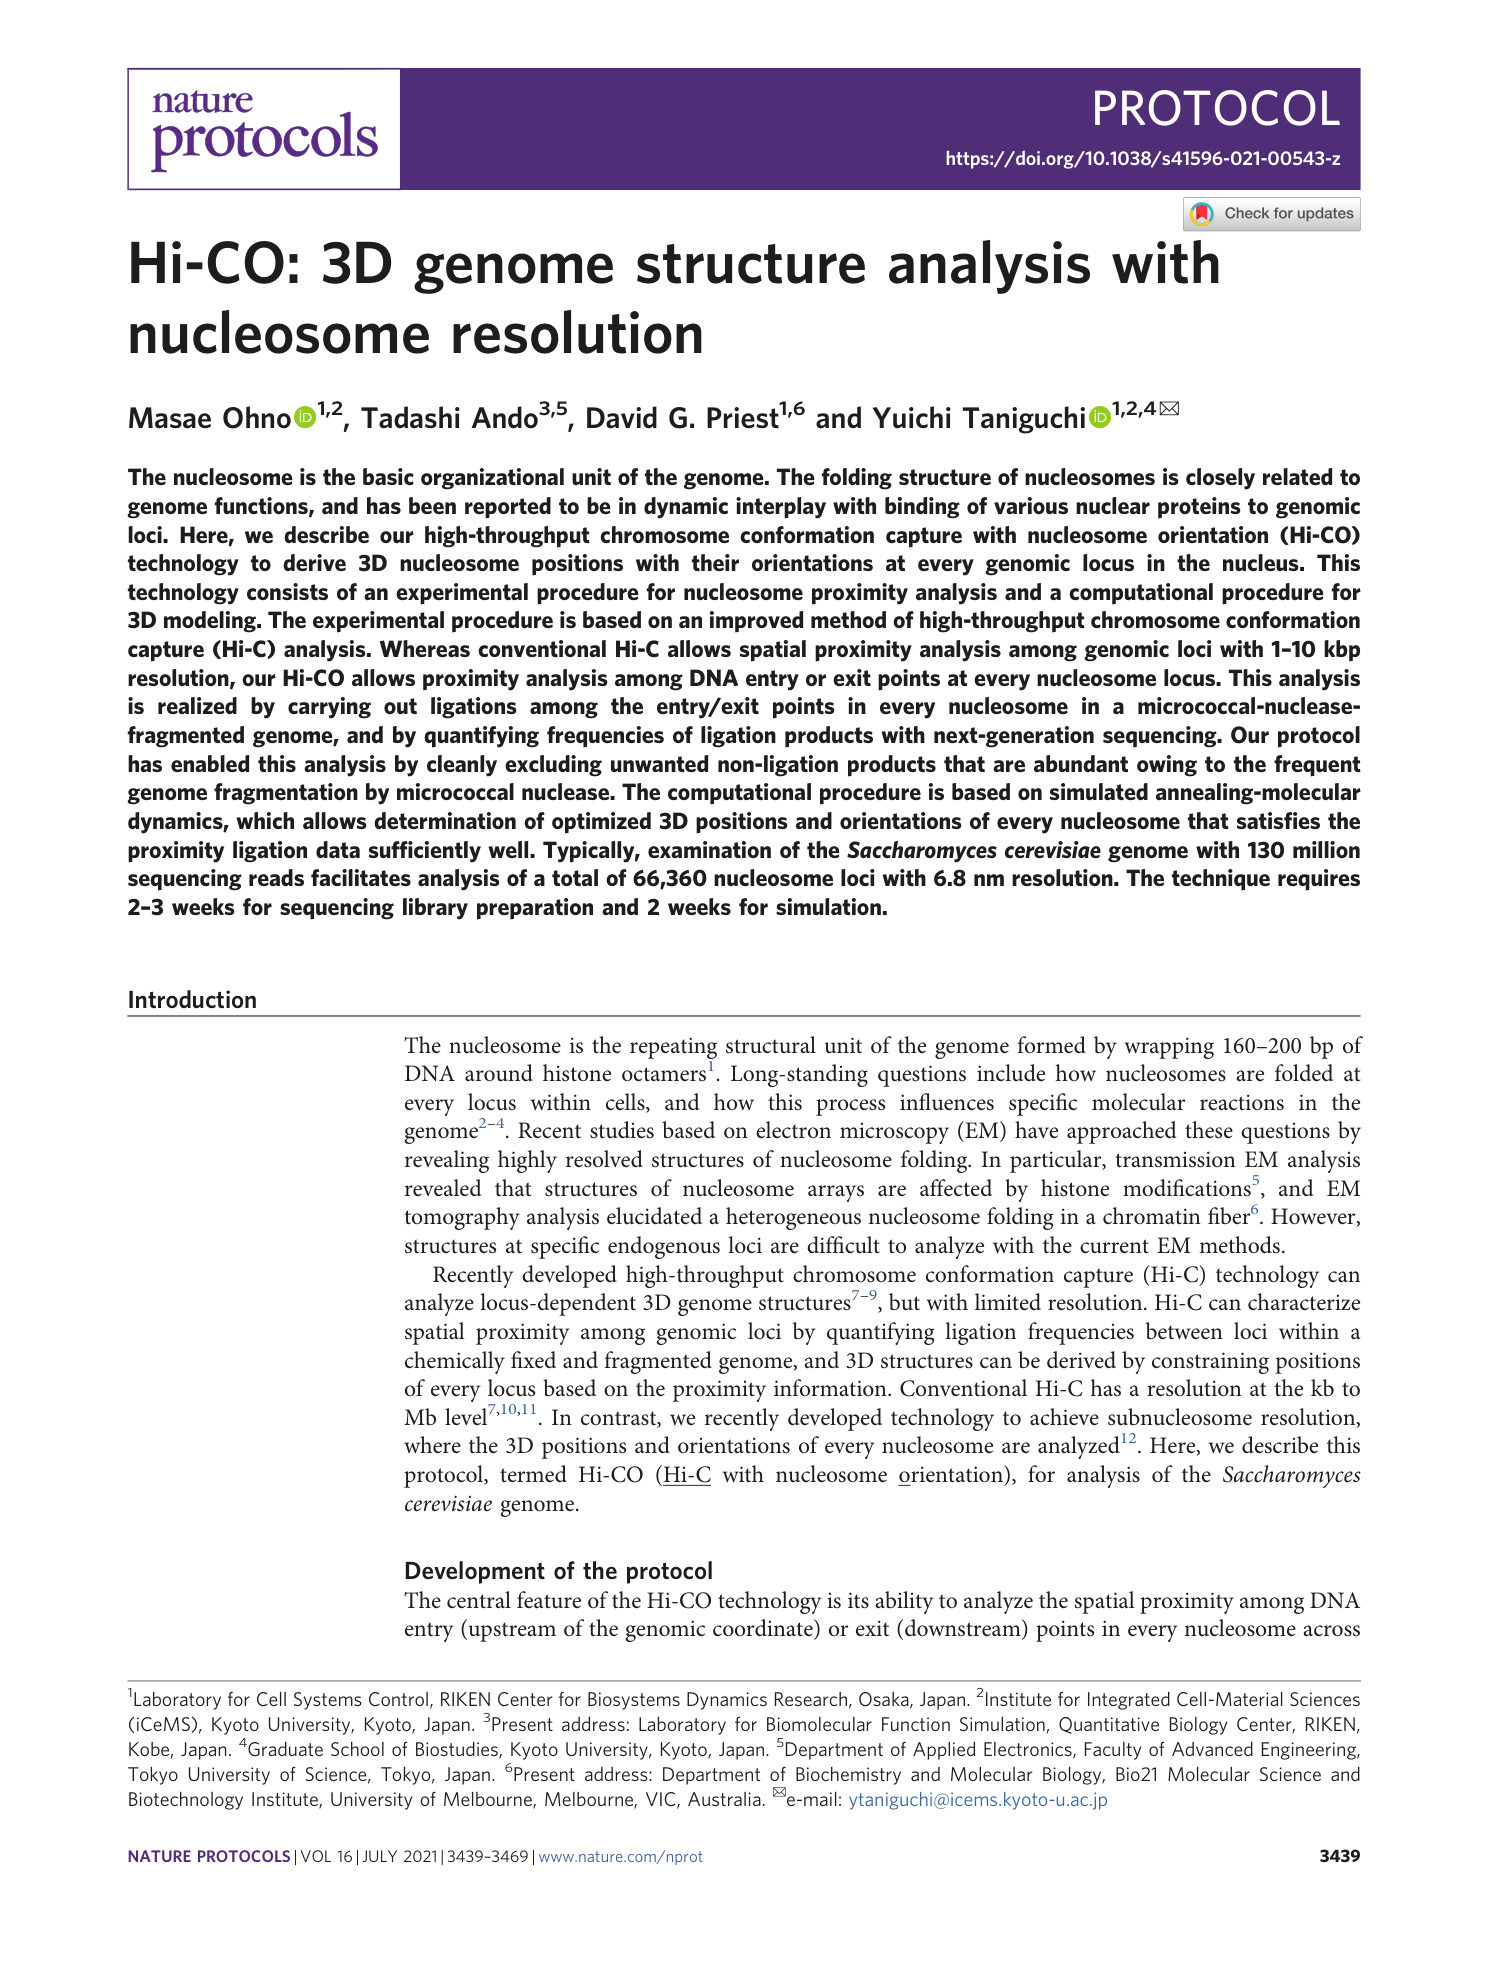
Hi-CO: 3D genome structure analysis with nucleosome resolution
Masae Ohno, Tadashi Ando, David G. Priest, Yuichi Taniguchi
nucleosome resolution
3D genome structure
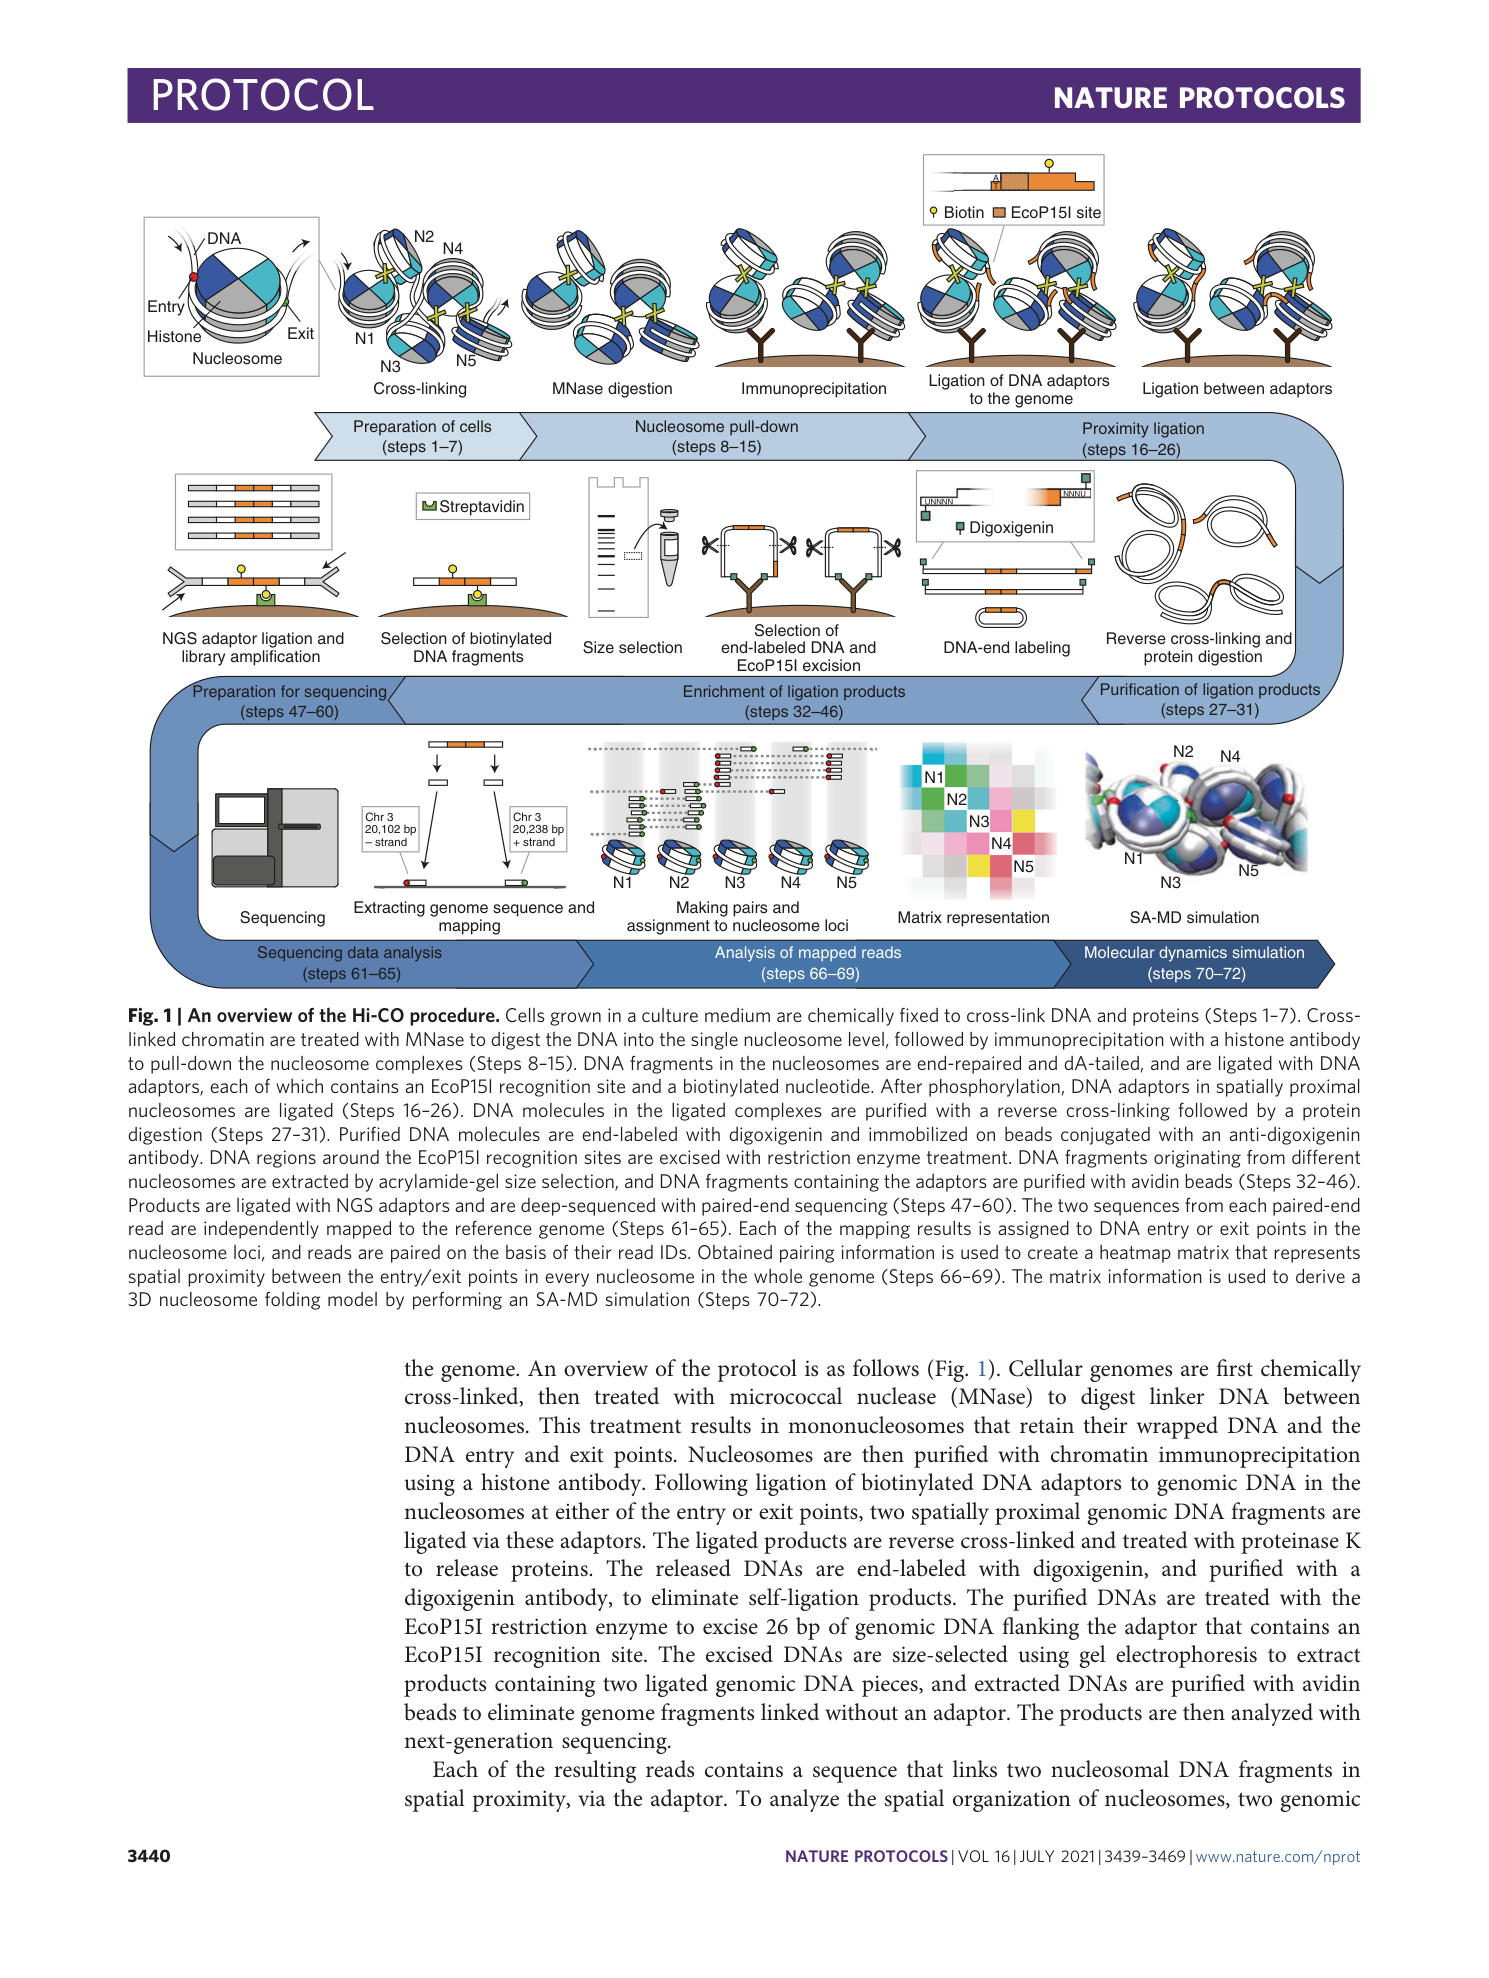
Hi-CO technology
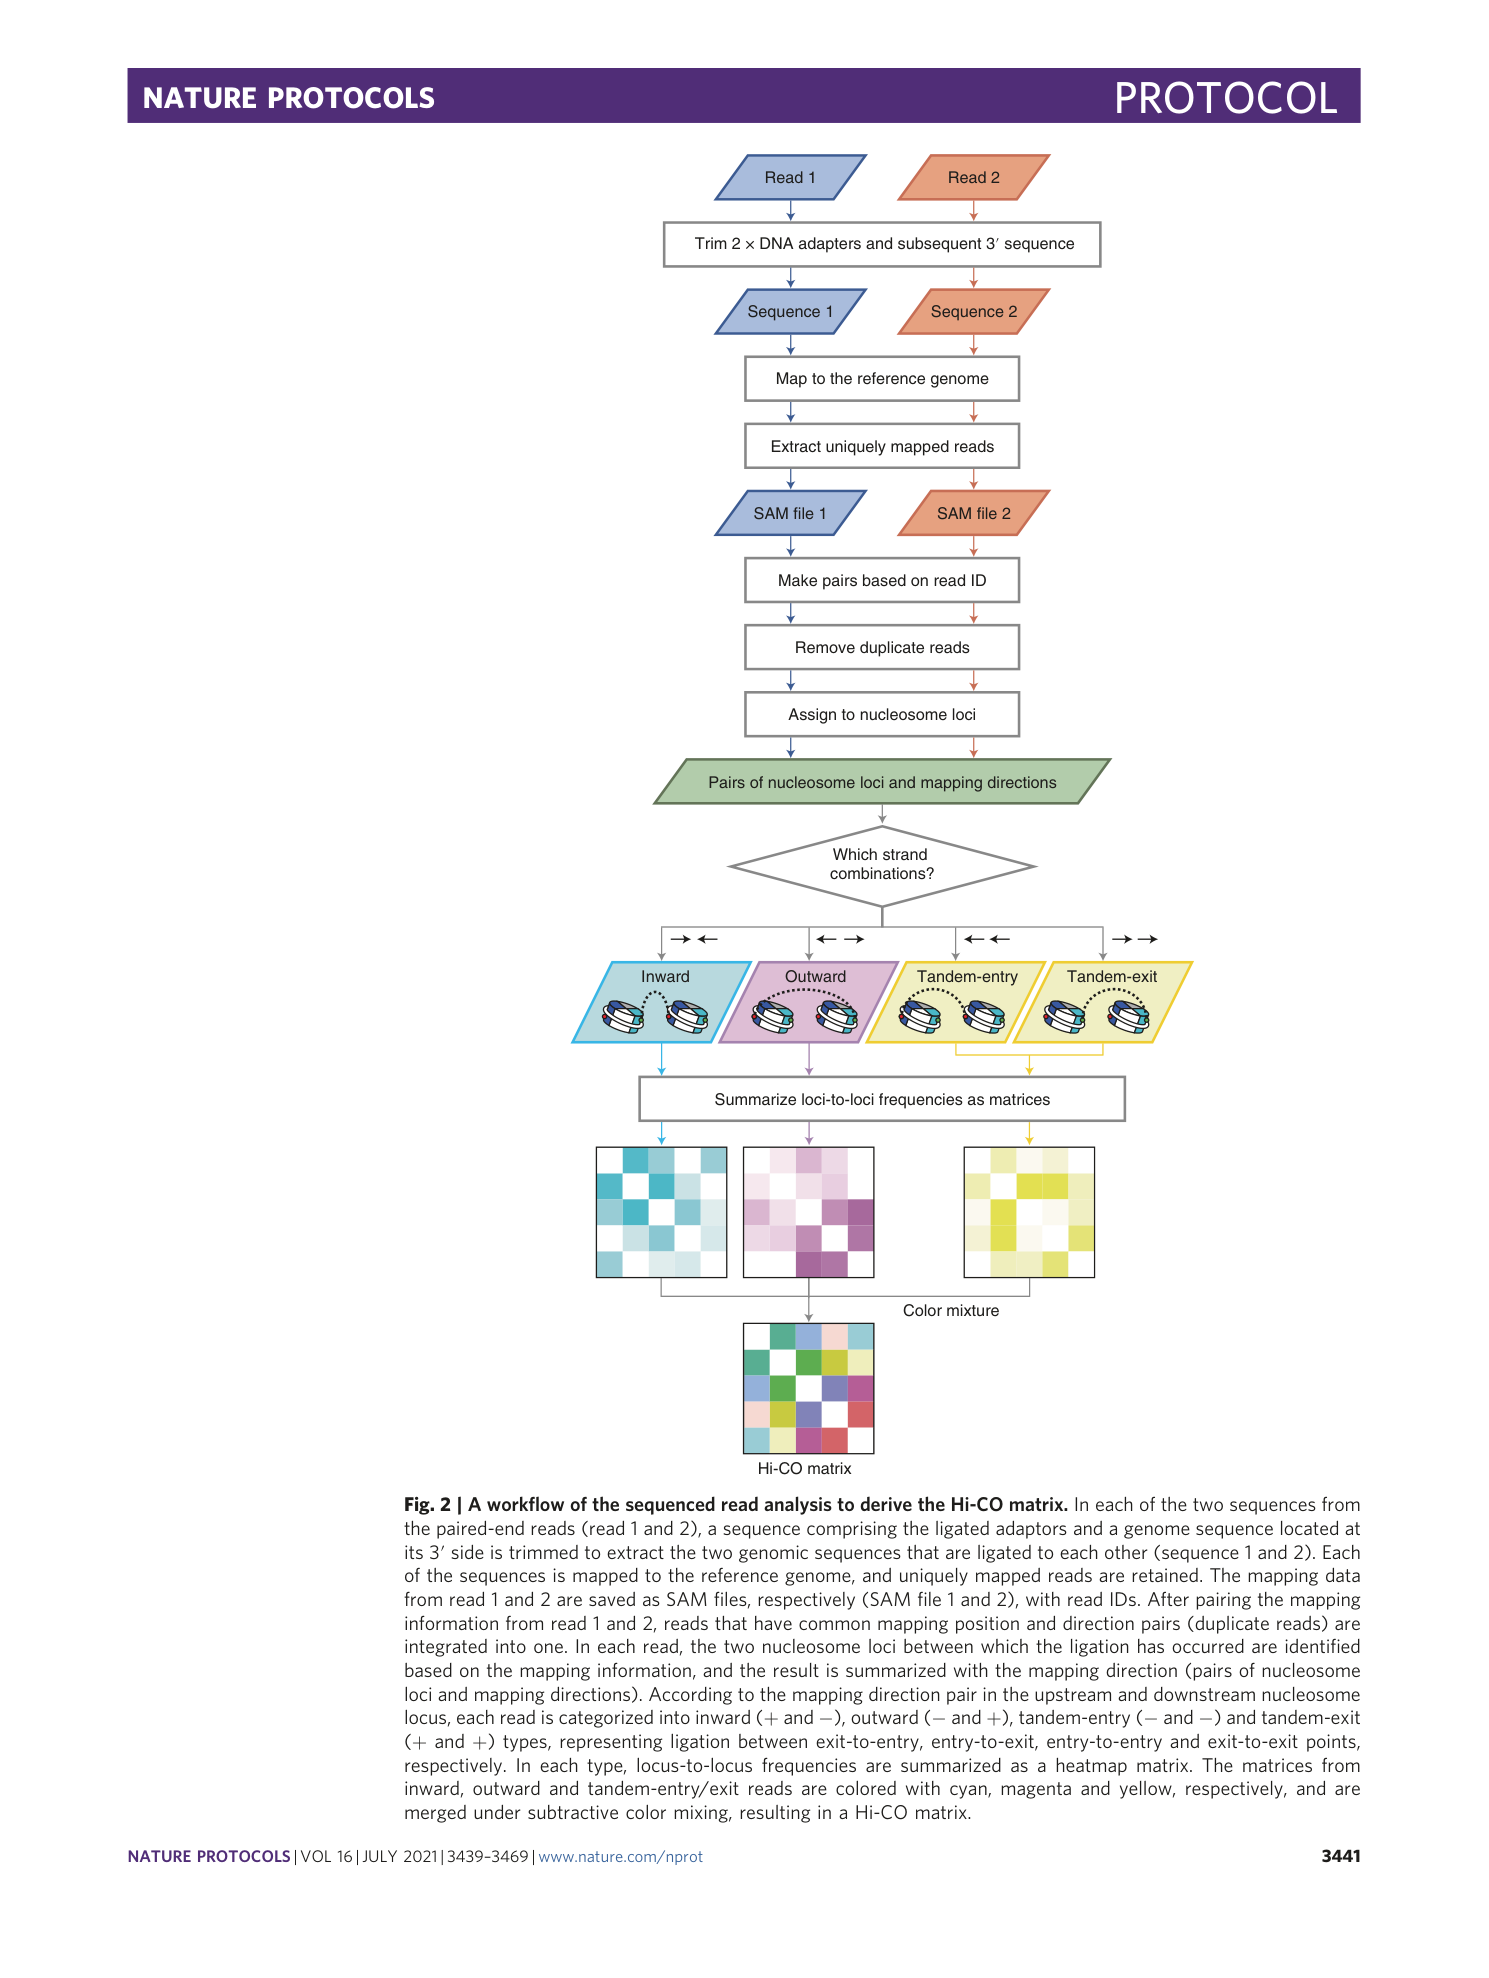
chromosome conformation capture
simulated annealing-molecular dynamics
Extended
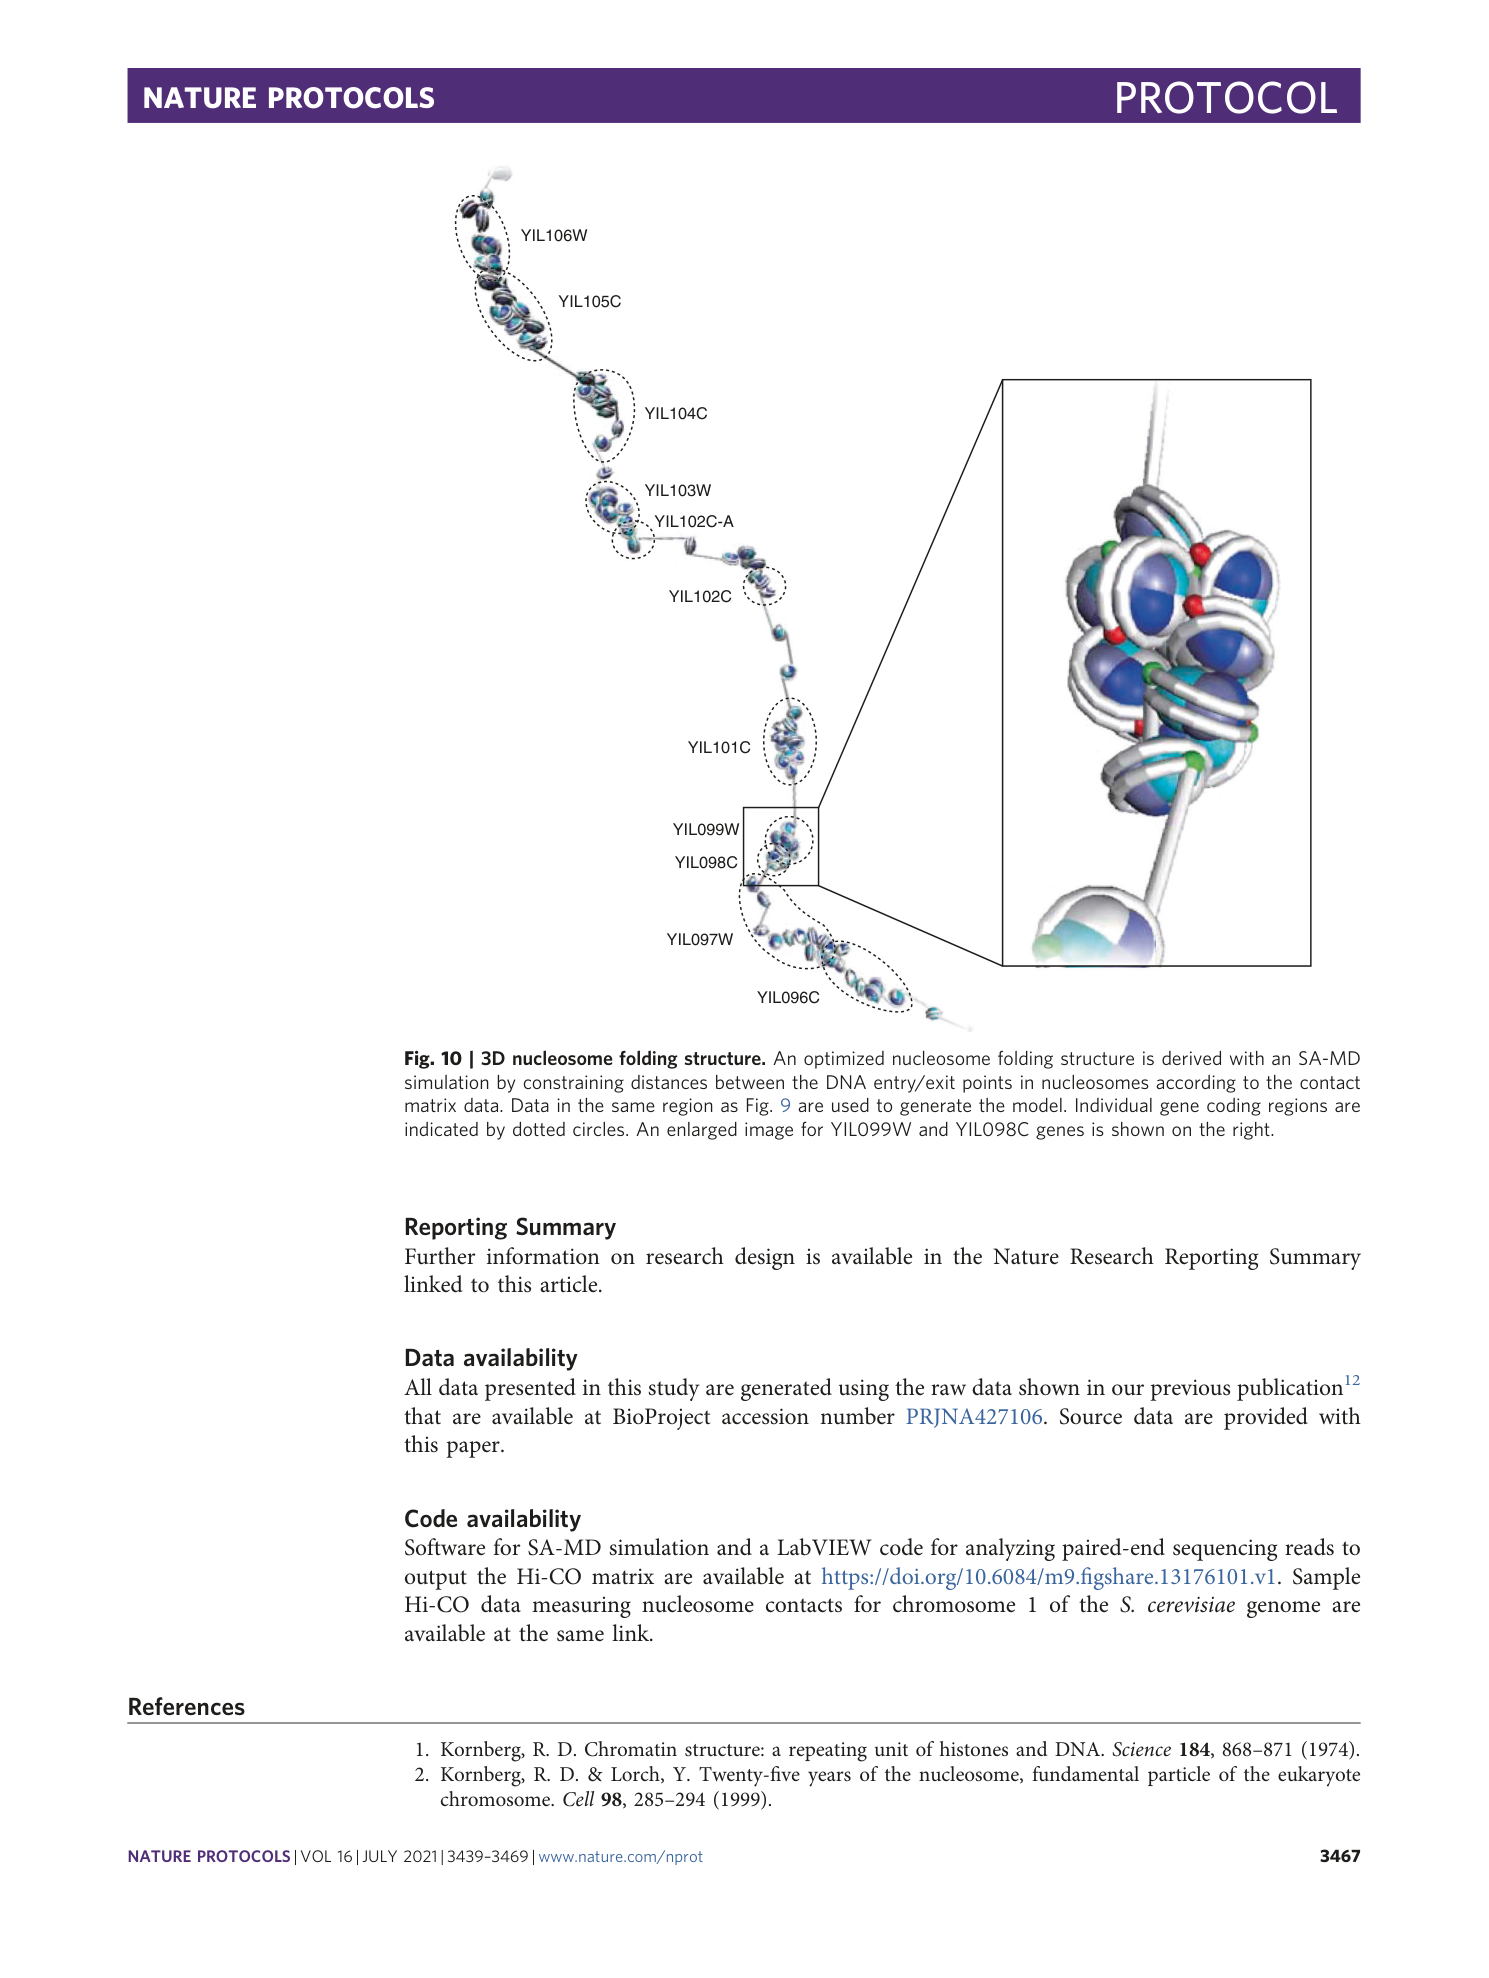
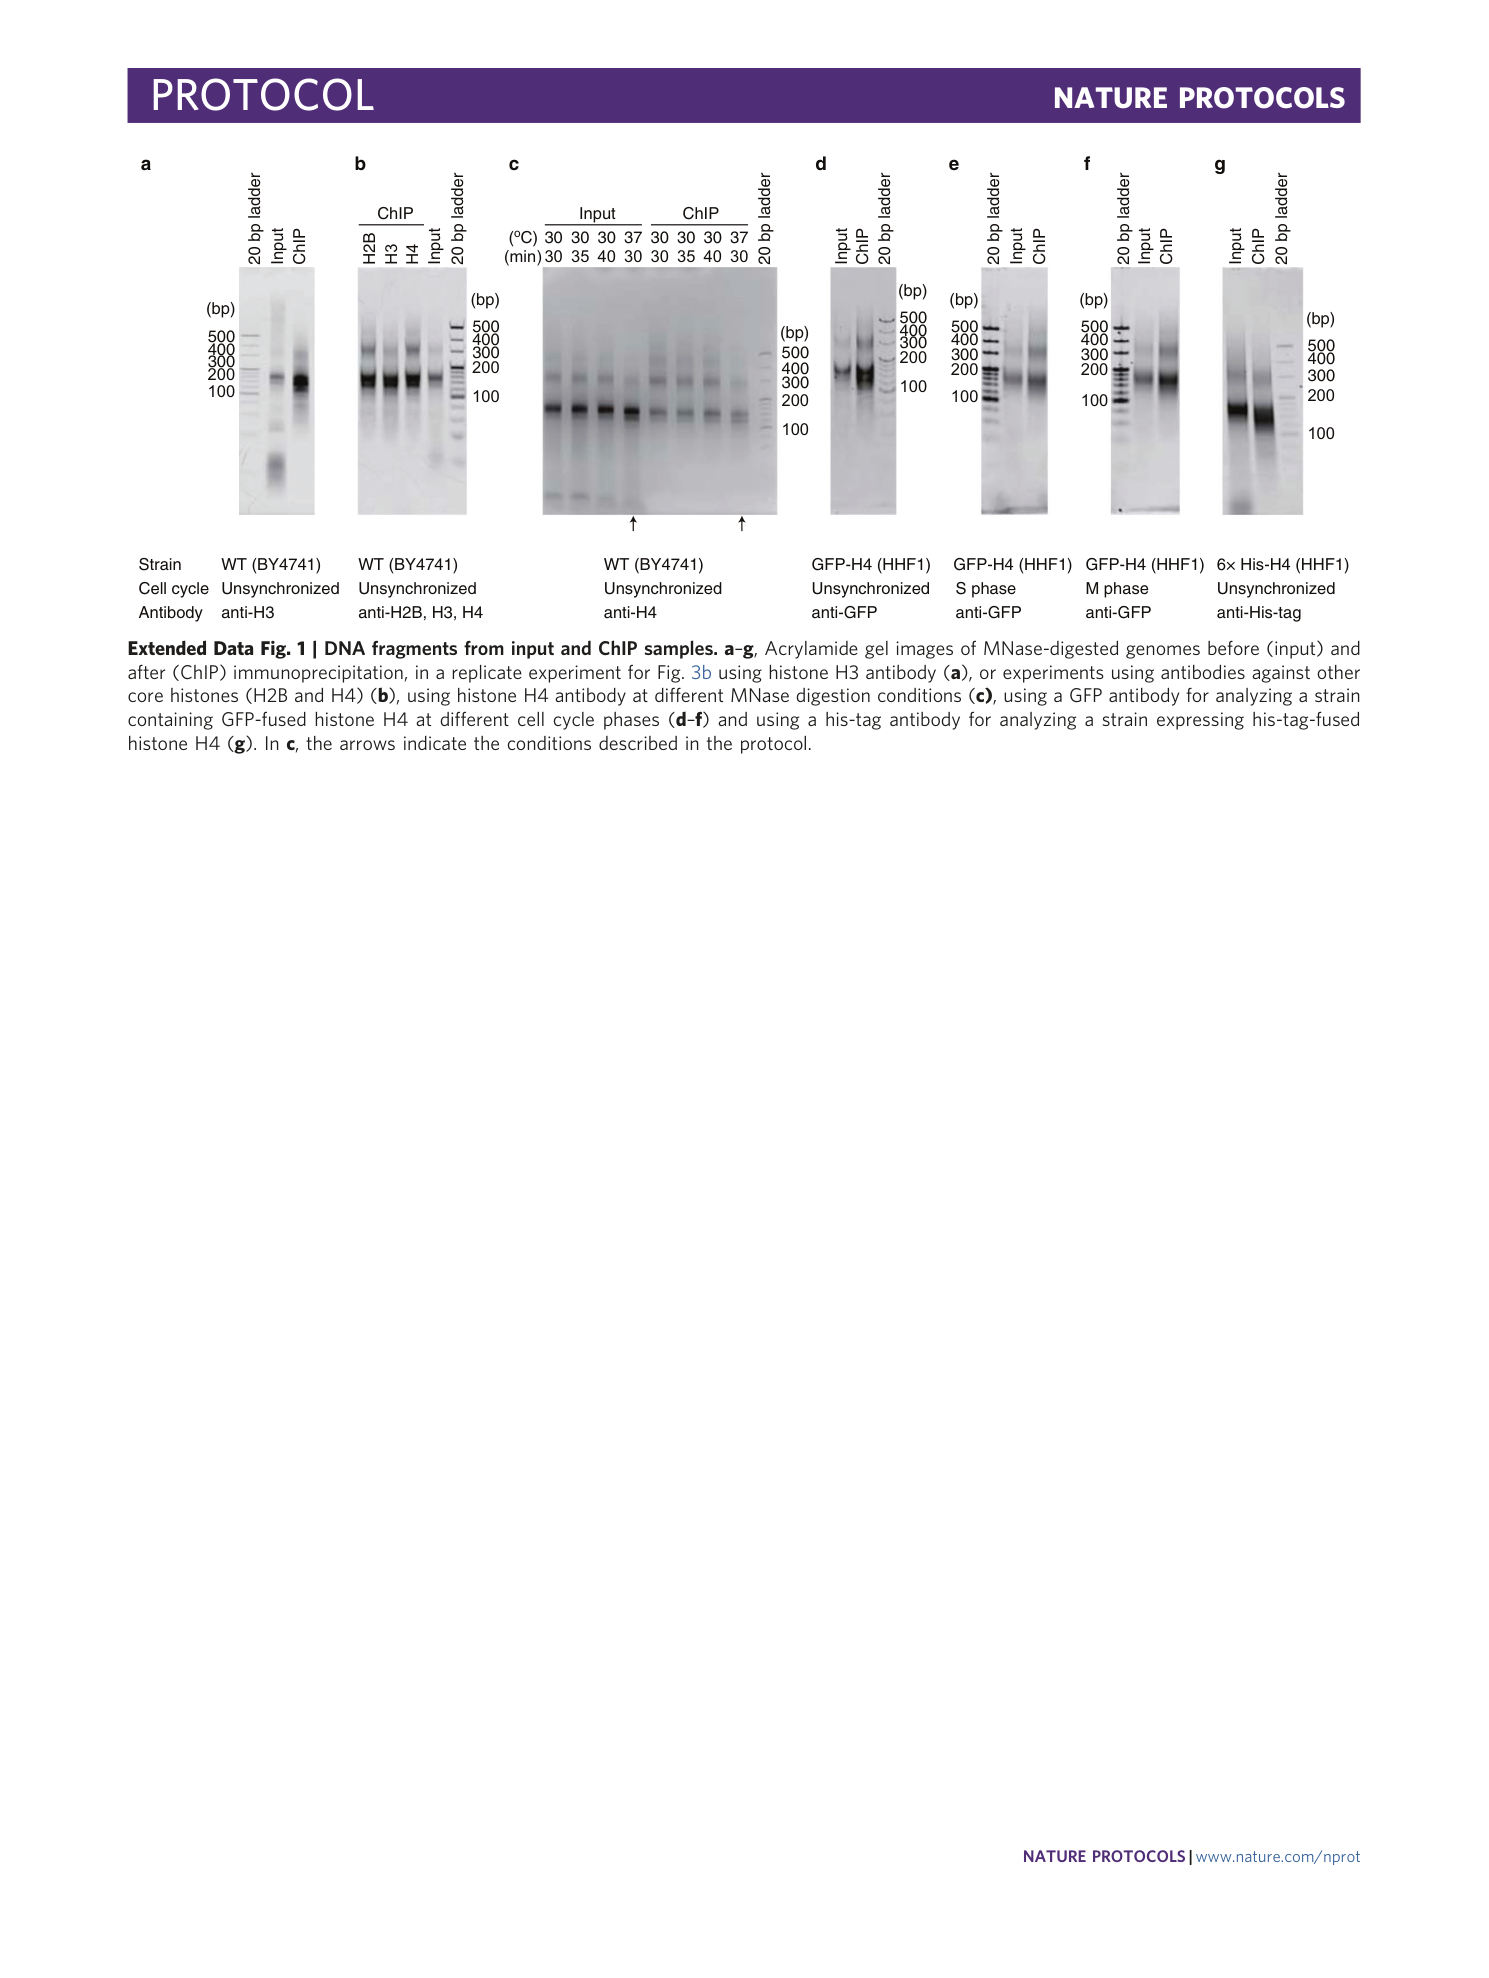
Extended Data Fig. 1 DNA fragments from input and ChIP samples.
a – g , Acrylamide gel images of MNase-digested genomes before (input) and after (ChIP) immunoprecipitation, in a replicate experiment for Fig. 3b using histone H3 antibody ( a ), or experiments using antibodies against other core histones (H2B and H4) ( b ), using histone H4 antibody at different MNase digestion conditions ( c) , using a GFP antibody for analyzing a strain containing GFP-fused histone H4 at different cell cycle phases ( d – f ) and using a his-tag antibody for analyzing a strain expressing his-tag-fused histone H4 ( g ). In c , the arrows indicate the conditions described in the protocol.
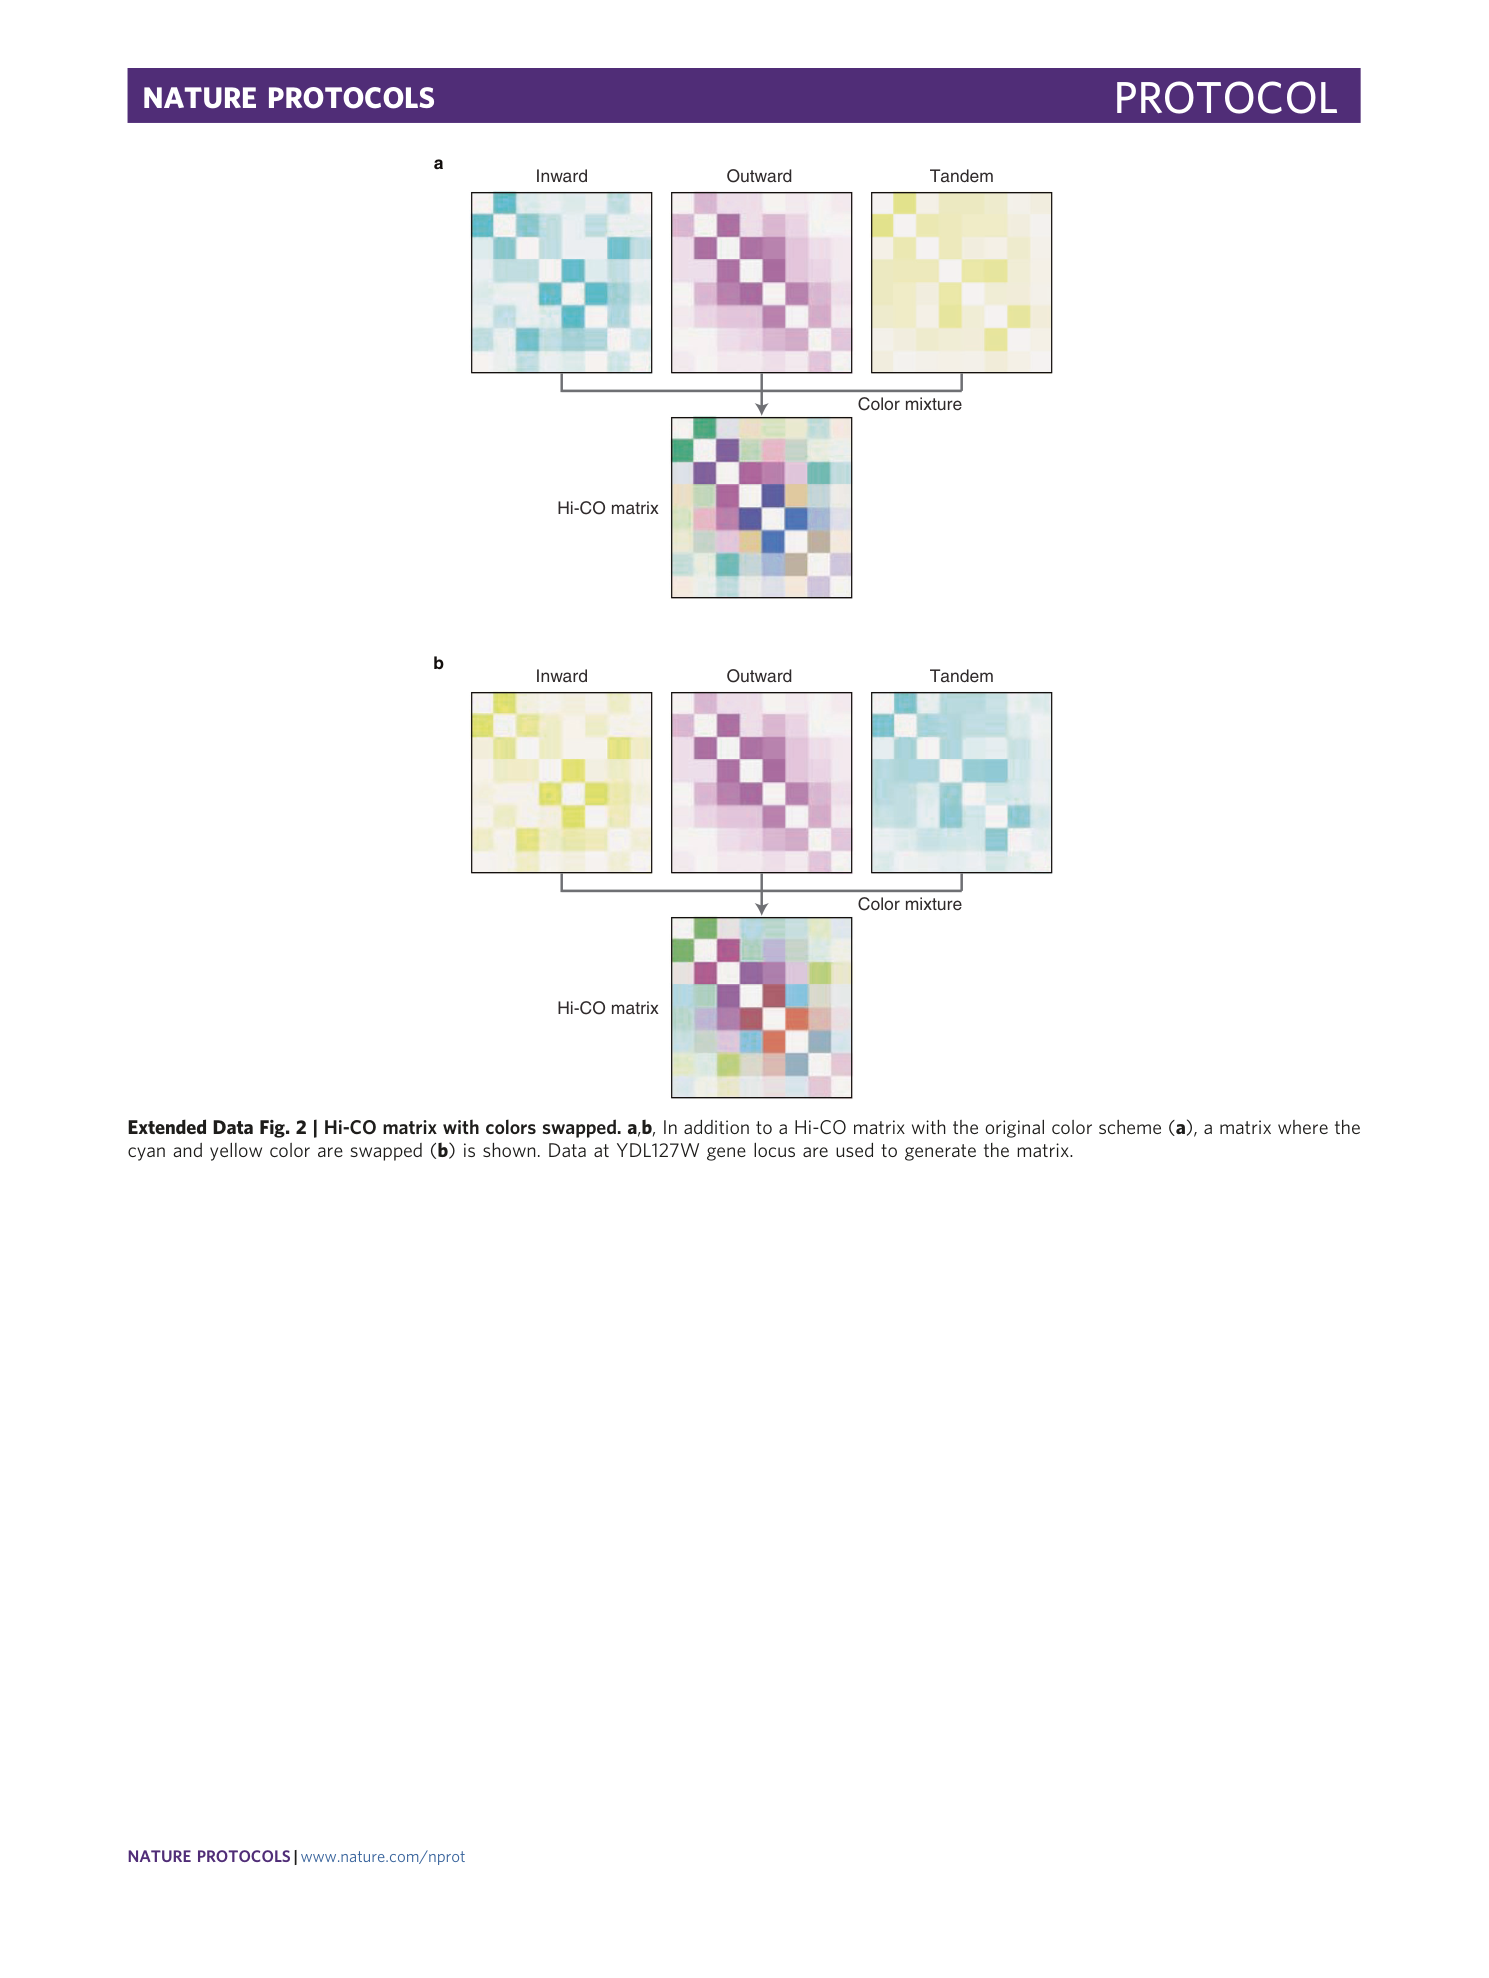
Extended Data Fig. 2 Hi-CO matrix with colors swapped.
a , b , In addition to a Hi-CO matrix with the original color scheme ( a ), a matrix where the cyan and yellow color are swapped ( b ) is shown. Data at YDL127W gene locus are used to generate the matrix.
