Single Nucleotide Polymorphism (SNP) Arrays and Their Sensitivity for Detection of Genetic Changes in Human Pluripotent Stem Cell Cultures
Jason A. Halliwell, Jason A. Halliwell, Victoria Steventon-Jones, Victoria Steventon-Jones, Dylan Stavish, Dylan Stavish, Duncan Baker, Duncan Baker, Ivana Barbaric, Ivana Barbaric
copy-number variant (CNV)
genetic changes
human pluripotent stem cells (hPSCs)
sensitivity
SNP arrays
Abstract
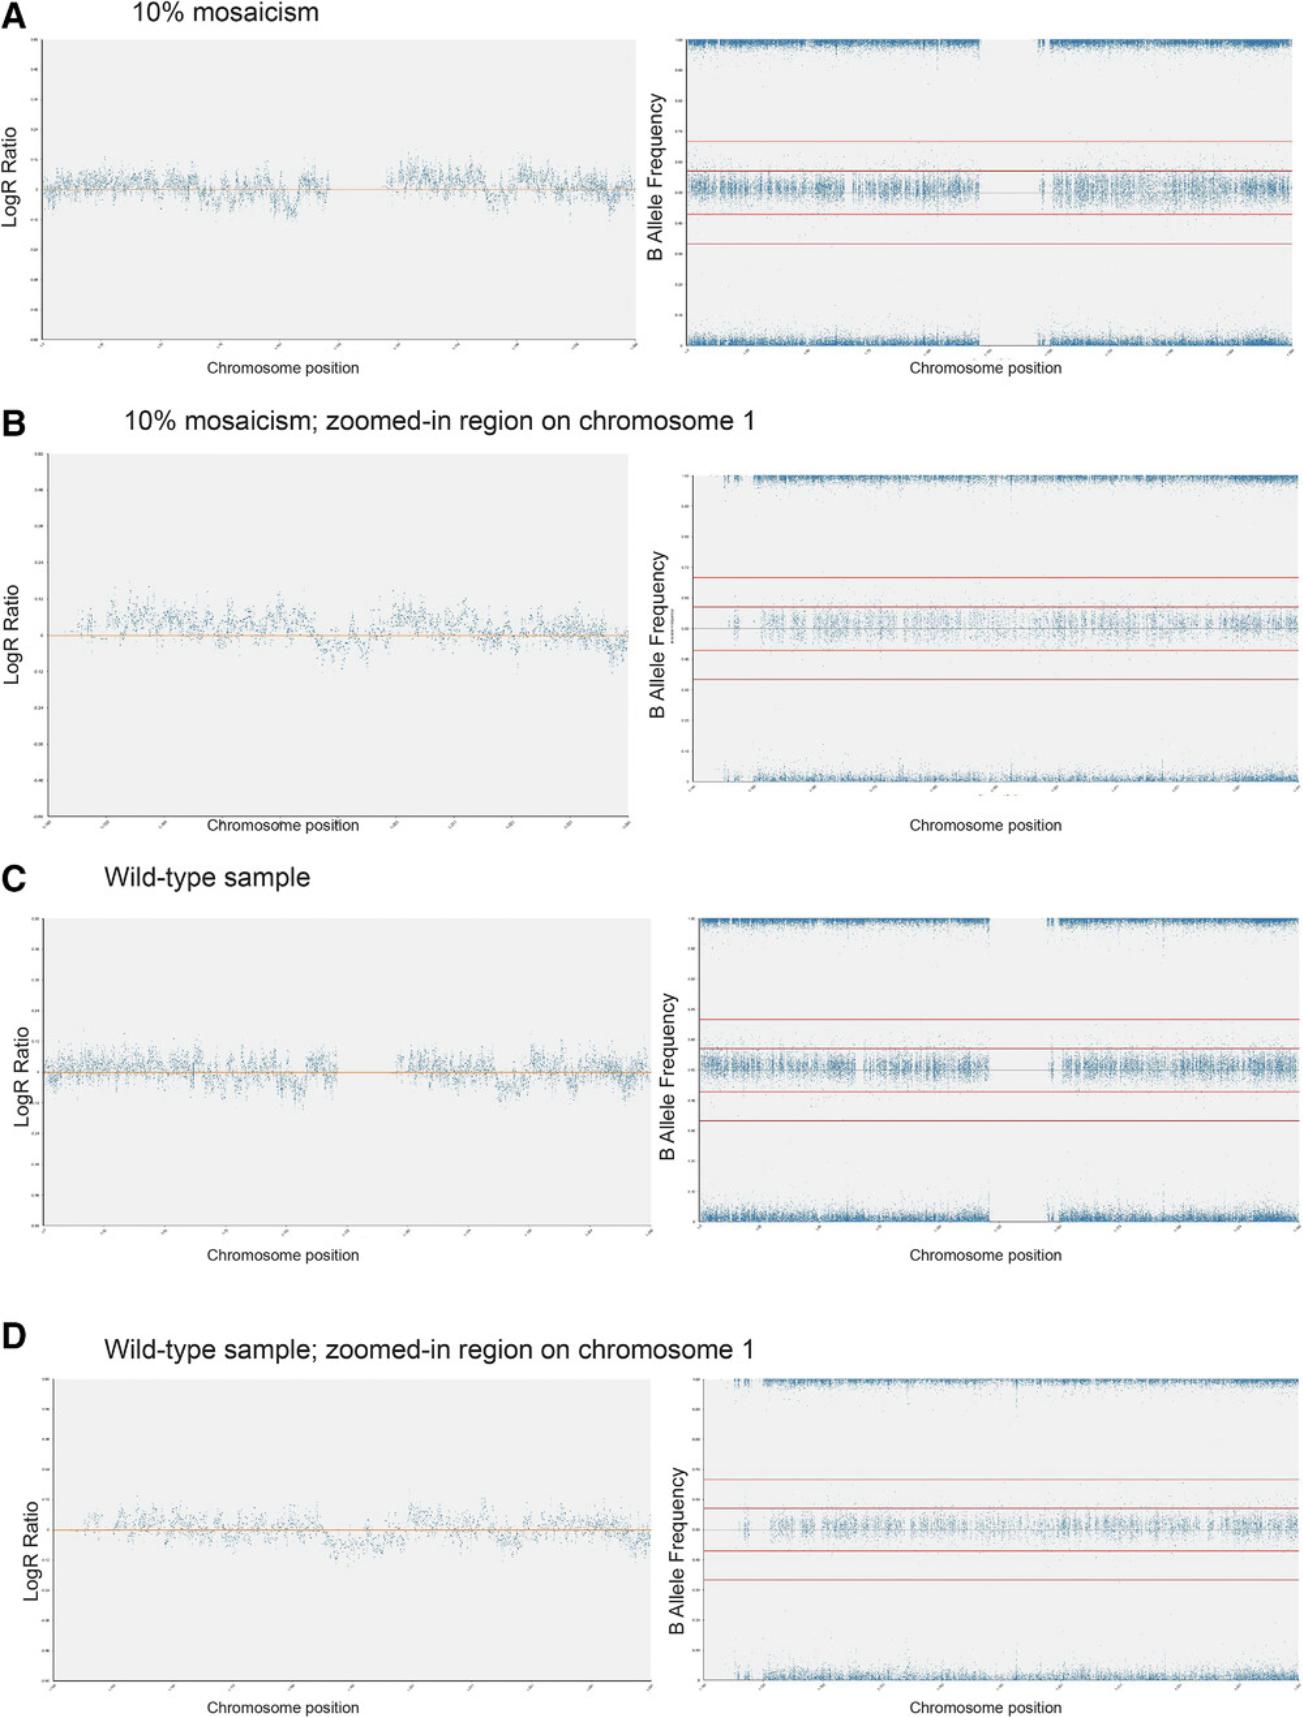
Human pluripotent stem cells (hPSCs) can be grown in culture indefinitely, making them a valuable tool for use in basic biology, disease modeling, and regenerative medicine. However, over prolonged periods in culture, hPSCs tend to acquire genomic aberrations that confer growth advantages, similar to those seen in some cancers. Monitoring the genomic stability of cultured hPSCs is critical to ensuring their efficacy and safety as a therapeutic tool. Most commonly employed methods for monitoring of hPSC genomes are cytogenetic methods, such as G-banding. Nonetheless, such methods have limited resolution and sensitivity for detecting mosaicism. Single nucleotide polymorphism (SNP) array platforms are a potential alternative that could improve detection of abnormalities. Here, we outline protocols for SNP array whole-genome screening of hPSCs. Moreover, we detail the procedure for assessing the SNP array's sensitivity in detecting low-level mosaic copy-number changes. We show that mosaicism can be confidently identified in samples only once they contain 20% variants, although samples containing 10% variants typically display enough variation to warrant further investigation and confirmation, for example by using a more sensitive targeted method. Finally, we highlight the advantages and limitations of SNP arrays, including a cost comparison of SNP arrays versus other commonly employed methods for detection of genetic changes in hPSC cultures. © 2022 The Authors. Current Protocols published by Wiley Periodicals LLC.
Basic Protocol 1 : DNA sample preparation for SNP arrays
Basic Protocol 2 : SNP array hybridization, washing, and scanning
Basic Protocol 3 : SNP array data analysis
Support Protocol : Assessment of SNP array sensitivity for detection of mosaicism
INTRODUCTION
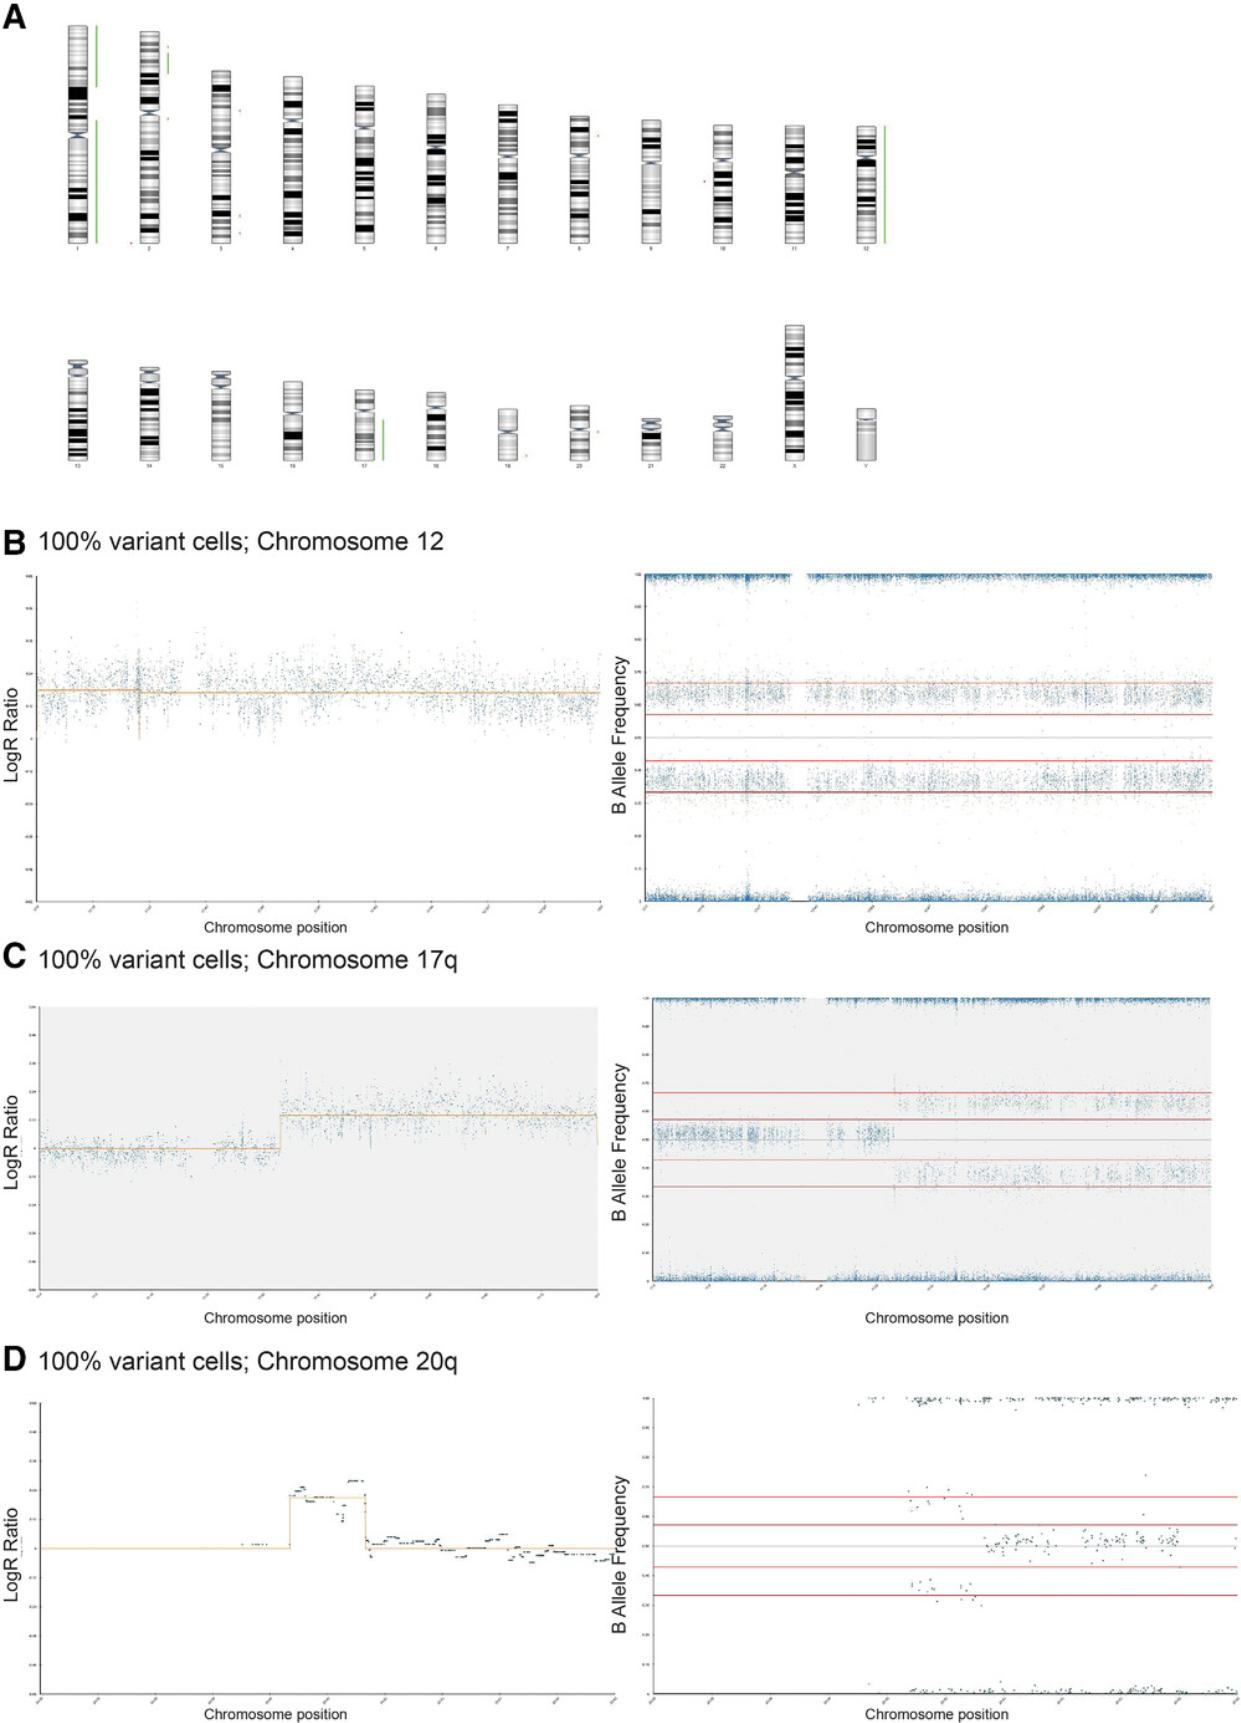
Over time and upon prolonged culturing, human pluripotent stem cells (hPSCs) tend to develop recurrent genetic abnormalities (reviewed in Halliwell, Barbaric, & Andrews, 2020). Multiple studies of both embryonic stem cells (ESCs) and induced pluripotent stem cells (iPSCs) have shown that the abnormalities seen are non-random, with gains of specific whole chromosomes or chromosome arms frequently reported (Amps et al., 2011; Baker et al., 2016; Draper et al., 2004; Taapken et al., 2011). In particular, gains of chromosome 1, 12, 17, 20, and X are the most commonly detected abnormalities in hPSC cultures (Amps et al., 2011; Baker et al., 2016; Taapken et al., 2011). Abnormalities can be seen in stem cell lines from as early as passage 4, and they can also retain a stable genotype for over 100 passages (Amps et al., 2011; Taapken et al., 2011).
Once an abnormality is present, it typically takes over the culture after several passages, consistent with the idea that the commonality of the aberrations seen points to a selection pressure and that these mutations confer an advantage that becomes “fixed” (Baker et al., 2007). These chromosomal changes typically lead to an increased cloning efficiency, as determined by an increase in the percentage of cells that settle on the flask surface and start dividing after seeding (Barbaric et al., 2014; Harrison, Baker, & Andrews, 2007). Cell lines with recurrent genomic abnormalities also exhibit reduced apoptosis, independence from growth-factor signals, and a faster cell cycle time compared to their euploid counterparts (Halliwell et al., 2020). The recurrent genetic changes seen in hPSCs are therefore adaptations that enhance the cells’ survival and enable them to retain their undifferentiated phenotype (Enver et al., 2005).
Although it is recognized that cultured stem cells must be frequently assessed for the presence of genetic changes (Andrews et al., 2017), guidance on which methods to use has been mostly lacking. The key issue is that hPSCs can acquire a wide spectrum of aberrations, from point mutations to large karyotypic changes, but no existing single method is equally suitable for detecting different types of genetic changes (Baker et al., 2016). Hence, a combination of methods is required to assess genetic changes at chromosome, sub-chromosome, and nucleotide resolution. For a whole-genome overview, karyotyping by G-banding has traditionally been the method of choice (Amps et al., 2011; Baker et al., 2016; Draper et al., 2004; Mitalipova et al., 2005). However, G-banding has a number of practical limitations as it has to be performed on live, proliferating cells. Moreover, the analysis requires a high level of expertise, and the resolution of detection is limited to changes that are larger than 5 to 10 Mb (Shaffer, McGowan-Jordan, & Schmid, 2013).
Single nucleotide polymorphisms (SNPs) are single-base variations in the DNA sequence. They are found at a relatively high frequency in the population but do not result in genetic disease on their own (LaFramboise, 2009). The SNPs targeted in SNP array analysis methods represent variability within a “normal” population. Two variable nucleotides (alleles), termed A and B, are targeted at different genomic loci. SNP arrays use probes that are labeled green for one allele (A) and red for the alternate allele (B) to determine which allele is present at these genetically variable sites within a sample. The more loci with targeted probes that are used, the higher the resolution of the array (Peiffer et al., 2006). The probes hybridize to the DNA, and a fluorescent signal is produced. The fluorescence intensity observed within the sample is compared to the expected fluorescence level at each locus and expressed as a LogR ratio, which indicates the copy number. Deletions and duplications are detected by observing a negative or positive change in the LogR ratio plot (Peiffer et al., 2006). Approximately 50% of the population is typically heterozygous, having the genotype AB or BA; ∼25% is homozygous for A (AA); and the remaining ∼25% is BB (LaFramboise, 2009). The B-allele frequency (BAF) is determined from the fluorescent signal of the B allele at each SNP and is calculated using the formula B/(A+B). Combining information from the LogR ratio and the BAF chart can determine the presence of any abnormalities within the genome with regard to gains and losses (LaFramboise, 2009). SNP arrays can be used to identify triplication, mosaicism, and homozygous loss (nullisomy). However, SNP arrays cannot be used to detect balanced translocations within a genome, nor can they distinguish the presence of multiple clones with differing abnormalities (LaFramboise, 2009; Peiffer et al., 2006).
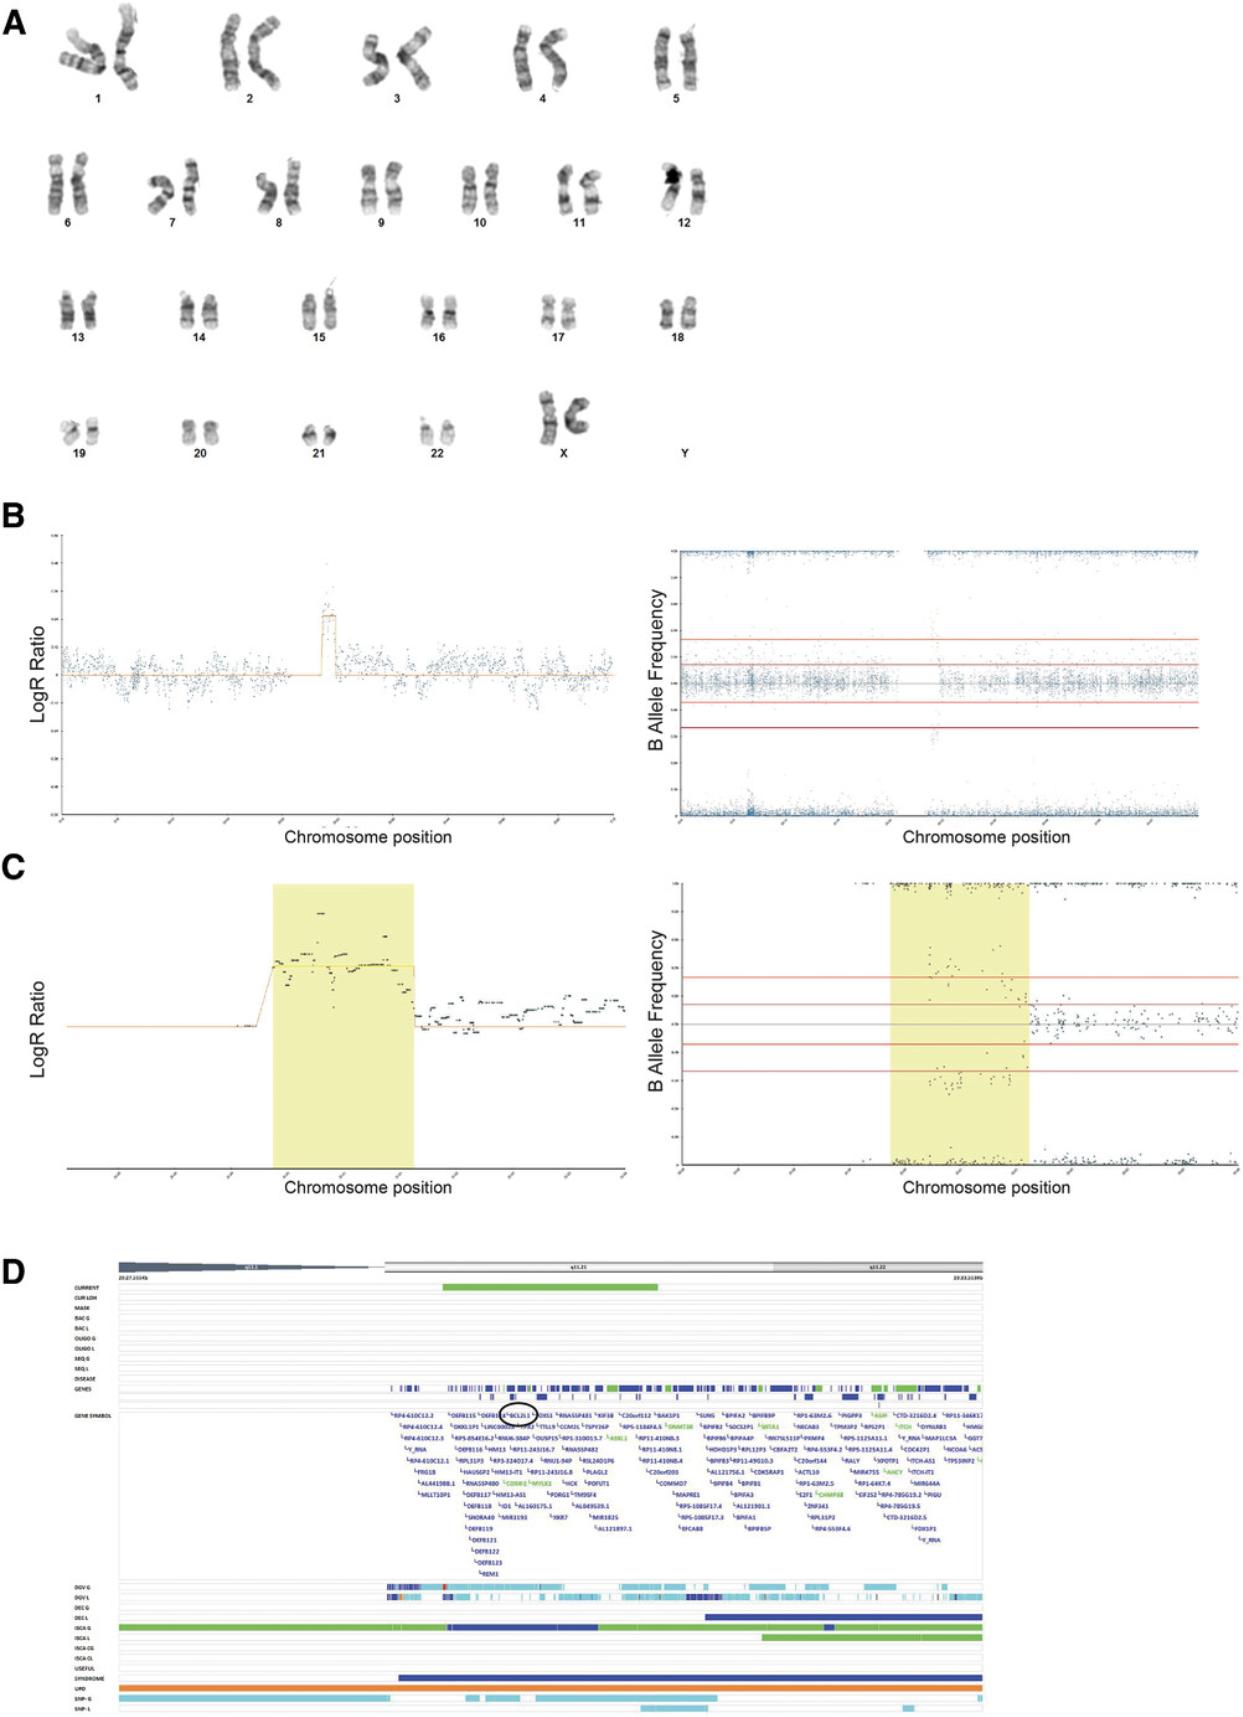
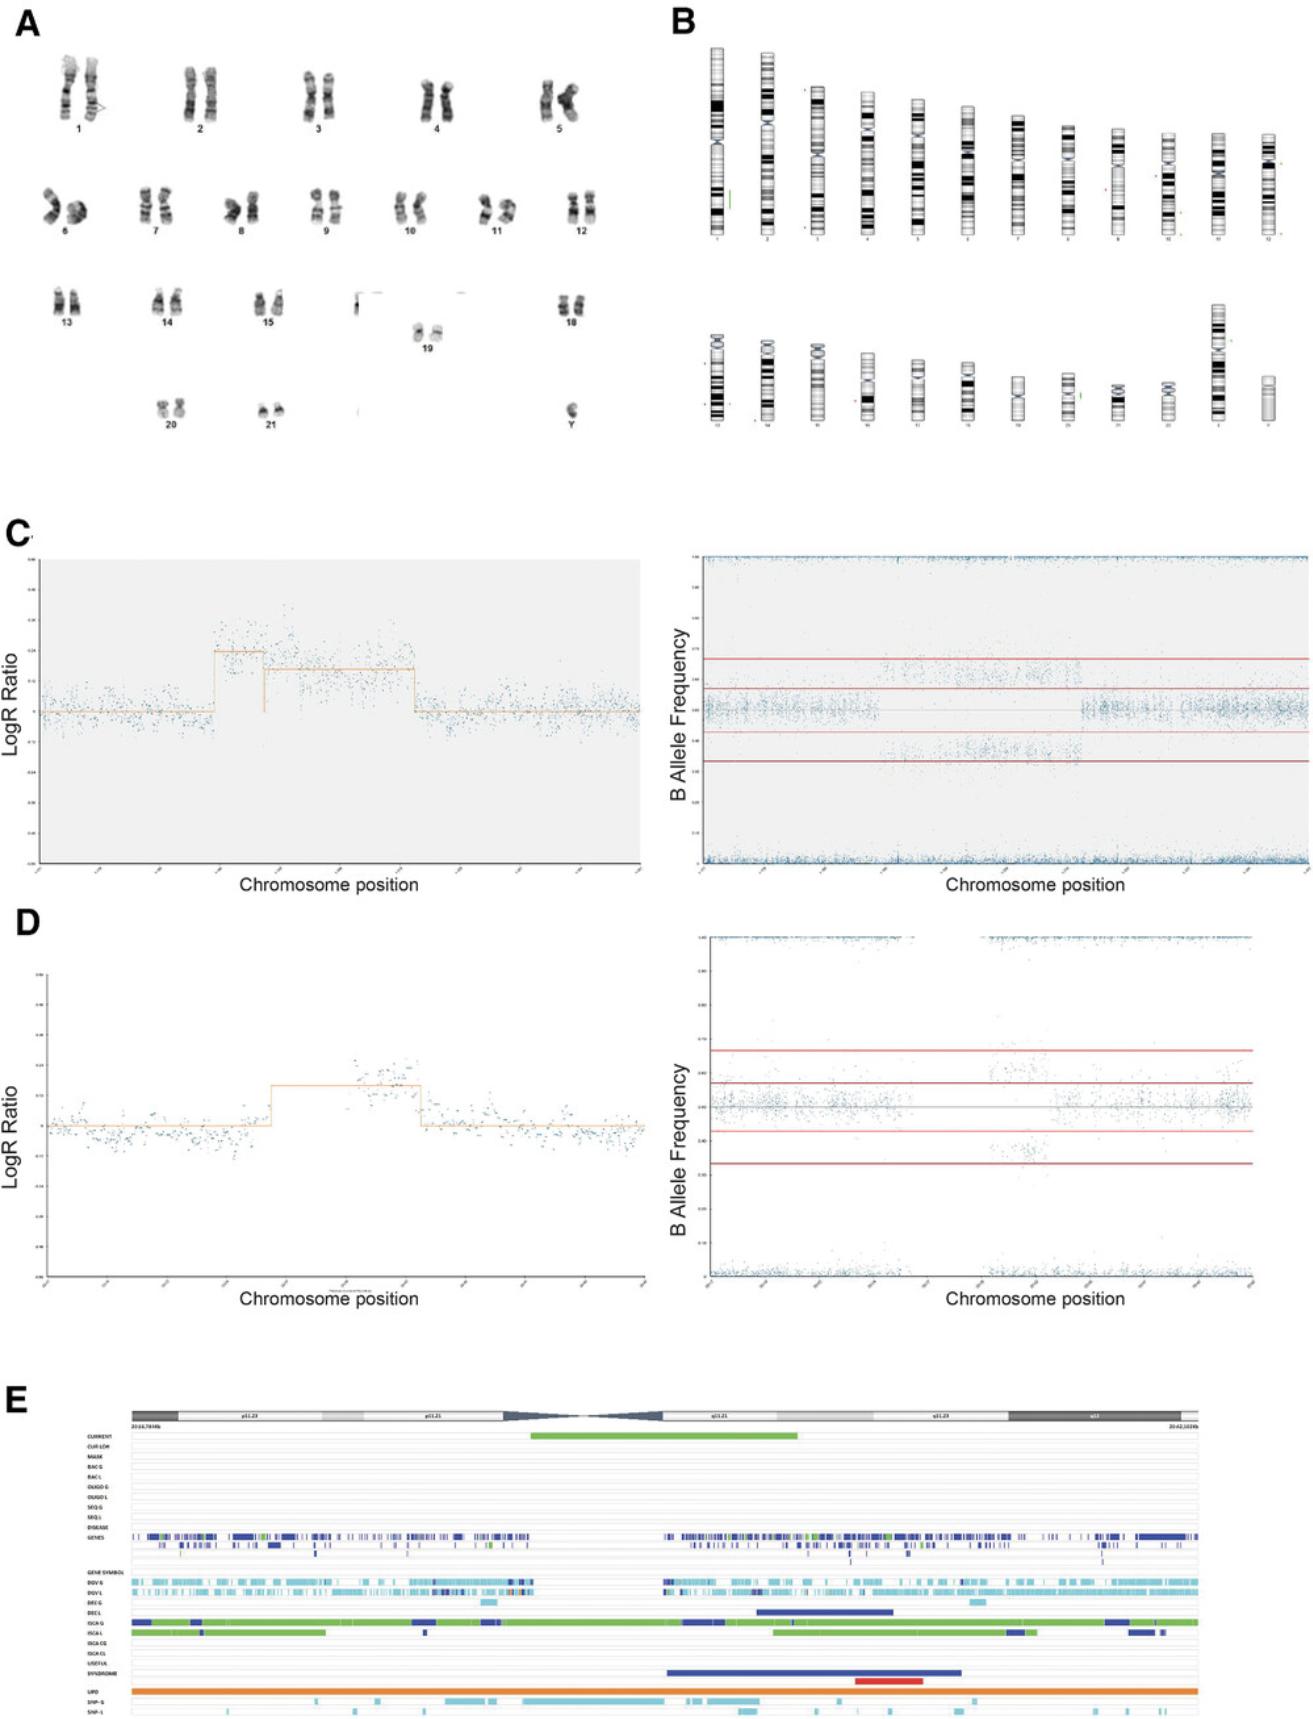
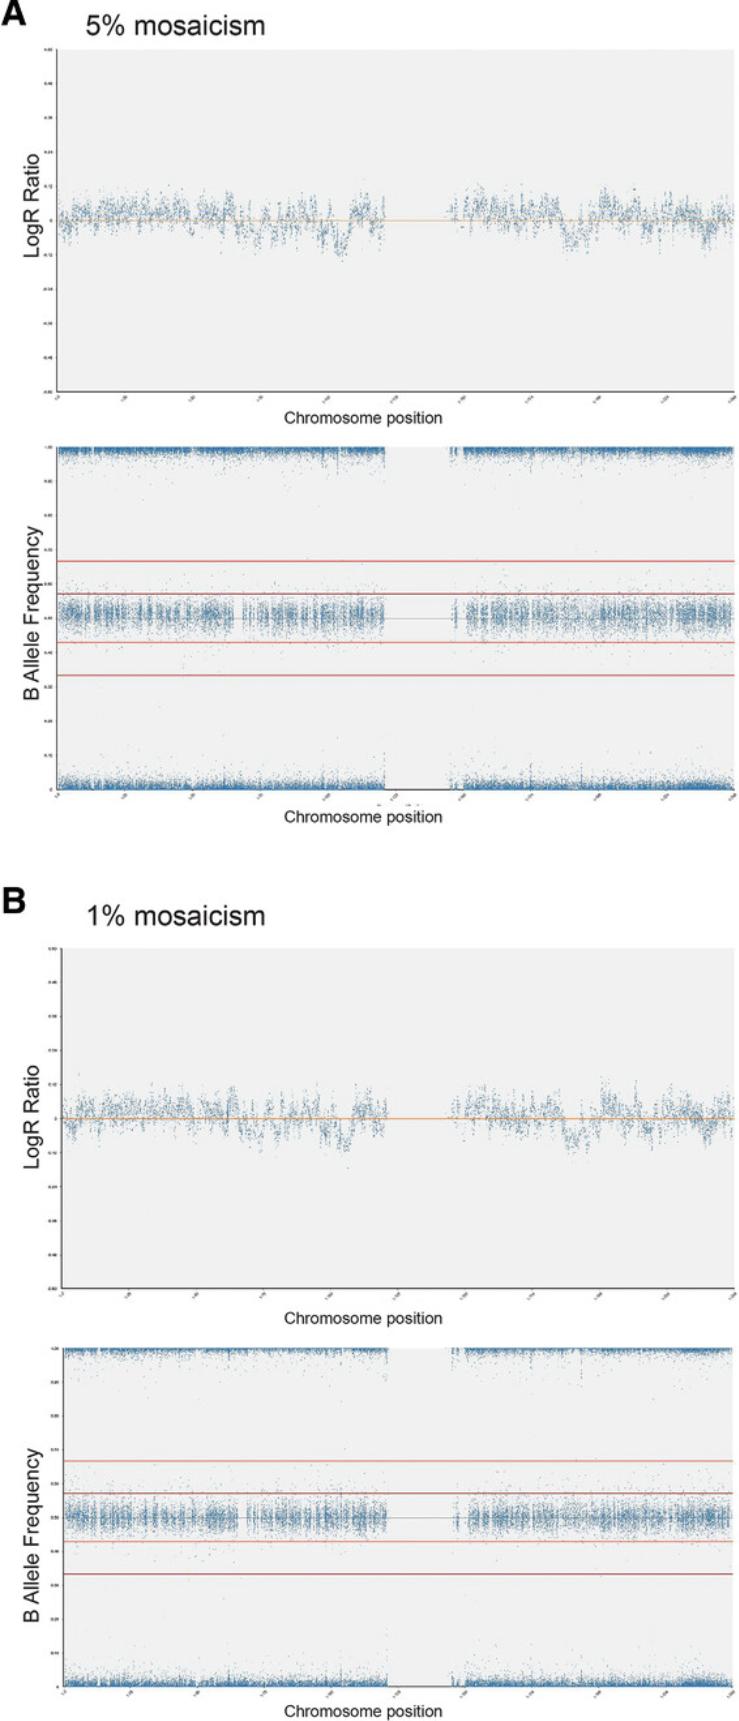
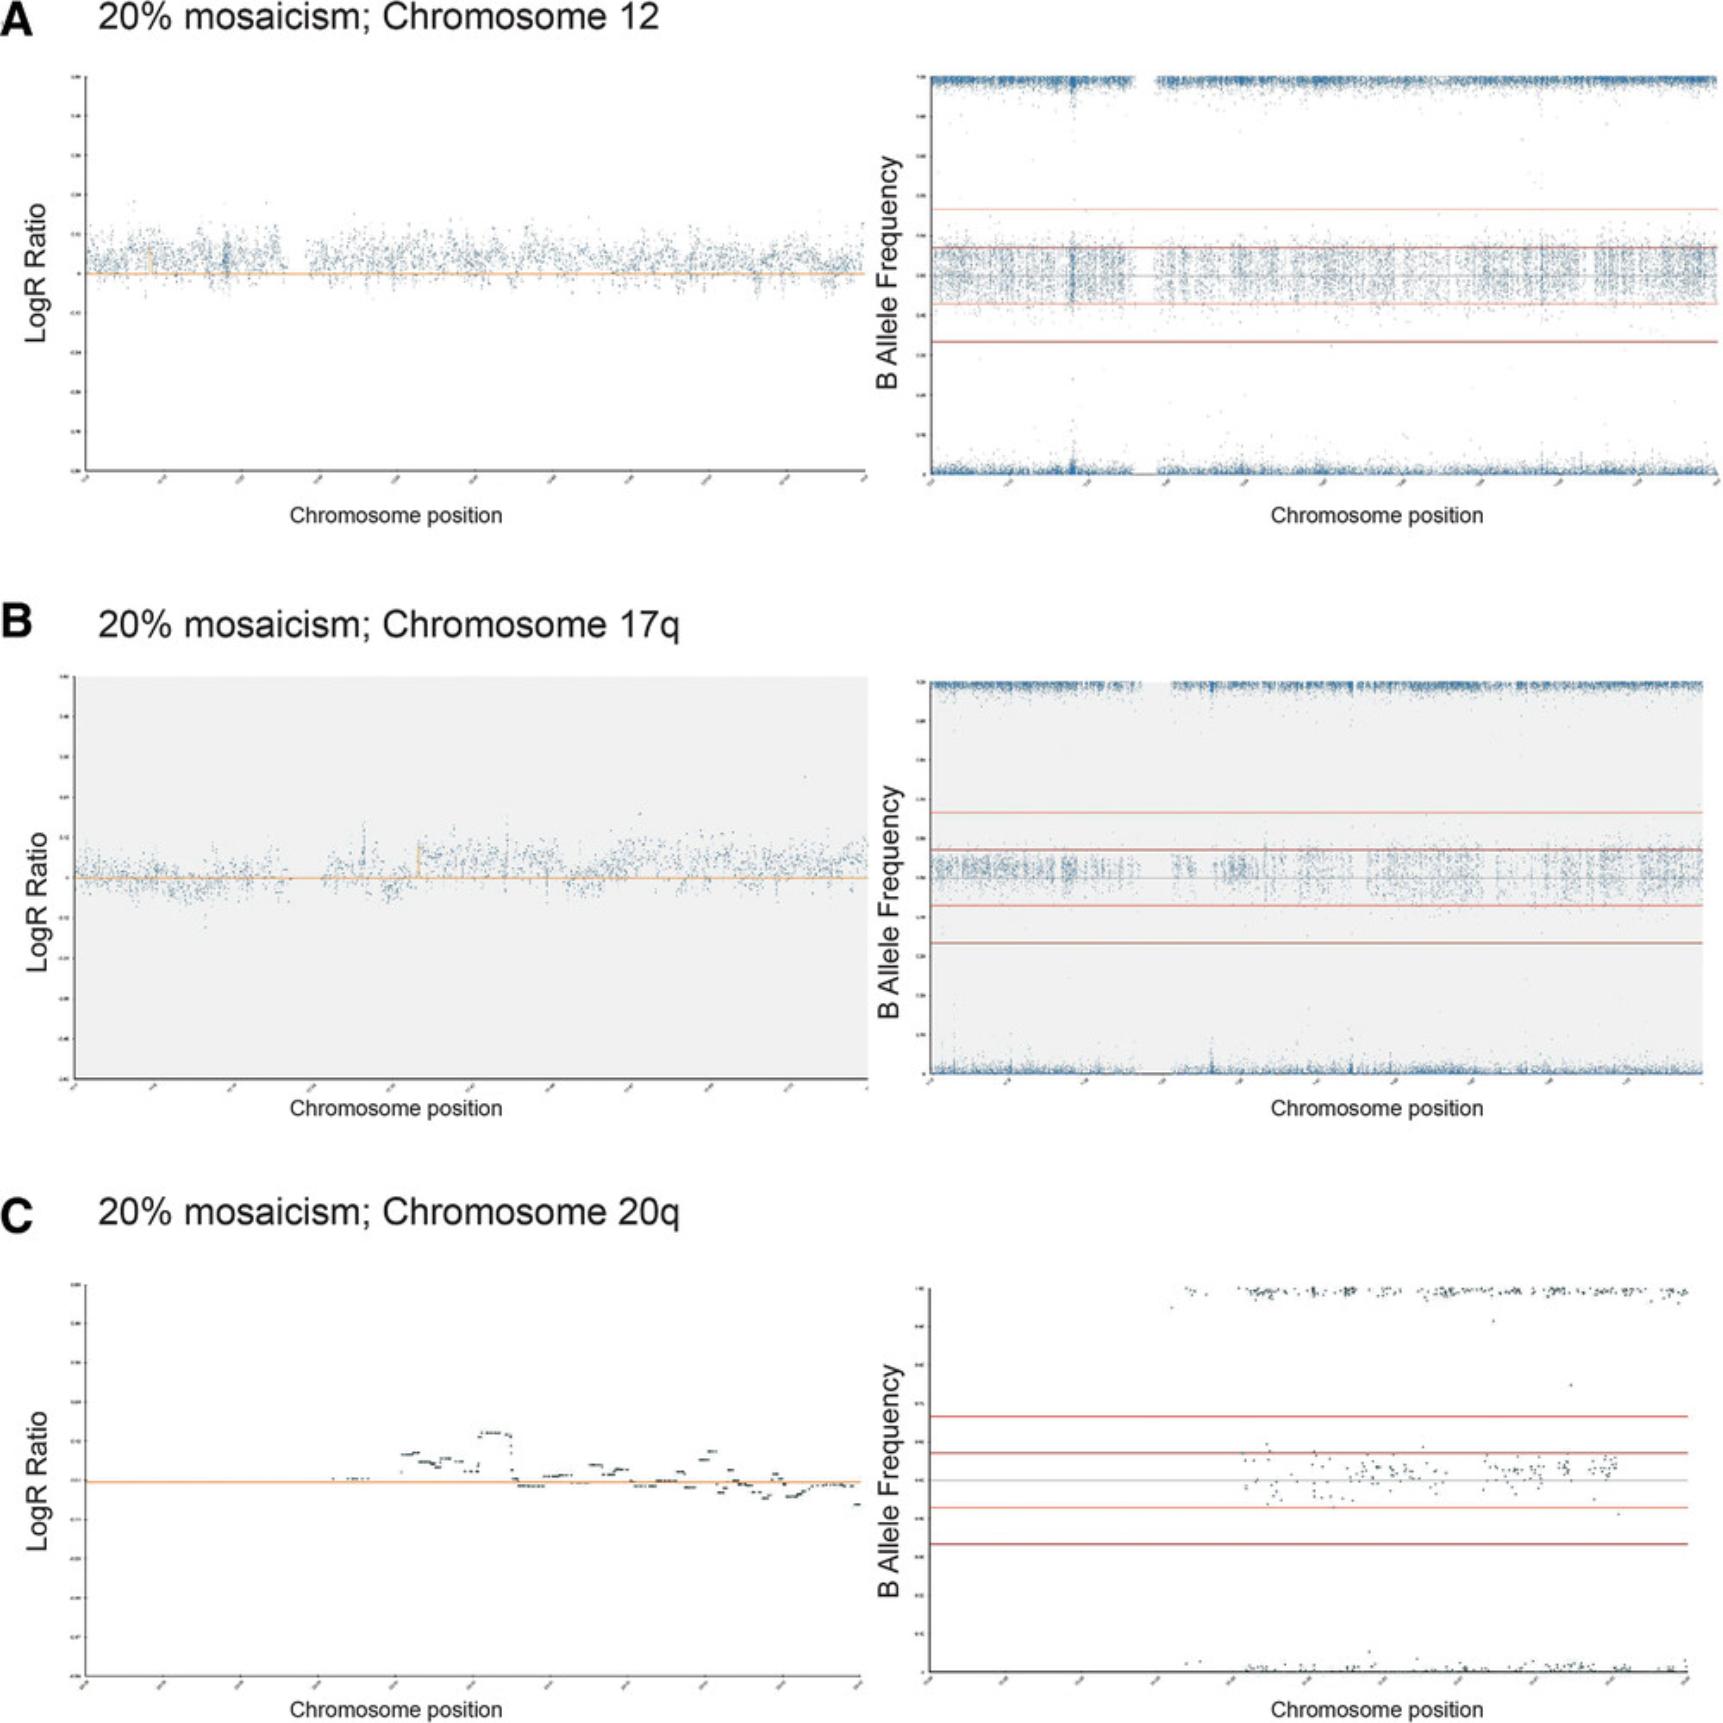
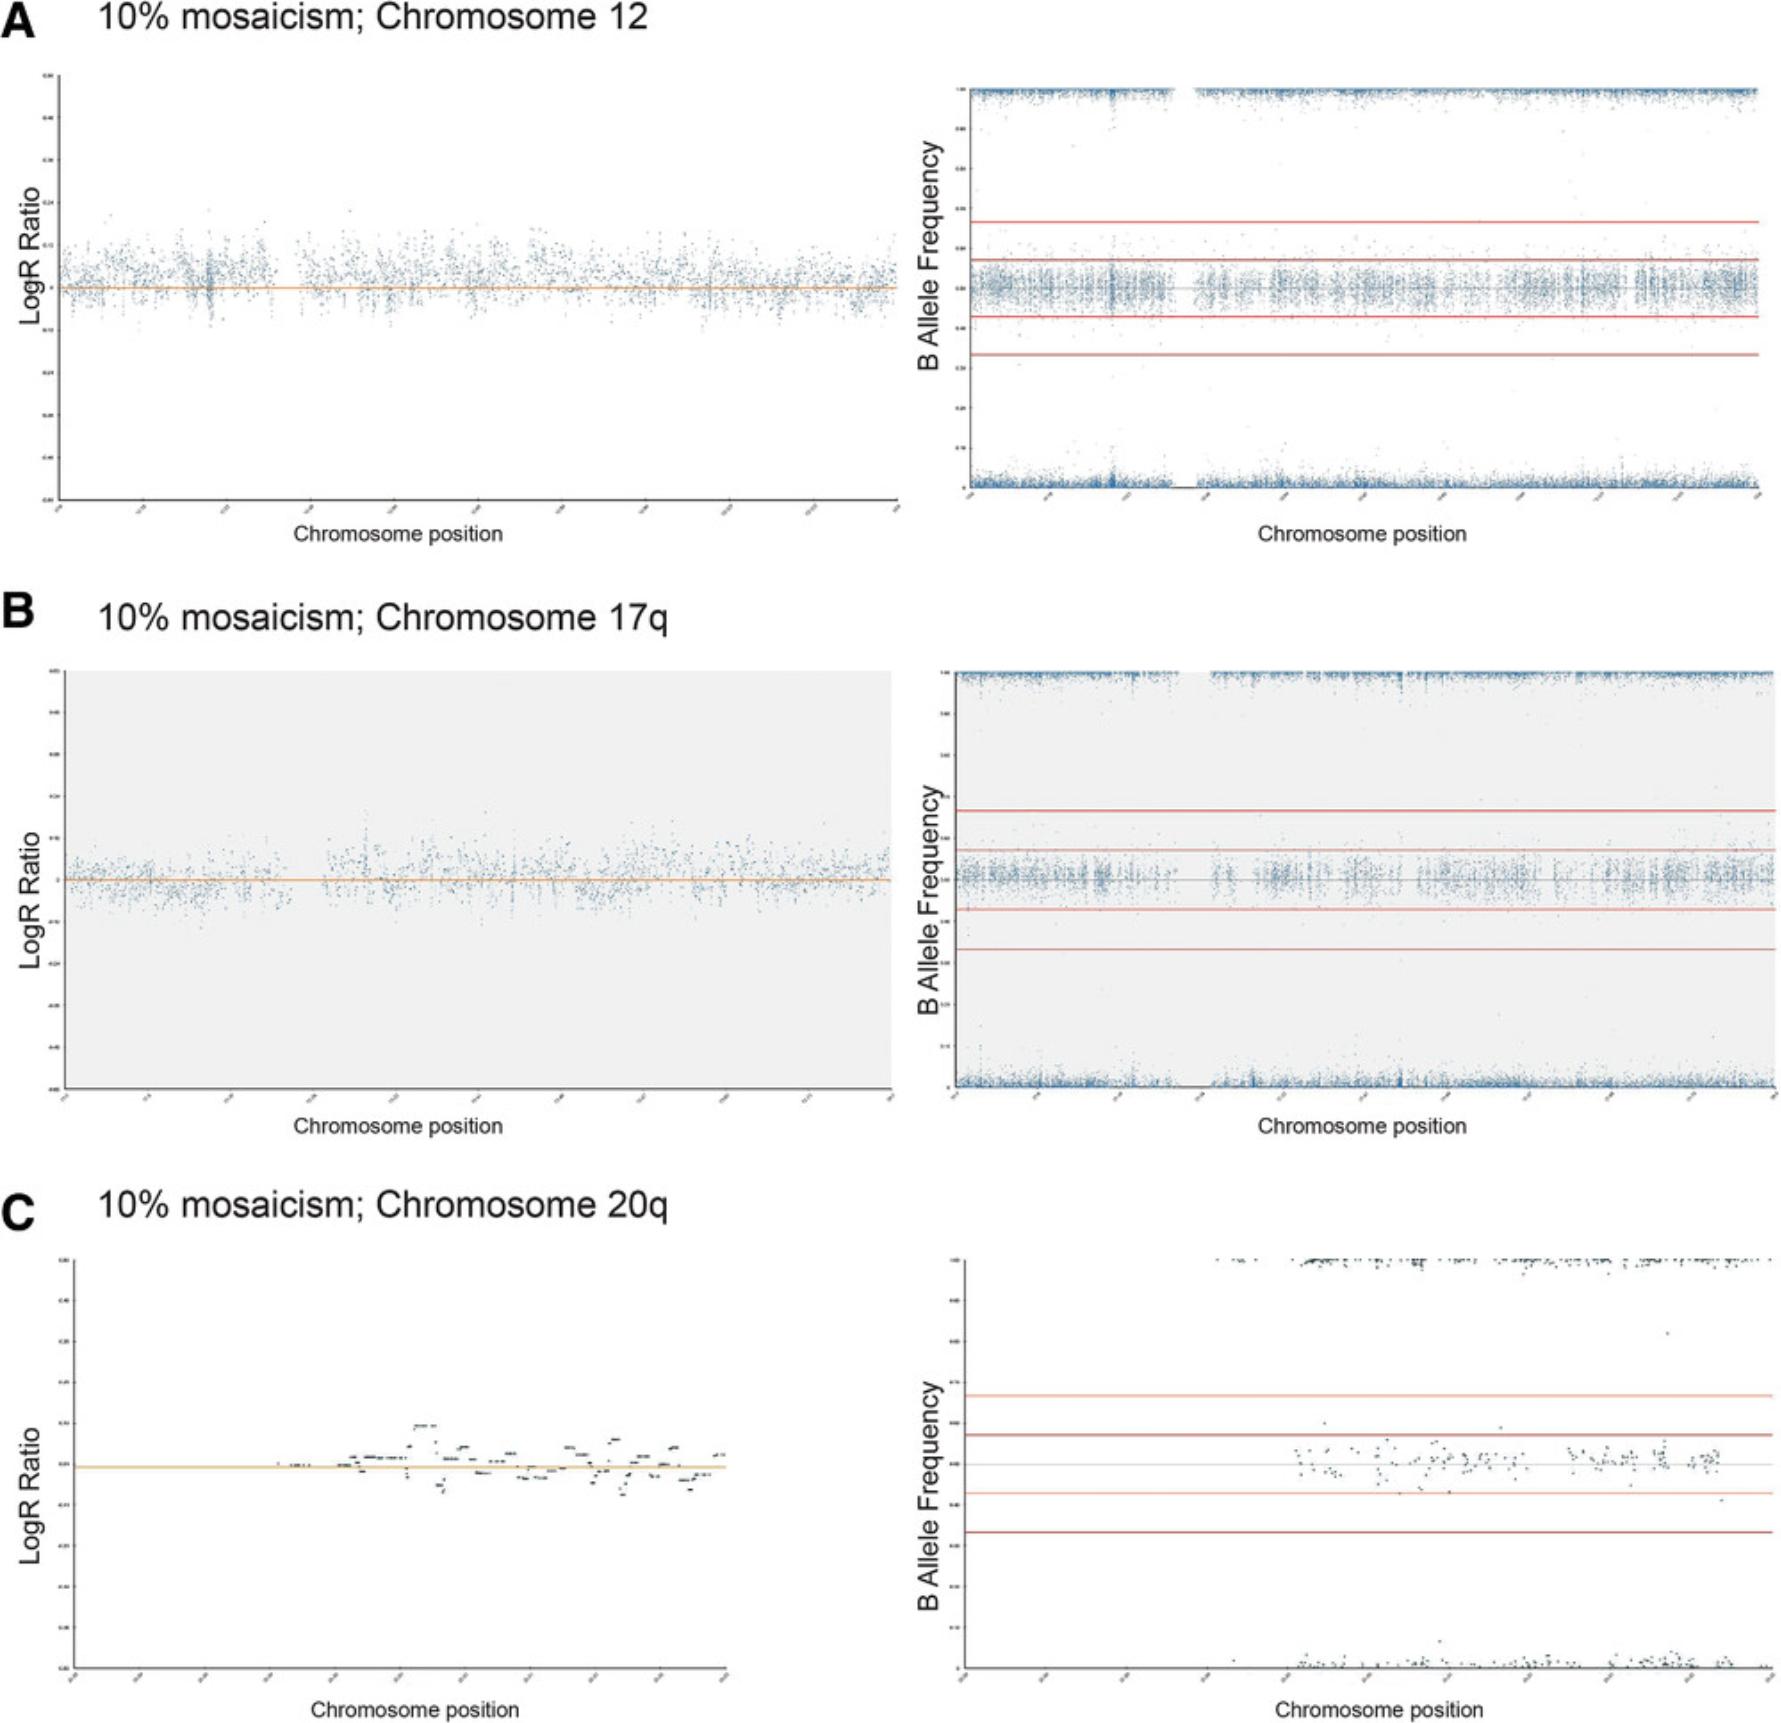
Here, we provide protocols for using SNP arrays to assess hPSC cultures (Basic Protocols 1 to 3). We show examples of the detection of commonly gained genetic changes in hPSC cultures, including an example where SNP arrays revealed a copy-number variant (CNV) that was not detected by G-banding. Moreover, we detail a protocol for assessment of the sensitivity of SNP arrays for detection of recurrent genetic changes in hPSC cultures (Support Protocol), and we show that mosaic genetic changes are not reliably detected by SNP arrays if variant DNA is present in <20% of the sample.
Basic Protocol 1: DNA SAMPLE PREPARATION FOR SNP ARRAYS
In this protocol, genomic DNA is extracted from cells, amplified to increase the quantity of DNA, and then labeled with fluorescent dyes. We describe PCR amplification and labeling of DNA using the InfiniumTM Cyto-SNP 850K DNA analysis kit, used according to the manufacturer's instructions.
Materials
- Growing hPSC culture
- DMEM/F12 (Sigma-Aldrich, cat. no. D6421-500 ML) or similar basal medium
- TrypLE Express (Thermo Fisher Scientific, cat. no. 11528856)
- Phosphate-buffered saline (PBS; Ca2+ and Mg2+ free; see recipe)
- Qiagen DNeasy Blood & Tissue Kit (Qiagen, cat. no. 69506), containing:
- Buffers AL, AW2, and AE
- DNeasy Mini spin column
- Collection tubes
- Ethanol, Absolute
- InfiniumTM Cyto-SNP 850K DNA analysis kit (kit contains reagents and bead chips; Illumina, cat. no. 20083589), containing:
- Multi-sample amplification mixes 1 and 2 (MA1 and MA2)
- Random primer mix (MSM)
- Fragmentation solution (FMS)
- Precipitation solution (PM1)
- Resuspension, hybridization, and wash solution (RA1; also cat. no. 11292441)
- Humidifying buffer (PB2; cat. no. 11191130)
- BeadChips
- Prepare BeadChip buffer 1 (PB1; also cat. no. 11292441; also available as buffer kit, cat. no. GT-201-1005)
- XStain BeadChip Solutions 1 to 4 (XC1 to XC4)
- Two-color extension master mix (TEM)
- Superior two-color master mix (STM)
- Anti-stain two-color master mix (ATM)
- 0.1 N sodium hydroxide (NaOH; see recipe)
- 100% 2-propanol
- 37°C incubator
- 15-ml conical centrifuge tubes
- Standard tabletop centrifuge
- Vortex
- Microcentrifuge
- 1.5-ml microcentrifuge tubes
- Qubit (Thermo Fisher Scientific, cat. no. Q33327) or similar fluorometer
- Hybridization oven
- 0.8-ml storage plate (midi plate), conical bottom
- Adhesive plate lids
- Microplate centrifuge
- Heat block
- Absorbent pad or paper towels
- Tube rack
- Heat sealer
- Foil heat seals
NOTE : Experiments involving PCR require extremely careful technique to prevent contamination, including use of nuclease-free pipet tips and personal protective equipment.
IMPORTANT NOTE : It is necessary to ensure that the pre-amplification and post-amplification processes (steps 18 to 31) are performed in separate laboratories with dedicated sets of instruments (including separate single-channel and multichannel pipets) maintained in each area or, if this is not possible, at separate workstations with dedicated instruments within the same lab.
Genomic DNA extraction
1.Remove culture medium from a growing hPSC culture.
2.Add 5 ml DMEM/F12 or similar basal medium. Swirl around and then remove medium.
3.Add 1 ml TrypLE Express and incubate cells for ≤4 min at 37°C.
4.Add 9 ml DMEM/F12 or similar basal medium to cells and gently pipet up and down a couple of times.
5.Transfer cell suspension into a 15-ml conical centrifuge tube and then pellet cells for 4 min at 270 × g at room temperature.
6.Carefully remove supernatant, taking care not to disturb the cell pellet.
7.Add 200 µl PBS to cell pellet and flick tube to resuspend the pellet.
8.Add 200 µl Buffer AL (from the Qiagen DNeasy Blood & Tissue Kit) and vortex to mix thoroughly.
9.Add 200 µl ethanol and vortex to mix thoroughly.
10.Transfer mixture into the DNeasy Mini spin column and then centrifuge 1 min at 6000 × g at room temperature in a microcentrifuge.
11.Remove DNeasy Mini spin column and discard collection tube, including the flow-through.
12.Place DNeasy Mini spin column into a fresh collection tube and then add 500 µl Buffer AW2 and spin down 3 min at 20,000 × g at room temperature.
13.Remove DNeasy Mini spin column and discard collection tube.
14.Place DNeasy Mini spin column into a 1.5-ml microcentrifuge tube.
15.Add 200 µl Buffer AE onto DNeasy Mini spin column and incubate column at room temperature for 1 min.
16.Centrifuge DNeasy Mini spin column for 1 min at 6000 × g to elute the DNA.
17.Quantify amount of DNA using Qubit or similar fluorometer.
Amplification of DNA
18.Preheat hybridization oven to 37°C.
19.Thaw MA1, MA2, and MSM reagents from the InfiniumTM Cyto-SNP 850K DNA analysis kit and allow them to reach room temperature. Once thawed, mix each solution by inverting it 10 times and briefly spin down.
20.Prepare multi-sample amplification (MSA) plate by pipetting 20 µl MA1 into an 0.8-ml storage plate.
21.Add 4 µl of DNA sample (diluted to 50 ng/µl) to the MSA plate.
22.Add 4 µl of 0.1 N NaOH to each well containing DNA.
23.Use an adhesive plate lid to seal MSA plate.
24.Mix contents of the wells by vortexing the plate at 1600 rpm for 1 min, followed by a brief centrifugation of 10 to 15 s at 280 × g in a microplate centrifuge.
25.Incubate plate at room temperature for 10 min.
26.Remove seal from the plate.
27.Transfer 68 µl MA2 to each well containing DNA sample.
28.Transfer 75 µl MSM to each well containing DNA sample.
29.Reseal plate with an adhesive plate lid.
30.Mix contents of the wells by vortexing the plate at 1600 rpm for 1 min, followed by a pulse centrifugation of 10 to 15 s at 280 × g.
31.Place sealed plate in the hybridization oven at 37°C for 20 to 24 hr.
DNA fragmentation
32.Pre-heat a heat block to 37°C.
33.Thaw FMS and bring it to room temperature. Once thawed, mix FMS solution by inverting the tube 10 times.
34.Take out plate from the hybridization oven and briefly spin down for 30 s at 280 × g.
35.Remove seal from the plate.
36.Transfer 50 µl FMS into each sample-containing well.
37.Seal plate using the original seal, placing it in the same orientation as previously applied.
38.Mix by vortexing plate for 1 min at 1600 rpm, followed by spinning for 5 s at 280 × g.
39.Place plate on the heat block at 37°C for 1 hr.
DNA precipitation
40.Bring PM1 to room temperature and invert it a few times to mix.
41.Cool down centrifuge to 4°C.
42.Transfer 100 µl PM1 to each sample well.
43.Seal and vortex plate (1600 rpm for 1 min).
44.Incubate plate on the heat block at 37°C for 5 min.
45.Pulse-centrifuge for 10 to 15 s at 280 × g.
46.Add 300 µl of 100% 2-propanol to each well.
47.Seal plate with a new, dry adhesive plate lid.
48.Invert plate 10 times to mix the contents of the wells.
49.Incubate plate at 4°C for 30 min and then centrifuge 20 min at 3000 × g , 4°C.
50.Remove seal from the plate and quickly invert plate over a sink or paper towels to remove the supernatant.
51.Remove excess liquid by blotting onto an adsorbent pad or paper towels.
52.Firmly tap inverted plate to decant the liquid from all wells.
53.Air-dry pellets by placing the inverted plate on a tube rack. Leave plate at room temperature for 1 hr.
54.Check that a blue pellet is present in each well containing a sample.
Resuspending the DNA
55.Preheat heat block to 95°C and hybridization oven to 48°C.
56.Preheat heat sealer for 10 min.
57.Transfer 46 µl RA1 to each well containing a DNA pellet and apply foil heat seal to the plate.
58.Roll heat sealer over the plate.
59.Place plate in the hybridization oven and incubate it at 48°C for 1 hr.
60.Vortex at 1800 rpm for 1 min followed by pulse-centrifugation for 10 to 15 s at 280 × g.
61.Repeat step 60 until pellets are fully resuspended.
Basic Protocol 2: SNP ARRAY HYBRIDIZATION, WASHING, AND SCANNING
This protocol describes hybridization of the samples (Basic Protocol 1) on SNP arrays, followed by extension/staining, washing of unhybridized or nonspecifically hybridized DNA, and, finally, scanning.
First, fragmented DNA samples hybridize to the BeadChips containing locus-specific 50-mers. BeadChips are then washed to prepare them for the staining process. The extension step of the protocol entails first washing away unhybridized or nonspecifically hybridized DNA fragments. The hybridized DNA fragments are then used as a template for single-base extension of the oligos on the BeadChips to incorporate fluorescent labels. Stained BeadChips are washed and coated to protect the fluorescent dyes. Finally, the BeadChips are scanned.
Additional Materials (also see Basic Protocol 1)
- MSA plate (see Basic Protocol 1)
- 95% formamide/1 mM EDTA (see recipe)
- 70% (v/v) ethanol
- Hybridization chambers
- Hybridization chamber gaskets
- Hybridization chamber inserts
- Vertical wash vessels
- Staining racks
- Te-Flow flow-through chambers (Tecan, cat. no. 760 800)
- Chamber rack
- Test tube rack
- Vacuum desiccator
- Scanners (e.g., NextSeq550 or iScan System)
Loading DNA onto BeadChips and hybridization
1.If previously frozen, thaw MSA plate and pulse-centrifuge for 10 to 15 s at 280 × g.
2.Preheat heat block to 95°C and hybridization oven to 48°C.
3.Denature DNA by incubating the plate at 95°C for 20 min.
4.While the plate is incubating, assemble hybridization chamber by placing the hybridization chamber gasket into the hybridization chamber.
5.Dispense 200 µl PB2 into top and bottom humidifying reservoir of the hybridization chamber and then place lid on the hybridization chamber to prevent evaporation.
6.When the 20-min incubation of the plate is over, remove plate from the heat block and let it cool down by leaving it at room temperature for 30 min. Pulse-centrifuge for 10 to 15 s at 280 × g.
7.Unpack BeadChips and then place them into a hybridization chamber insert, with the barcode ends aligning.
8.Remove seal from the plate and pipet 26 µl sample from plate onto the appropriate section of the BeadChip.
9.Allow DNA to disperse over the whole surface.
10.Inspect BeadChip for bubbles or areas not coated in liquid. If bubbles are present, try to remove them by gently agitating insert. If some areas are not coated in liquid, add leftover sample from MSA plate.
11.Place inserts into the hybridization chamber, taking care that the barcode of the chip is positioned over the barcode on the hybridization chamber.
12.Close lid of the chamber and secure it with four clasps.
13.Place hybridization chamber in the hybridization oven and incubate at 48°C for 16 to 24 hr.
Washing BeadChips
14.Prepare a vertical wash vessel and fill it with 310 ml PB1.
15.Insert a staining rack into the vertical wash vessel.
16.Remove hybridization chambers from the hybridization oven and allow to cool for 25 min.
17.Take BeadChips out of the hybridization chambers and remove seal. Quickly place them into staining rack in PB1, taking care that the BeadChips do not dry out.
18.Wash BeadChips thoroughly by lifting the staining rack up and down 10 times and then soaking the. BeadChips in PB1 for a further 5 min.
19.Repeat step 18 in a second, clean staining rack in PB1.
20.Assemble TE-Flow flow-through chambers and leave them in PB1 until ready to load into chamber rack.
Extending and staining BeadChips
21.Pre-heat chamber rack to 44°C and then place each TE-Flow flow-through chamber assembly on chamber rack.
22.Add 150 µl RA1 to flow-through chamber reservoir and incubate for 30 s. Repeat 5 times.
23.Add 450 µl blocking buffer (XC1) to flow-through assembly. Incubate for 10 min.
24.Add 450 µl equilibration buffer (XC2) and incubate for 5 min.
25.Add 200 µl TEM and incubate for 15 min.
26.Add 450 µl of 95% formamide/1 mM EDTA to flow-through assembly. Incubate for 1 min and then repeat addition and incubate for 5 min.
27.Add 450 µl wash buffer (XC3) and then drain assembly. Repeat this washing step twice.
28.Into the reservoir of each flow-through chamber, add 250 µl STM. Incubate for 10 min.
29.Add 450 µl XC3 and incubate for 1 min. Repeat addition and wait 5 min.
30.Add 250 µl ATM. Incubate for 10 min.
31.Add 450 µl XC3 and incubate for 1 min. Repeat this step once more.
32.Repeat steps 28 to 31.
33.Add 250 µl staining solution (STM). Incubate for 10 min.
34.Add 450 µl of 95% formamide/1 mM EDTA and incubate for 1 min. Repeat addition and incubate for 5 min.
35.Immediately remove flow-through chambers from the chamber rack and place at room temperature.
Washing and coating BeadChips
36.Prepare a vertical wash vessel and fill it with 310 ml PB1.
37.Insert a staining rack into the vertical wash vessel.
38.Take BeadChips from the TE-Flow flow-through chambers and place them into staining rack in PB1, taking care that the BeadChips do not dry out.
39.Wash BeadChips thoroughly by lifting the staining rack up and down 10 times and then soaking BeadChips in PB1 for a further 5 min.
40.While the BeadChips are soaking, prepare another vertical wash vessel and fill it with 310 ml XC4, taking care that the XC4 is used within 10 min.
41.Move staining rack with the BeadChips from the PB1-filled wash vessel to the XC4-filled wash vessel.
42.Wash BeadChips thoroughly by lifting the staining rack up and down 10 times and then soaking BeadChips in XC4 for a further 5 min.
43.Remove staining rack from the wash vessel and place it on a test tube rack in the horizontal position.
44.Transfer test tube rack with the horizontally- placed BeadChips into a vacuum desiccator.
45.Apply vacuum (≥675 mm Hg) for 50 to 55 min to dry BeadChips.
46.Wipe back of each BeadChip with a wipe sprayed with 70% ethanol.
Scanning BeadChips
47.Scan BeadChips using a scanner.
Basic Protocol 3: SNP ARRAY DATA ANALYSIS
SNP array analysis is carried out to examine the presence of gains or losses of genetic material in samples of interest from Basic Protocol 2.Our analysis is based on BlueFuse Multi v4.4 (BlueGnome) software. Analysis of each sample starts with the genome view, giving an overall view of the whole genome of each sample. This is used to assess the level of noise within the data and perform quality-control (QC) checks. For samples that pass QC checks, the analysis view is used to visualize the calls assigned by the software, using the karyotype chart and the CGH table. The karyotype view presents an ideogram with losses represented by red bars and gains by green bars, alongside the chromosomal region in which they arise. The CGH table lists the CNVs and gives details of the size and the chromosomal coordinates of its location.
Materials
- BlueFuse Multi (BlueGnome) software
1.Use BlueFuse Multi (BlueGnome) software to analyze sample data from Basic Protocol 2.
2.Use SNP report to check the QC metrics for the run, e.g., using the following metrics to check whether they fall within the acceptable range:
- a. SD autosome/Robust: measures amount of variation from the average. This parameter should be in the range of 0.05 to 0.11.
- b. DLR = derivative log ratio: measure of consistency or noise. This parameter should have a value of <0.2. Samples with a high DLR tend to have poor properties.
- c. Median LogR deviation: measures variation in the log ratio between adjacent SNPs. <0.30 = pass, <0.20 to call CNVs.
- d. Median call rate: median of the bin call rates. The value of this parameter should be >0.98.
Samples that do not pass QC should not be analyzed. To improve quality, try running a higher concentration of DNA or re-extracting DNA from a fresh sample. DNA quality should be checked prior to analysis using, for example, a Qubit fluorometer.
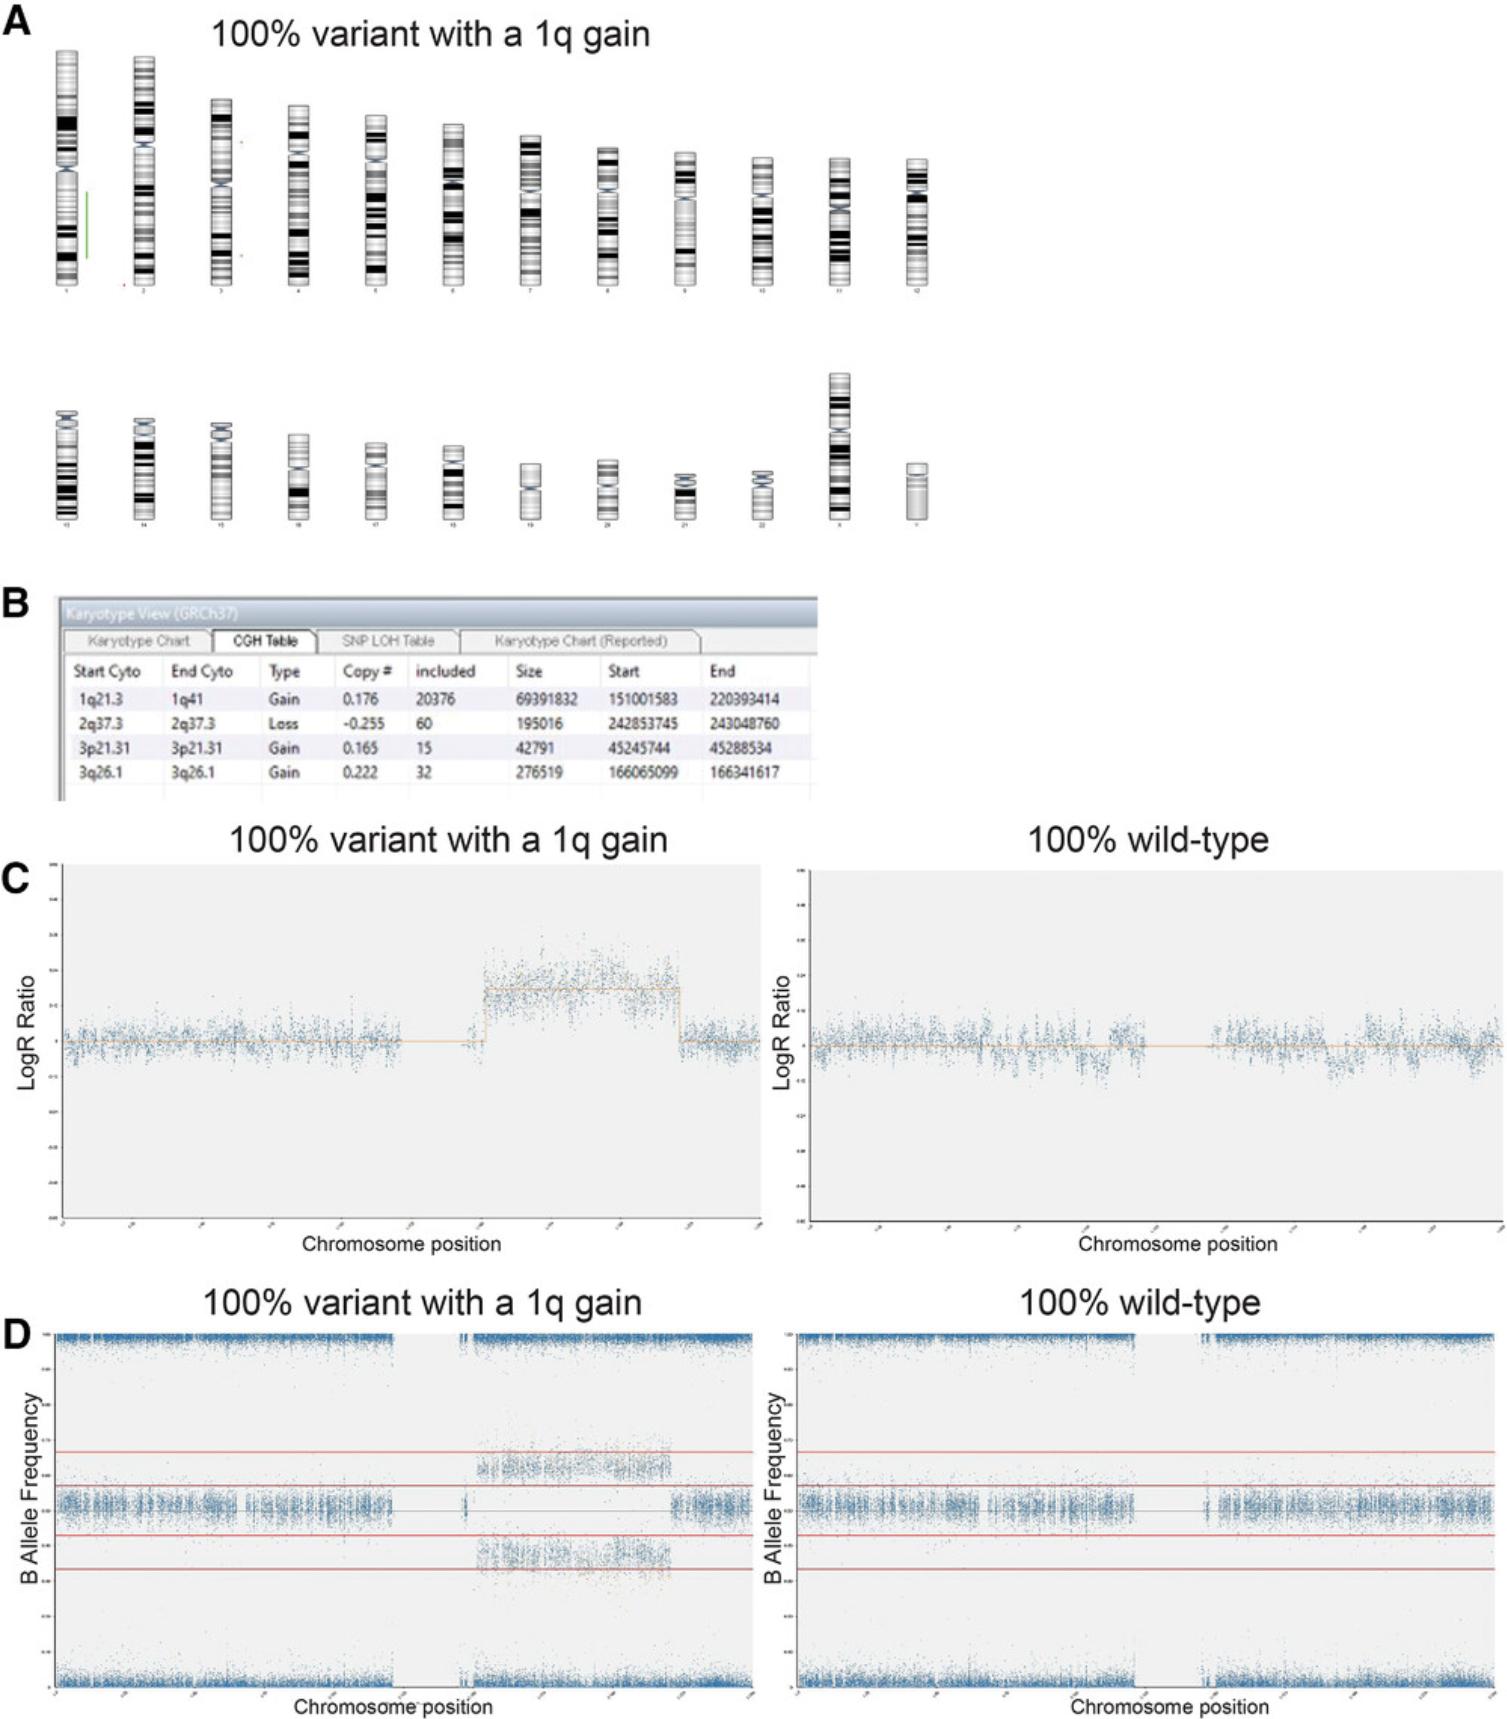
3.Use analysis view to check calls in karyotype view using the karyotype chart (Fig. 1A) and comparative genomic hybridization (CGH) table (Fig. 1B).
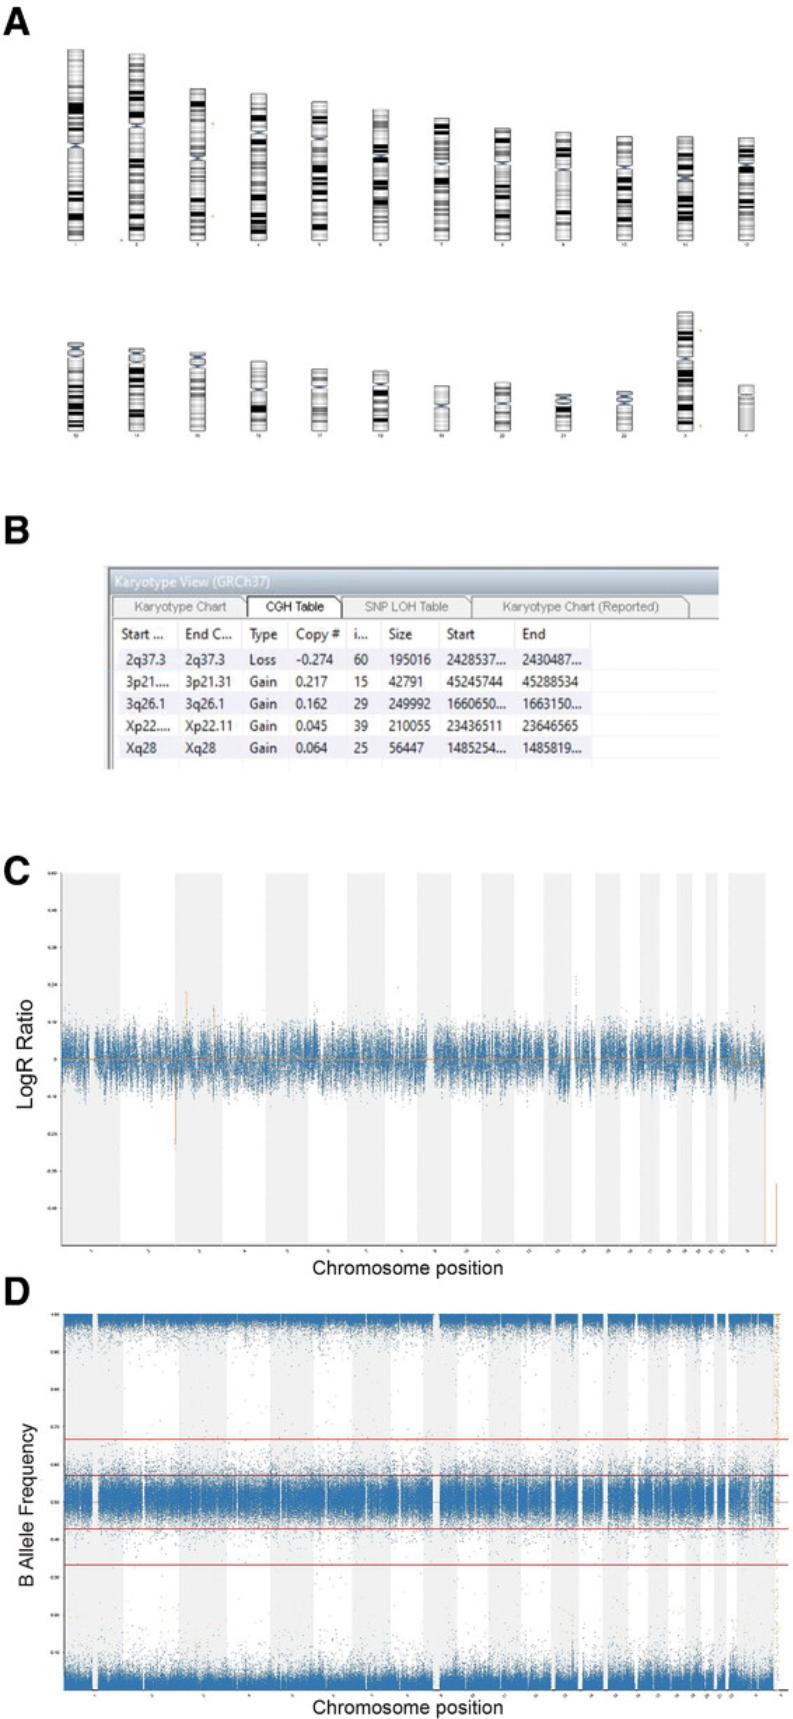
4.Check LogR ratio track (Fig. 1C) and BAF chart (Fig. 1D) to identify any potential CNVs. Zoom into regions with potential CNVs for a closer look.
5.Analyze each call identified by software in turn by clicking on the call region on the CGH table and inspecting the LogR ratio track (Fig. 2A) and BAF chart (Fig. 2B).
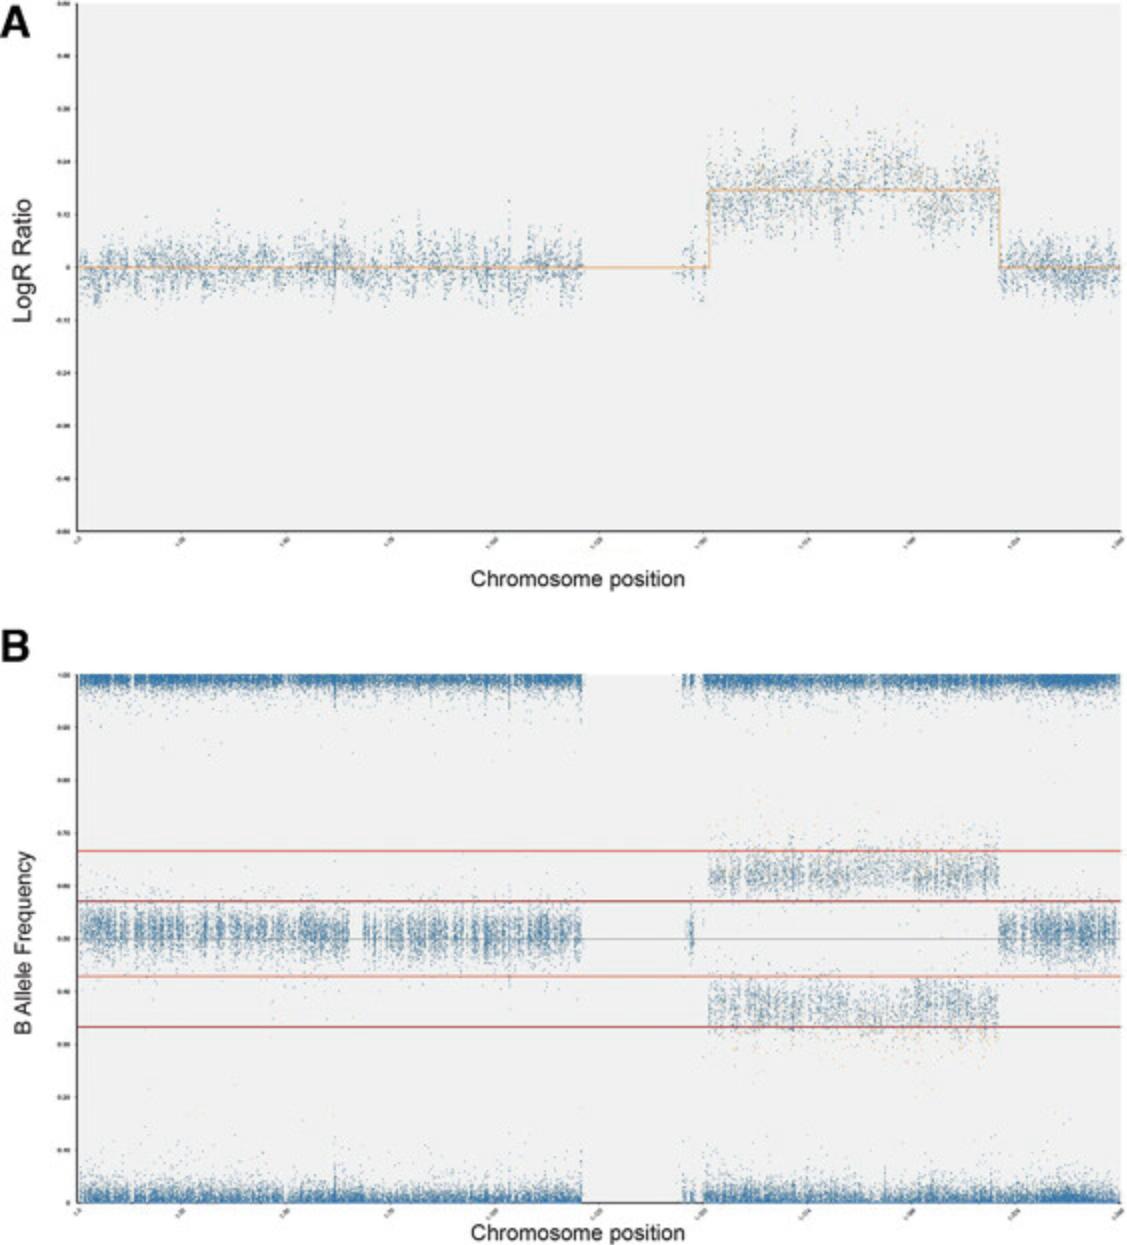
6.Determine if each call is real by assessing the following questions:
-
Do the SNPs have a BAF value that agrees with a gain or loss of copy number?
-
Are there enough SNPs in the region? Zoom in to highlighted region. Count number of SNPs. Note that 7 SNPs are required for a real call.
7.Check for normal variation.
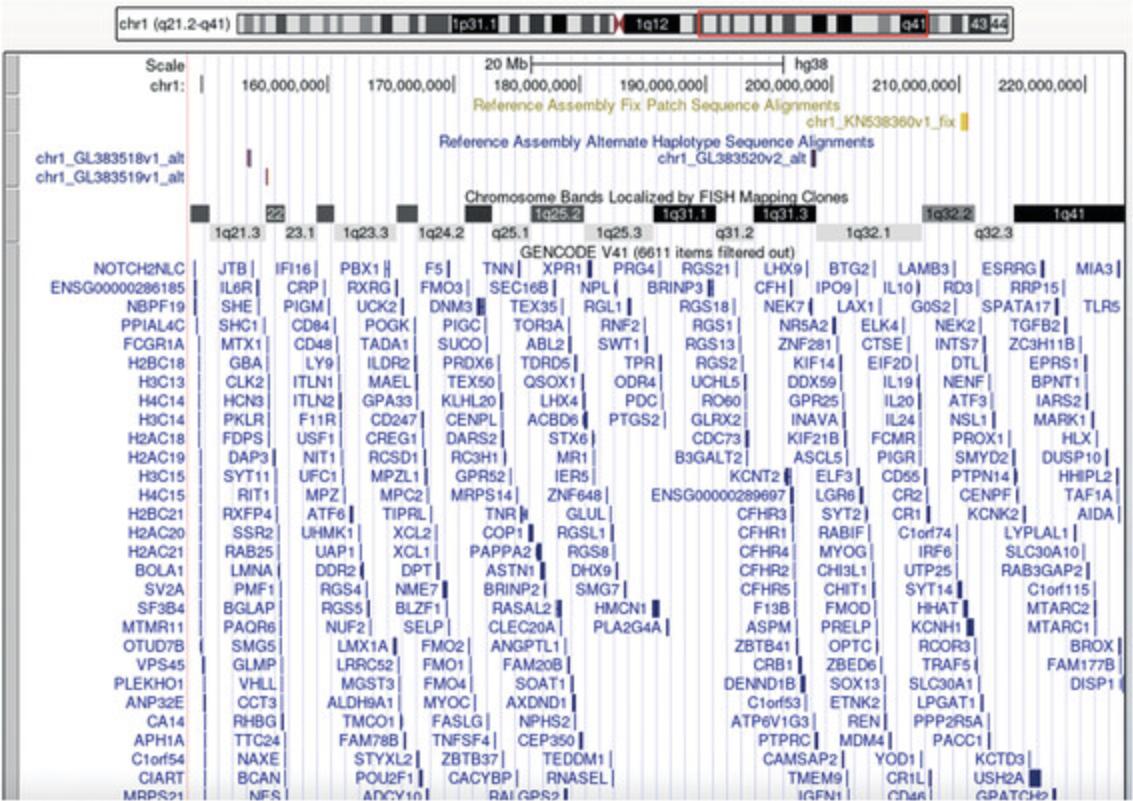
8.Assess any calls using inbuilt decision tracks. Obtain information about genes present in the regions gained or lost using the UCSC genome browser (Fig. 3).
Support Protocol: ASSESSMENT OF SNP ARRAY SENSITIVITY FOR DETECTION OF MOSAICISM
When using a method for detection of genetic changes, it is critical to know the sensitivity of the method, i.e., the ability to detect genetic changes when they are present at a low level of mosaicism in culture. The Support Protocol details the assessment of SNP array sensitivity for detection of mosaicism in hPSC cultures. Preparing mosaic samples with defined percentages of variant cells requires extraction of genomic DNA from pure populations of wild-type and variant cells and then mixing these populations to obtain increasing percentages of variant cells.
Materials
- See Basic Protocols 1 to 3.
Preparing mosaic samples with defined percentages of variant hPSCs
1.Extract genomic DNA from a culture that is 100% diploid and 100% variant (e.g., as determined on parallel cultures by G-banding or another suitable whole-genome method), processing samples for genomic DNA extraction using the protocol outlined in Basic Protocol 1.
2.Mix genomic DNA of wild-type and variant cells to obtain the following percentages of variant cells in the mosaic sample: 1%, 5%, 10%, 20%, and 30%.
3.Process samples for SNP arrays using the protocols outlined in Basic Protocols 1 and 2.
Data analysis for mosaic samples
4.Using Basic Protocol 3, analyze 100% variant and 100% wild-type diploid samples first to give a baseline of any common SNPs that are markers of each cell line (Fig. 6A to 6D).
REAGENTS AND SOLUTIONS
95% formamide/1 mM EDTA
- Add 7.0 ml of 20 mM EDTA solution (99.0-101.0% titration; Sigma-Aldrich, cat. no. E5134-250G) to a clean bottle. Add 133.0 ml of 100% formamide (BioUltra, for molecular biology; Sigma-Aldrich, cat. no. 47671-250 ml-F) and mix well. Divide into 4.0-ml aliquots into pre-labeled Bijou bottles. Store ≤6 months at −20°C.
NOTE: The molecular-grade water is sourced from a water purifier. Make sure that you are using a purifier that dispenses water at 18.2 MΩ (molecular biology grade).
Phosphate-buffered saline (PBS)
- Add 10 PBS tablets from VWR or 5 PBS tablets from Sigma (Ca2+ and Mg2+ free) to 1000 ml deionized distilled water. Pour into sterile plastic universal containers and autoclave. Store indefinitely at 4°C.
Sodium hydroxide (NaOH), 0.1 N
- Add 1.485 µl molecular-grade water to a 1.5-ml PCR-grade Eppendorf tube. Add 15 µl stock 10 M NaOH solution (BioUltra, for molecular biology; Sigma-Aldrich, cat. no. 72068-100 ML). Mix well and store at 4°C. Prepare fresh immediately before use or prepare large batches and aliquot into 1-ml sealed tubes, which can be stored ≤1 year at 2° to 8°C. Aliquots must be opened and used on the same day.
NOTE: The molecular-grade water is sourced from a water purifier. Make sure that you are using a purifier that dispenses water at 18.2 MΩ (molecular biology grade).
COMMENTARY
Background Information
The chromosomal changes seen in hPSCs in culture are acquired, meaning that cultures can harbor variants whose mosaicism level may change over time (Avery et al., 2013; Draper et al., 2004; Olariu et al., 2010; Price et al., 2021). If a variant confers growth advantages, cells that harbor the culture-acquired variant will start to overtake the culture, whereas cells with a normal genotype or with variants that confer less advantageous traits will be lost during passaging. It is therefore important to identify abnormalities as early as possible, as they will dominate the culture with continued maintenance (Andrews et al., 2017). Previous studies have demonstrated that, once these abnormalities are acquired, variant hPSCs with recurrent genetic changes take over cultures relatively rapidly, often within 5 to 10 passages during routine maintenance (Avery et al., 2013; Olariu et al., 2010). Significant bottlenecks, such as single-cell cloning of hPSCs, also allow rapid takeover by variants as wild-type cells undergo excessive apoptosis (Barbaric et al., 2014). Thus, although there are currently no standardized guidelines for timelines and frequency of testing of hPSCs, based on empirical observations of variant takeover, a reasonable regimen may entail testing cultures every 10 passages or after significant bottlenecks in culture. Apart from the frequency of testing, critical to the early detection of variants is the sensitivity of the method used for screening of hPSC cultures.
The current gold-standard method for monitoring hPSC cultures for the presence of genetic changes is karyotyping by Giemsa staining (referred to as G-banding karyotyping or simply karyotyping). Karyotyping allows for examination of the entire genome in a single assay, but it has a relatively low resolution of around 5 to 10 Mb, depending on the quality of the preparation (Baker et al., 2016; Shaffer, McGowan-Jordan, & Schmid, 2013). This low resolution of karyotyping means that it can detect the common aneuploidies seen in stem cells but cannot detect sub-chromosomal changes (Baker et al., 2016; Laurent et al., 2011; Shaffer, McGowan-Jordan, & Schmid, 2013). Karyotyping also suffers from limited sensitivity in detecting low-grade mosaicism (Baker et al., 2016; Hook, 1977). For example, examining 30 cells can exclude a 10% variant, whereas examination of 50 cells is needed to exclude 6% mosaicism with 95% confidence. To detect mosaicism at 1% with this level of confidence, more than 500 cells would need to be scored (Baker et al., 2016; Hook, 1977). Given the time required for scoring each metaphase cell, this level of throughput is simply not possible for routine screening of hPSC cultures.
Fluorescent in situ hybridization (FISH) can detect small duplications and deletions with a resolution of around 50 to 100 kb (Wiegant et al., 1991). FISH can also be carried out on interphase cells, making it more rapid than karyotyping. However, it is a targeted method, so it cannot be used to screen the entire genome for the presence of aberrations. In its routinely used form, FISH does have greater sensitivity for detecting mosaicism than karyotyping. For example, analysis of 100 cells with a large karyotypic abnormality by FISH can exclude 5% mosaicism (Baker et al., 2016). Both FISH and karyotyping require expert cytogenetic analysis to be carried out, which requires a lot of training. This can hamper the frequency of testing, and there is also an element of human error associated with it.
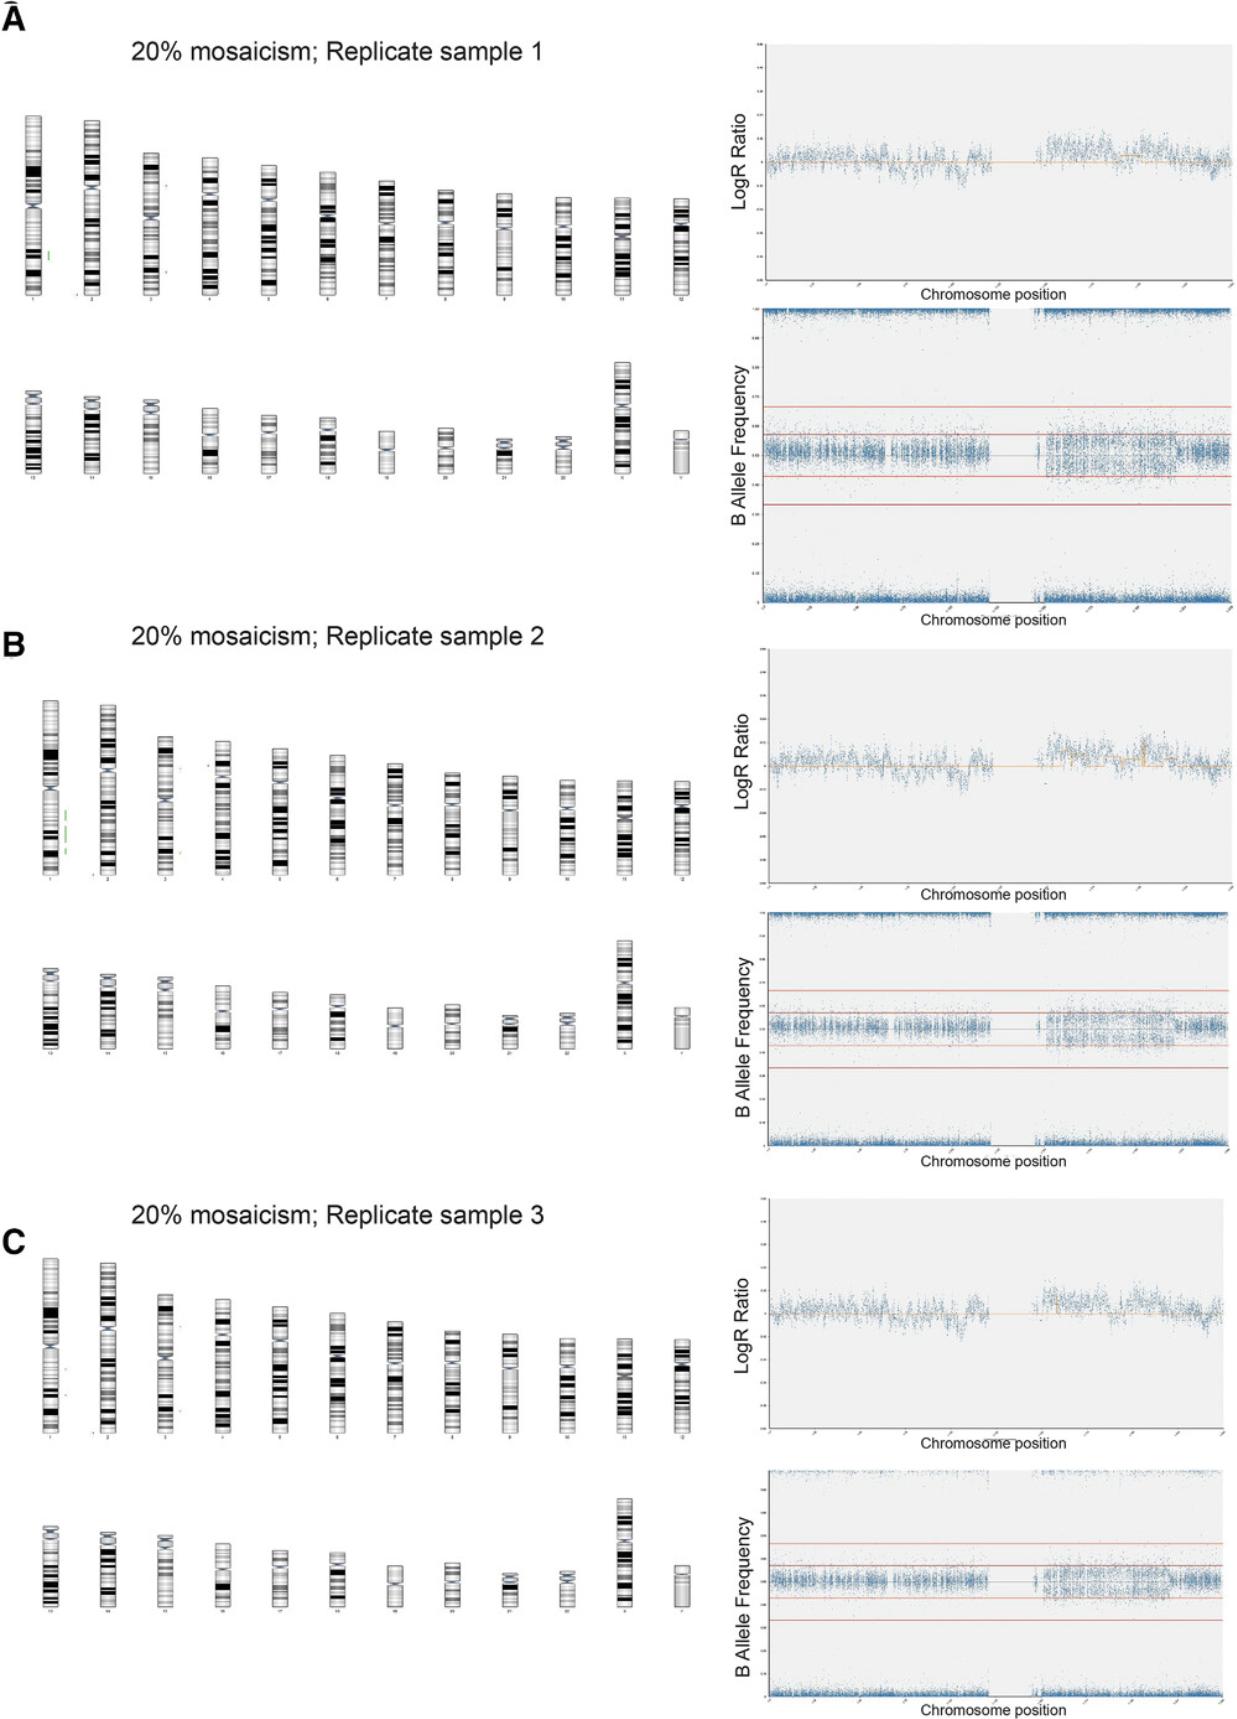
Alternatively, molecular array–based methods, such as SNP arrays, can be used as genome-wide screens for assessment of hPSC lines (Amps et al., 2011; Laurent et al., 2011). The SNP array method is a valid alternative to karyotyping insofar as it allows assessment of the entire genome, but with a much higher resolution, and testing can be carried out on a comparable number of cells as that required for G-band karyotype analysis (Josephson et al., 2006). The International Stem Cell Initiative used SNP array–based analysis to study over 100 hPSC lines and identified the 20q11.21 gain, which is <0.5 Mb in size, in >40% of lines that had been assessed as karyotypically normal (Amps et al., 2011). SNP arrays are also beneficial compared to karyotyping or FISH due to the more objective analysis methods used and are comparatively less costly (Table 1). As shown in examples in the Support Protocol, SNP arrays can confidently identify variants once they represent 20% of the total sample, although enough variation to warrant further investigation is typically seen at 10% mosaicism. Following the SNP array analysis, confirmation of suspect regions can be carried out on already-extracted DNA from cells by targeted methods. For example, quantitative or digital PCR enables a relatively cheap and quick interrogation of targeted sites of interest, with a sensitivity of around 10% to 20%, depending on the nature of the genetic change implicated (Baker et al., 2016; see Current Protocols article: Laing et al., 2019).
| Stage | Karyotyping | FISH | SNP array | ddPCRb |
|---|---|---|---|---|
| Booking/Receiving samples in lab | $13 | N/A (follow-up to previous test) | $13 | N/A (follow-up to previous test) |
| Culturing* | $100 (*Cells can be sent confluent and ready for harvesting) | N/A | ||
| DNA extraction* | N/A | $20 (*DNA can be received already extracted) | ||
| Laboratory consumables required for test (per sample) | $150 | $170 | $145 | $54 |
| Analysis (calculated as average time taken by two relevant members of staff × wage/hour) | $54 | $18 | $33 | $26 |
| Estimated total laboratory cost | $348 ($250 if no culturing required) | $278 | $323 ($304 if no DNA extraction required) | $125 |
| Genome screen method followed by targeted confirmation | $627 ($528 without culturing) | $448 ($429 without DNA extraction) |
- aNote that costs do not include equipment/software costs or any service agreements/maintenance associated with them. The analysis time is calculated based on the average time taken for analysis of a sample; complex cases would take longer for both karyotyping and SNP array. Values in this table are based on costs at the Sheffield Diagnostic Genetics Service at the Sheffield Children's NHS Foundation Trust (Sheffield, UK). Prices listed in the table have been converted from Pound Sterling to US Dollars and rounded.
- bddPCR, droplet digital PCR.
Critical Parameters
There are several steps within these protocols that are critical. In Basic Protocol 1, DNA must be of an appropriate concentration in order for genetic abnormalities to be identified. If the DNA concentration is <60 ng/µl, then the DNA sample should be run neat, whereas DNA with a concentration >300 ng/µl should be diluted 1:4 with molecular-grade water and re-quantified. DNA with a concentration <15 ng/µl should not be used, as it will fail QC testing.
It is also necessary to ensure that pre-amplification and post-amplification processes (Basic Protocol 1) are performed in separate laboratories with dedicated sets of instruments maintained in each area, or at the very least at separate benches with dedicated sets of equipment.
Particular attention should be paid to the storage of reagents and samples, as many of these are temperature sensitive. Incubation temperatures are also important; otherwise, samples are likely to fail QC. For example, when the extension and stain steps are carried out in Basic Protocol 2, the temperature of the BeadChips must be 44°C ± 0.5°C and 32°C ± 0.5°C, respectively.
Furthermore, thorough mixing of reagents and samples is necessary to ensure a good yield of DNA and in turn good hybridization to BeadChips (Basic Protocol 2). Additionally, all equipment should be correctly calibrated and serviced regularly, in particular pipets and the hybridization oven.
The removal of the glass plates from the BeadChips in the TE-Flow flow-through chambers (Basic Protocol 2) must be done quickly, without the BeadChips drying out and the spacers dragging across the surface of the chip. Drying of the chips leads to poor QC, and damage will result in no signal in that area.
Troubleshooting
Common problems with the protocols, their causes, and potential solutions are listed in Table 2.
| Problem | Possible cause | Solution |
|---|---|---|
| No pellet observed after centrifugation (DNA precipitation; Basic Protocol 1, step 49) | Original DNA sample degraded | Invert several times and repeat centrifugation step. If no pellet appears, DNA may be degraded. Repeat DNA amplification. |
| Precipitation reaction solution not mixed thoroughly before centrifugation |
Check that complete mixing has occurred before centrifugation. |
|
| Either PM1 or 2-propanol not added correctly | Add required reagents. Invert plate several times and repeat centrifugation step. | |
|
Pellet not dissolved after vortexing (DNA resuspension; Basic Protocol 1, step 60) |
Vortex speed too low | Check speed setting and readjust if required. Re-vortex at 1800 rpm for 1 min. |
| Incubation of reaction plate too short | Incubate for further 30 min. Ensure that plate is properly sealed to prevent any sample evaporation. | |
| Insufficient reagent | Reagents not spun down after thawing and before use |
Spin down again. |
| Pipet set incorrectly | Check pipette calibration and recalibrate pipets annually. | |
|
BeadChips still wet after 55 min in vacuum desiccator (washing and coating BeadChips; Basic Protocol 2, step 44) |
BeadChips must be dried for longer period |
Dry BeadChips for longer in desiccator. Note lab temperature and humidity can affect drying time. |
| XC4 may be old | Replace with fresh XC4. | |
| Scanning did not generate any signal | May be due to failures in experiment | Repeat experiment. Check that staining controls are generating signal. |
| Small number of SNPs called | Genomic DNA used is of insufficient quality or quantity | Obtain good-quality DNA before re-doing protocols. |
| Issues with DNA fragmentation, hybridization, or labeling | Ensure that all reagents are used and stored according to manufacturer's instructions. | |
| Issues with scanning | Re-scan BeadChips. |
Understanding Results
When interpreting results from SNP arrays (Basic Protocol 3), it is important to appreciate the limitations of this technique. For example, as SNP arrays detect genomic imbalances, they cannot detect balanced genomic rearrangements, such as balanced translocations or inversions. Detection of such aberrations would require a different method, such as karyotyping by G-banding or FISH. Moreover, single-nucleotide variants are also undetectable by SNP arrays and require different detection techniques, such as sequencing-based methods. Finally, as outlined in this article, another critical parameter for understanding results is the sensitivity of detection (Support Protocol). By performing experiments mixing wild-type and variant hPSCs with known genetic aberrations, we showed that SNP arrays identify mosaicism in samples only once they contain 20% variants. As a corollary, any samples detected as “wild-type” based on SNP arrays could still contain up to 20% variants.
Time Considerations
The whole set of protocols takes ≥4 days to complete. The suggested timeline is as follows:
Day 1 : Genomic DNA extraction (1 hr) and DNA amplification (2 hr plus 20 to 24 hr of incubation) (Basic Protocol 1).
Day 2 : DNA fragmentation (1.5 hr), DNA precipitation (2 hr), and hybridization (2 hr plus 16 to 24 hr of incubation) (Basic Protocols 1 and 2).
Day 3 : Extending/staining (4 hr), washing/coating (1.5 hr), and scanning (Basic Protocol 2).
Day 4 : Data analysis (the time required depends on the numbers of samples and putative CNVs identified) (Basic Protocol 3).
The Support Protocol follows the same timeline as the basic protocols but uses additional (mosaic) samples with known ratios of variant cells.
Acknowledgments
SNP array wet work was performed at NE&Y GLH Newcastle. This work was partly funded by the UK Regenerative Medicine Platform, MRC reference MR/R015724/1, and partly by the European Union's Horizon 2020 research and innovation program under grant agreement no. 668724.
Author Contributions
Ivana Barbaric : Conceptualization, Funding acquisition, Investigation, Project administration, Supervision, Writing – original draft, Writing – review and editing. Victoria Steventon : Data curation, Formal analysis, Investigation, Methodology, Writing – original draft, Writing – review and editing. Dylan Stavish : Data curation, Methodology, Writing – review and editing. Jason A. Halliwell : Data curation, Writing – review and editing. Duncan Baker : Data curation, Investigation, Methodology, Writing – review and editing.
Conflict of Interest
The authors declare no conflict of interest.
Open Research
Data Availability Statement
The data that support the findings of this article are available from the corresponding author upon reasonable request.
Literature Cited
- Aflatoonian, B., Ruban, L., Shamsuddin, S., Baker, D., Andrews, P., & Moore, H. (2010). Generation of Sheffield (Shef) human embryonic stem cell lines using a microdrop culture system. In Vitro Cellular & Developmental Biology Animal, 46(3-4), 236–241. doi: 10.1007/s11626-010-9294-2
- Andrews, P. W., Ben-David, U., Benvenisty, N., Coffey, P., Eggan, K., Knowles, B. B., … Stacey, G. N. (2017). Assessing the safety of human pluripotent stem cells and their derivatives for clinical applications. Stem Cell Reports , 9(1), 1–4. doi: 10.1016/j.stemcr.2017.05.029
- Amps, K., Andrews, P. W., Anyfantis, G., Armstrong, L., Avery, S., Baharvand, H., … Zhou, Q. (2011). Screening ethnically diverse human embryonic stem cells identifies a chromosome 20 minimal amplicon conferring growth advantage. Nature Biotechnology , 29(12), 1132–1144. doi: 10.1038/nbt.2051
- Avery, S., Hirst, A. J., Baker, D., Lim, C. Y., Alagaratnam, S., Skotheim, R. I., … Knowles, B. B. (2013). BCL-XL mediates the strong selective advantage of a 20q11.21 amplification commonly found in human embryonic stem cell cultures. Stem Cell Reports , 1(5), 379–386. doi: 10.1016/j.stemcr.2013.10.005
- Baker, D., Harrison, N. J., Maltby, E., Smith, K., Moore, H. D., Shaw, P. J., … Andrews, P. W. (2007). Adaptation to culture of human embryonic stem cells and oncogenesis in vivo. Nature Biotechnology , 25(2), 207–215. doi: 10.1038/nbt1285
- Baker, D., Hirst, A. J., Gokhale, P. J., Juarez, M. A., Williams, S., Wheeler, M., … Barbaric, I. (2016). Detecting genetic mosaicism in cultures of human pluripotent stem cells. Stem Cell Reports , 7(5), 998–1012. doi: 10.1016/j.stemcr.2016.10.003
- Barbaric, I., Biga, V., Gokhale, P. J., Jones, M., Stavish, D., Glen, A., … Andrews, P. W. (2014). Time-lapse analysis of human embryonic stem cells reveals multiple bottlenecks restricting colony formation and their relief upon culture adaptation. Stem Cell Reports , 3(1), 142–155. doi: 10.1016/j.stemcr.2014.05.006
- Desmarais, J. A., Unger, C., Damjanov, I., Meuth, M., & Andrews, P. (2016). Apoptosis and failure of checkpoint kinase 1 activation in human induced pluripotent stem cells under replication stress. Stem Cell Research & Therapy, 7, 17. doi: 10.1186/s13287-016-0279-2
- Draper, J. S., Smith, K., Gokhale, P., Moore, H. D., Maltby, E., Johnson, J., … Andrews, P. W. (2004). Recurrent gain of chromosomes 17q and 12 in cultured human embryonic stem cells. Nature Biotechnology , 22(1), 53–54. doi: 10.1038/nbt922
- Enver, T., Soneji, S., Joshi, C., Brown, J., Iborra, F., Orntoft, T., … Andrews, P. W. (2005). Cellular differentiation hierarchies in normal and culture-adapted human embryonic stem cells. Human Molecular Genetics , 14(21), 3129–3140. doi: 10.1093/hmg/ddi345
- Halliwell, J., Barbaric, I., & Andrews, P. W. (2020). Acquired genetic changes in human pluripotent stem cells: Origins and consequences. Nature Reviews Molecular Cell Biology , 21(12), 715–728. doi: 10.1038/s41580-020-00292-z
- Harrison, N. J., Baker, D., & Andrews, P. W. (2007). Culture adaptation of embryonic stem cells echoes germ cell malignancy. International Journal of Andrology , 30(4), 275–281. discussion 281. doi: 10.1111/j.1365-2605.2007.00762.x
- Hook, E. B. (1977). Exclusion of chromosomal mosaicism: Tables of 90%, 95% and 99% confidence limits and comments on use. American Journal of Human Genetics , 29(1), 94–97.
- Josephson, R., Sykes, G., Liu, Y., Ording, C., Xu, W., Zeng, X., … Auerbach, J. M. (2006). A molecular scheme for improved characterization of human embryonic stem cell lines. BMC Biology , 4, 28. doi: 10.1186/1741-7007-4-28
- LaFramboise, T. (2009). Single nucleotide polymorphism arrays: A decade of biological, computational and technological advances. Nucleic Acids Research , 37(13), 4181–4193. doi: 10.1093/nar/gkp552
- Laing, O., Halliwell, J., & Barbaric, I. (2019). Rapid PCR assay for detecting common genetic variants arising in human pluripotent stem cell cultures. Current Protocols in Stem Cell Biology , 49(1), e83. doi: 10.1002/cpsc.83
- Laurent, L. C., Ulitsky, I., Slavin, I., Tran, H., Schork, A., Morey, R., … Loring, J. F. (2011). Dynamic changes in the copy number of pluripotency and cell proliferation genes in human ESCs and iPSCs during reprogramming and time in culture. Cell Stem Cell , 8(1), 106–118. doi: 10.1016/j.stem.2010.12.003
- Mitalipova, M. M., Rao, R. R., Hoyer, D. M., Johnson, J. A., Meisner, L. F., Jones, K. L., … Stice, S. L. (2005). Preserving the genetic integrity of human embryonic stem cells. Nature Biotechnology , 23(1), 19–20. doi: 10.1038/nbt0105-19
- Olariu, V., Harrison, N. J., Coca, D., Gokhale, P. J., Baker, D., Billings, S., … Andrews, P. W. (2010). Modeling the evolution of culture-adapted human embryonic stem cells. Stem Cell Research , 4(1), 50–56. doi: 10.1016/j.scr.2009.09.001
- Peiffer, D. A., Le, J. M., Steemers, F. J., Chang, W., Jenniges, T., Garcia, F., … Gunderson, K. L. (2006). High-resolution genomic profiling of chromosomal aberrations using Infinium whole-genome genotyping. Genome Research , 16(9), 1136–1148. doi: 10.1101/gr.5402306
- Price, C. J., Stavish, D., Gokhale, P. J., Stevenson, B. A., Sargeant, S., Lacey, J., … Barbaric, I. (2021). Genetically variant human pluripotent stem cells selectively eliminate wild-type counterparts through YAP-mediated cell competition. Developmental Cell , 56(17), 2455–2470 e2410. doi: 10.1016/j.devcel.2021.07.019
- L. G. Shaffer, J. McGowan-Jordan, & M. Schmid (Eds.) (2013). ISCN 2103: An international system for human cytogenetic nomenclature. Basel: Karger.
- Taapken, S. M., Nisler, B. S., Newton, M. A., Sampsell-Barron, T. L., Leonhard, K. A., McIntire, E. M., & Montgomery, K. D. (2011). Karotypic abnormalities in human induced pluripotent stem cells and embryonic stem cells. Nature Biotechnology , 29(4), 313–314. doi: 10.1038/nbt.1835
- Thomson, J. A., Itskovitz-Eldor, J., Shapiro, S. S., Waknitz, M. A., Swiergiel, J. J., Marshall, V. S., & Jones, J. M. (1998). Embryonic stem cell lines derived from human blastocysts. Science , 282(5391), 1145–1147. doi: 10.1126/science.282.5391.1145
- Wiegant, J., Ried, T., Nederlof, P. M., van der Ploeg, M., Tanke, H. J., & Raap, A. K. (1991). In situ hybridization with fluoresceinated DNA. Nucleic Acids Research , 19(12), 3237–3241. doi: 10.1093/nar/19.12.3237

