Glucagon measurement from islet populations using a TR-FRET assay
Wesley Eaton, Michael Roper
Abstract
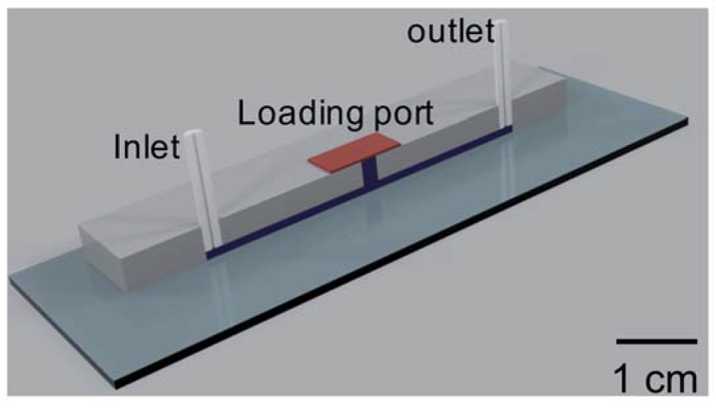
TR-FRET homogenous assay method using a microfluidic device for quantitation of glucagon secretion from human islet populations is described. A PDMS microfluidic device was used to perfuse a population of islets and collect 10µL fractions of perfusate every two minutes. The method was used to measure glucagon secretion from human islet populations from 5 donors.
Steps
Polydimethylsiloxane (PDMS) prepolymer (Sylgard 184) -Dow Corning (Midland, MI)
Preparation for on chip measurements
Chip has been conditioned with BSS for at least 30 minutes
Islets are washed by transferring them to a petri dish with pre-warmed BSS with desired concentration of glucose (we used 20 mM) and let sit in BSS for a few minutes (~2 min)
Chemical reagents
TR-FRET glucagon assay -Cisbio (Walthan, MA)
Dextrose -Fisher Scientific (Pittsburg, PA)
Polydimethylsiloxane (PDMS) prepolymer (Sylgard 184) -Dow Corning (Midland, MI)
All other reagents were purchased from Sigma-Aldrich (St. Louis, MO) unless noted otherwise. All solutions were made with ultrapure DI water (NANOpure Diamond System, Barnstead International, Dubuque, IA). A balanced salt solution (BSS) was used for islet experiments which contained 125 mM NaCl, 5.9 mM KCl, 1.2 mM MgCl2, 2.4 mM CaCl2, 25 mM tricine, and brought to pH 7.4 before addition of 0.1% BSA.
Materials and Instrumentation
HTRF 96 well low volume plates
Spectramax iD5 plate reader
PDMS device was fabricated using previously described methods1
Calibration Curve
10,000** pg/ml stock glucagon was diluted following manufacturer's protocol for a serial dilution.
Final concentration was 2000, 1000, 500, 250, 125, 62.5, 31.25, 15.6 and 0 pg/mL
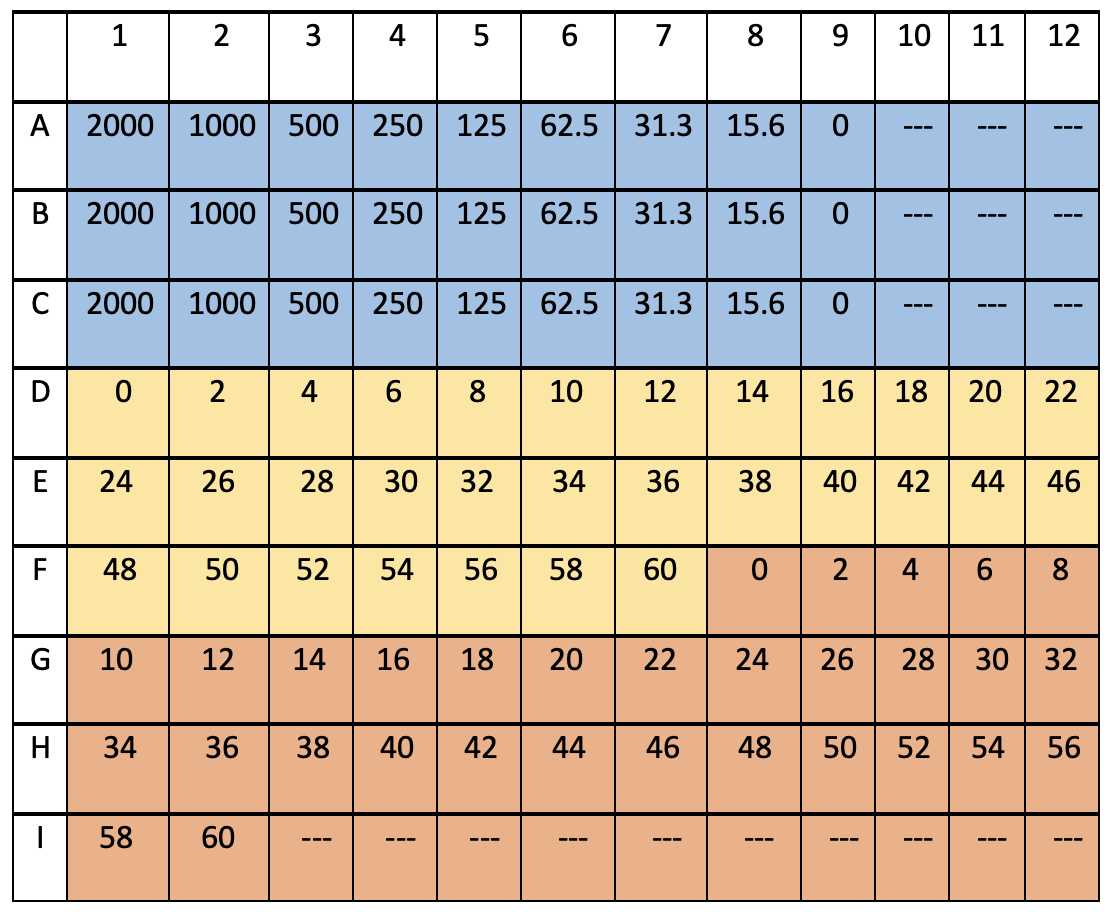
The table below shows how a typical well plate was arranged for incubation.
Rows A,B and C are shown in blue and are for the calibration to be run in triplicate. Values are given for pg/mL.
The yellow and orange portion are marked for the fractions from the first and second islet experiment and the numbers correspond to the time stamp of the fraction. For example, the "0" corresponds to the perfusate from 0-2 min.
Open wells (- - -) can be used for the lysate dilutions described below
Islets were incubated in PIM(S) media (Prodo Labs).
Chip had been conditioned with BSS for at least 30 minutes.
Islets washed by transferring them to a petri dish with prewarmed BSS with desired concentration of glucose (we used 20 mM) and let sit in BSS for a few minutes (~2 min)
Islets were then transferred to the device in a 10 µL pipet and were positioned so that they could sediment into the islet chamber on the device
Once islets are loaded the top of the chip is dried and chamber is sealed with PCR tape
Inlet and outlet tubing are connected to the device
Flow from syringe pumps is started and run for ~10-15 minutes or at least until the volume of the chip and outlet tubing has been displaced twice. We used a flow rate of 5 uL/min. *Note- times will change depending on flow rate.
Collect fractions every 2 min into low volume Eppendorf tubes and seal once fraction is collected.
Islet Lysis
Remove islets from device with a 200 µL pipet by vacuum and transfer to a small centrifuge tube
Remove islets with a 10 µL pipet after centrifugation
Lysis is performed using an acid ethanol mixture as described previously2
Transfer lysate to a low adsorption vial
Dilute lysate appropriately ( we used 10:1 and 20:1) with BSS.
10 uL of TR-FRET reagents were added to each well, covered, and incubated overnight for 12-14 hours at room temperature in the dark.
The Spectramax ID5 plate reader was used to measure the TR-FRET signal according to the manufacturer's protocol.
Excitation light (360 nm) was set for 50 us, followed by a 100 us delay, and a 600 us recording time of the two FRET channels (620 and 665 nm). This timing protocol was repeated every 2 ms for 100 cycles.
Data Analysis
FRET ratios are presented as the ratio of the emission at 665 nm to that at 620 nm multiplied by 10,000
The average FRET signal from the 0 pg mL1 standard solution was subtracted from all FRET measurements
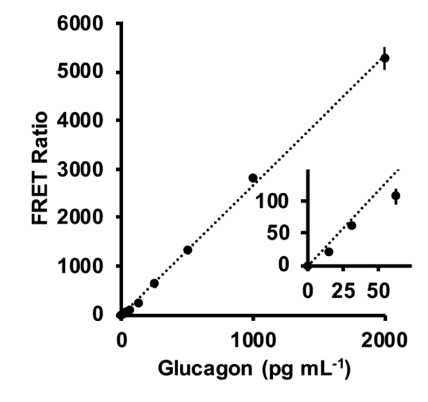
Calibration curves were generated by averaging the FRET ratio from the three replicates of each standard glucagon solution and plotting these values vs. the concentration of glucagon
Using calibration convert FRET ratio to pg/mL glucagon for all fractions and diluted lysate samples
Use lysate dilution that fell within the calibration range to quantify the amount of glucagon in the lysate
To report data as a percent of glucagon secreted, the amount of glucagon from each fraction was summed and added to the total glucagon in the lysate.3
Aquire Chemicals and Reagents


