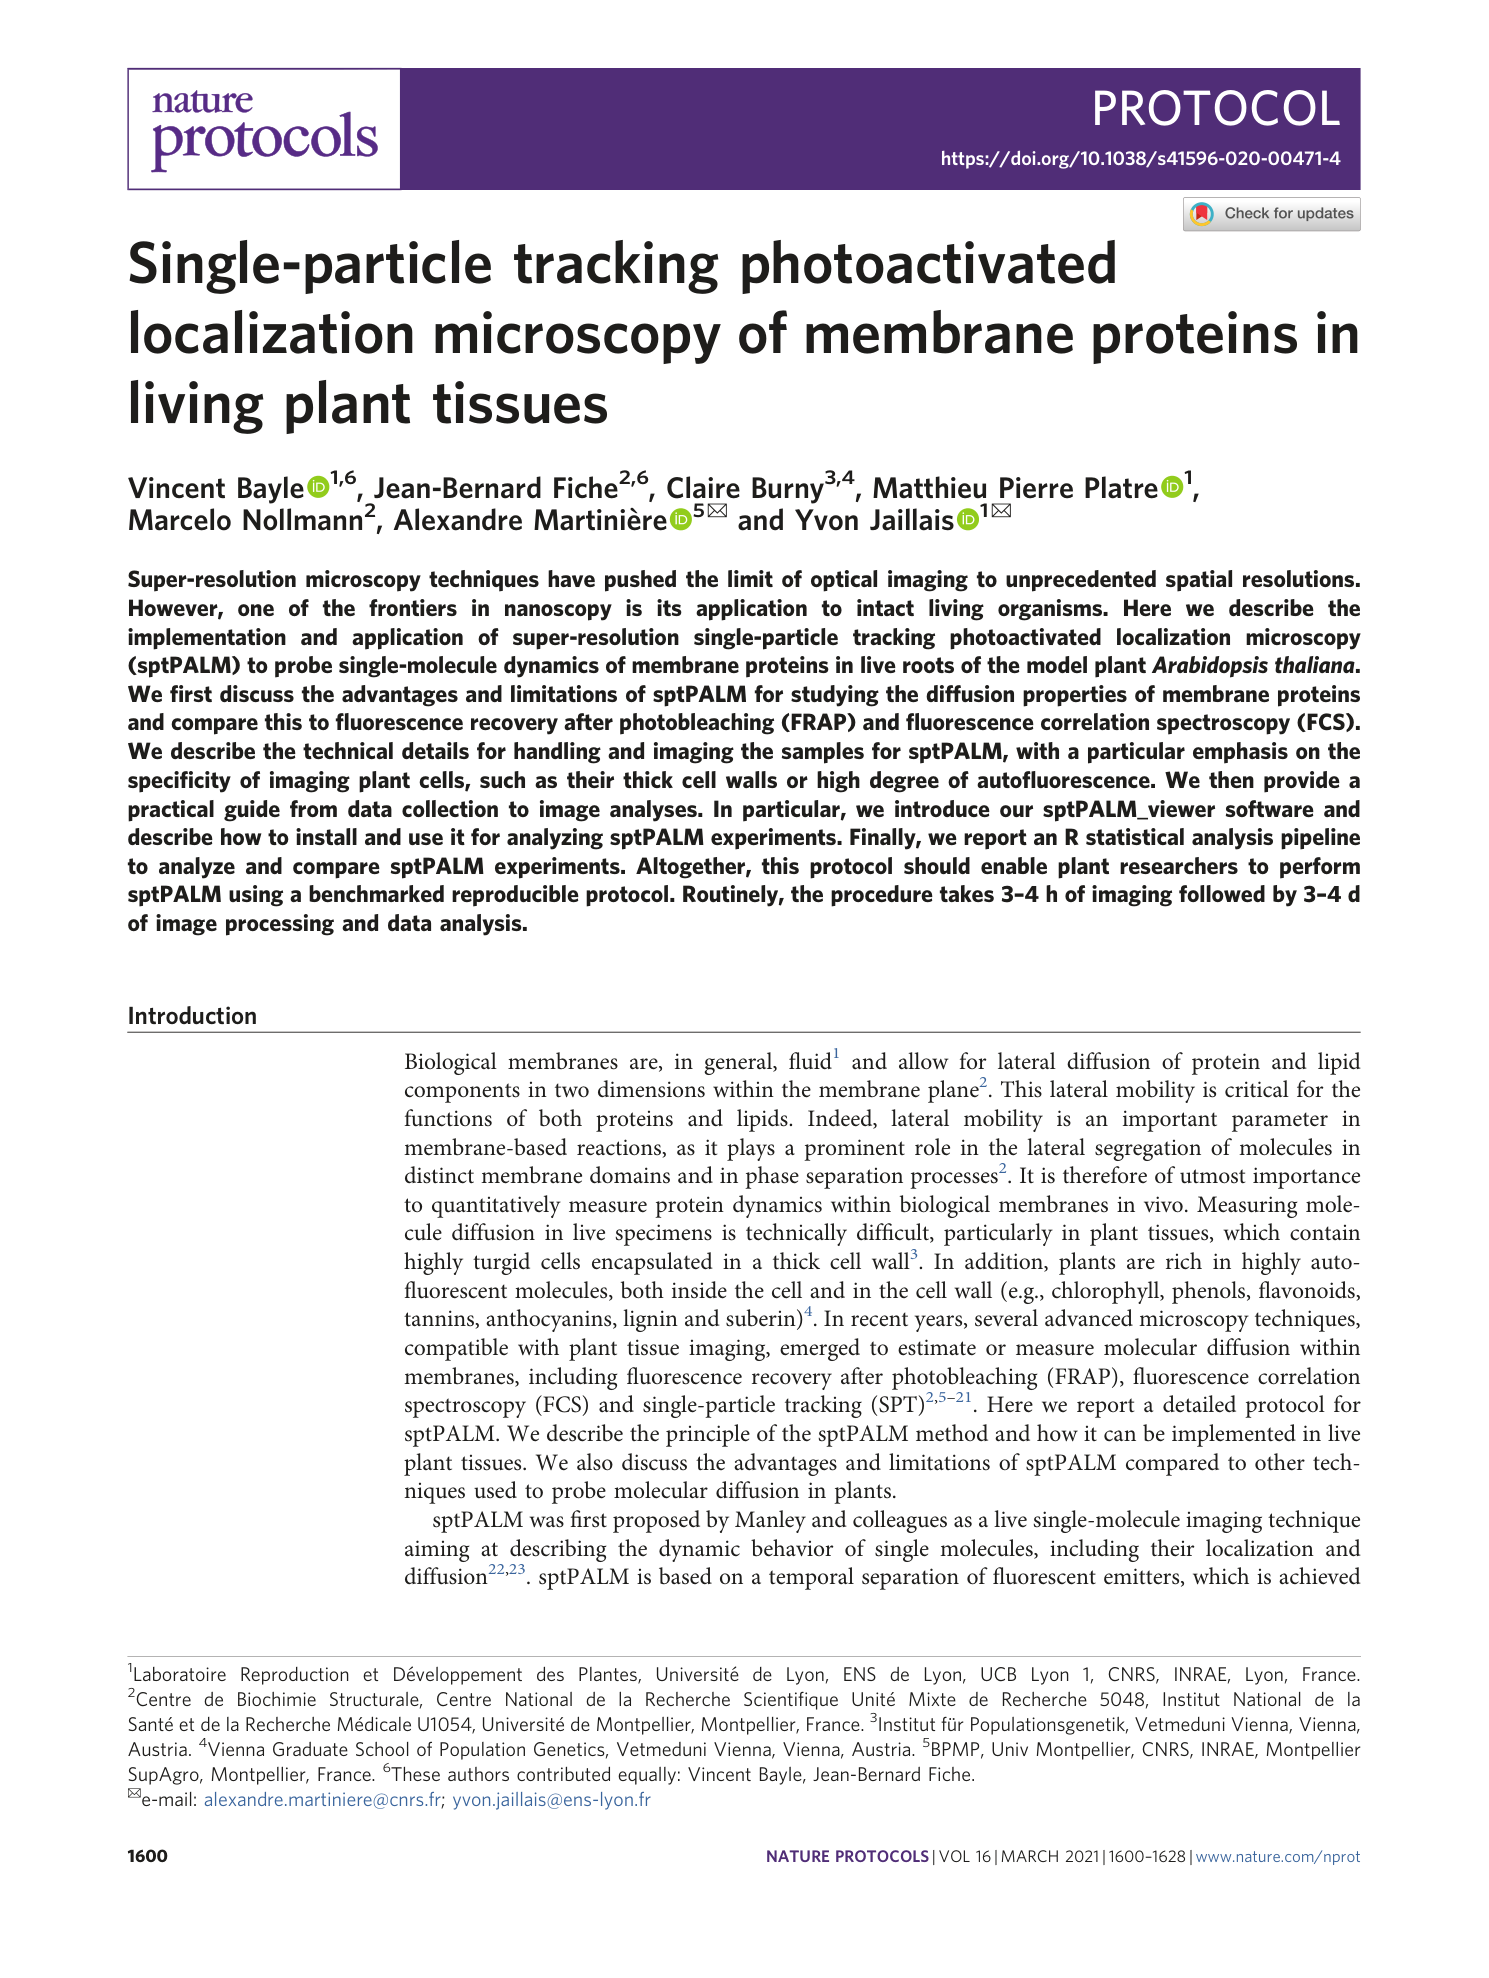
Single-particle tracking photoactivated localization microscopy of membrane proteins in living plant tissues
Vincent Bayle, Jean-Bernard Fiche, Claire Burny, Matthieu Pierre Platre, Marcelo Nollmann, Alexandre Martinière, Yvon Jaillais


Extended
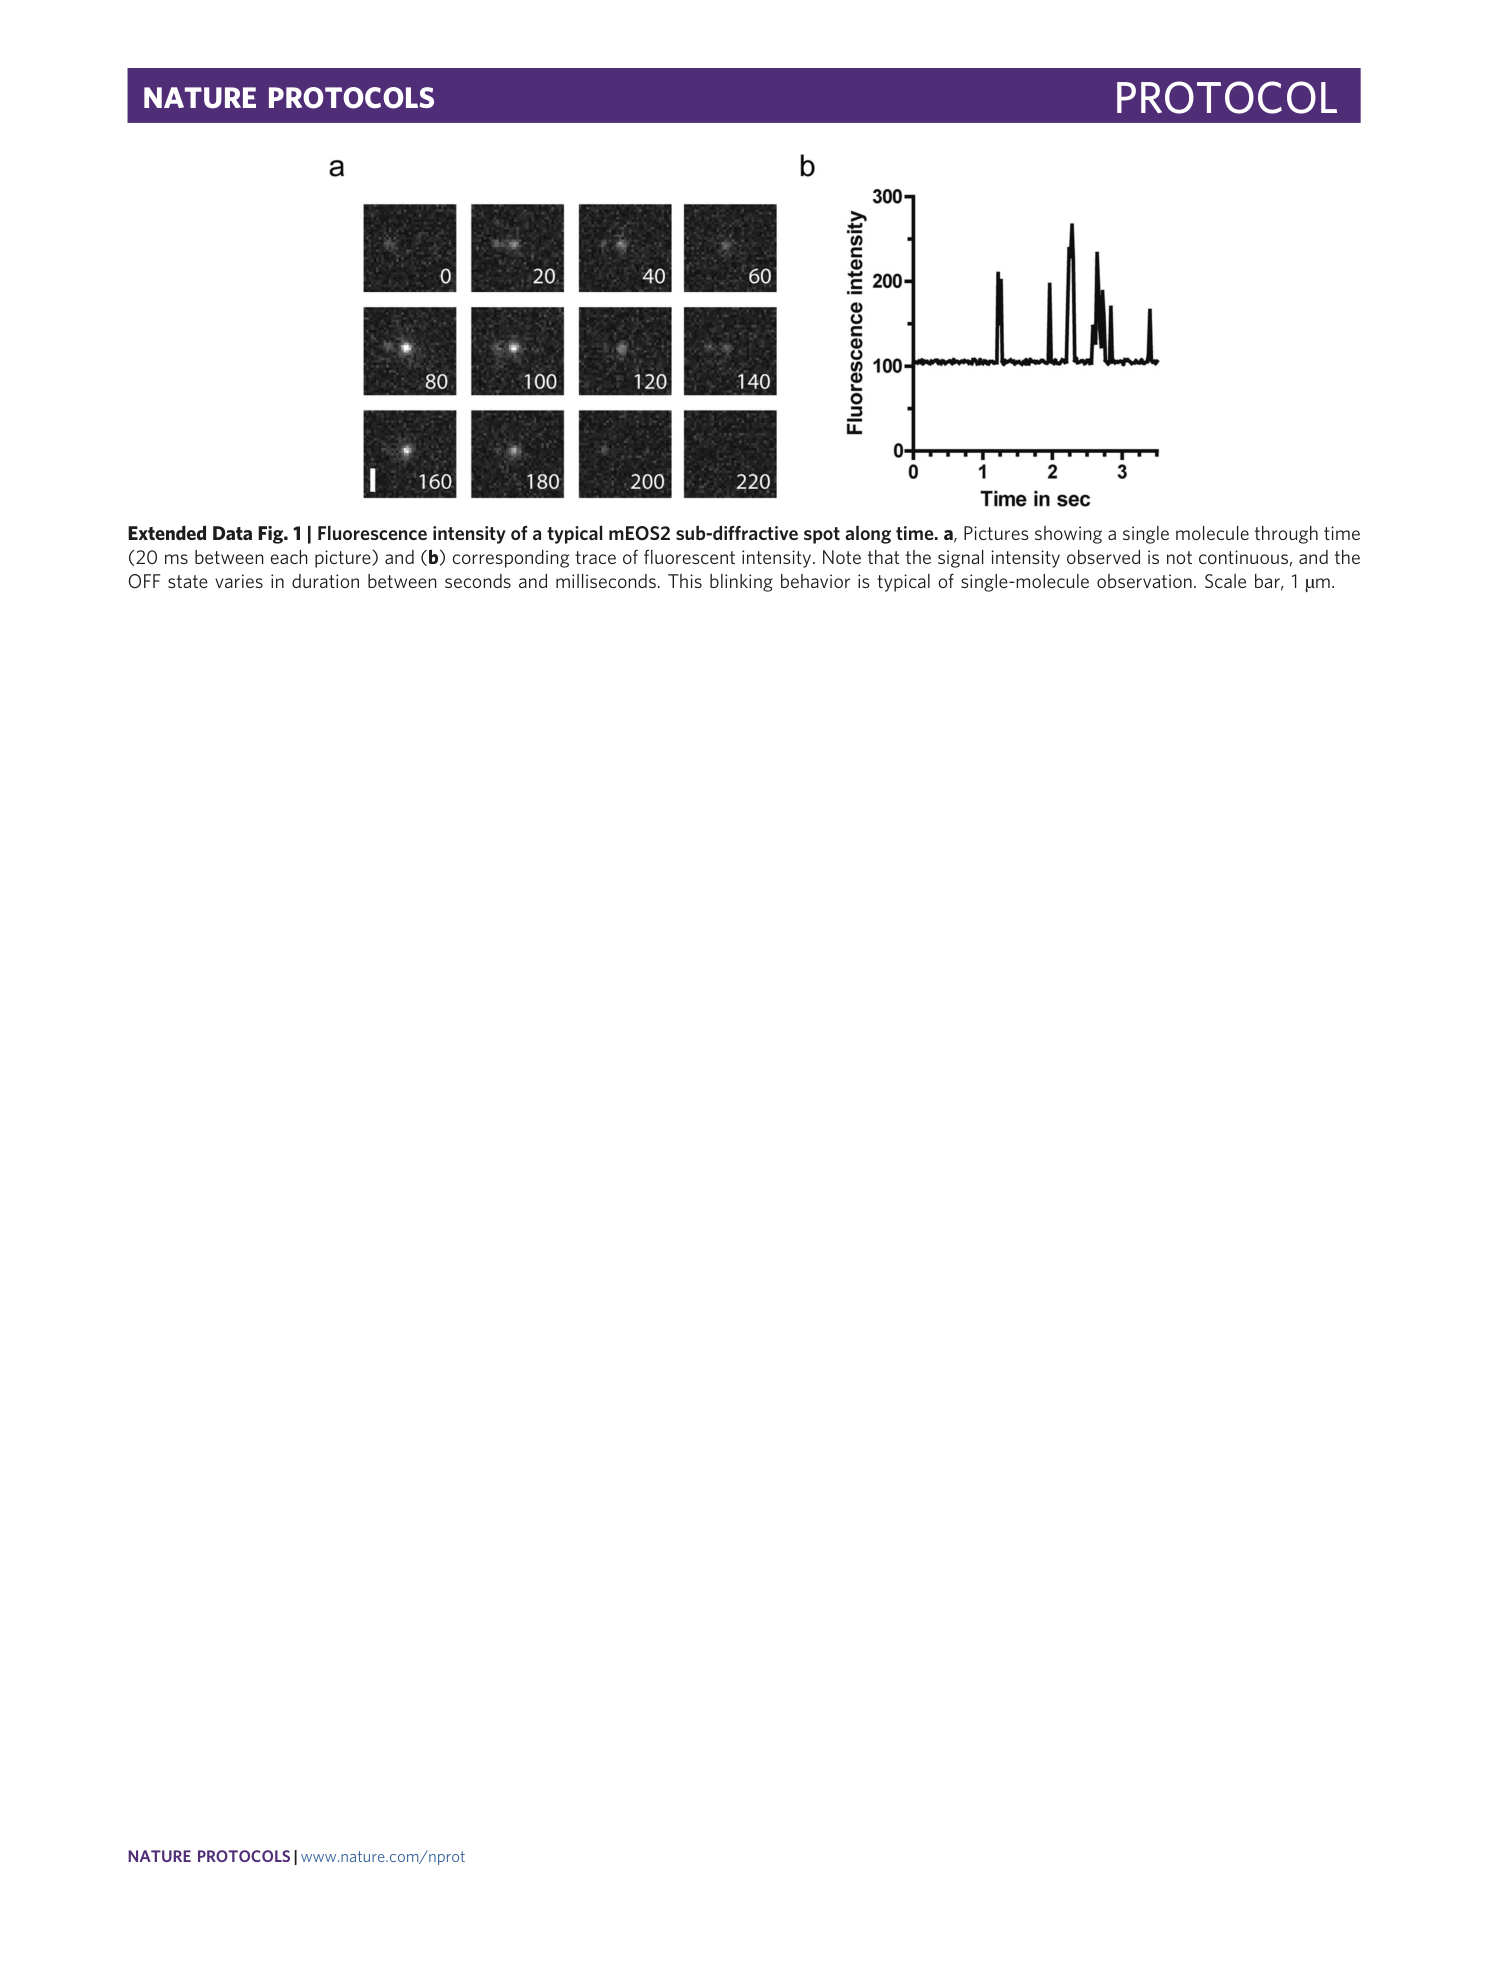
Extended Data Fig. 1 Fluorescence intensity of a typical mEOS2 sub-diffractive spot along time.
a , Pictures showing a single molecule through time (20 ms between each picture) and ( b ) corresponding trace of fluorescent intensity. Note that the signal intensity observed is not continuous, and the OFF state varies in duration between seconds and milliseconds. This blinking behavior is typical of single-molecule observation. Scale bar, 1 µm.
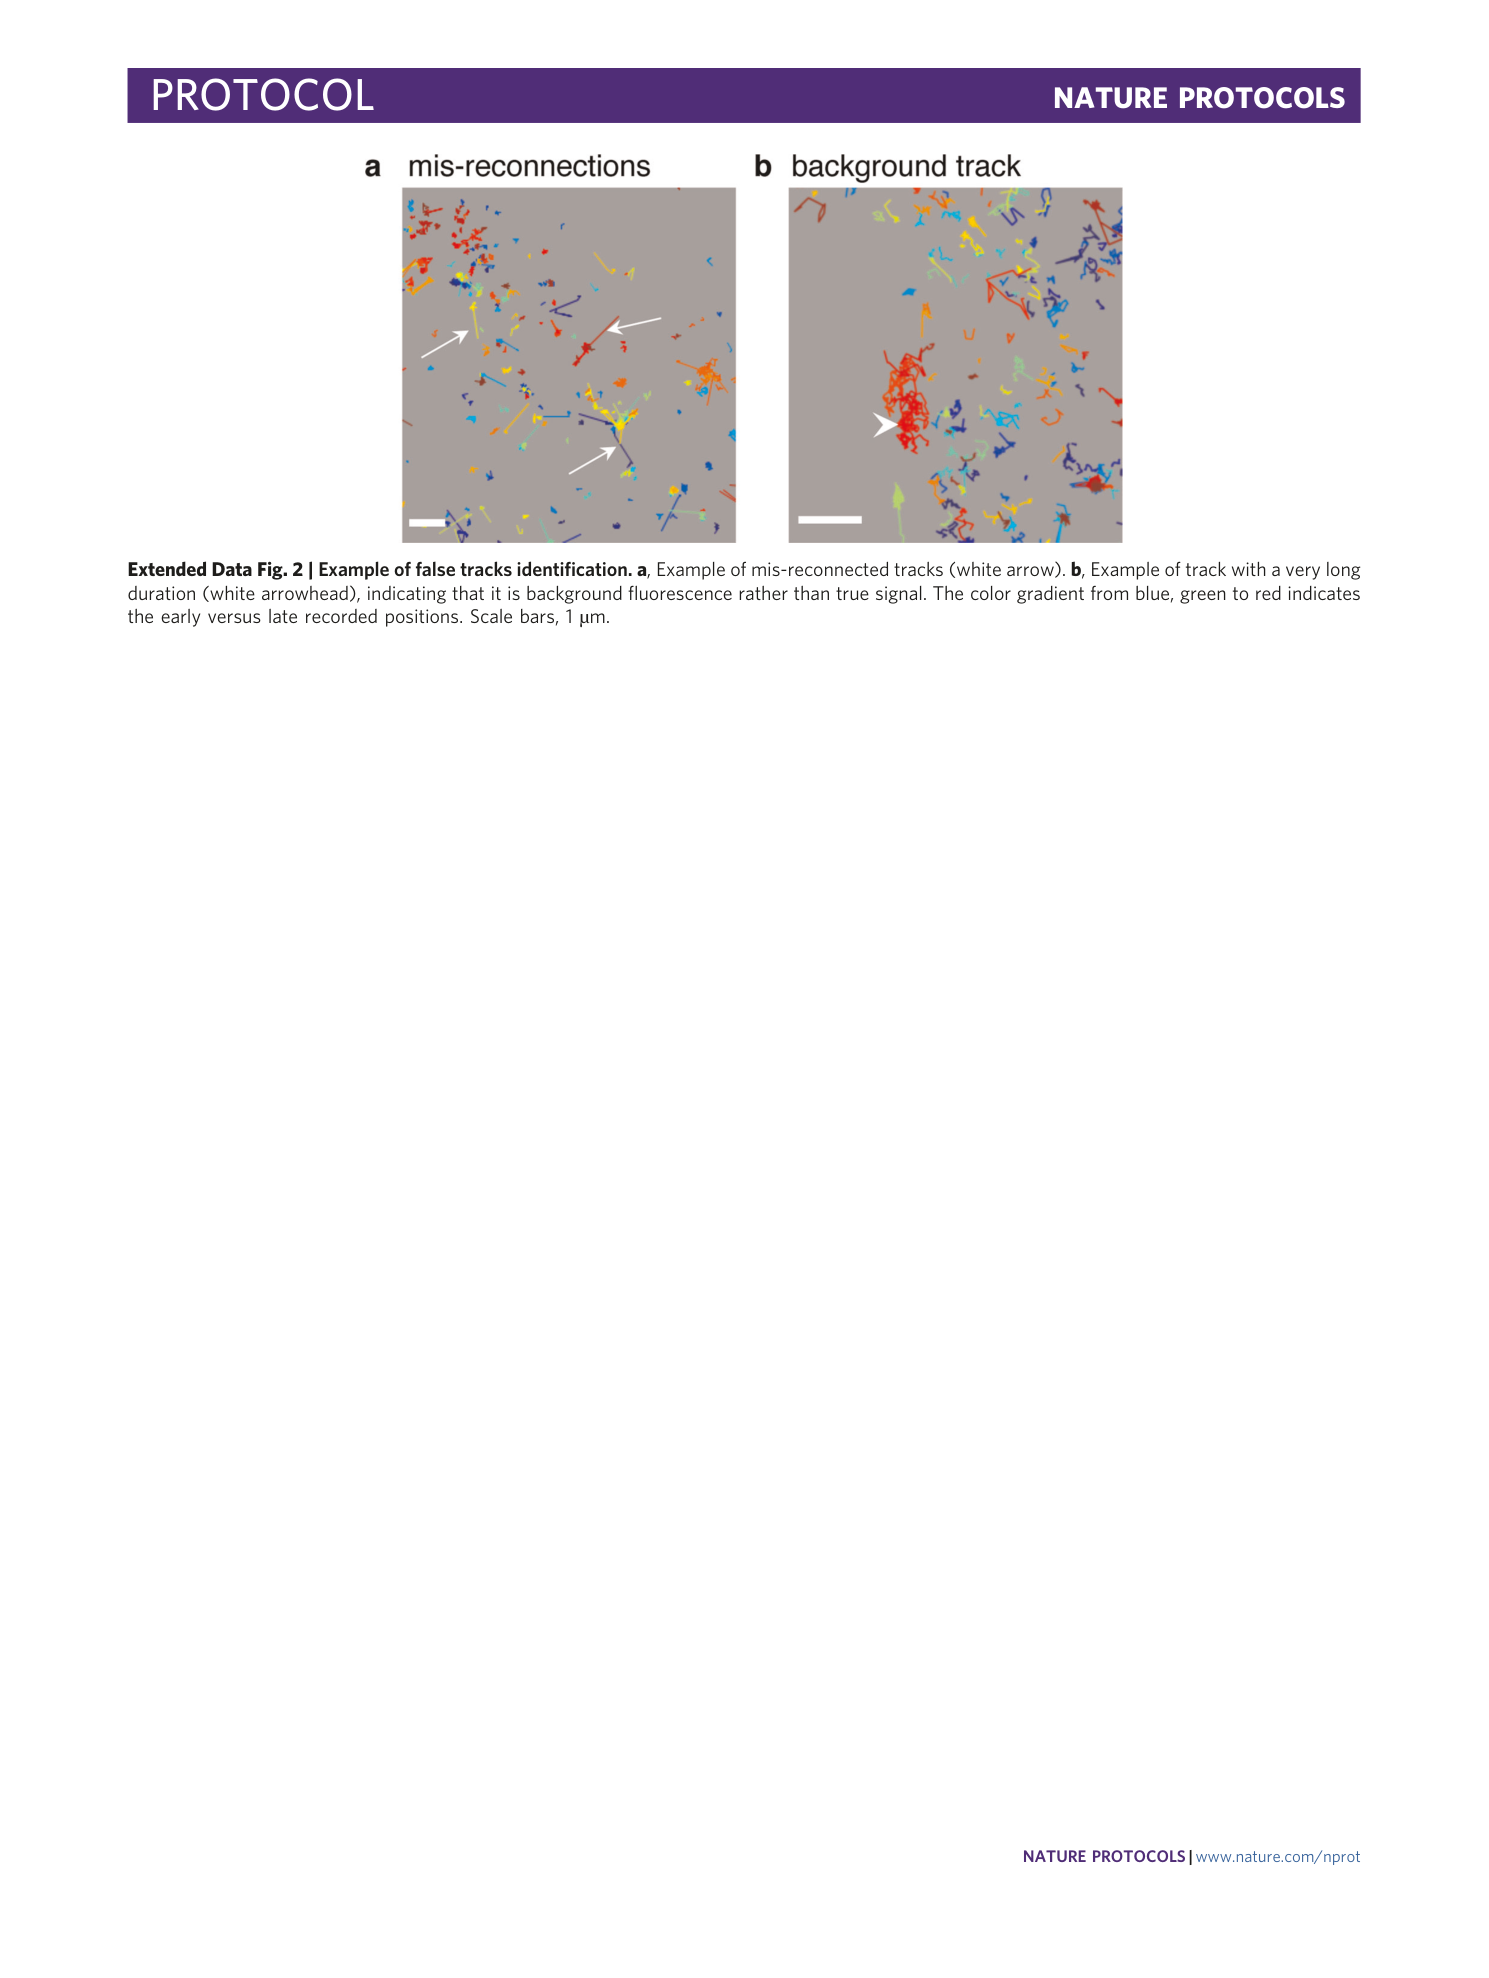
Extended Data Fig. 2 Example of false tracks identification.
a , Example of mis-reconnected tracks (white arrow). b , Example of track with a very long duration (white arrowhead), indicating that it is background fluorescence rather than true signal. The color gradient from blue, green to red indicates the early versus late recorded positions. Scale bars, 1 µm.
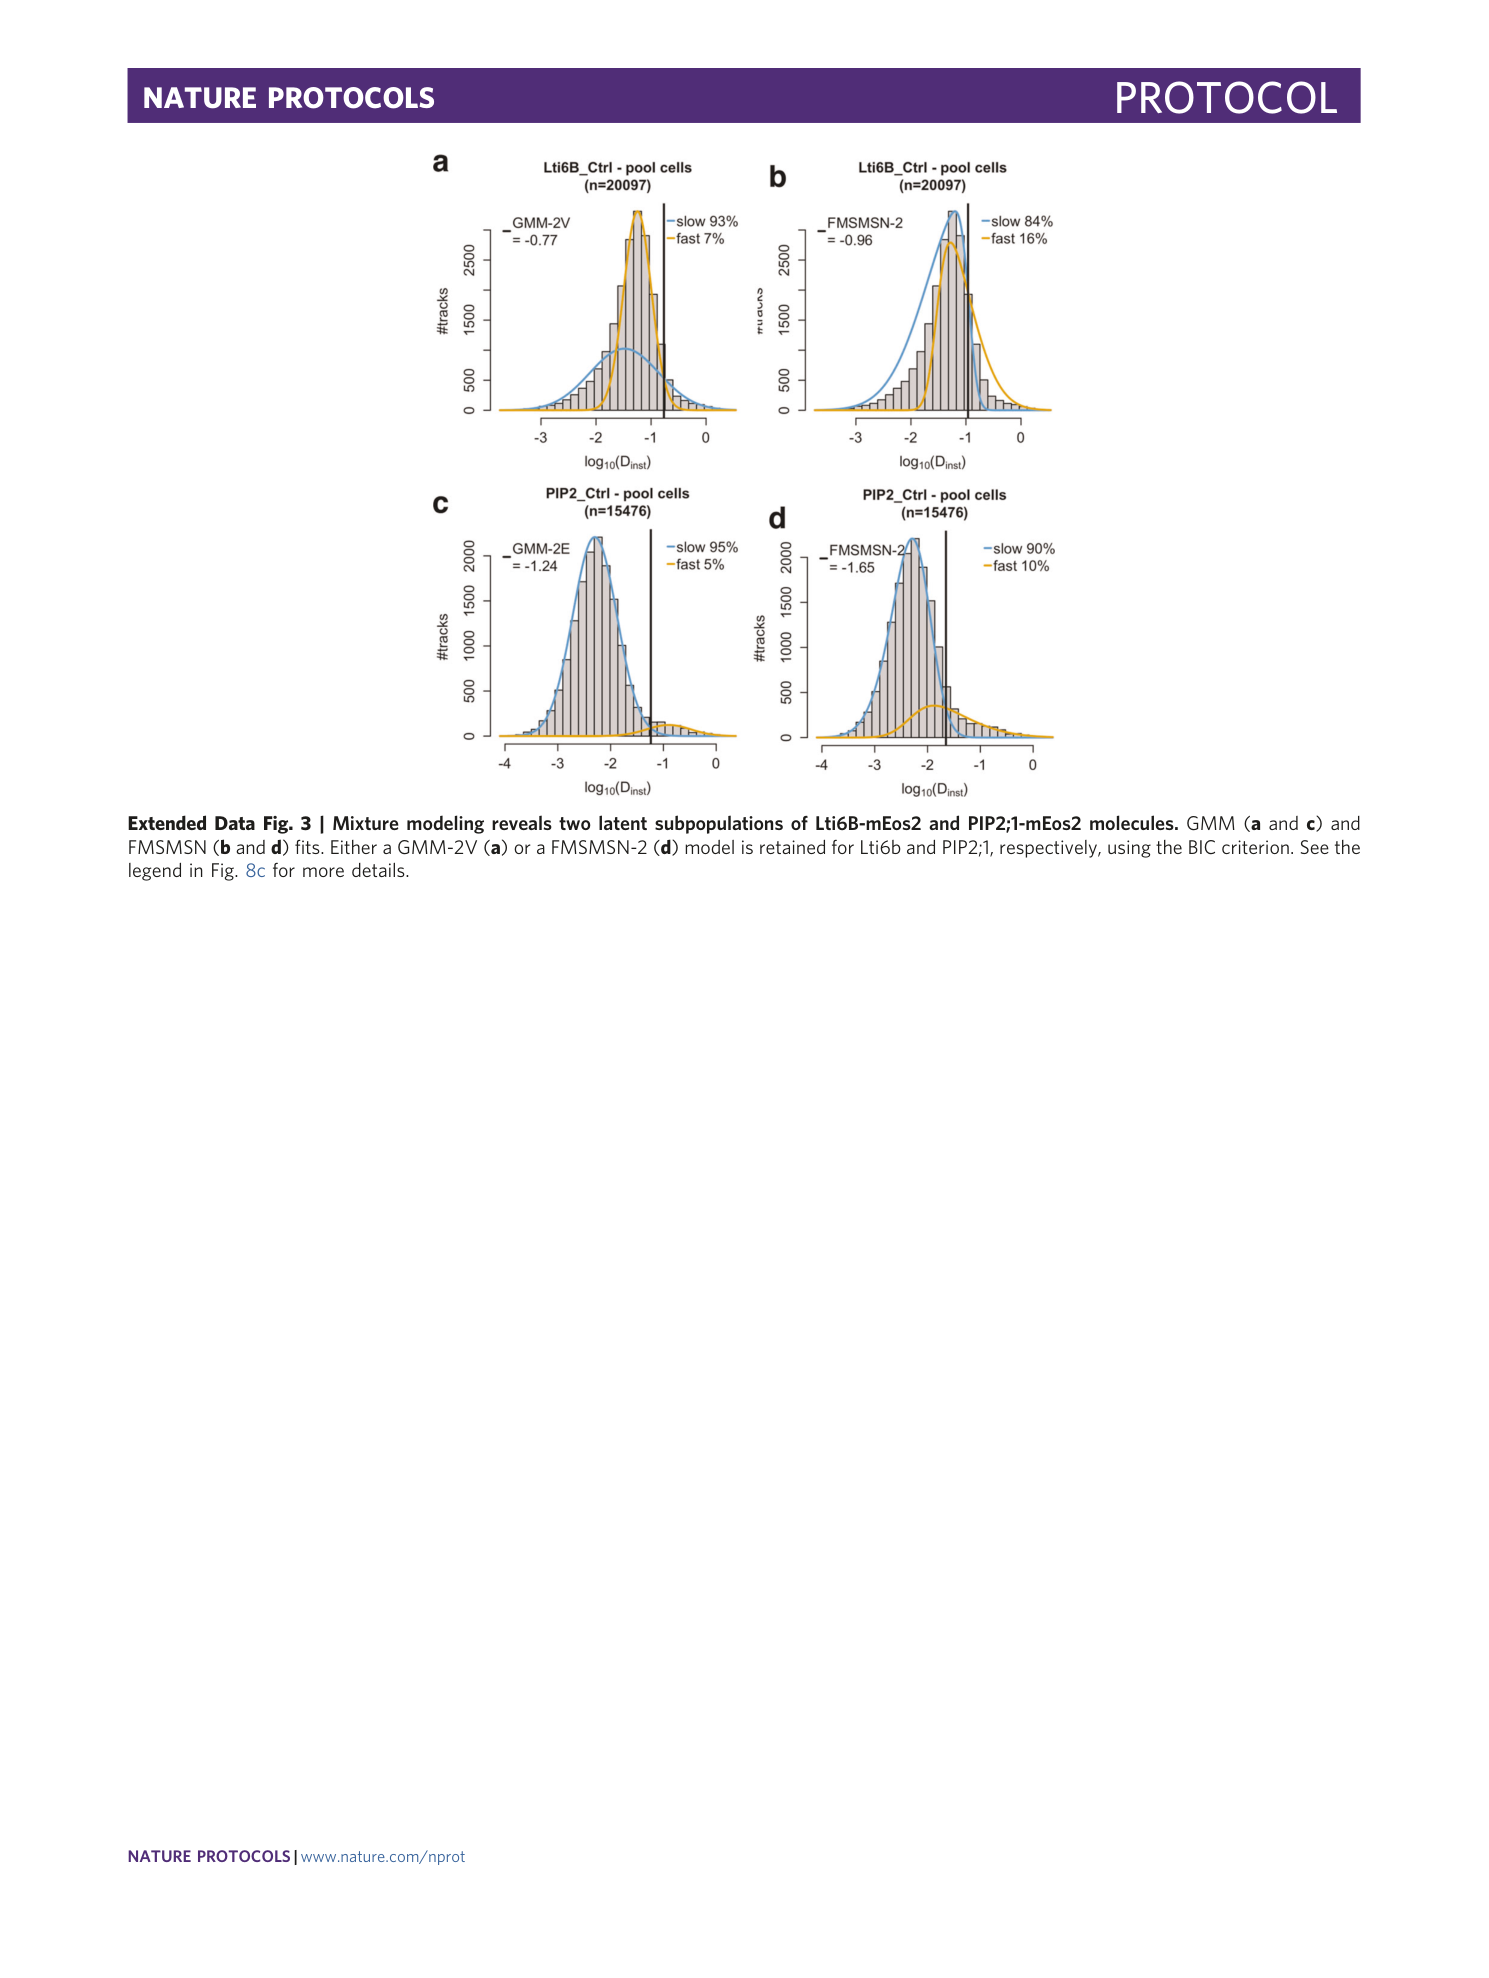
Extended Data Fig. 3 Mixture modeling reveals two latent subpopulations of Lti6B-mEos2 and PIP2;1-mEos2 molecules.
GMM ( a and c ) and FMSMSN ( b and d ) fits. Either a GMM-2V ( a ) or a FMSMSN-2 ( d ) model is retained for Lti6b and PIP2;1, respectively, using the BIC criterion. See the legend in Fig. 8c for more details.
