Multispectral confocal 3D imaging of intact healthy and tumor tissue using mLSR-3D
Ellen J. Wehrens, Anne C. Rios, Ravian L. van Ineveld, Raphaël Collot, Mario Barrera Román, Anna Pagliaro, Nils Bessler, Hendrikus C. R. Ariese, Michiel Kleinnijenhuis, Marcel Kool, Maria Alieva, Susana M. Chuva de Sousa Lopes


Extended
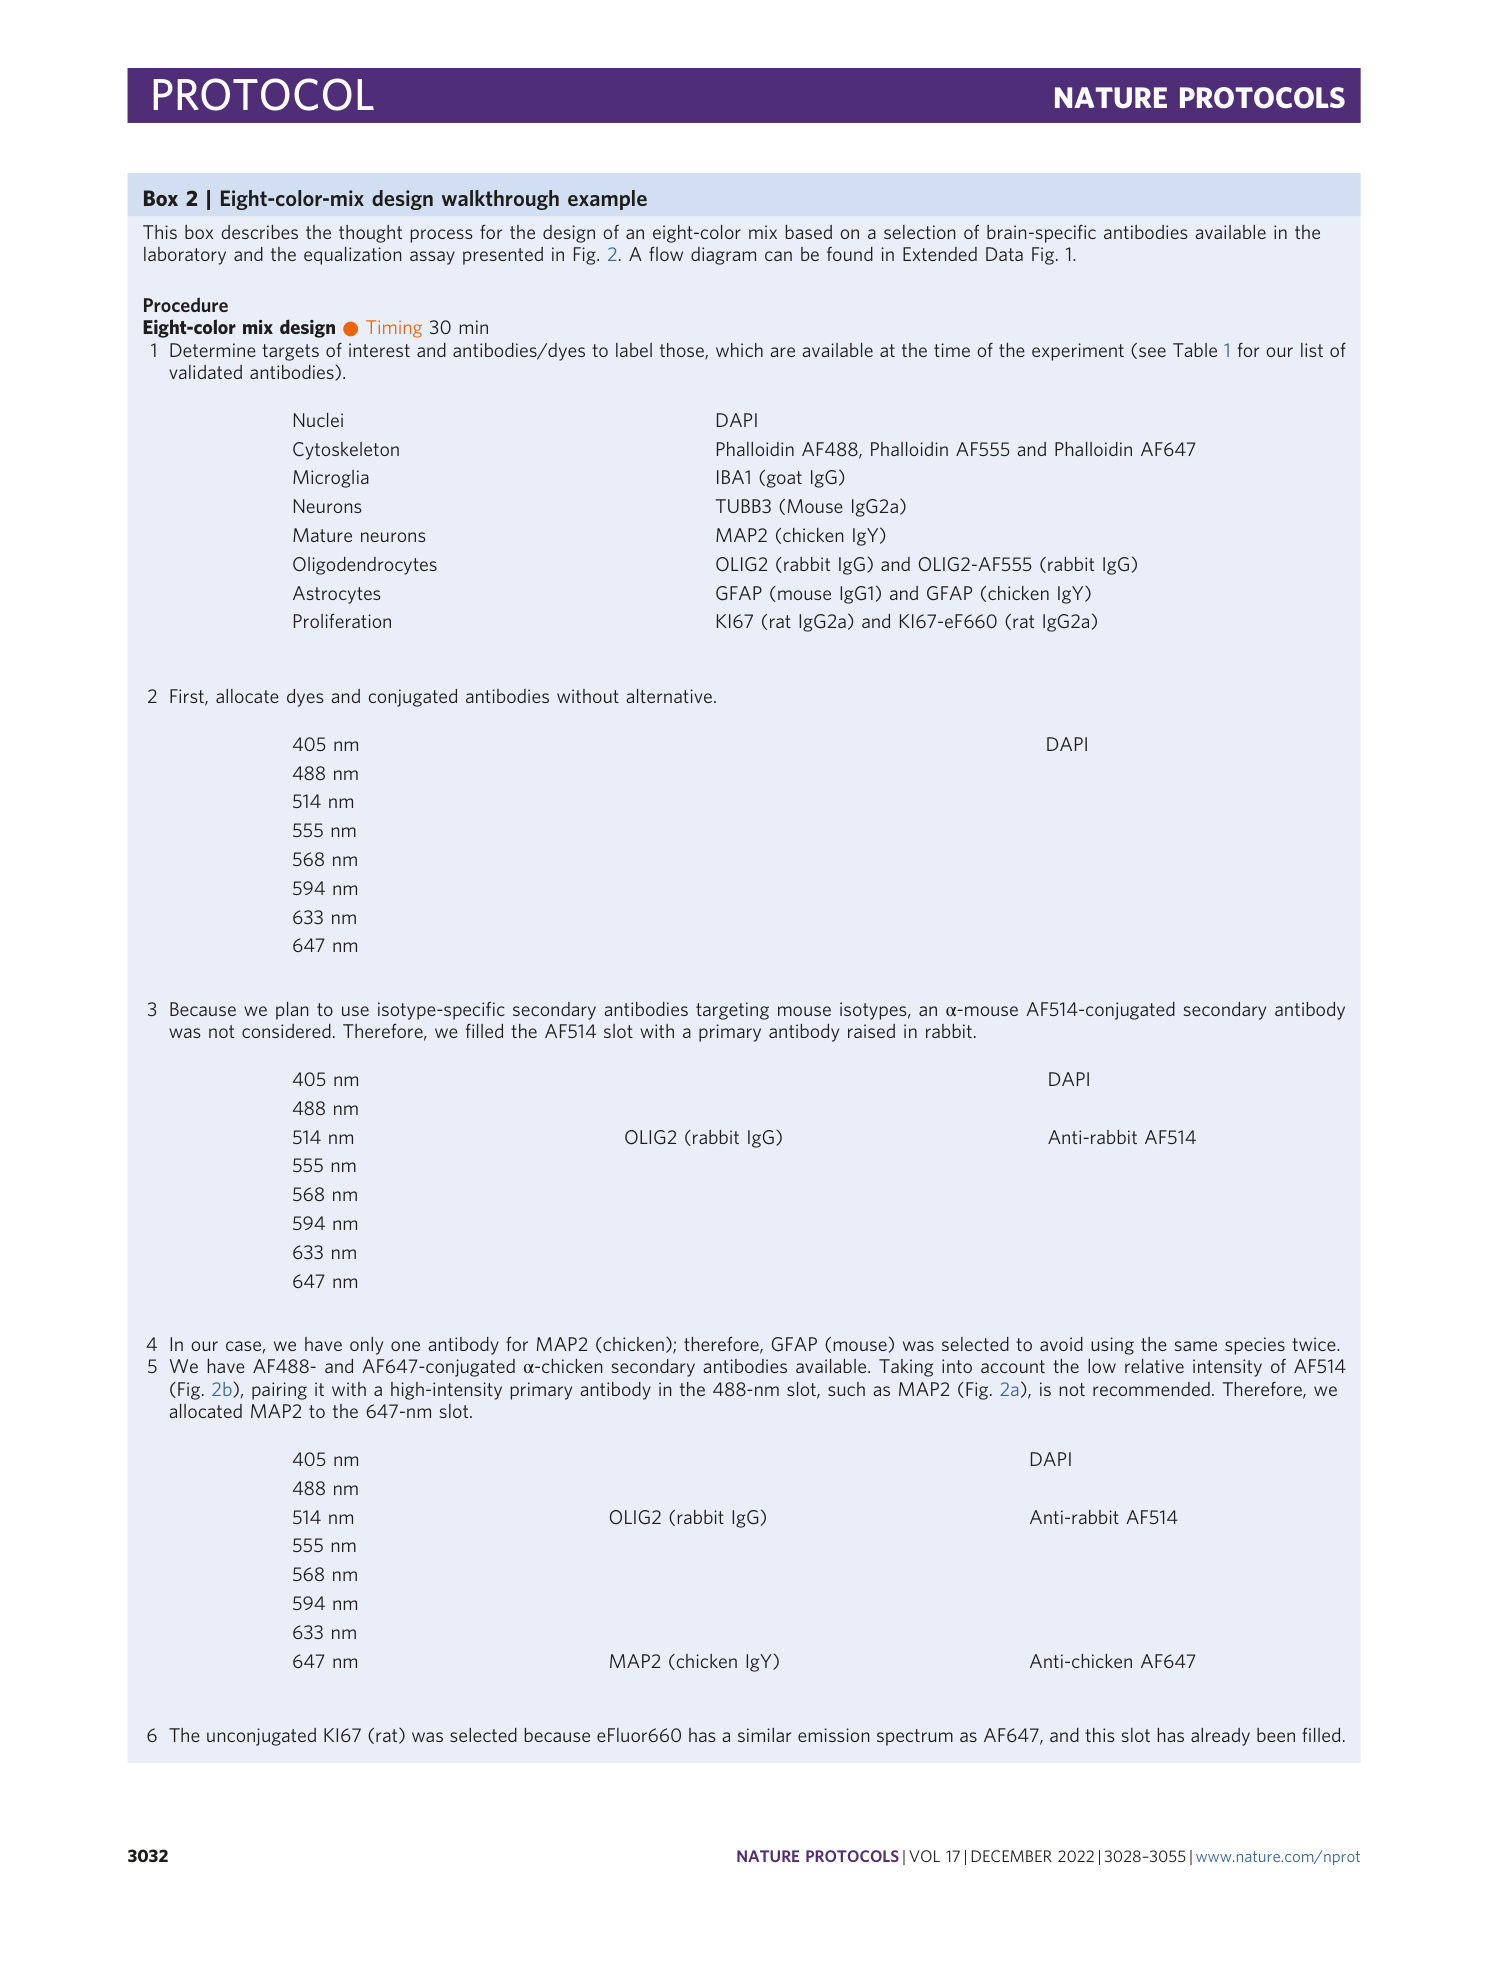
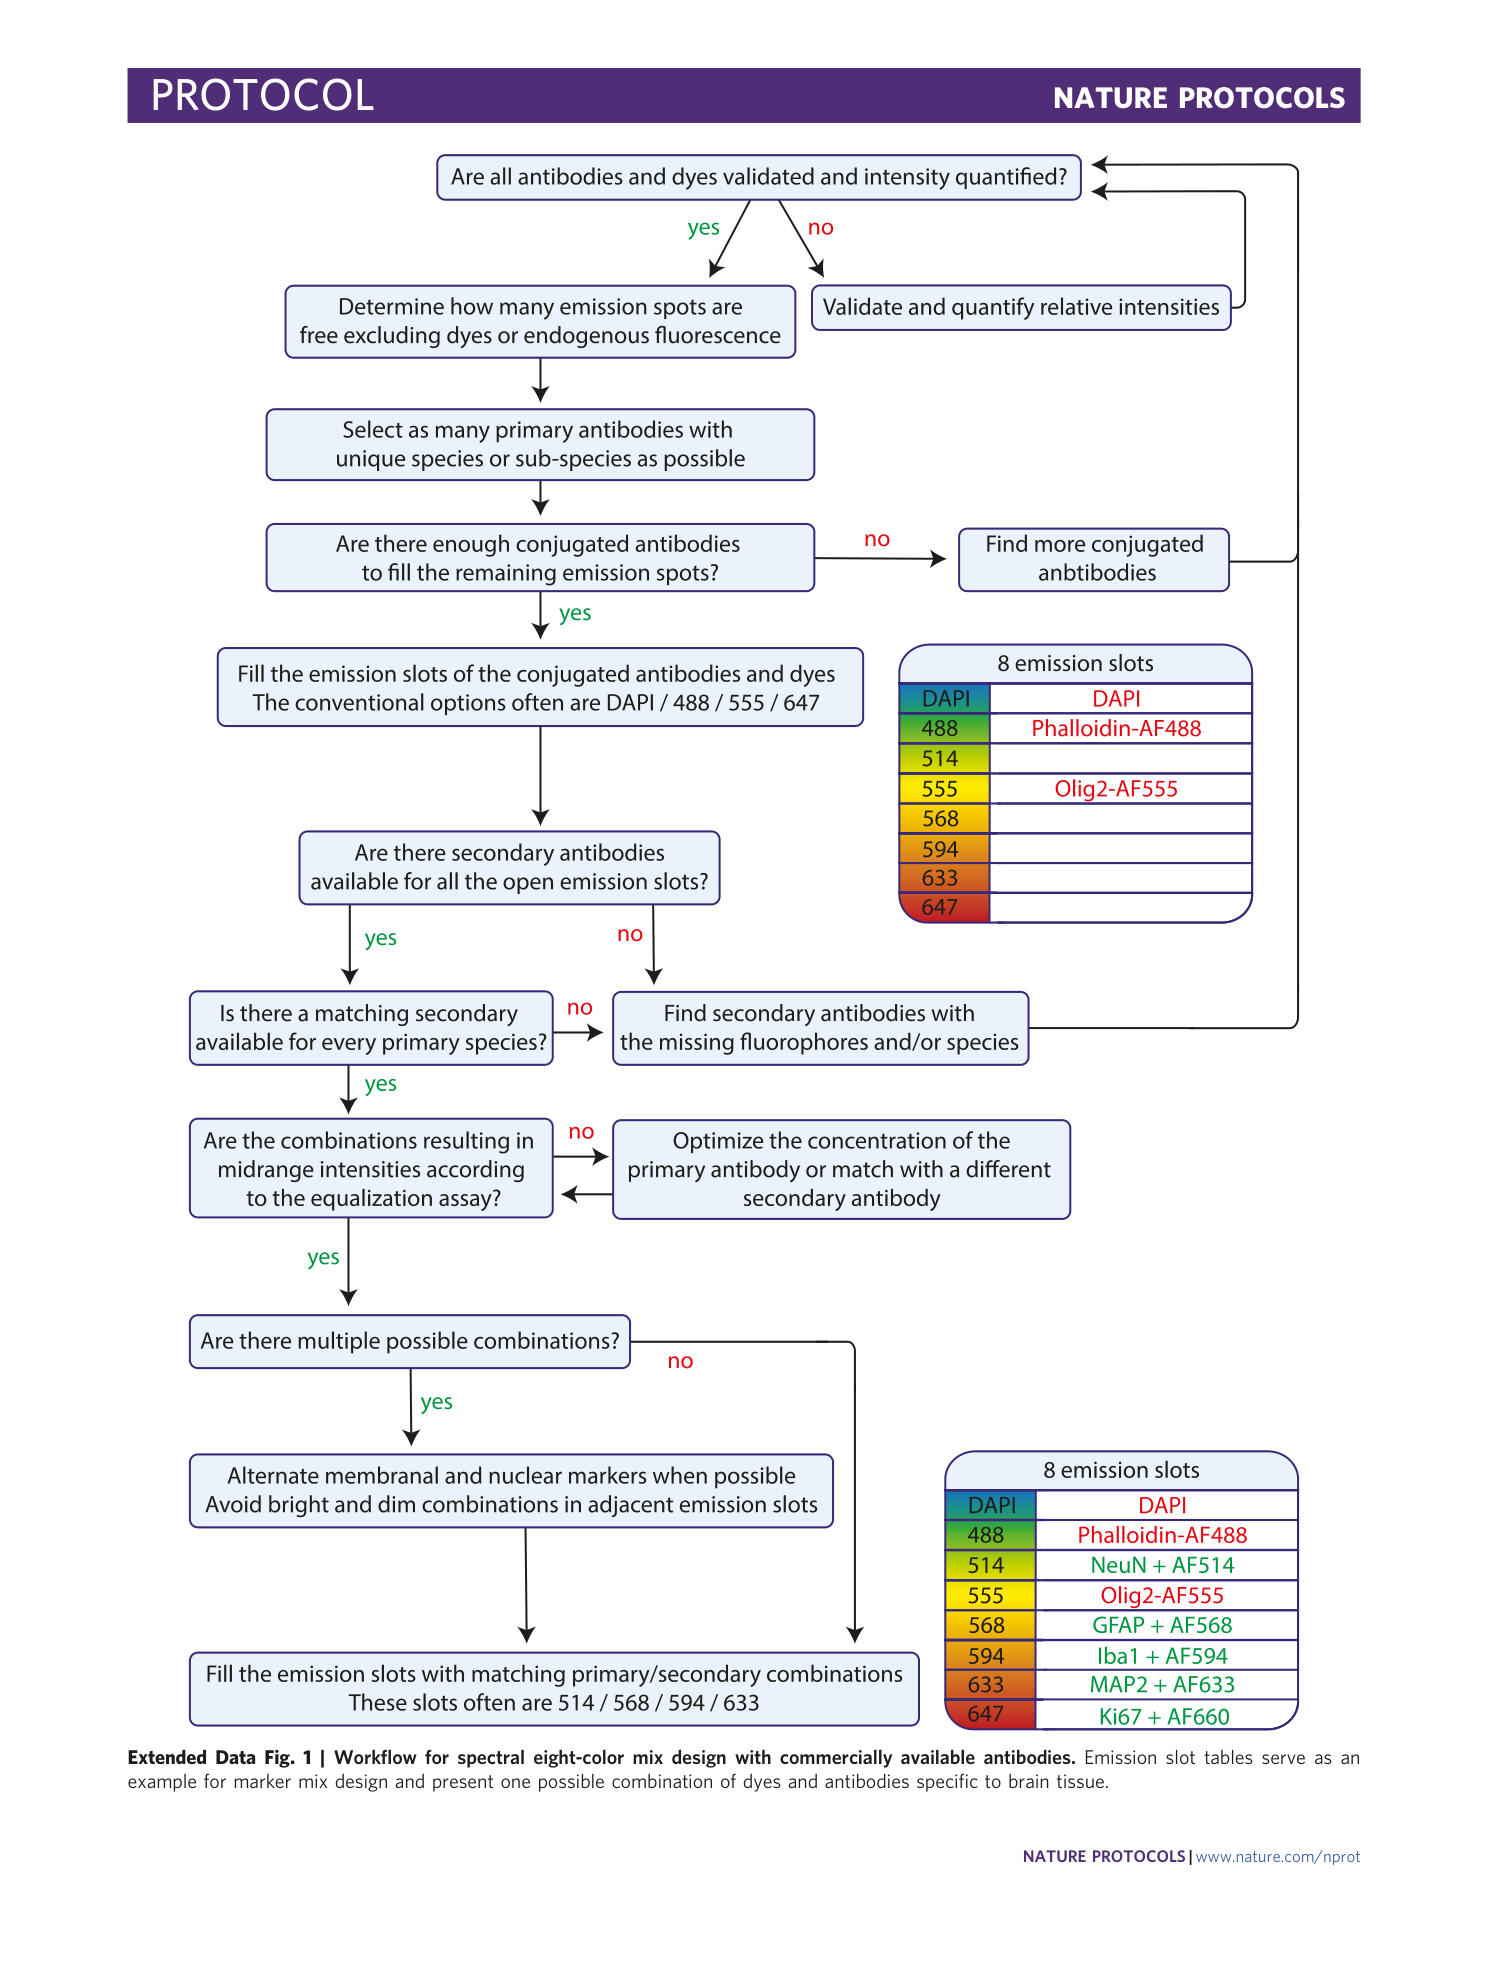
Extended Data Fig. 1 Workflow for spectral eight-color mix design with commercially available antibodies.
Emission slot tables serve as an example for marker mix design and present one possible combination of dyes and antibodies specific to brain tissue.
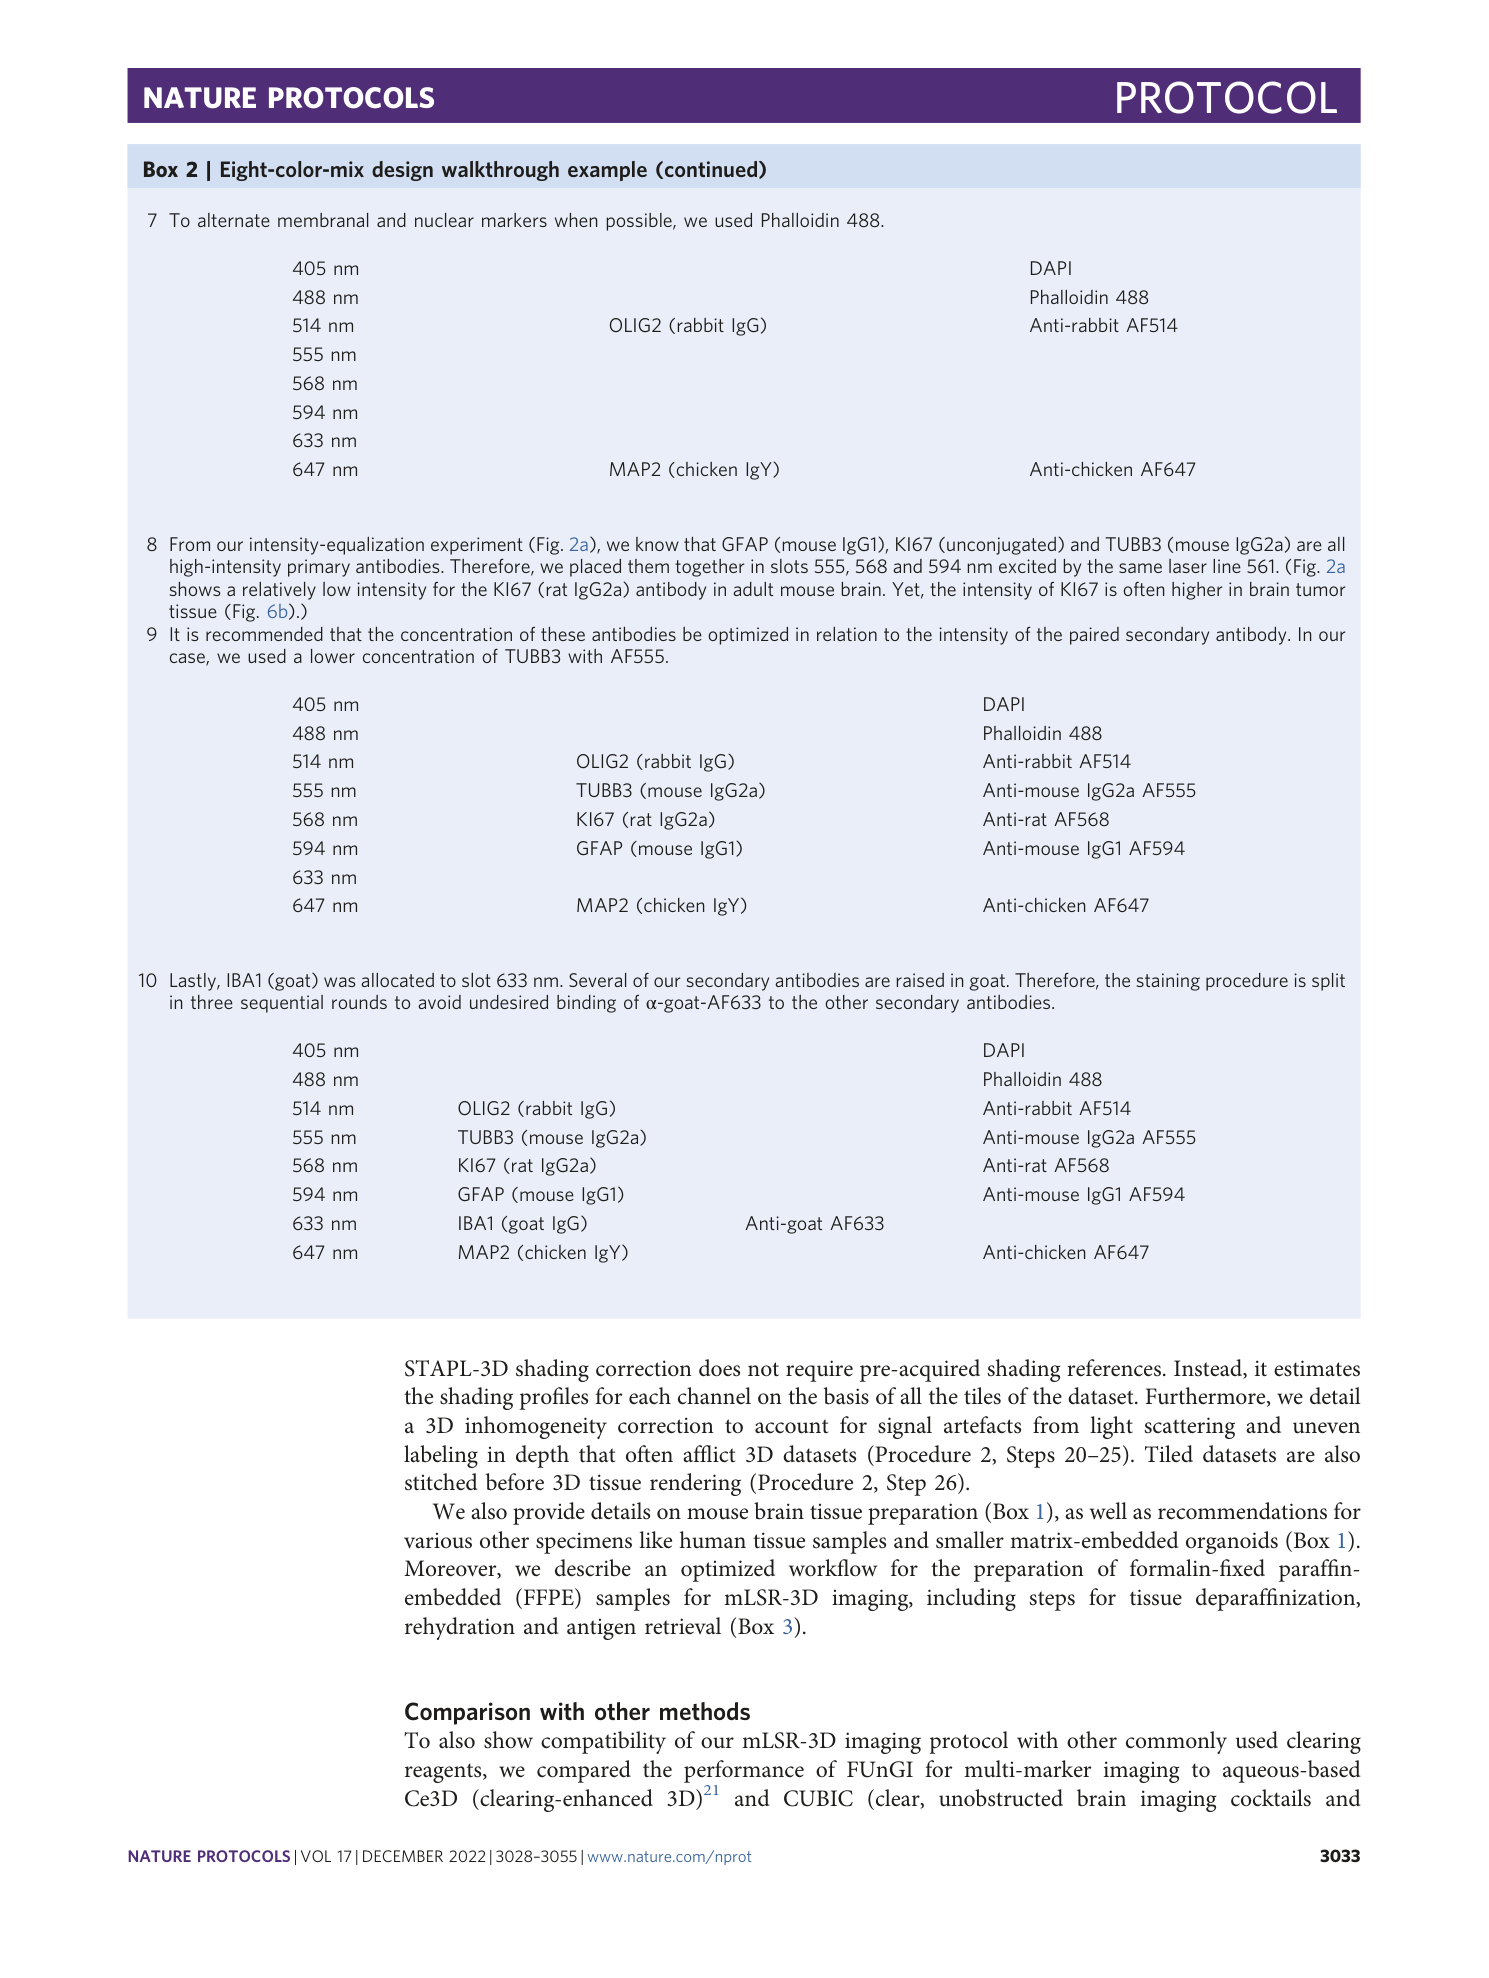
Extended Data Fig. 2 Clearing comparison.
a , Widefield microscopic images of human embryonic kidney tissues uncleared or cleared with FUnGI, Ce3D, CUBIC or iDISCO. Squares represent 1 mm. b , Optical sections at two depths (surface and 100 μm) for all eight channels per condition. Red asterisks indicate lack of specific signal in this channel. Scale bars, 50 μm. c , Quantification of the 10% highest intensity pixels per z -plane per channel for every condition. Channels without sufficient specific signal indicated with a red asterisk were not quantified.
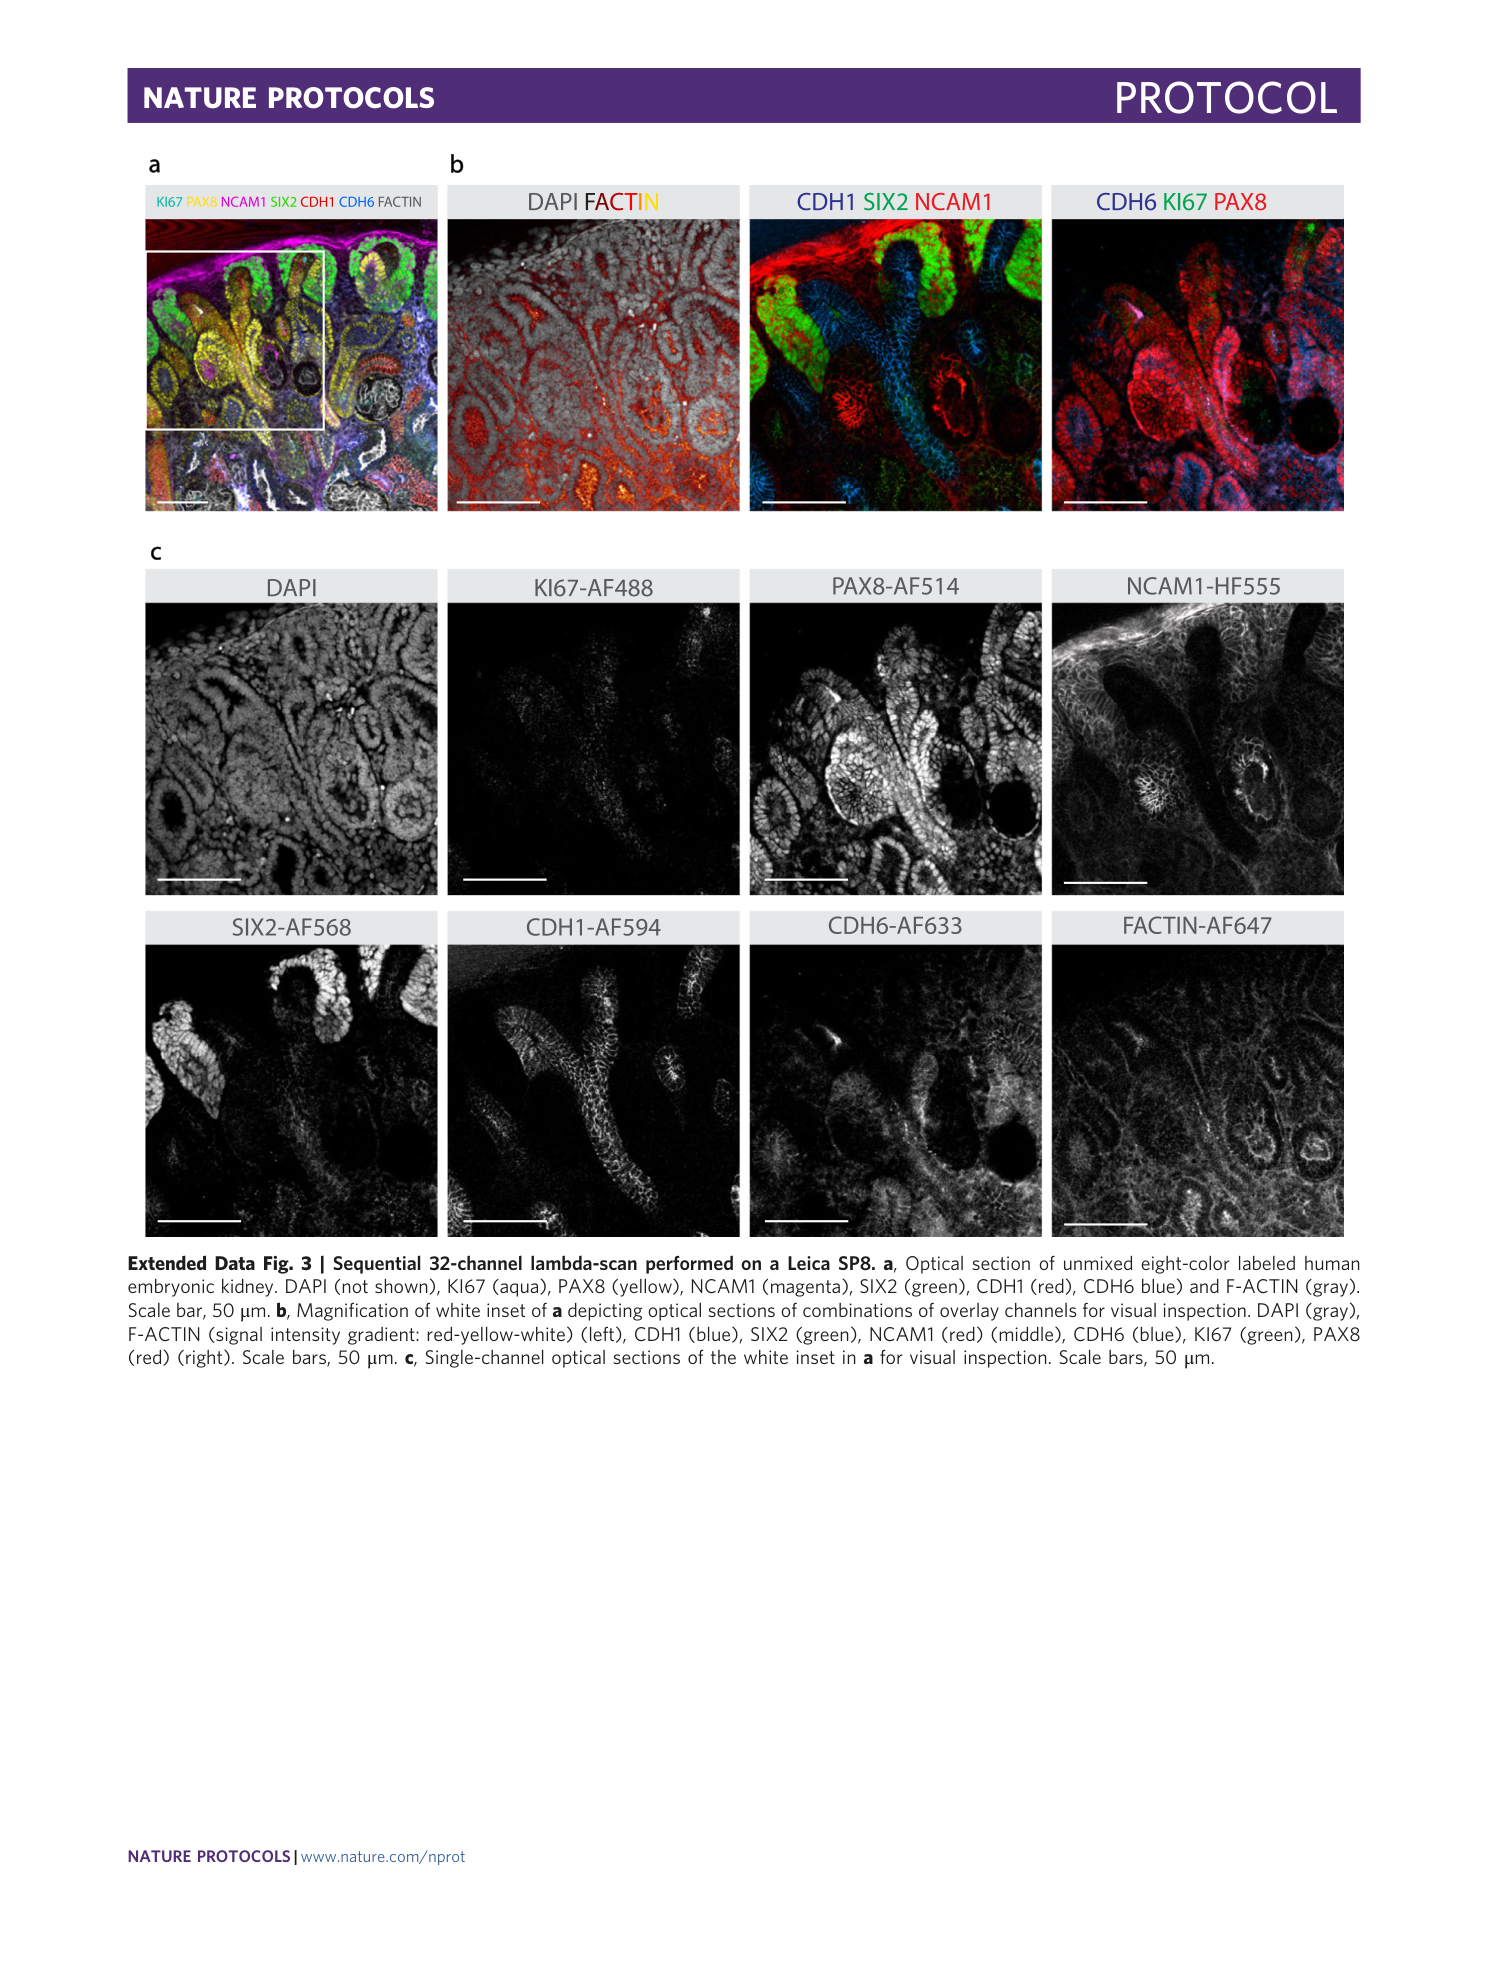
Extended Data Fig. 3 Sequential 32-channel lambda-scan performed on a Leica SP8.
a , Optical section of unmixed eight-color labeled human embryonic kidney. DAPI (not shown), KI67 (aqua), PAX8 (yellow), NCAM1 (magenta), SIX2 (green), CDH1 (red), CDH6 blue) and F-ACTIN (gray). Scale bar, 50 μm. b , Magnification of white inset of a depicting optical sections of combinations of overlay channels for visual inspection. DAPI (gray), F-ACTIN (signal intensity gradient: red-yellow-white) (left), CDH1 (blue), SIX2 (green), NCAM1 (red) (middle), CDH6 (blue), KI67 (green), PAX8 (red) (right). Scale bars, 50 μm. c , Single-channel optical sections of the white inset in a for visual inspection. Scale bars, 50 μm.
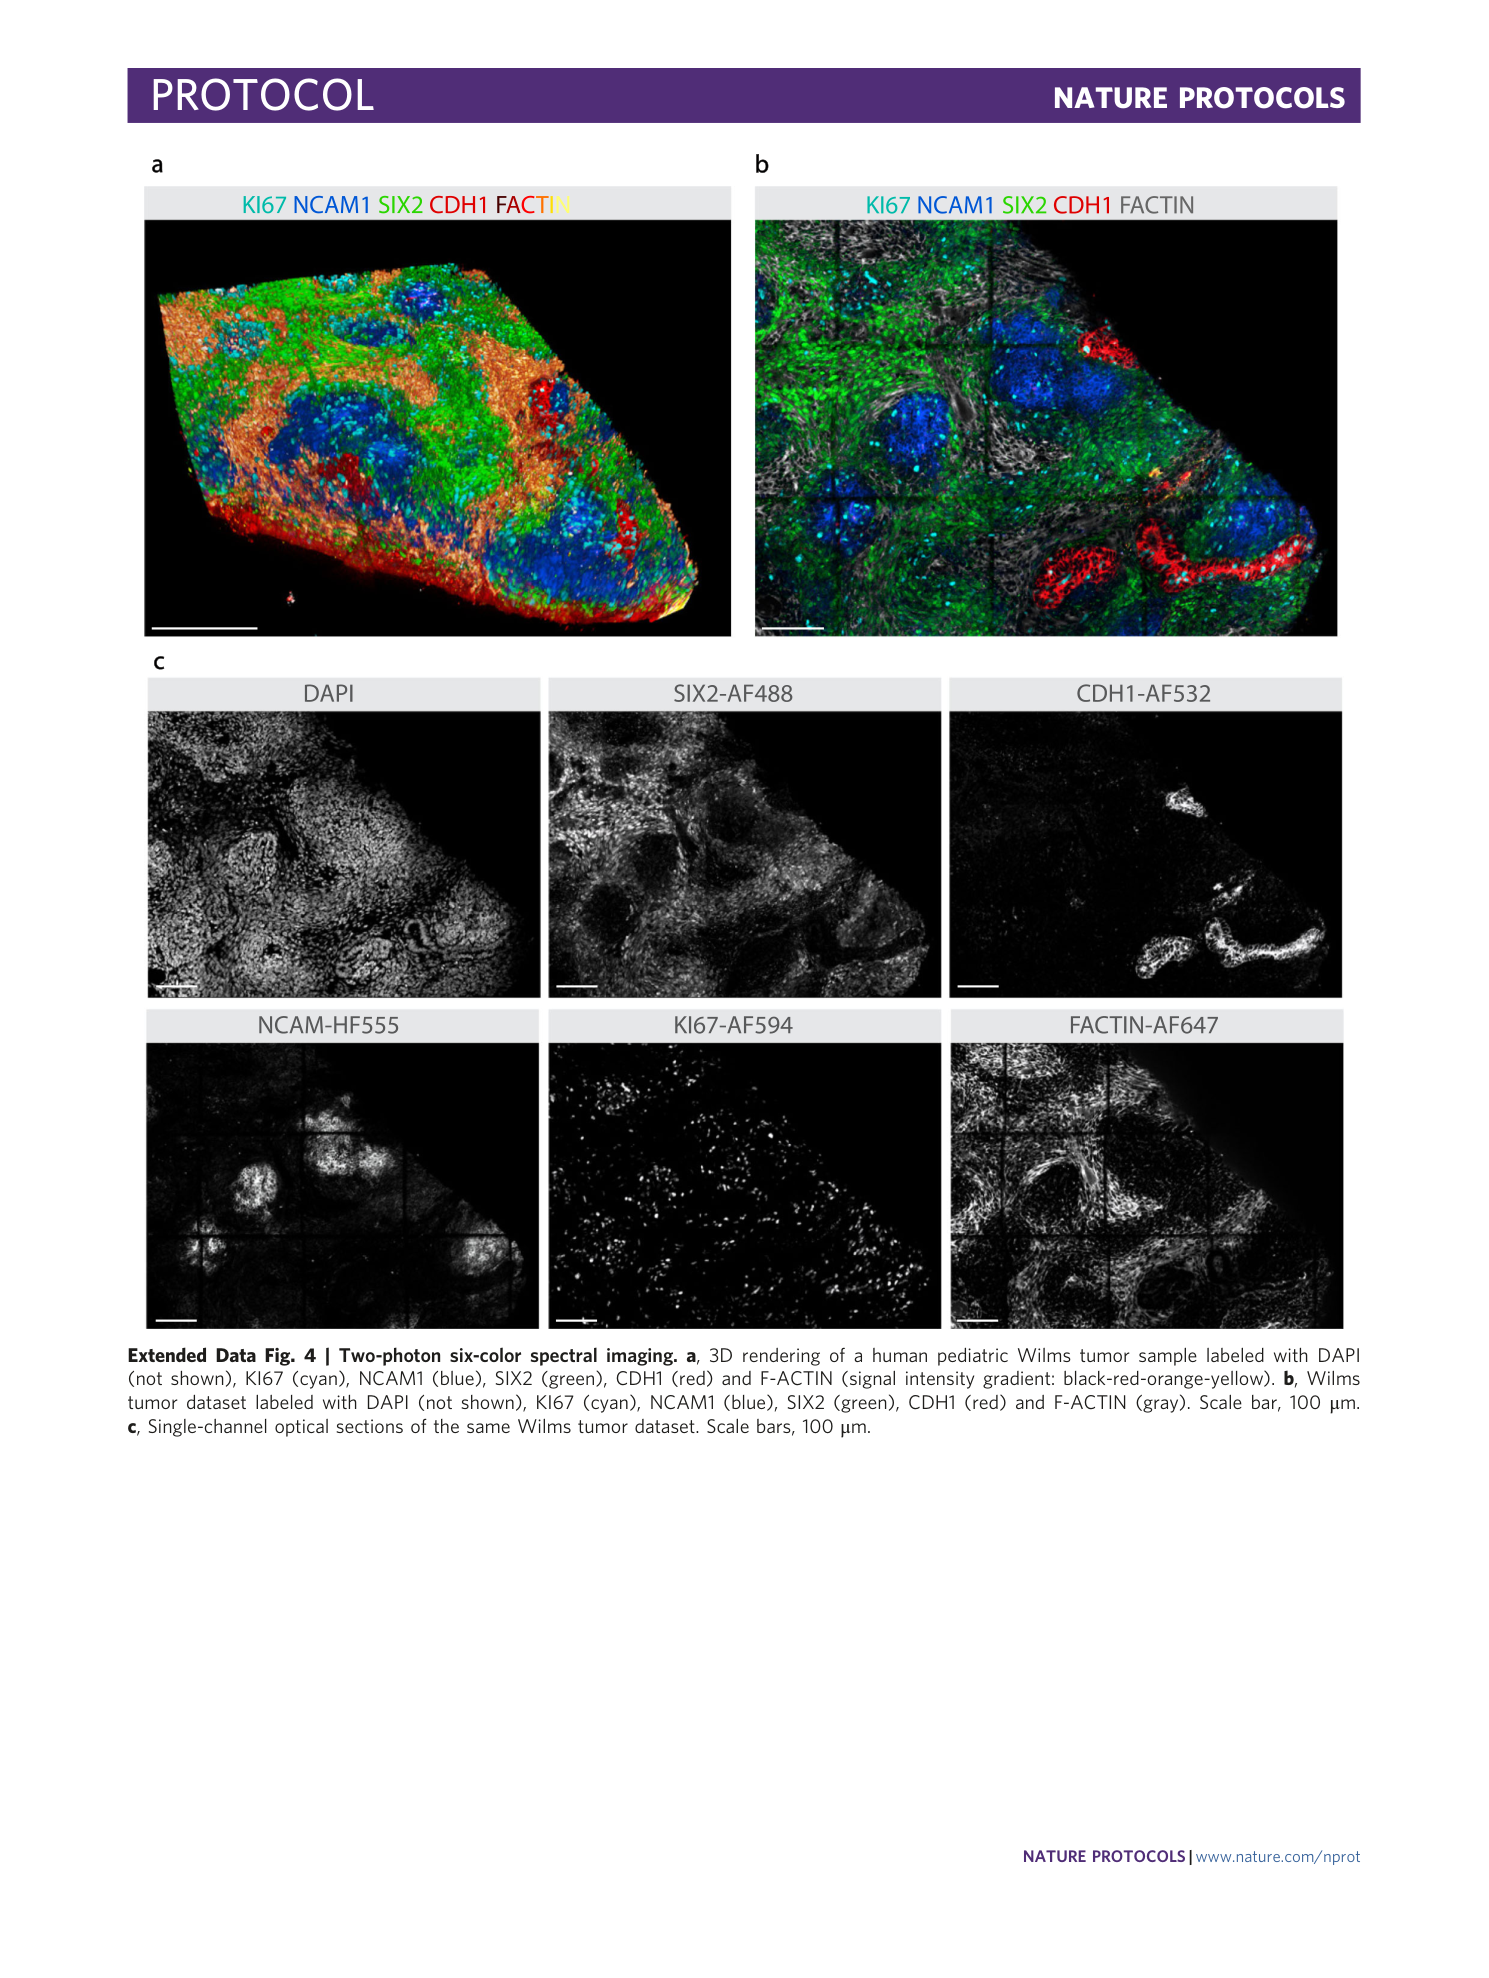
Extended Data Fig. 4 Two-photon six-color spectral imaging.
a , 3D rendering of a human pediatric Wilms tumor sample labeled with DAPI (not shown), KI67 (cyan), NCAM1 (blue), SIX2 (green), CDH1 (red) and F-ACTIN (signal intensity gradient: black-red-orange-yellow). b , Wilms tumor dataset labeled with DAPI (not shown), KI67 (cyan), NCAM1 (blue), SIX2 (green), CDH1 (red) and F-ACTIN (gray). Scale bar, 100 μm. c , Single-channel optical sections of the same Wilms tumor dataset. Scale bars, 100 μm.
Supplementary information
Supplementary Information
Supplementary Methods and Supplementary Tables 1 and 2.
Supplementary Movie 1
Summary movie of the mLSR-3D protocol. 0:40–0:50, Optical section z -stack fly-through animation of human embryonic kidney labeled with DAPI (not shown), KI67 (cyan), PAX8 (yellow), NCAM1 (blue), SIX2 (green), CDH1 (red), CDH6 (orange) and F ACTIN (black-red-yellow-white). This movie has been modified from ref. 26 . 1:00–1:20, Animation depicting the 3D rendering of breast cancer organoids from Fig. 3d labeled with DAPI (gray), KI67 (green), B-CAT (yellow), CDH1 (red) and K8/18 (blue). 0:00–0:25, Animation depicting the 3D rendering of low-grade glioma from Fig. 6b labeled with DAPI (gray), F ACTIN (black-red-yellow-white), OLIG2 (magenta), TUBB3 (yellow), KI67 (green), GFAP (red), IBA1 (blue) and MAP2 (cyan).
