Detecting chromosomal interactions in Capture Hi-C data with CHiCAGO and companion tools
Paula Freire-Pritchett, Helen Ray-Jones, Monica Della Rosa, Chris Q. Eijsbouts, William R. Orchard, Steven W. Wingett, Chris Wallace, Jonathan Cairns, Mikhail Spivakov, Valeriya Malysheva

Extended
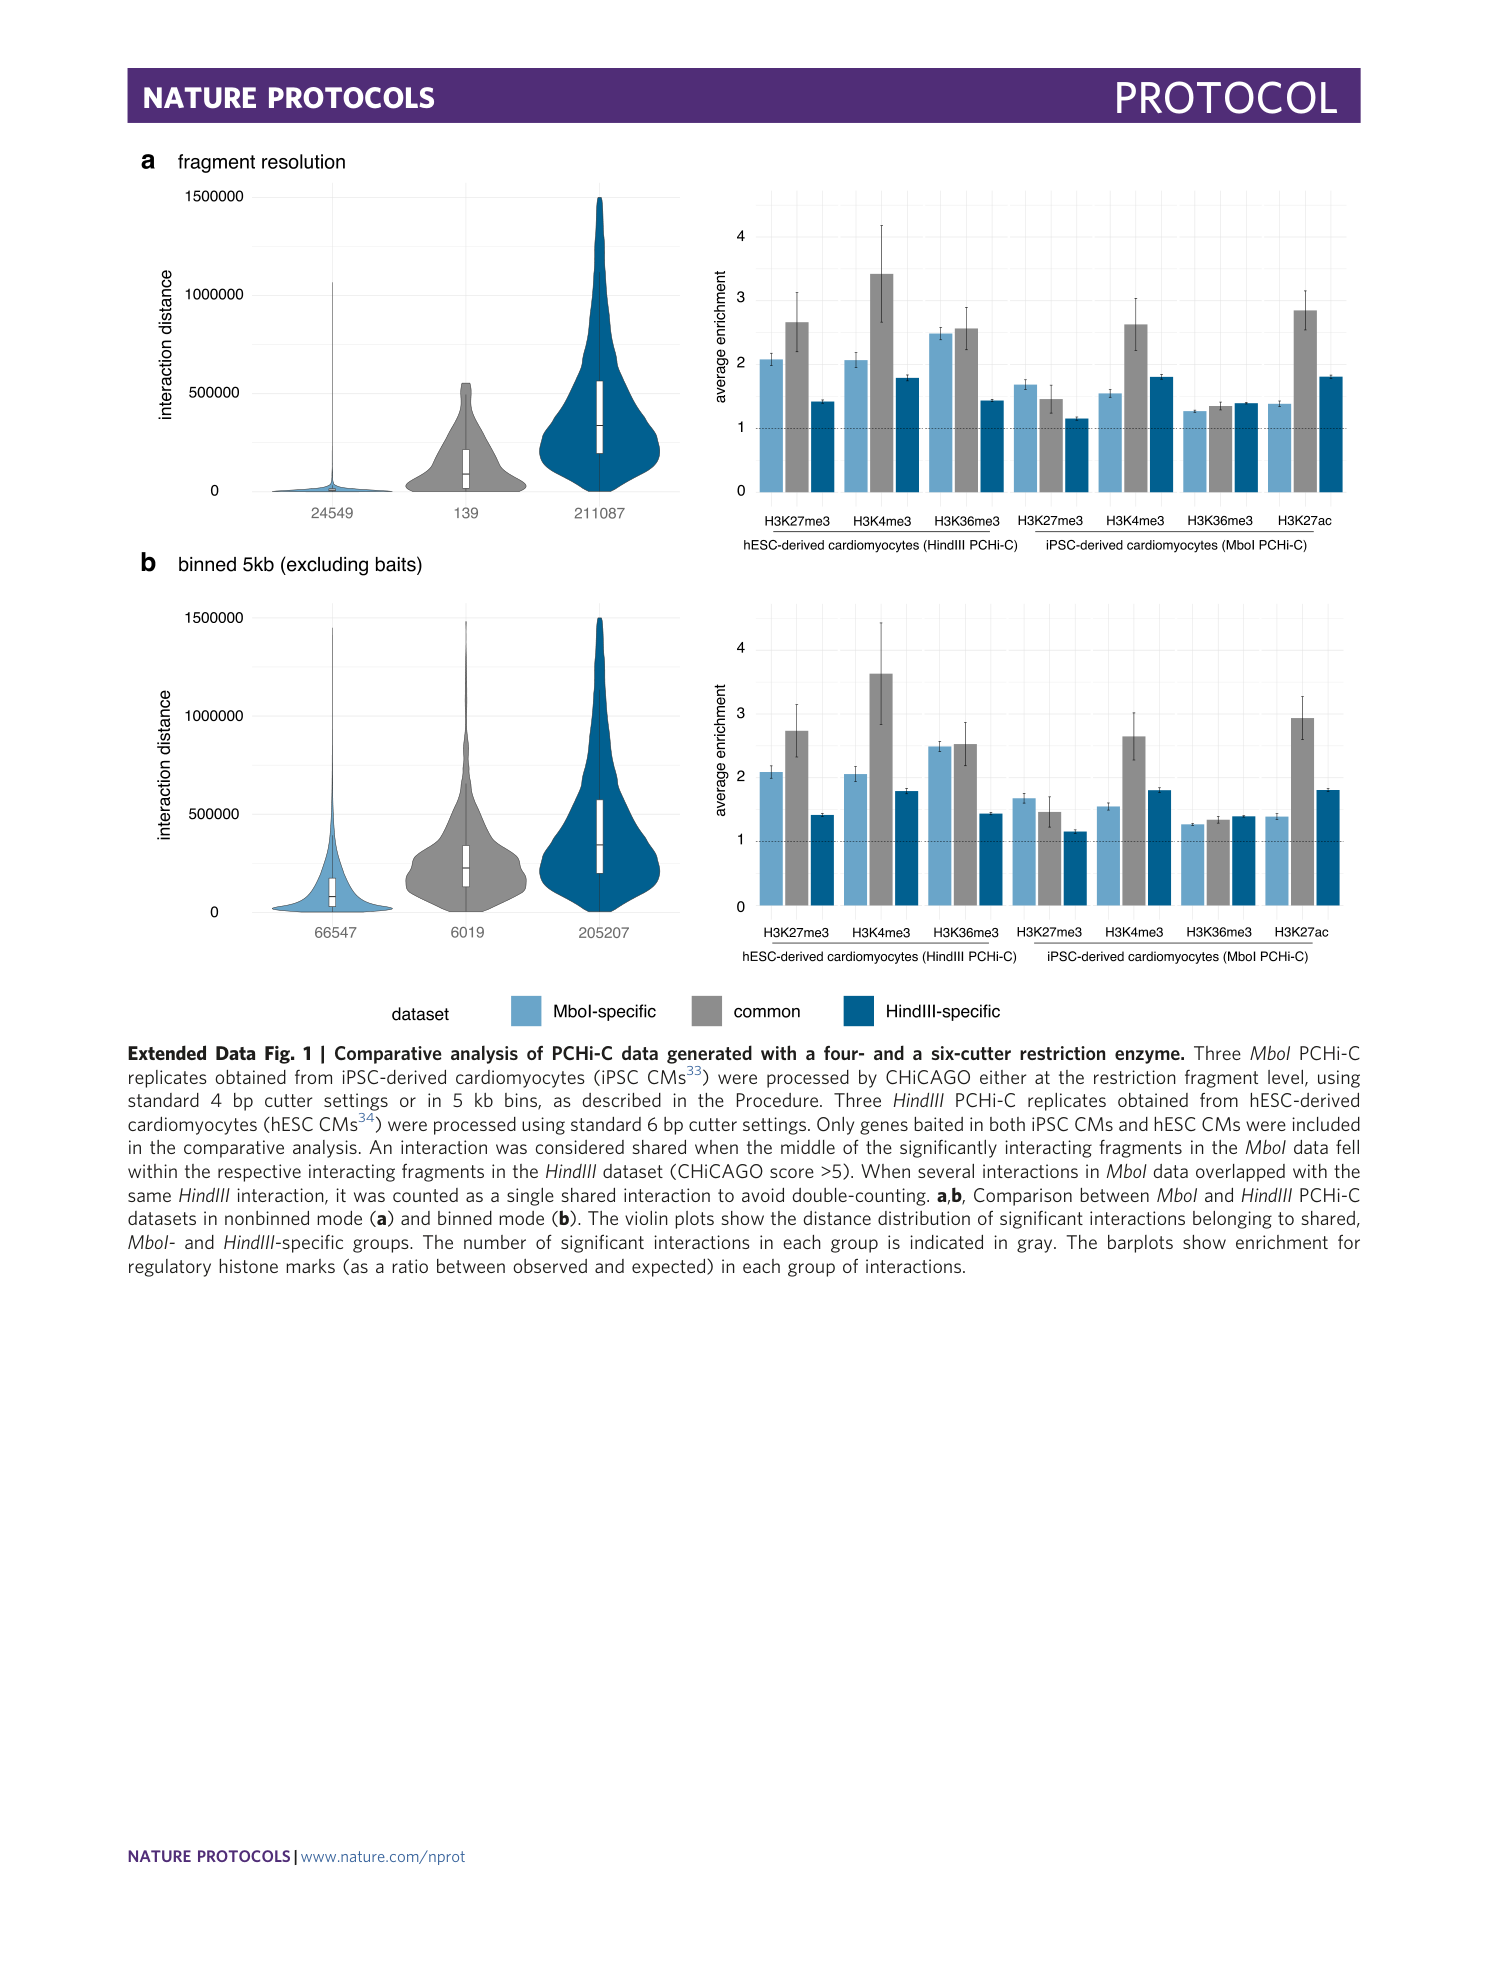
Extended Data Fig. 1 Comparative analysis of PCHi-C data generated with a four- and a six-cutter restriction enzyme.
Three MboI PCHi-C replicates obtained from iPSC-derived cardiomyocytes (iPSC CMs 33 ) were processed by CHiCAGO either at the restriction fragment level, using standard 4 bp cutter settings or in 5 kb bins, as described in the Procedure. Three HindIII PCHi-C replicates obtained from hESC-derived cardiomyocytes (hESC CMs 34 ) were processed using standard 6 bp cutter settings. Only genes baited in both iPSC CMs and hESC CMs were included in the comparative analysis. An interaction was considered shared when the middle of the significantly interacting fragments in the MboI data fell within the respective interacting fragments in the HindIII dataset (CHiCAGO score >5). When several interactions in MboI data overlapped with the same HindIII interaction, it was counted as a single shared interaction to avoid double-counting. a , b , Comparison between MboI and HindIII PCHi-C datasets in nonbinned mode ( a ) and binned mode ( b ). The violin plots show the distance distribution of significant interactions belonging to shared, MboI- and HindIII -specific groups. The number of significant interactions in each group is indicated in gray. The barplots show enrichment for regulatory histone marks (as a ratio between observed and expected) in each group of interactions.
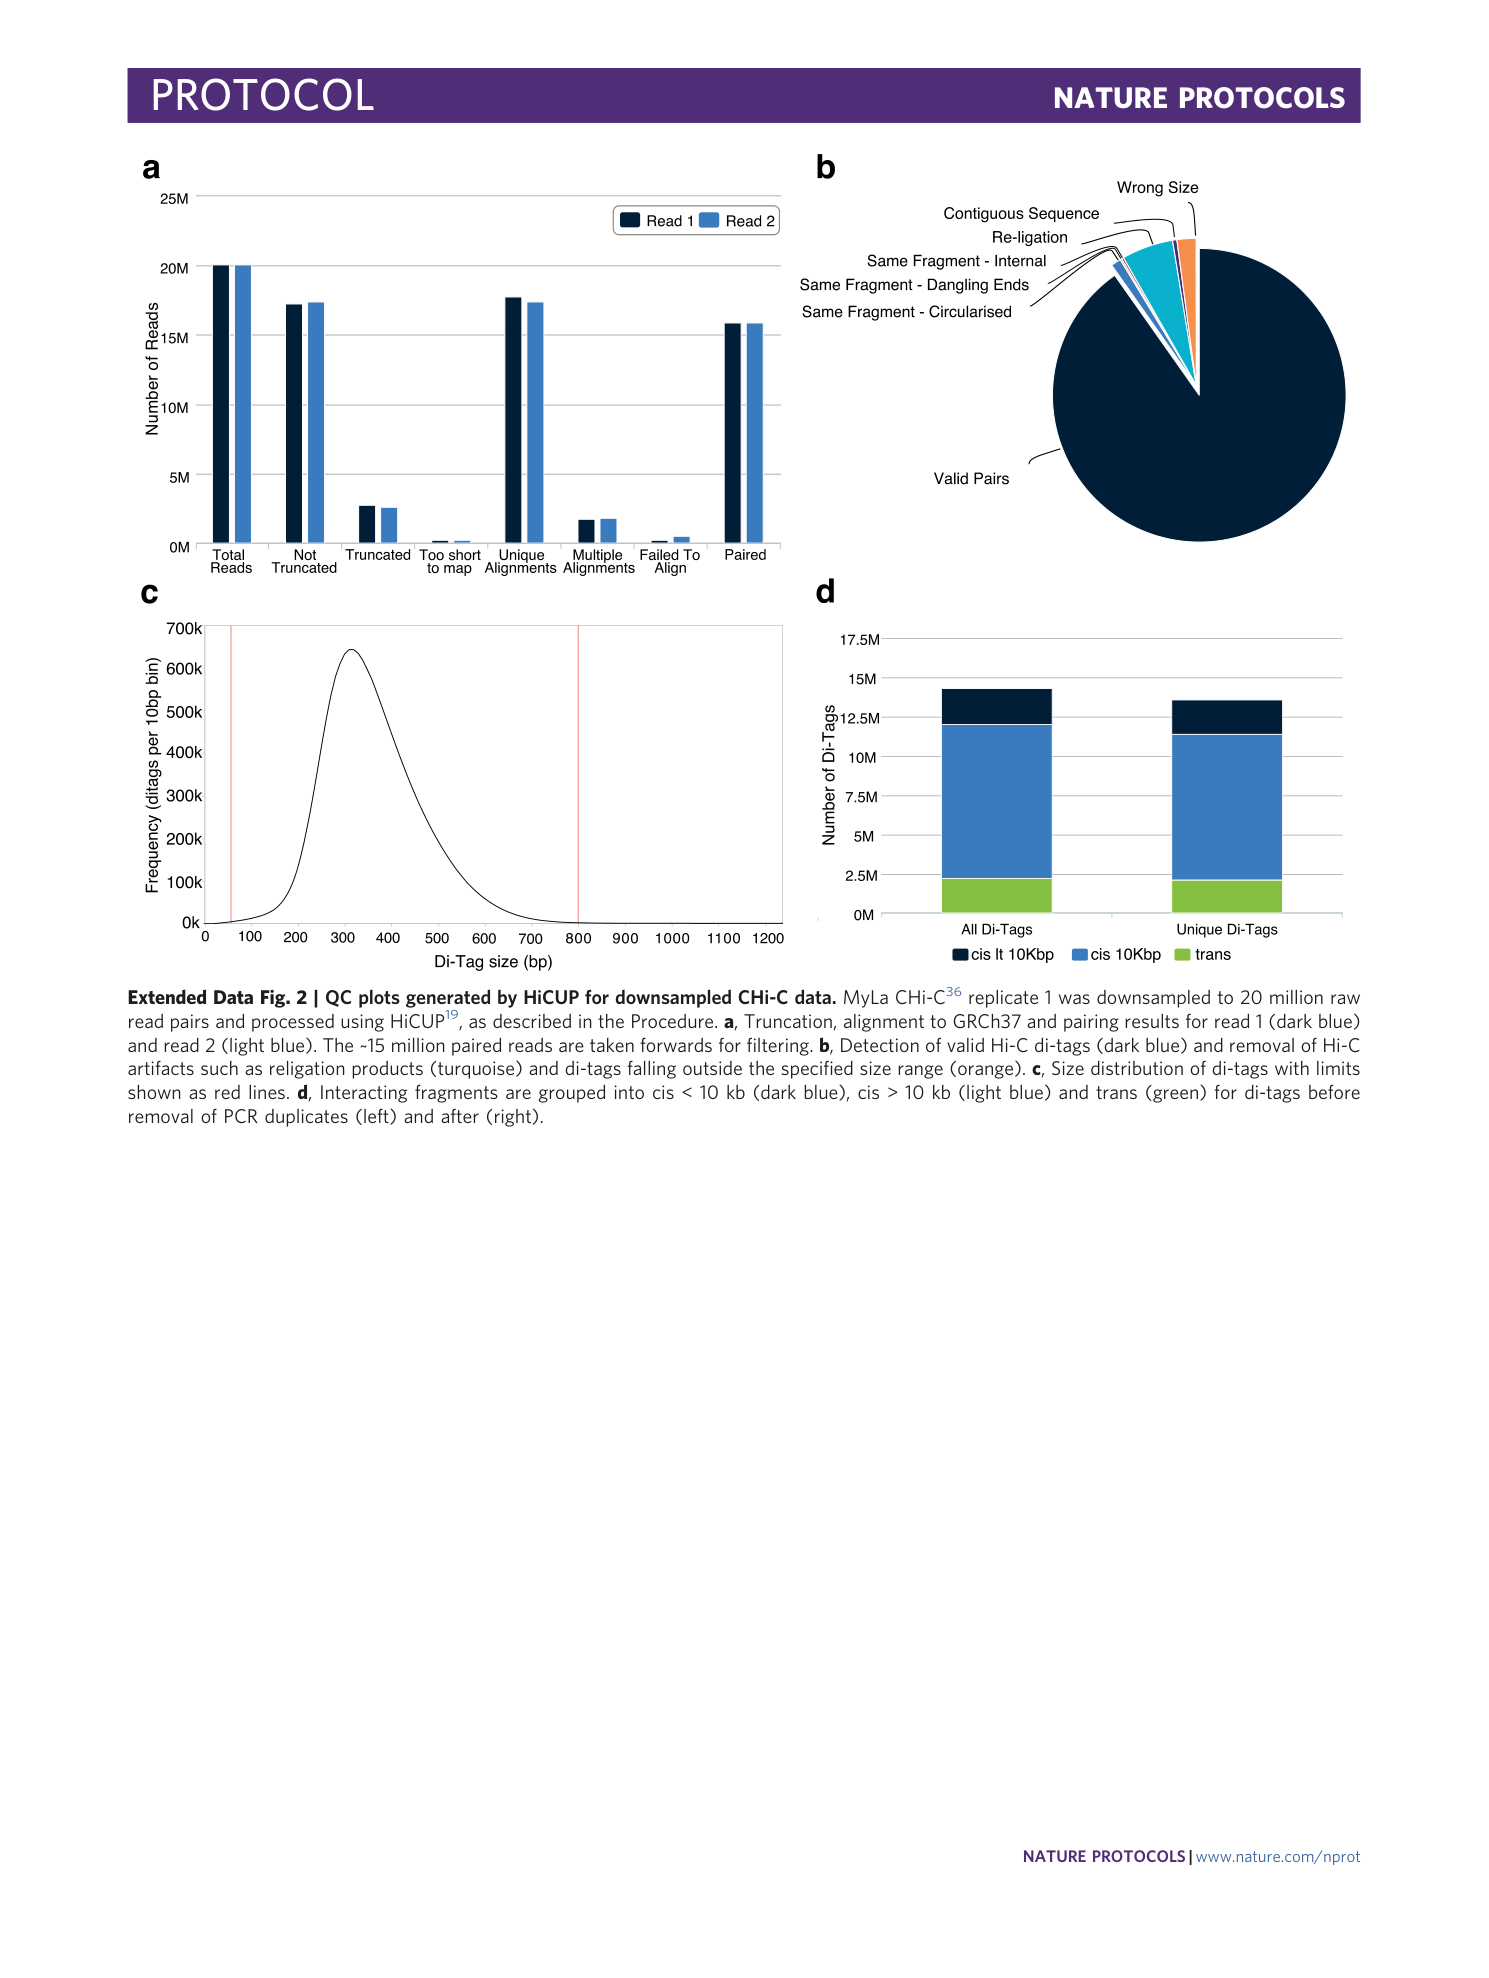
Extended Data Fig. 2 QC plots generated by HiCUP for downsampled CHi-C data.
MyLa CHi-C 36 replicate 1 was downsampled to 20 million raw read pairs and processed using HiCUP 19 , as described in the Procedure. a , Truncation, alignment to GRCh37 and pairing results for read 1 (dark blue) and read 2 (light blue). The ~15 million paired reads are taken forwards for filtering. b , Detection of valid Hi-C di-tags (dark blue) and removal of Hi-C artifacts such as religation products (turquoise) and di-tags falling outside the specified size range (orange). c , Size distribution of di-tags with limits shown as red lines. d , Interacting fragments are grouped into cis < 10 kb (dark blue), cis > 10 kb (light blue) and trans (green) for di-tags before removal of PCR duplicates (left) and after (right).
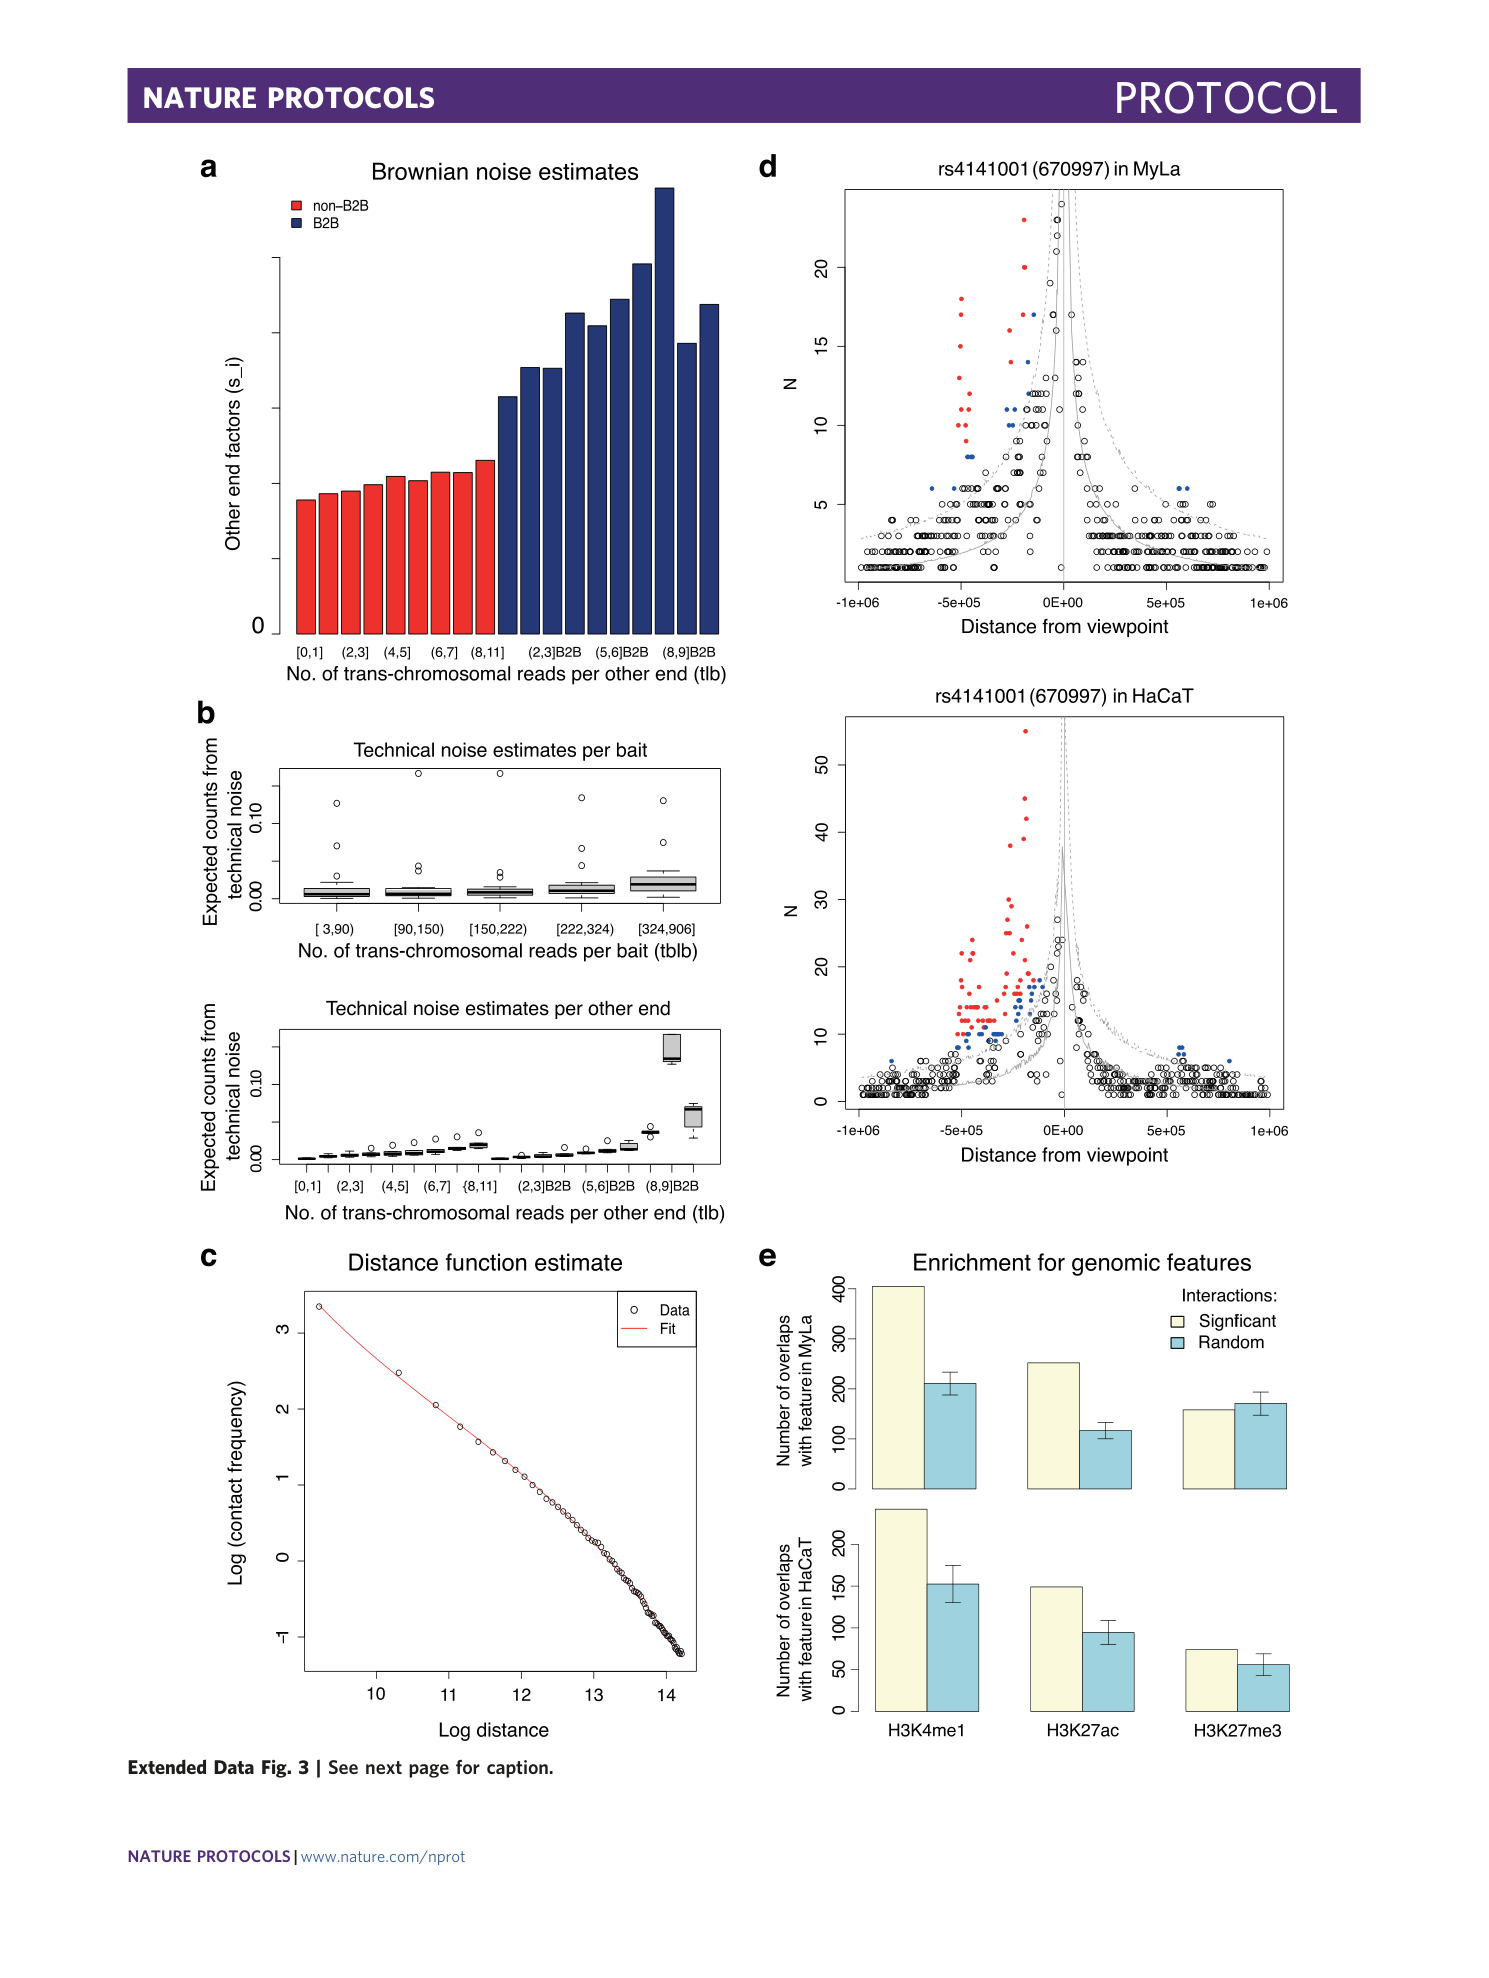
Extended Data Fig. 3 QC plots generated by CHiCAGO for downsampled CHi-C data.
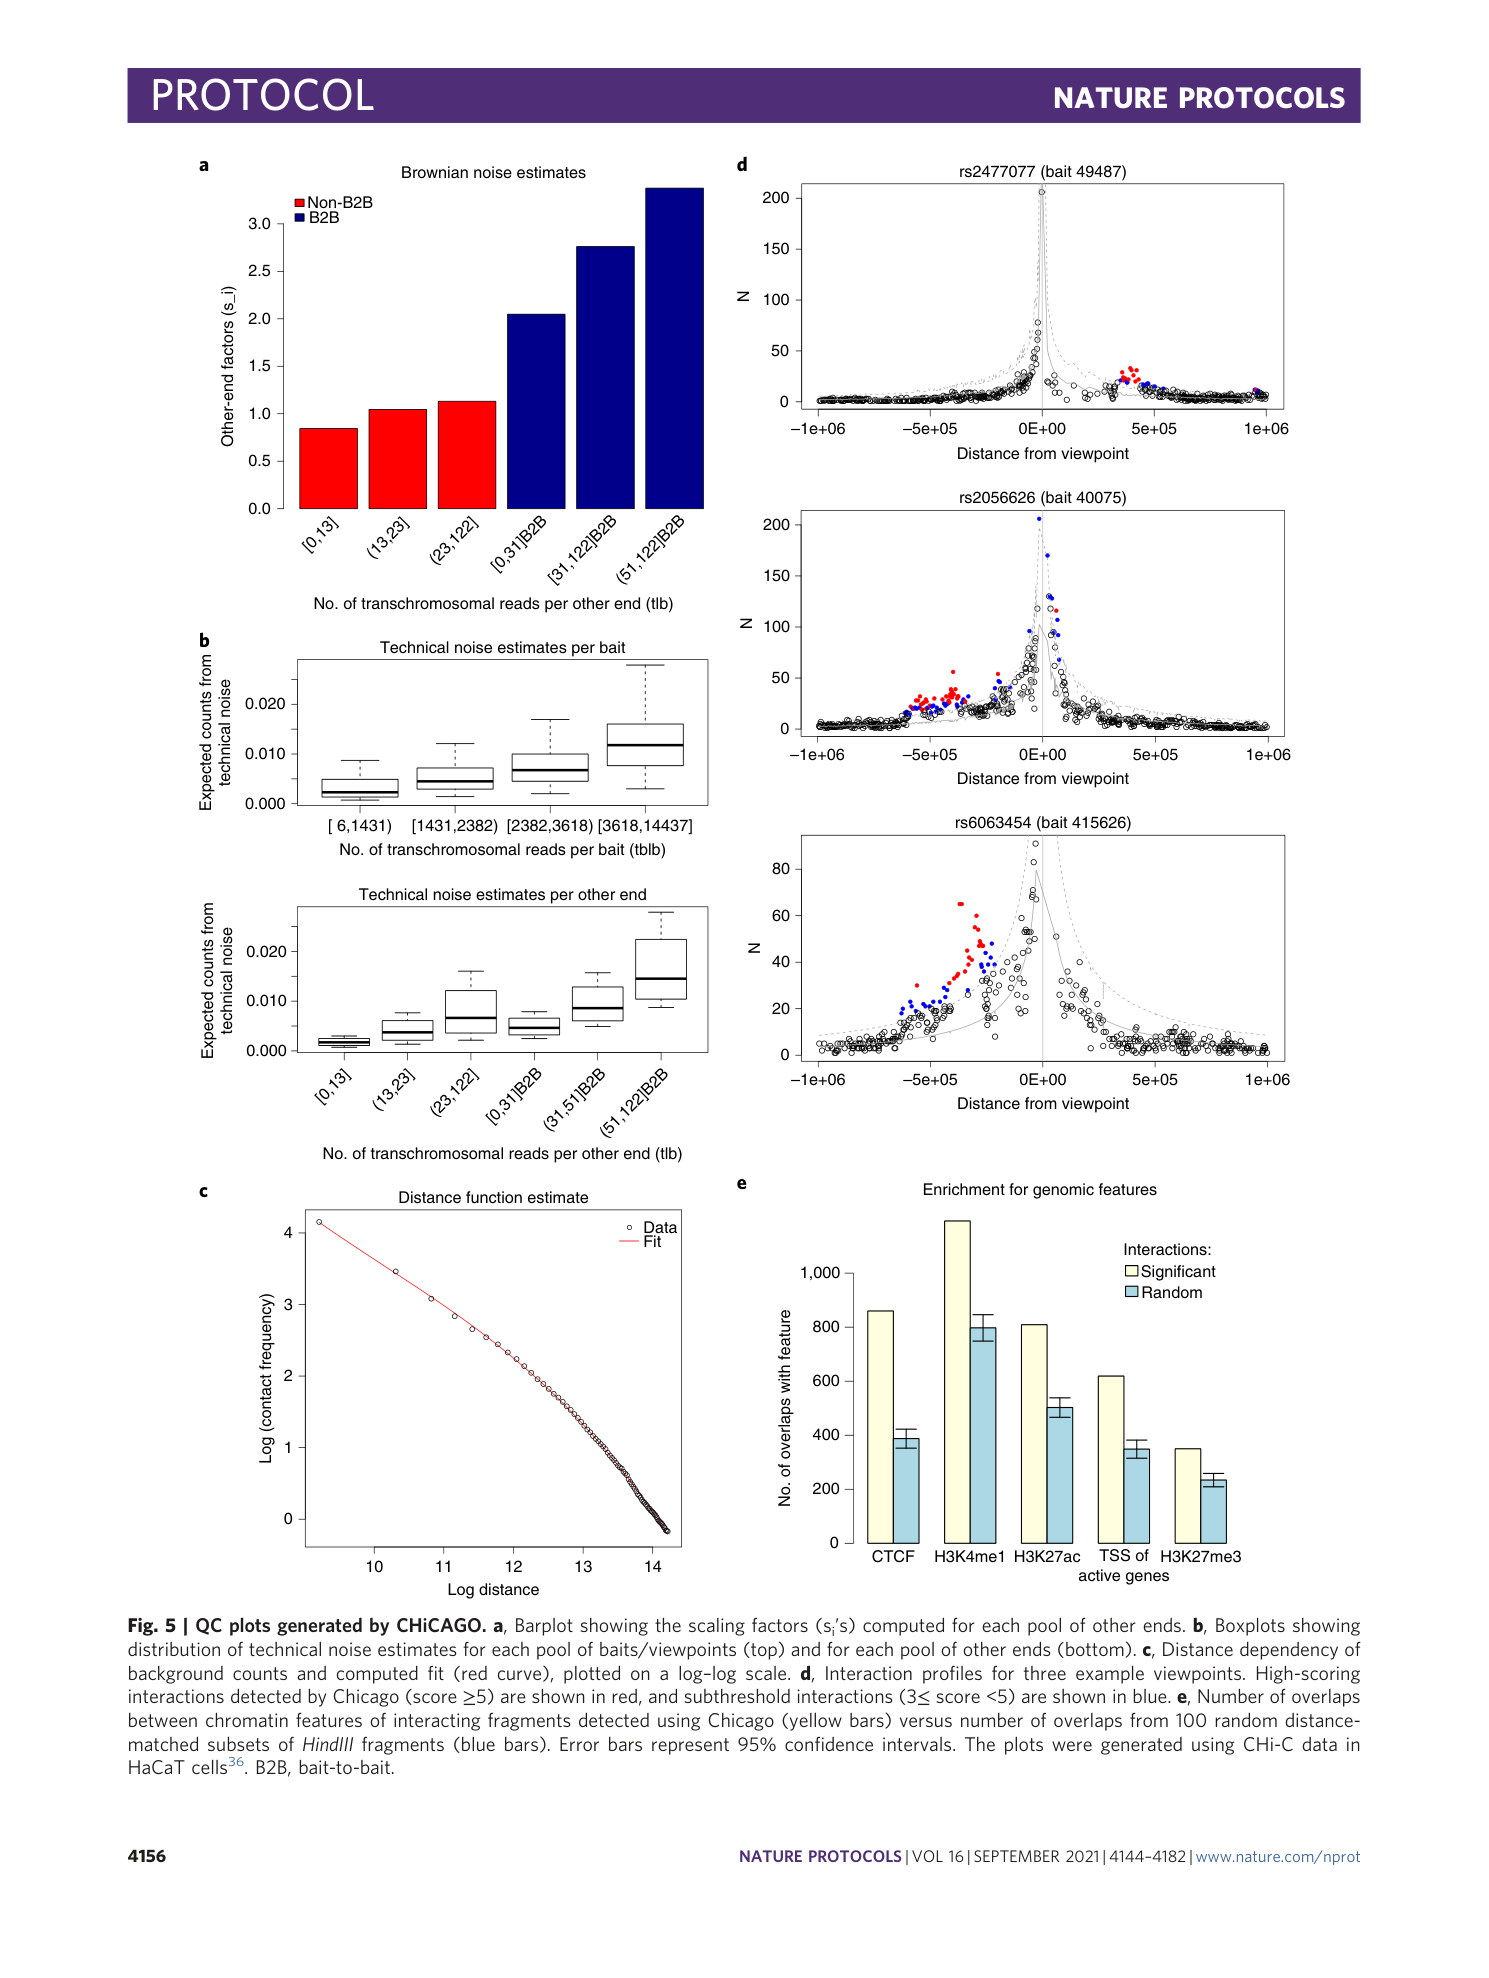
Downsampled CHi-C datasets 36 were processed by CHiCAGO using both replicates per cell line as described in the Procedure. a , Barplot showing the scaling factors (s i ’s) computed for each pool of other ends for MyLa. b , Boxplots showing distribution of technical noise estimates for each pool of baits/viewpoints (top) and for each pool of other ends (bottom) for MyLa. c , Distance dependency of background counts and computed fit (red curve), plotted on a log–log scale for MyLa. d , Interaction profiles for the bait 670997, assigned to rs4141001, in MyLa (top) and HaCaT (bottom). High-scoring interactions detected by CHiCAGO (score ≥5) are shown in red, and subthreshold interactions (3 ≤ score < 5) are shown in blue. e , Number of overlaps between chromatin features of interacting fragments detected using CHiCAGO (yellow bars) versus number of overlaps from 100 random distance-matched subsets of HindIII fragments (blue bars) in MyLa (top) and HaCaT (bottom). Error bars represent 95% confidence intervals.
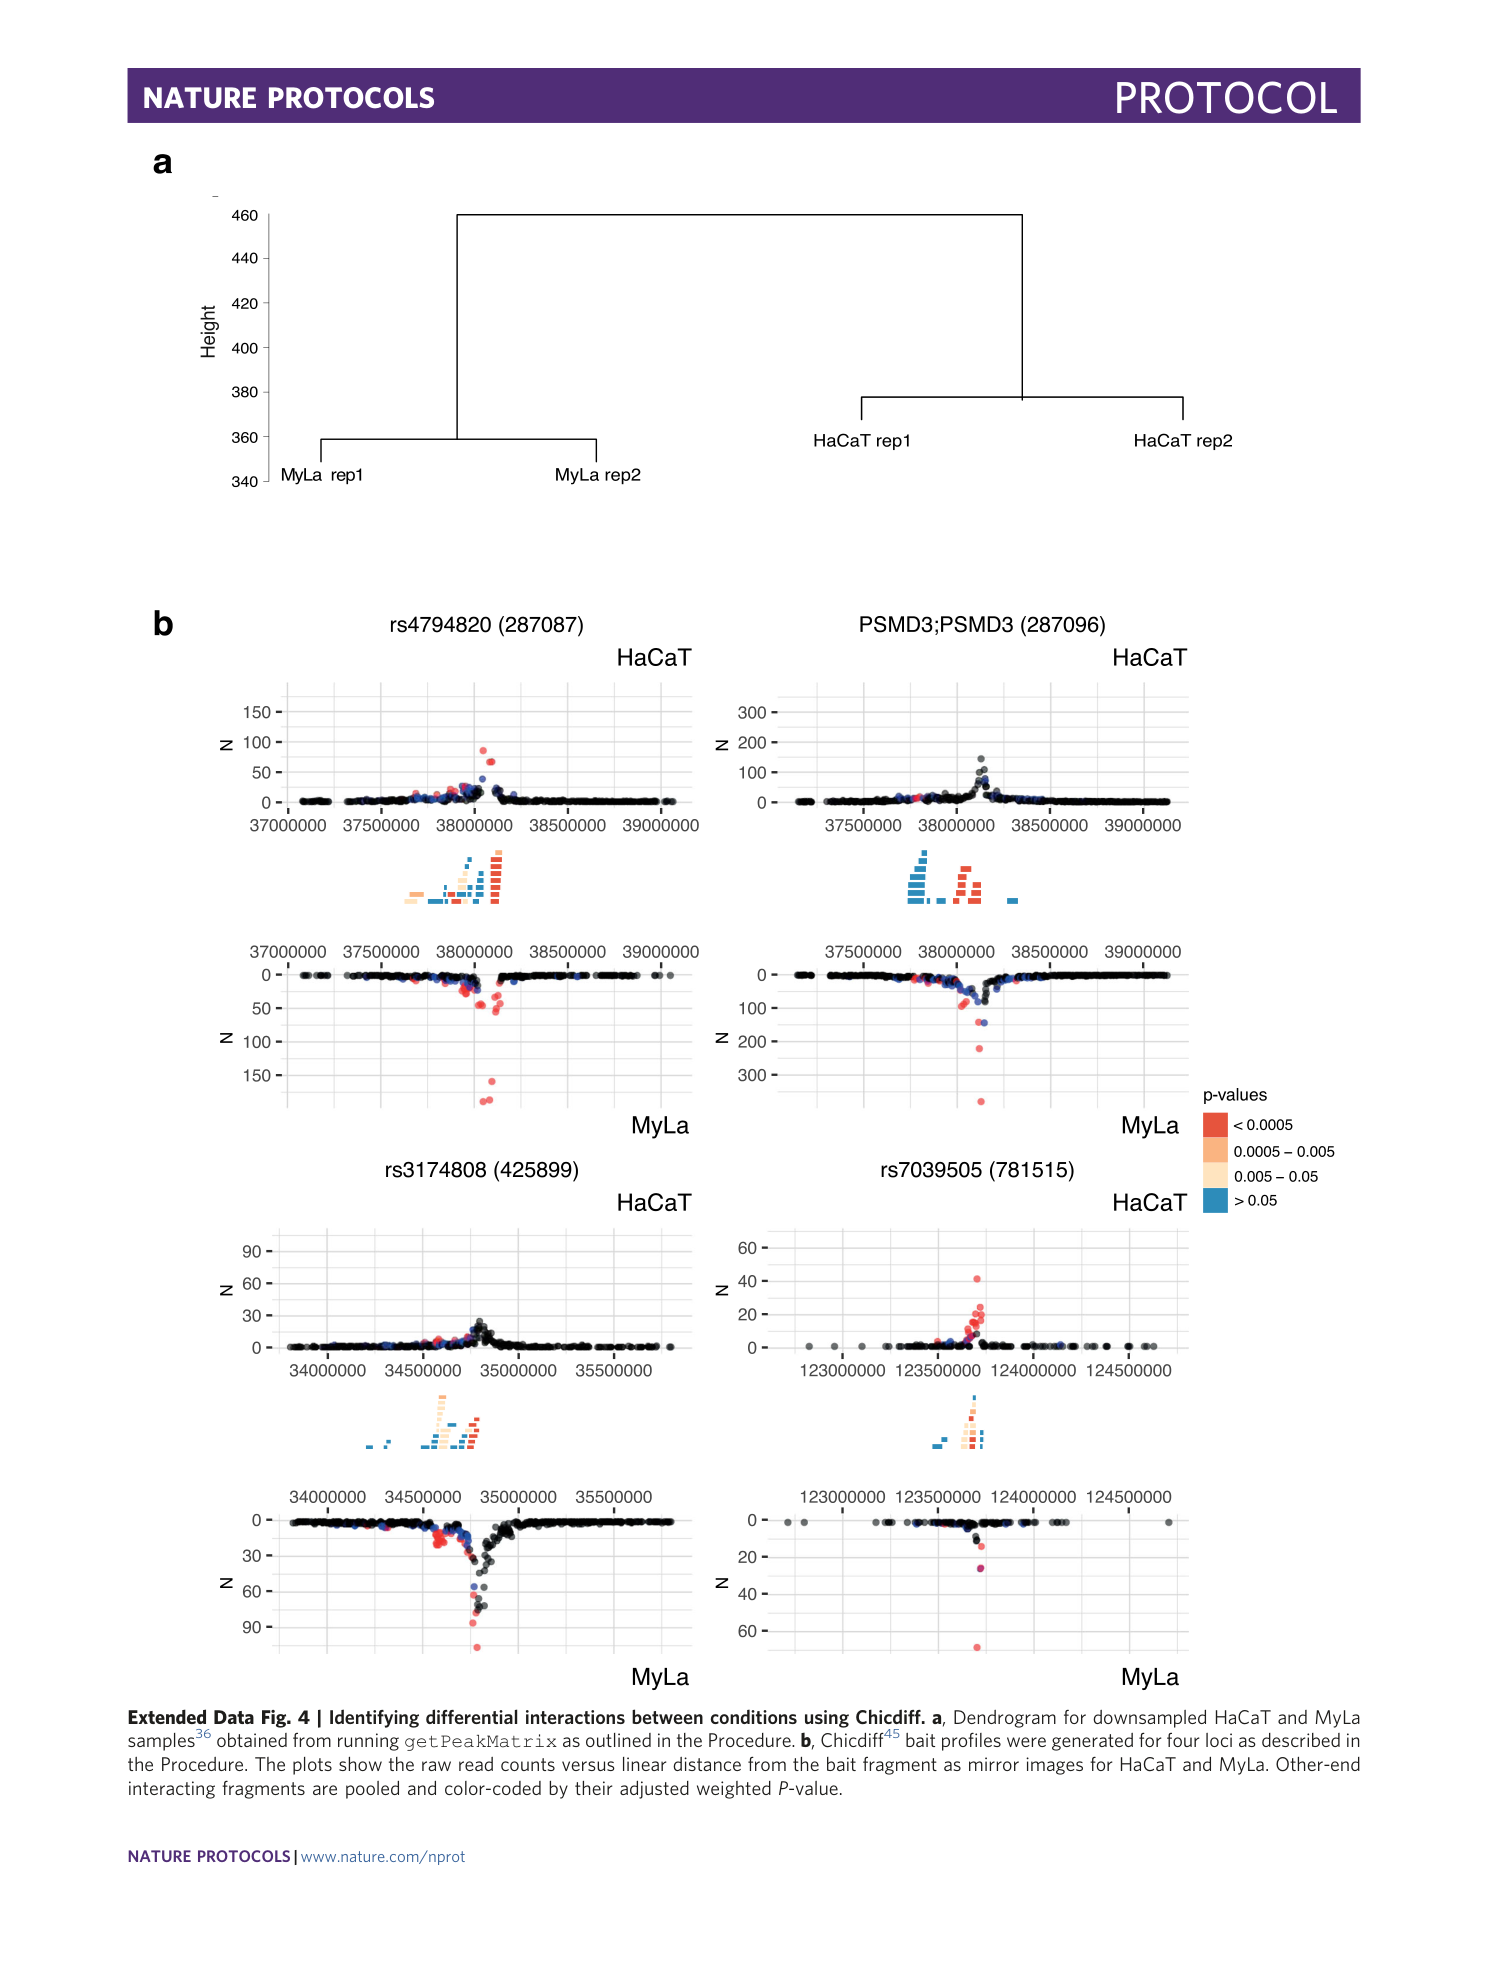
Extended Data Fig. 4 Identifying differential interactions between conditions using Chicdiff.
a , Dendrogram for downsampled HaCaT and MyLa samples 36 obtained from running getPeakMatrix as outlined in the Procedure. b , Chicdiff 45 bait profiles were generated for four loci as described in the Procedure. The plots show the raw read counts versus linear distance from the bait fragment as mirror images for HaCaT and MyLa. Other-end interacting fragments are pooled and color-coded by their adjusted weighted P -value.
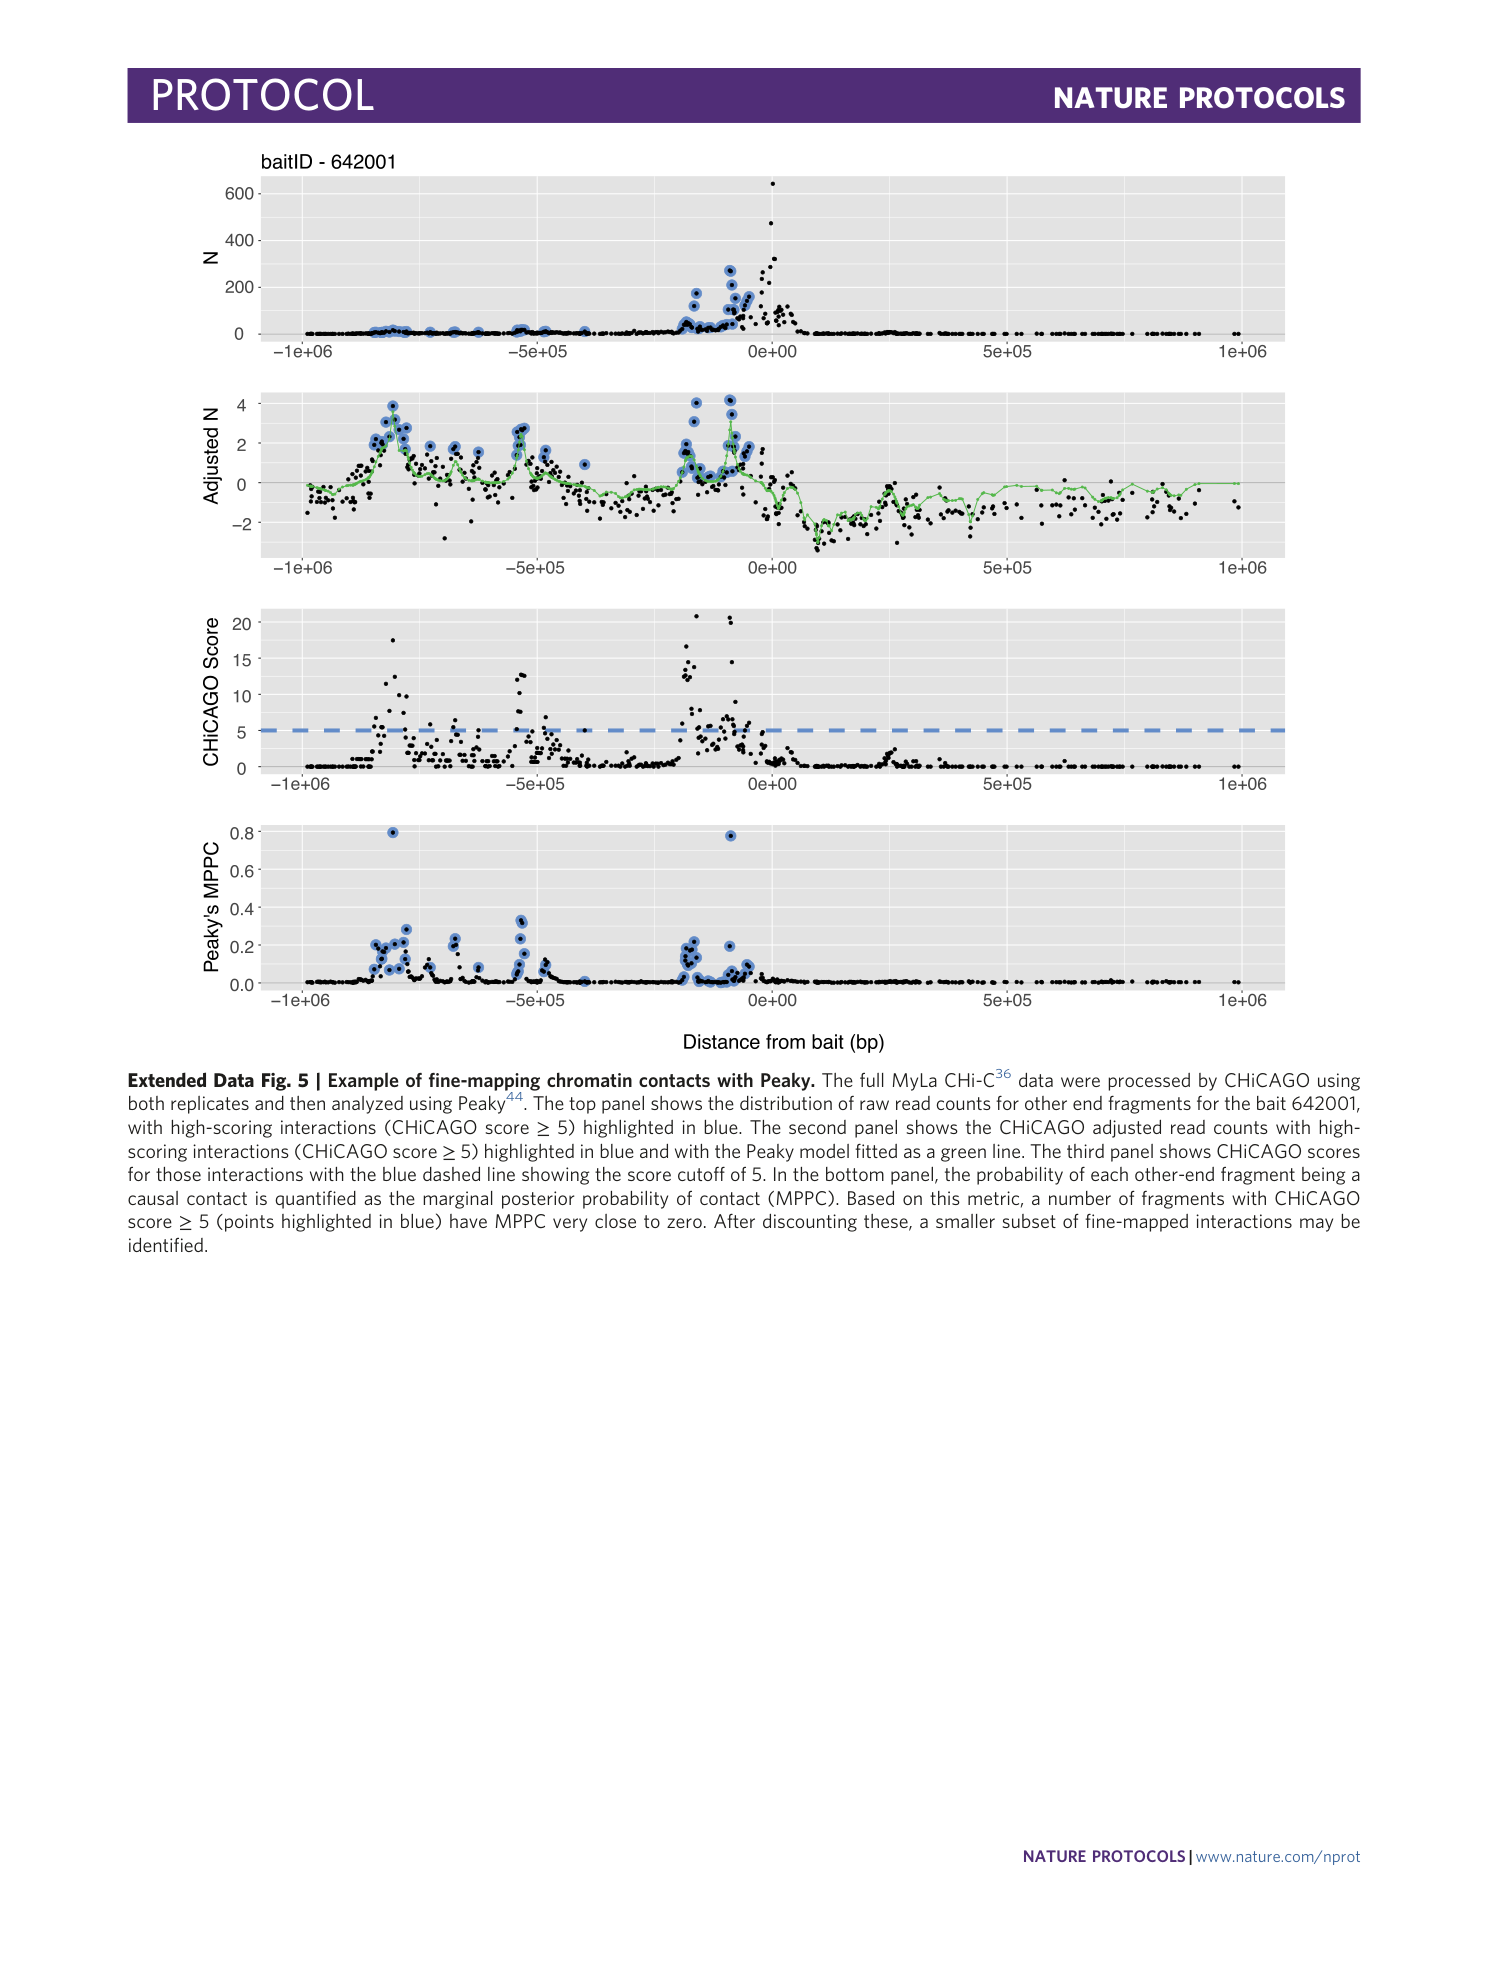
Extended Data Fig. 5 Example of fine-mapping chromatin contacts with Peaky.
The full MyLa CHi-C 36 data were processed by CHiCAGO using both replicates and then analyzed using Peaky 44 . The top panel shows the distribution of raw read counts for other end fragments for the bait 642001, with high-scoring interactions (CHiCAGO score ≥ 5) highlighted in blue. The second panel shows the CHiCAGO adjusted read counts with high-scoring interactions (CHiCAGO score ≥ 5) highlighted in blue and with the Peaky model fitted as a green line. The third panel shows CHiCAGO scores for those interactions with the blue dashed line showing the score cutoff of 5. In the bottom panel, the probability of each other-end fragment being a causal contact is quantified as the marginal posterior probability of contact (MPPC). Based on this metric, a number of fragments with CHiCAGO score ≥ 5 (points highlighted in blue) have MPPC very close to zero. After discounting these, a smaller subset of fine-mapped interactions may be identified.
Supplementary information
Supplementary Information
Supplementary Tables 1 and 2.
