Activation of mechanoluminescent nanotransducers by focused ultrasound enables light delivery to deep-seated tissue in vivo
Shan Jiang, Xiang Wu, Fan Yang, Nicholas J. Rommelfanger, Guosong Hong
mechanoluminescent nanotransducers
focused ultrasound
deep-tissue light delivery
optogenetic neuromodulation
noninvasive illumination


Extended
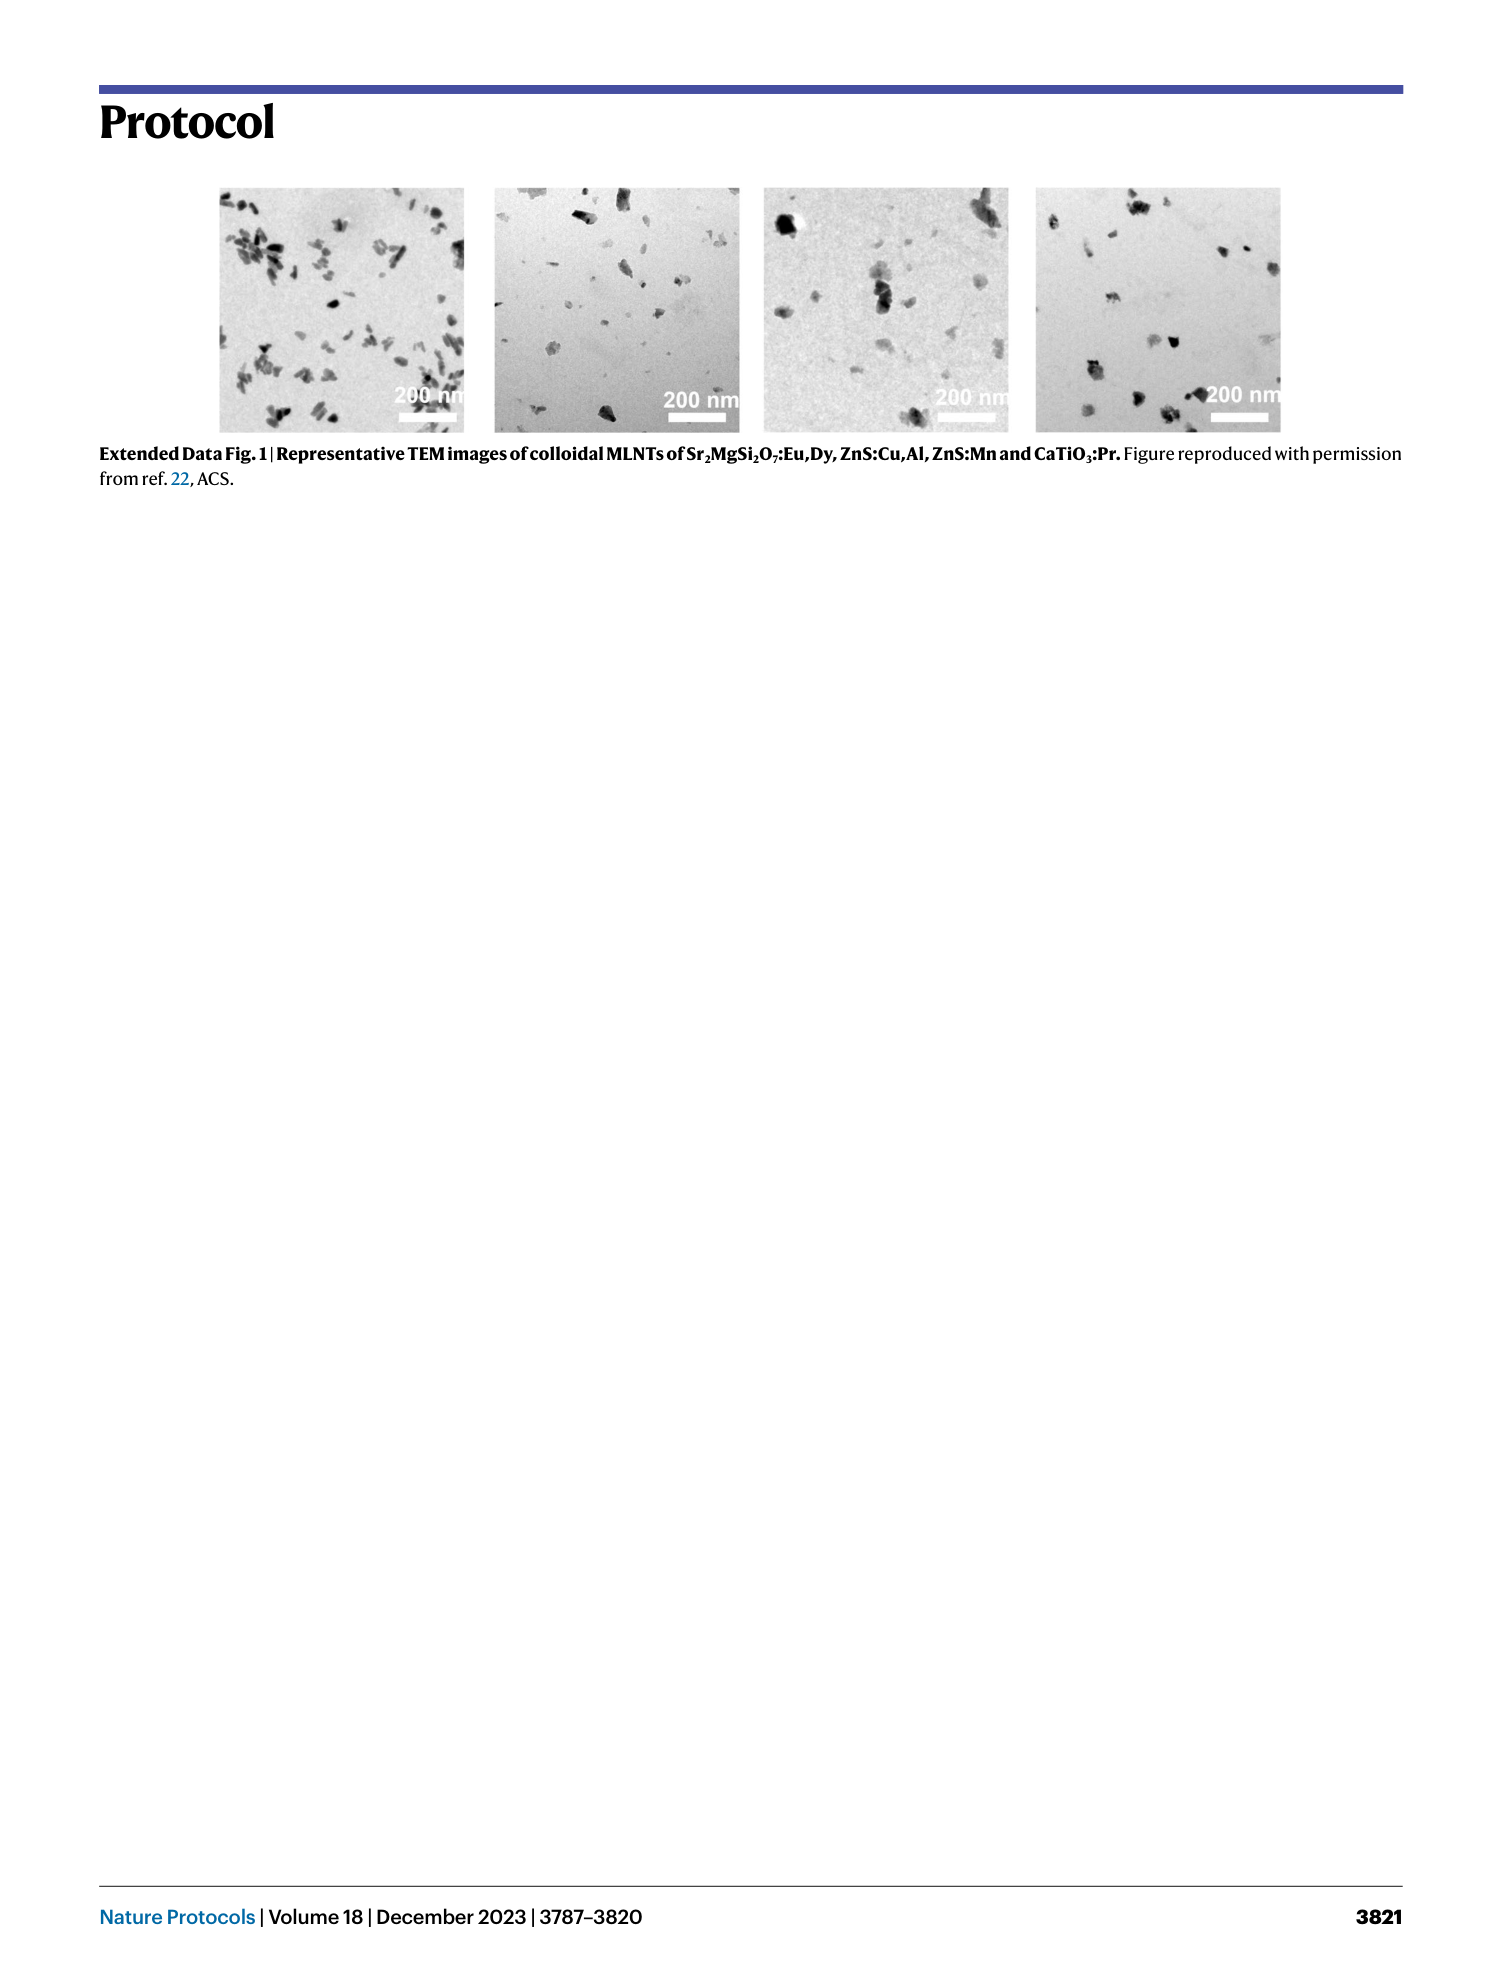
Extended Data Fig. 1
Representative TEM images of colloidal MLNTs of Sr 2 MgSi 2 O 7 :Eu,Dy, ZnS:Cu,Al, ZnS:Mn and CaTiO 3 :Pr. Figure reproduced with permission from ref. 22 , ACS.
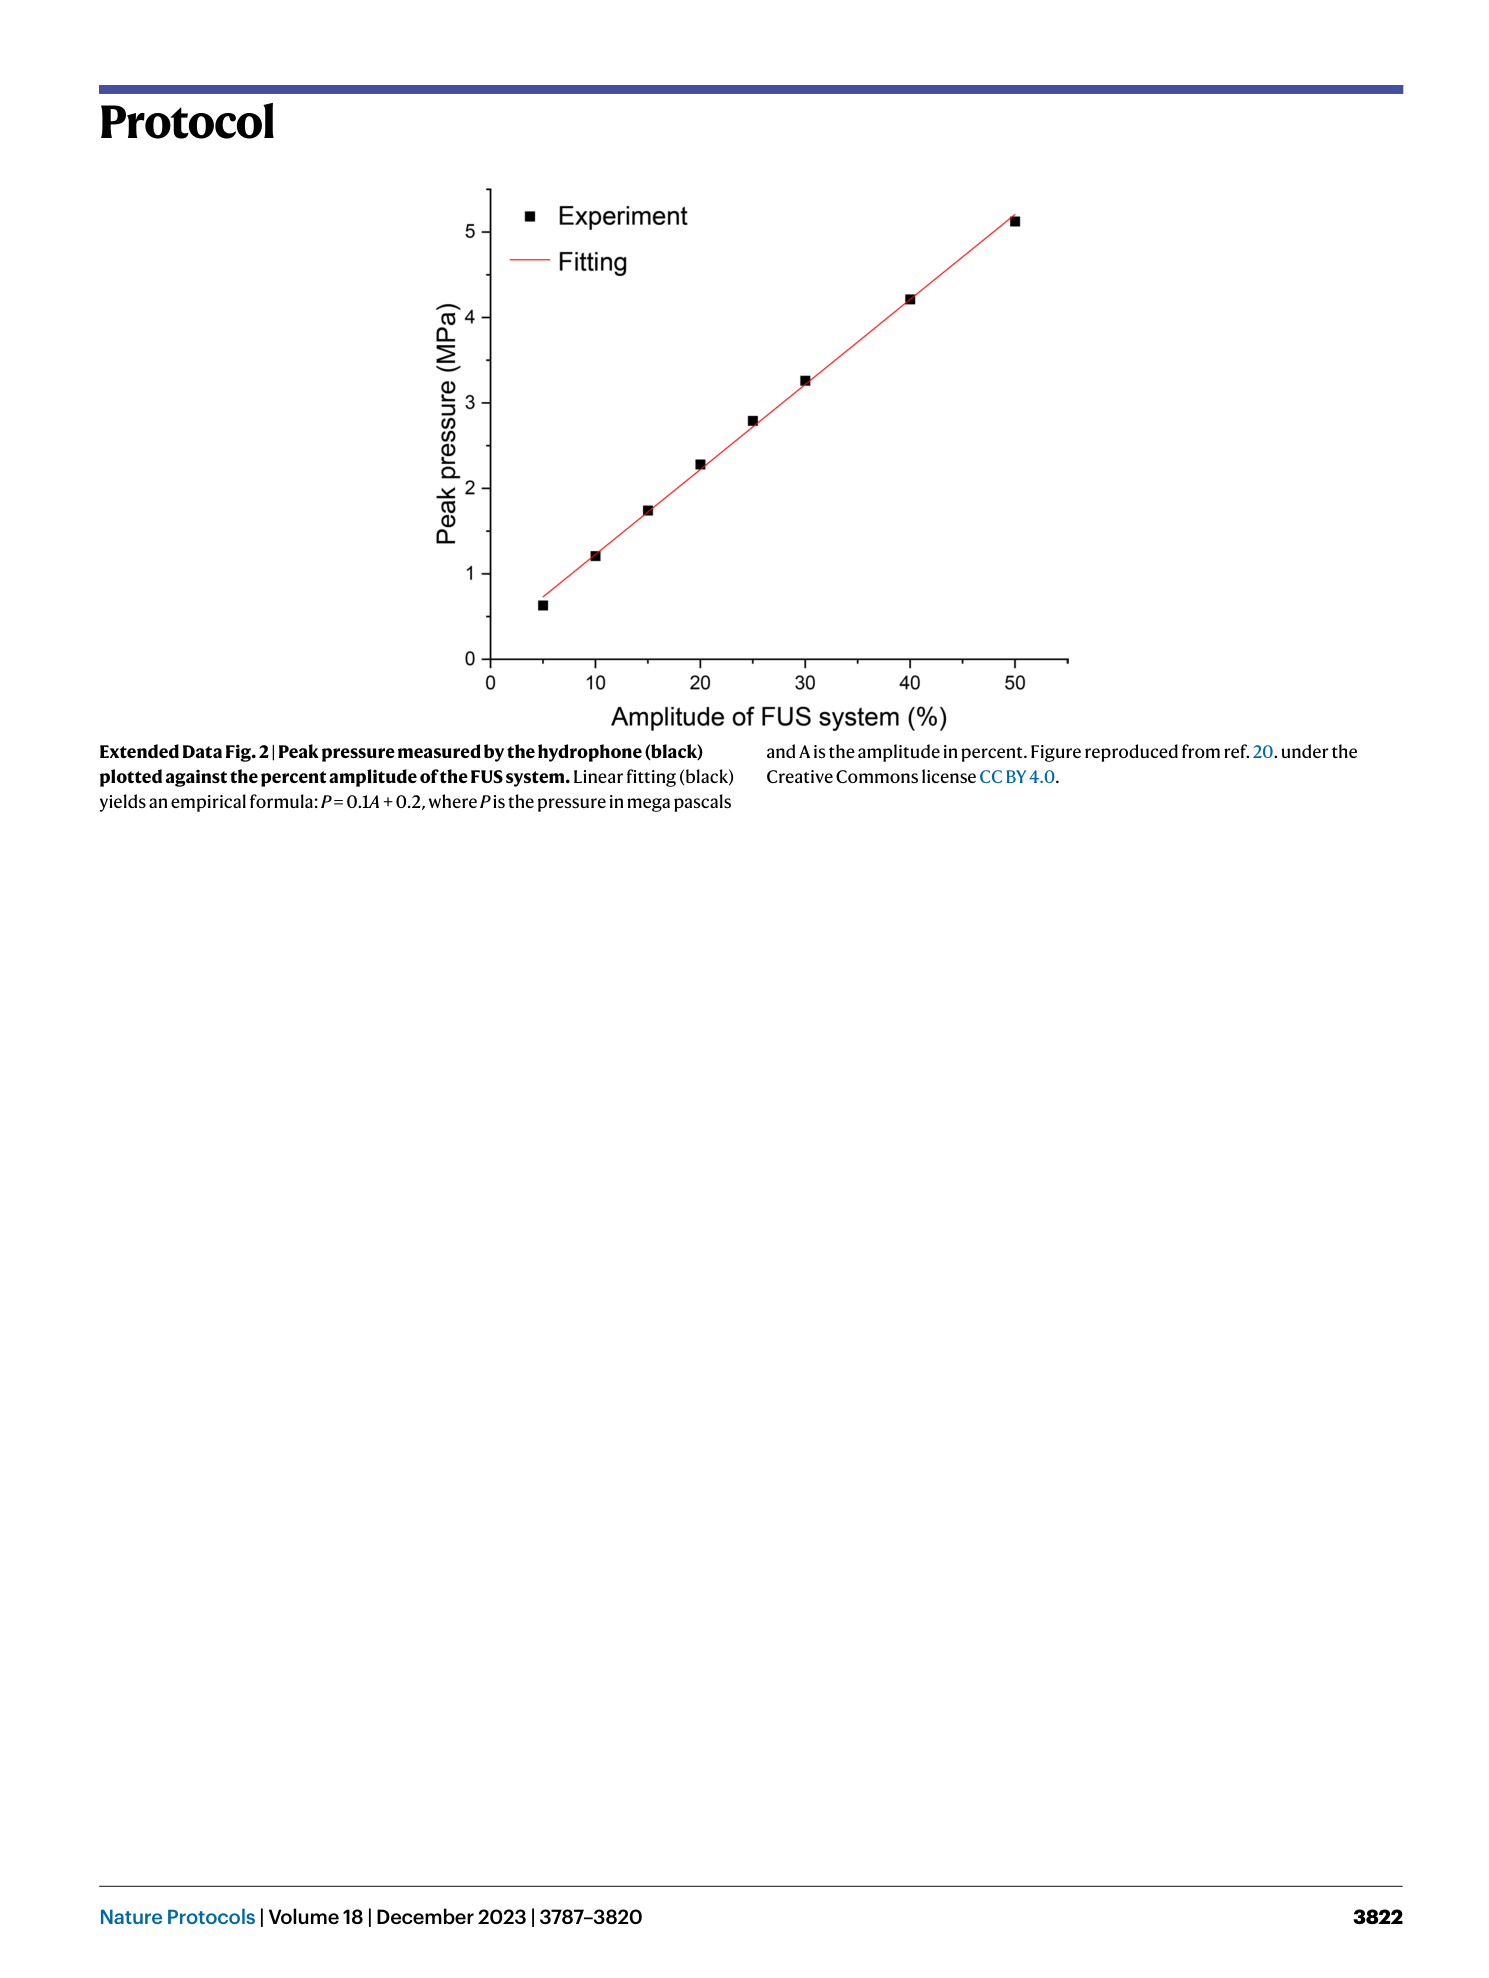
Extended Data Fig. 2 Peak pressure measured by the hydrophone (black) plotted against the percent amplitude of the FUS system.
Linear fitting (black) yields an empirical formula: P = 0.1 A + 0.2, where P is the pressure in mega pascals and A is the amplitude in percent. Figure reproduced from ref. 20 . under the Creative Commons license CC BY 4.0 .
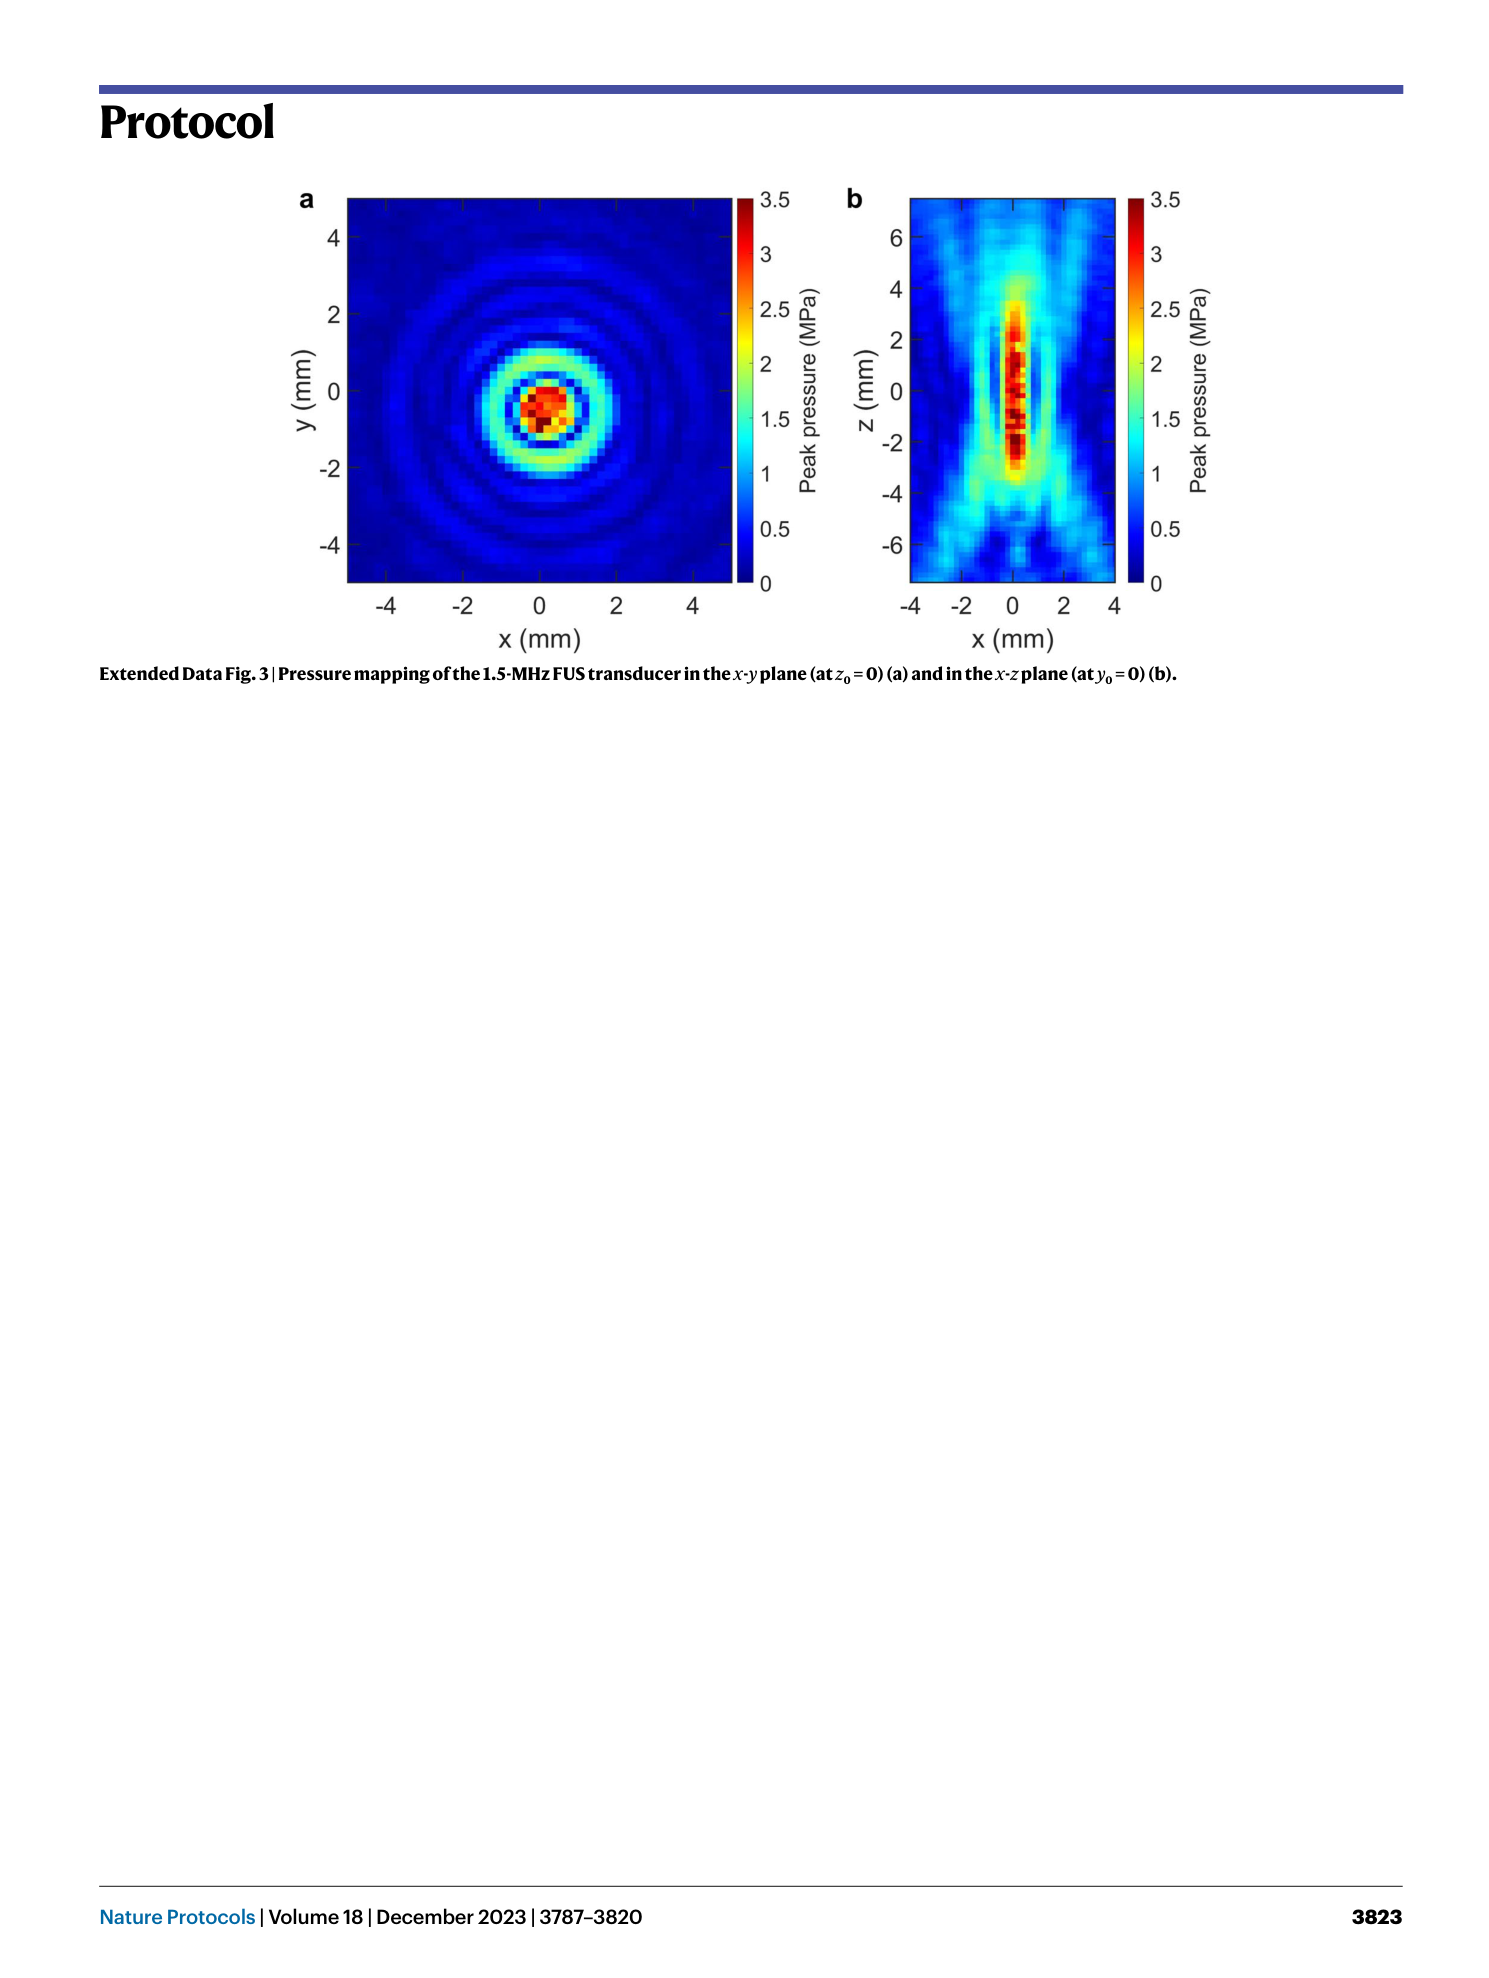
Extended Data Fig. 3
Pressure mapping of the 1.5-MHz FUS transducer in the x - y plane (at z 0 = 0) ( a ) and in the x - z plane (at y 0 = 0) ( b ).
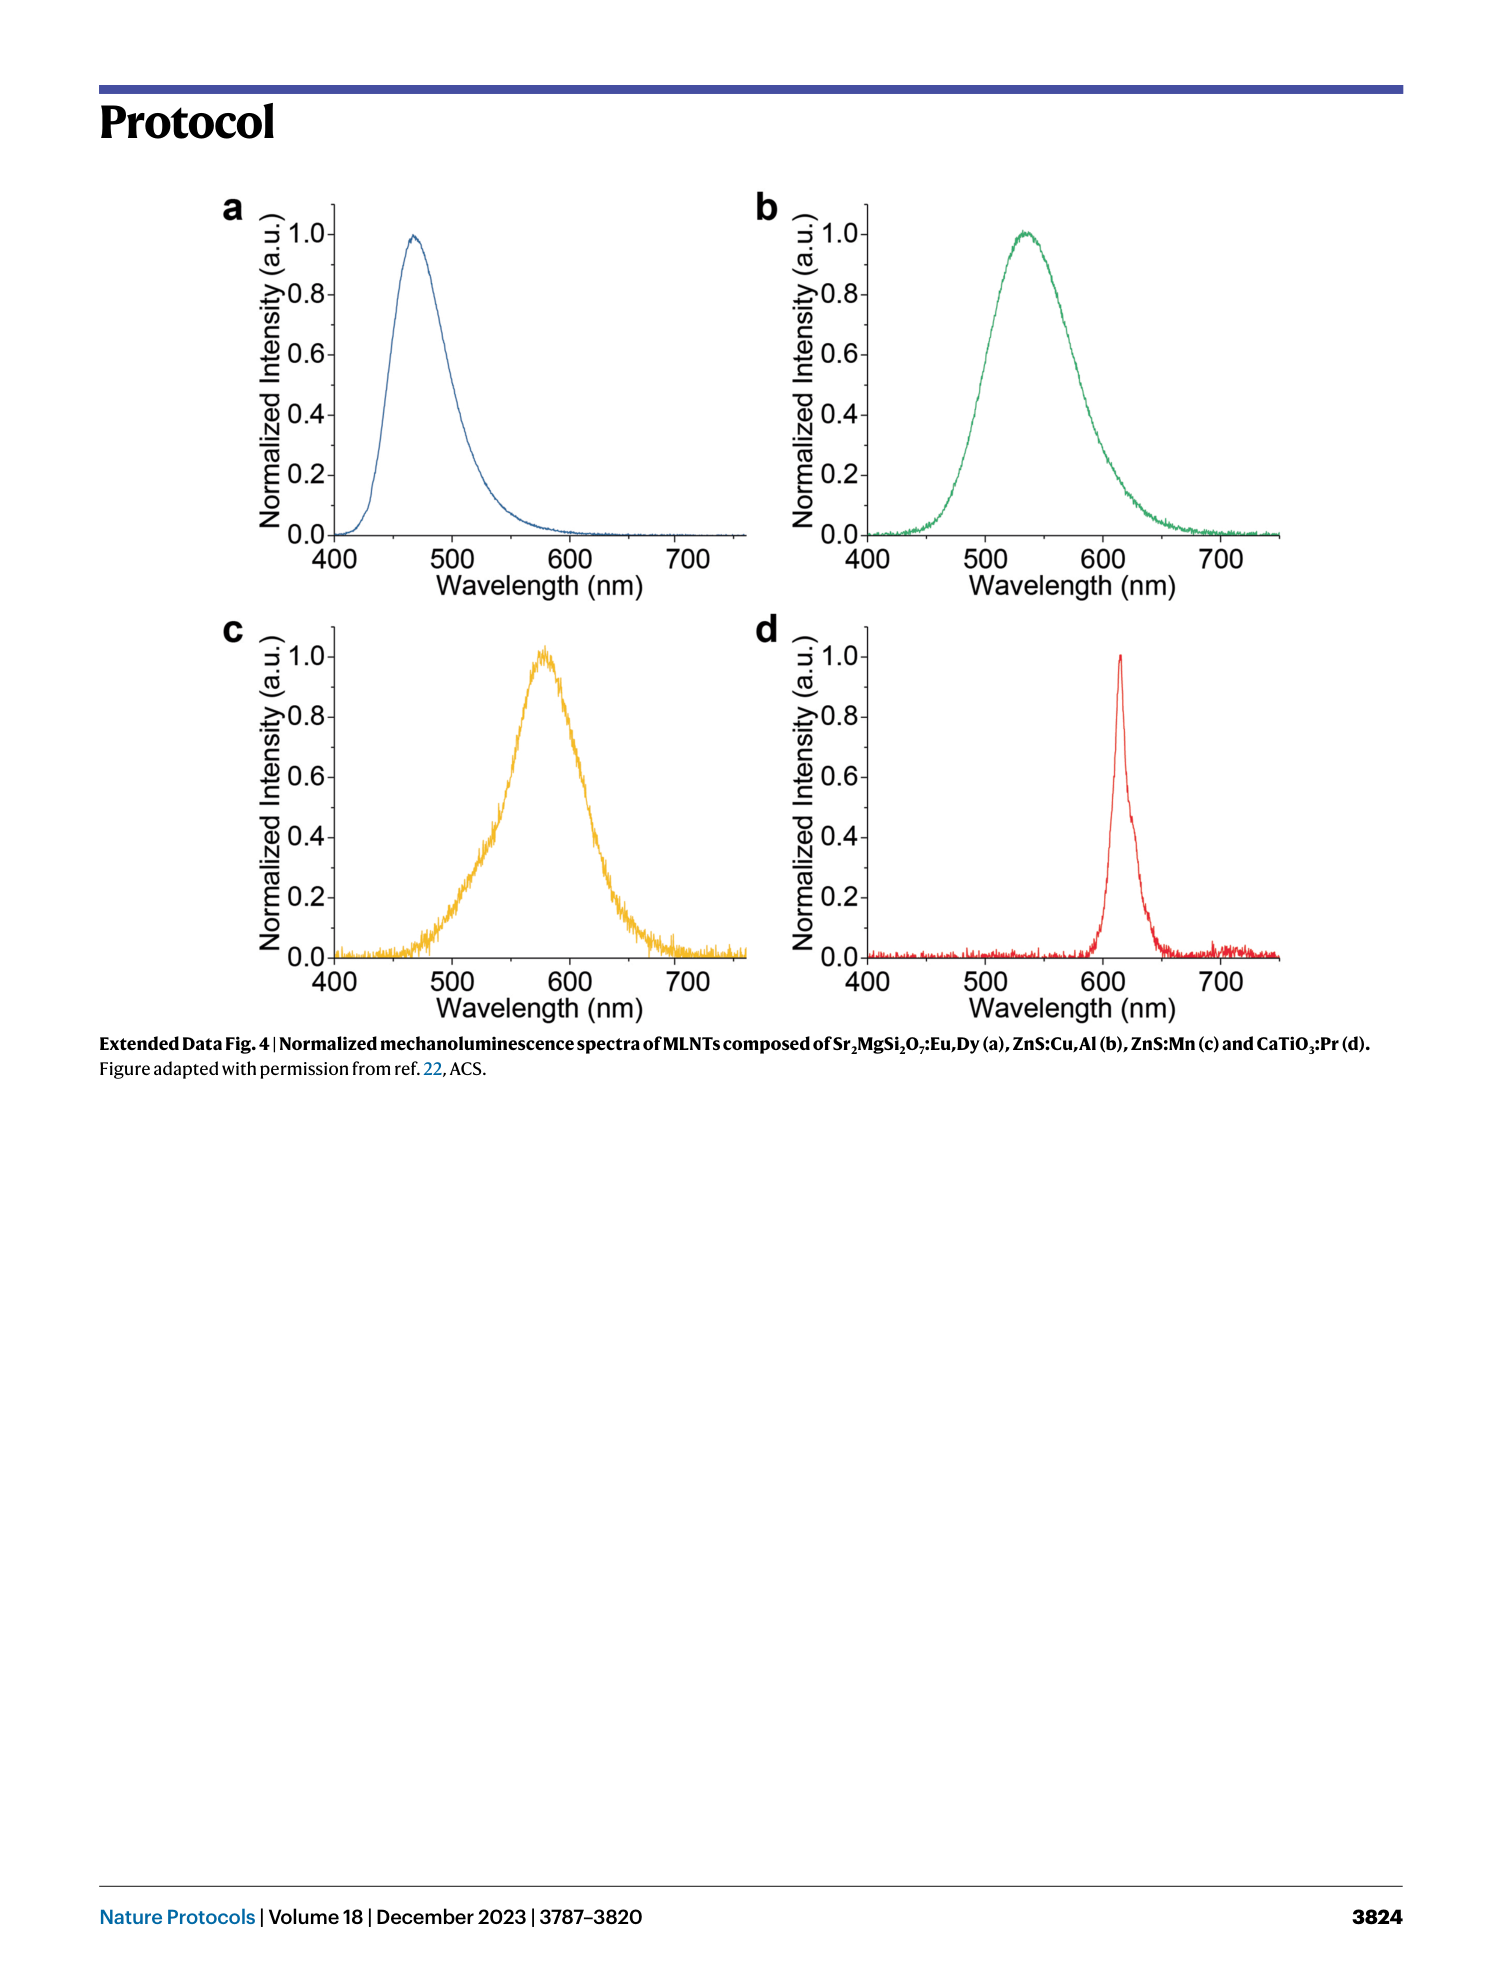
Extended Data Fig. 4
Normalized mechanoluminescence spectra of MLNTs composed of Sr 2 MgSi 2 O 7 :Eu,Dy ( a ), ZnS:Cu,Al ( b ), ZnS:Mn ( c ) and CaTiO 3 :Pr ( d ). Figure adapted with permission from ref. 22 , ACS.
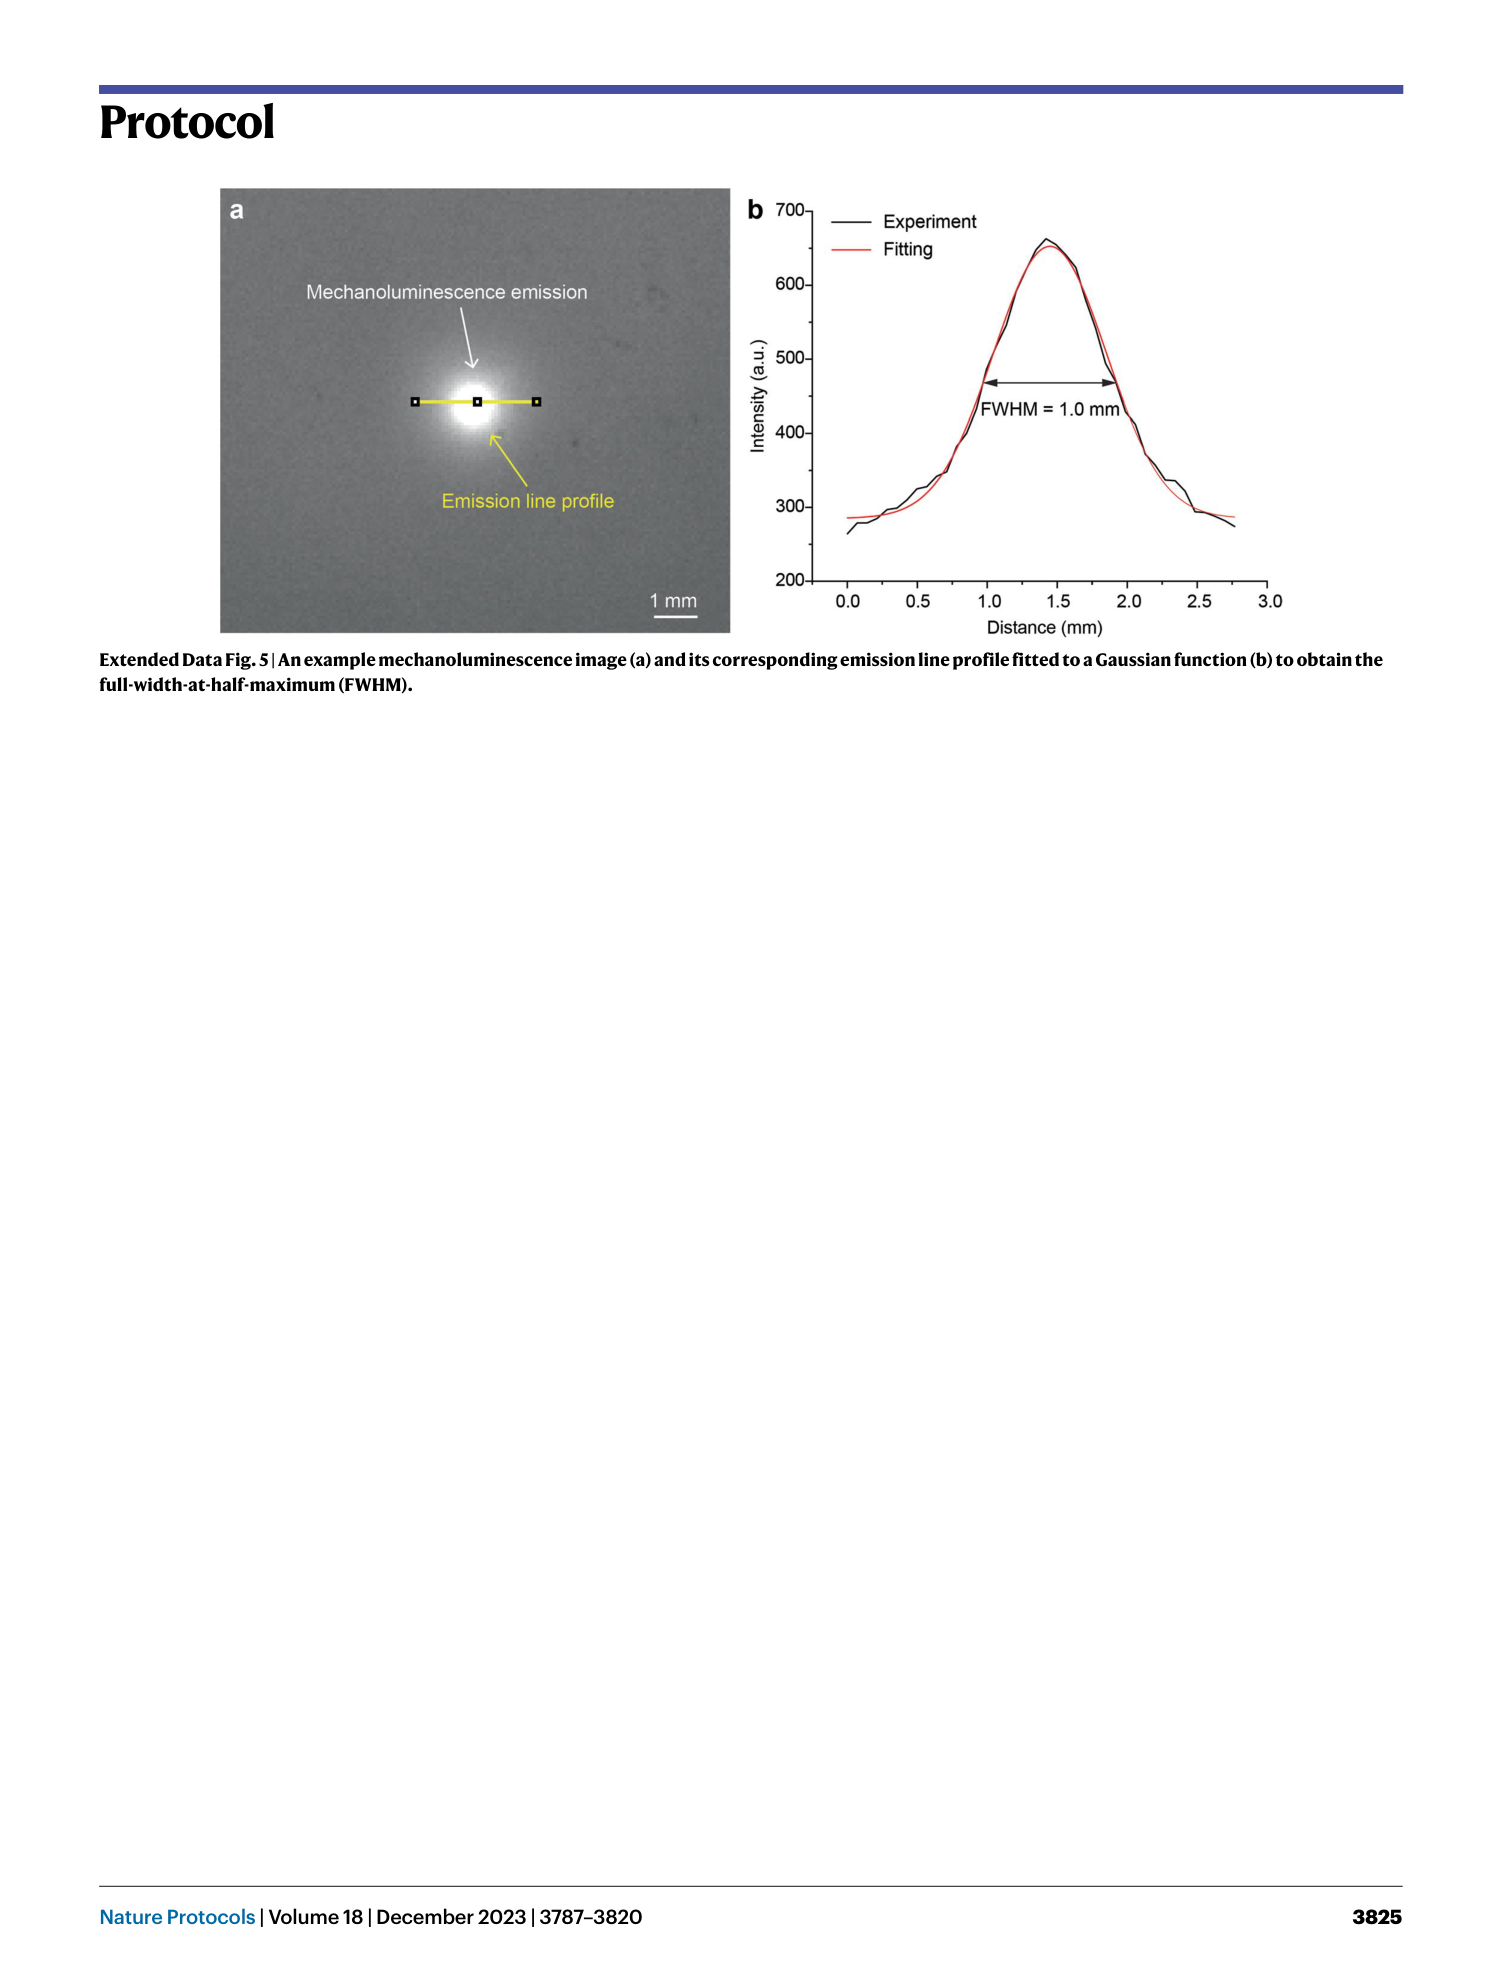
Extended Data Fig. 5
An example mechanoluminescence image ( a ) and its corresponding emission line profile fitted to a Gaussian function ( b ) to obtain the full-width-at-half-maximum (FWHM).
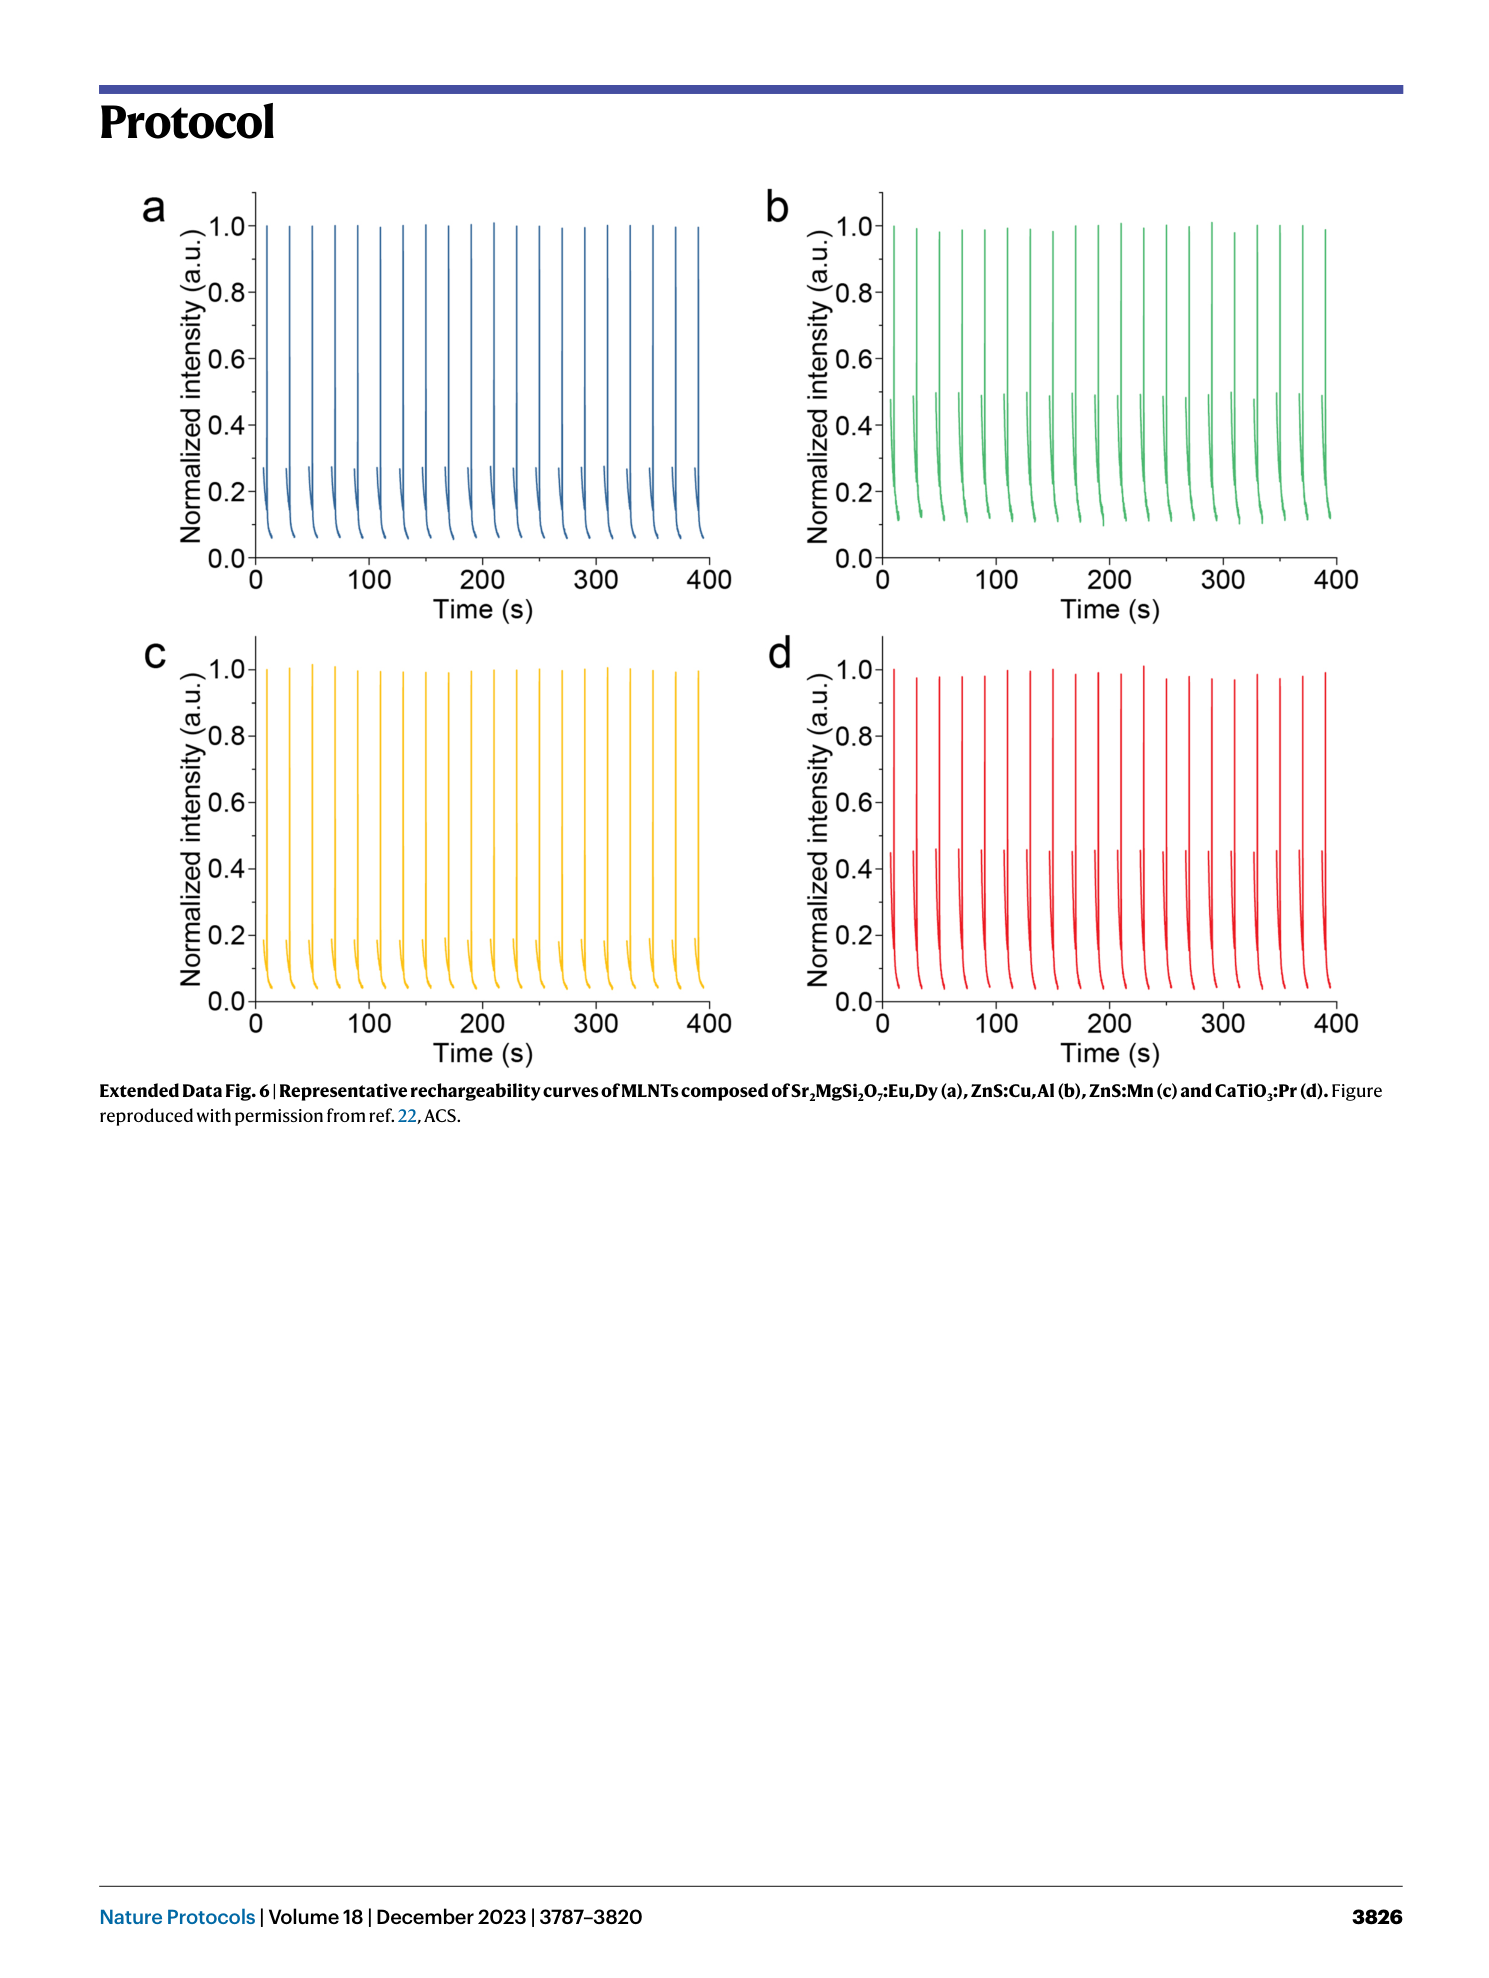
Extended Data Fig. 6
Representative rechargeability curves of MLNTs composed of Sr 2 MgSi 2 O 7 :Eu,Dy ( a ), ZnS:Cu,Al ( b ), ZnS:Mn ( c ) and CaTiO 3 :Pr ( d ). Figure reproduced with permission from ref. 22 , ACS.
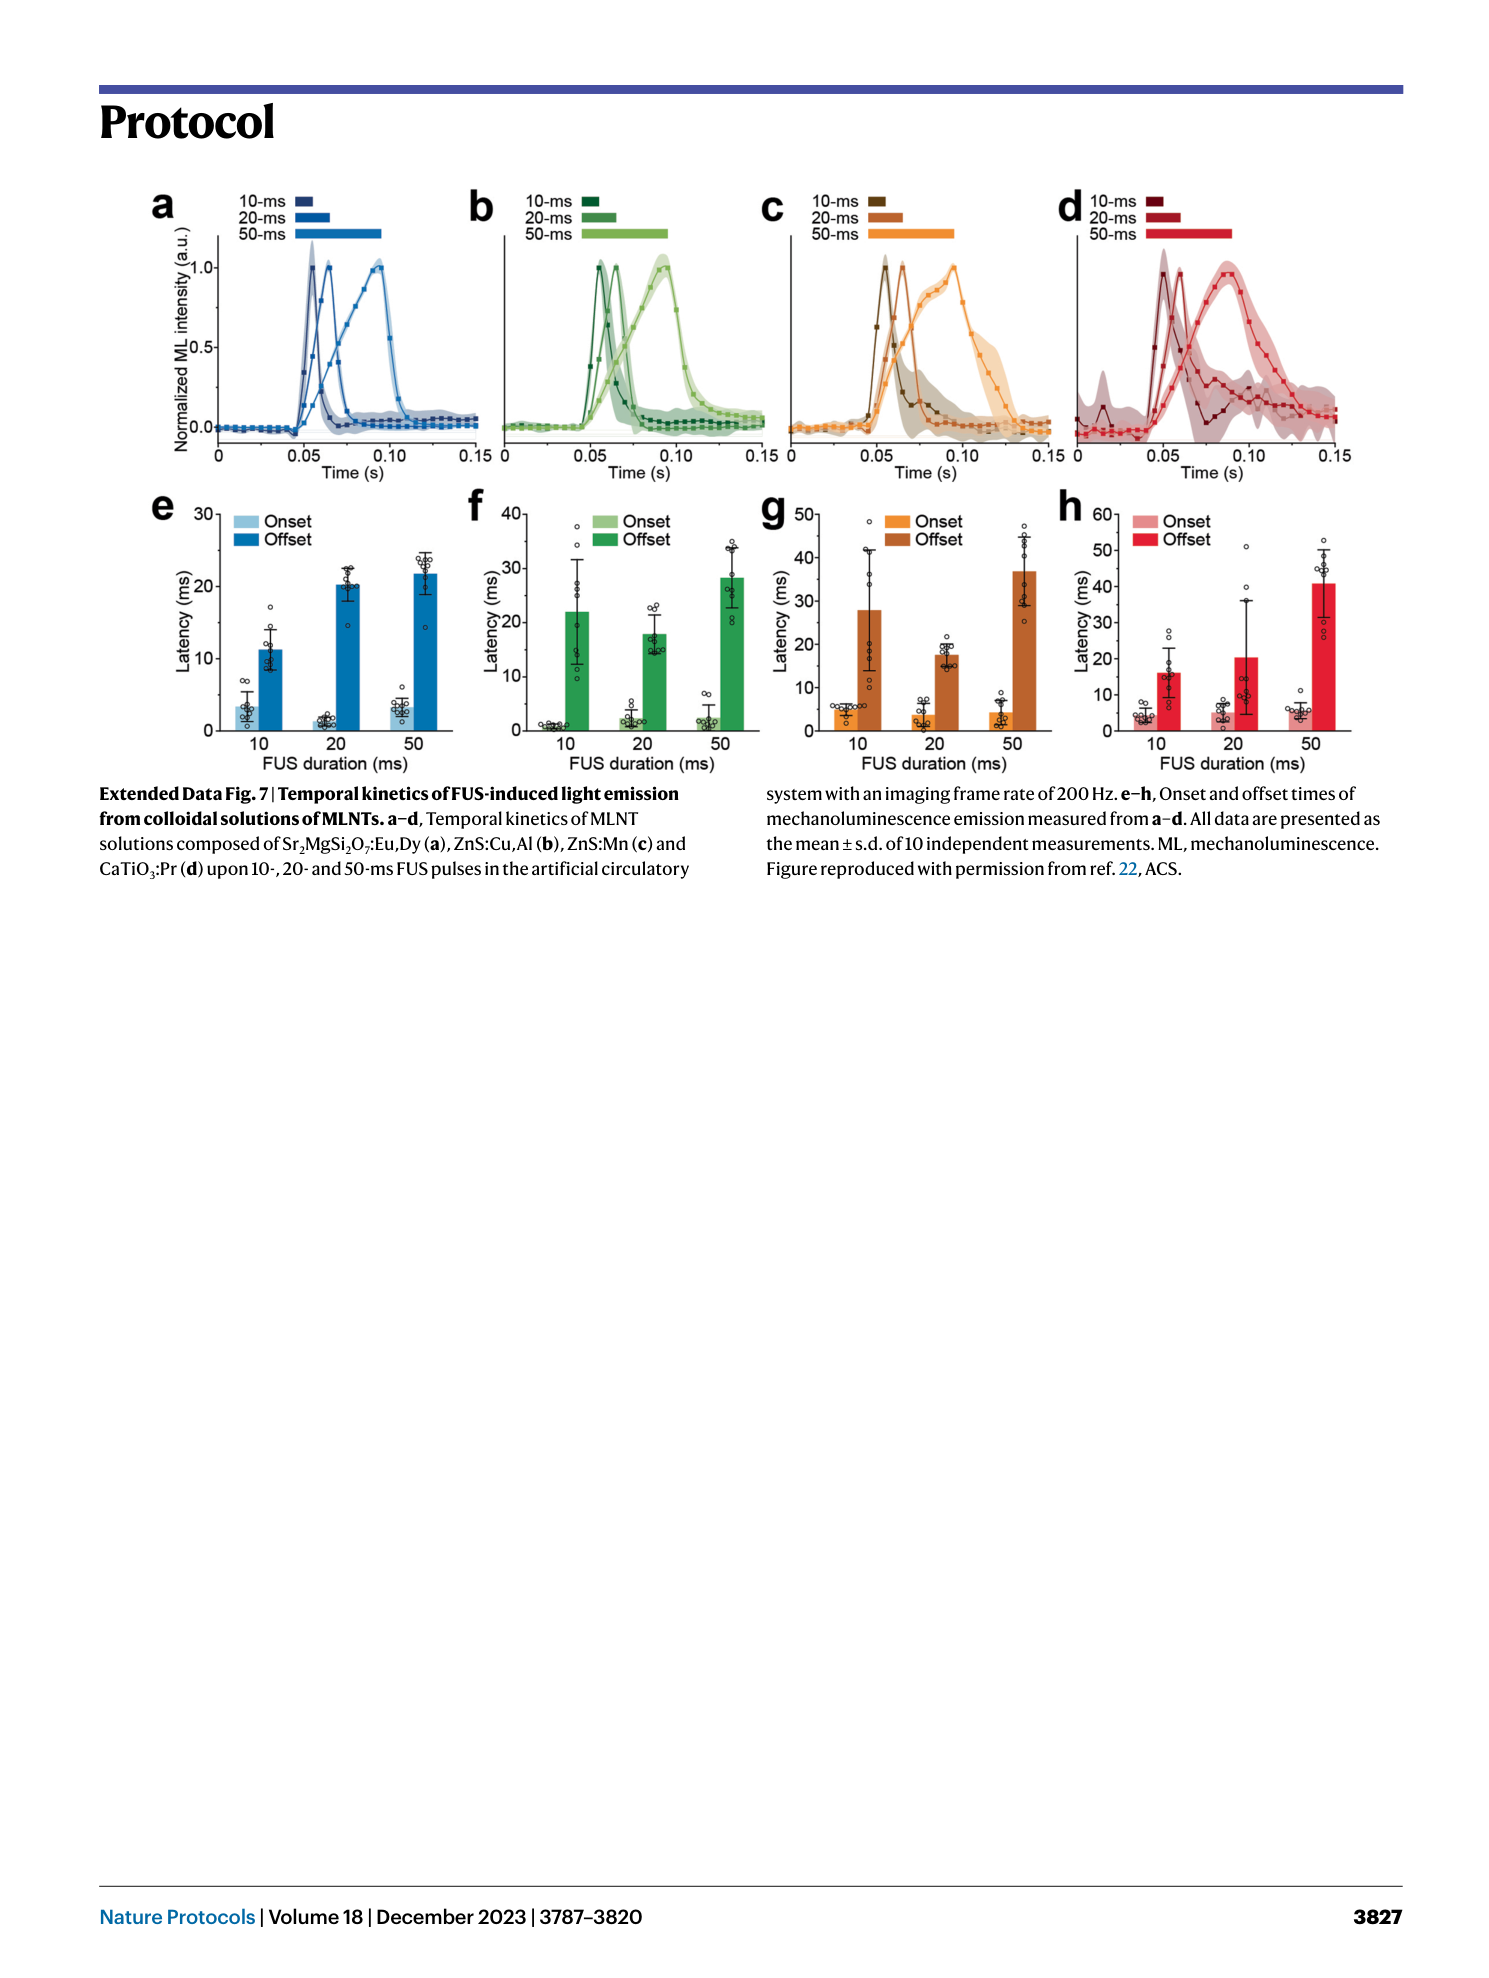
Extended Data Fig. 7 Temporal kinetics of FUS-induced light emission from colloidal solutions of MLNTs.
a−d , Temporal kinetics of MLNT solutions composed of Sr 2 MgSi 2 O 7 :Eu,Dy ( a ), ZnS:Cu,Al ( b ), ZnS:Mn ( c ) and CaTiO 3 :Pr ( d ) upon 10-, 20- and 50-ms FUS pulses in the artificial circulatory system with an imaging frame rate of 200 Hz. e−h , Onset and offset times of mechanoluminescence emission measured from a–d . All data are presented as the mean ± s.d. of 10 independent measurements. ML, mechanoluminescence. Figure reproduced with permission from ref. 22 , ACS.
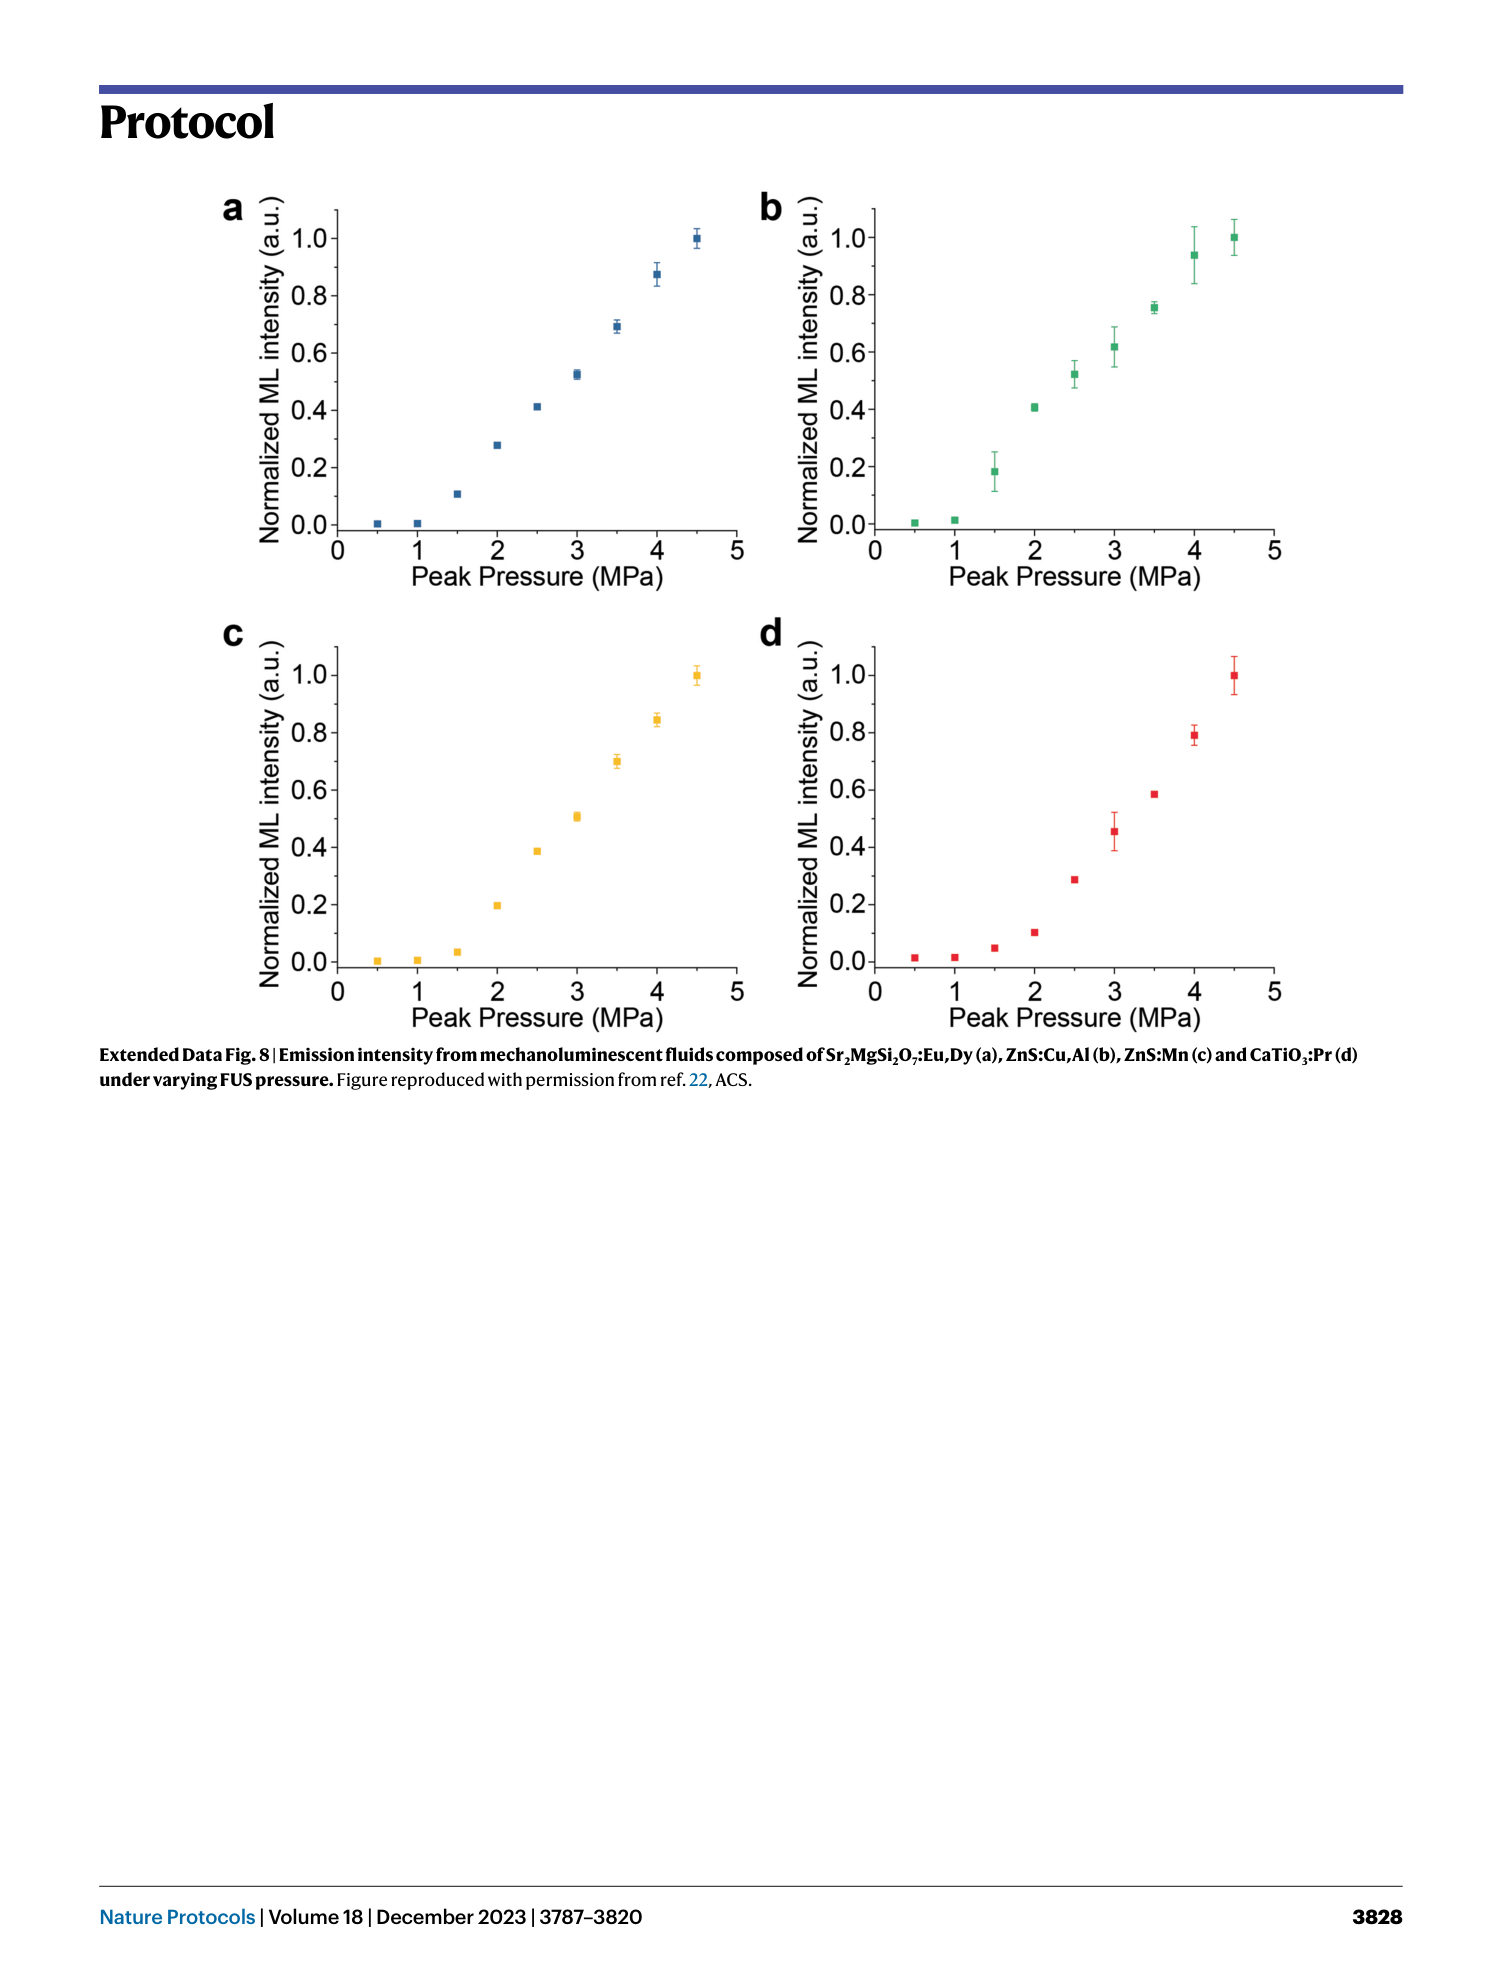
Extended Data Fig. 8
Emission intensity from mechanoluminescent fluids composed of Sr 2 MgSi 2 O 7 :Eu,Dy ( a ), ZnS:Cu,Al ( b ), ZnS:Mn ( c ) and CaTiO 3 :Pr ( d ) under varying FUS pressure. Figure reproduced with permission from ref. 22 , ACS.
