Ultra-fast supercritically solvothermal polymerization for large single-crystalline covalent organic frameworks
Xuejun Wang, Yunqi Liu, Dacheng Wei, Jiang Sun, Qiankun Wang, Lan Peng


Extended
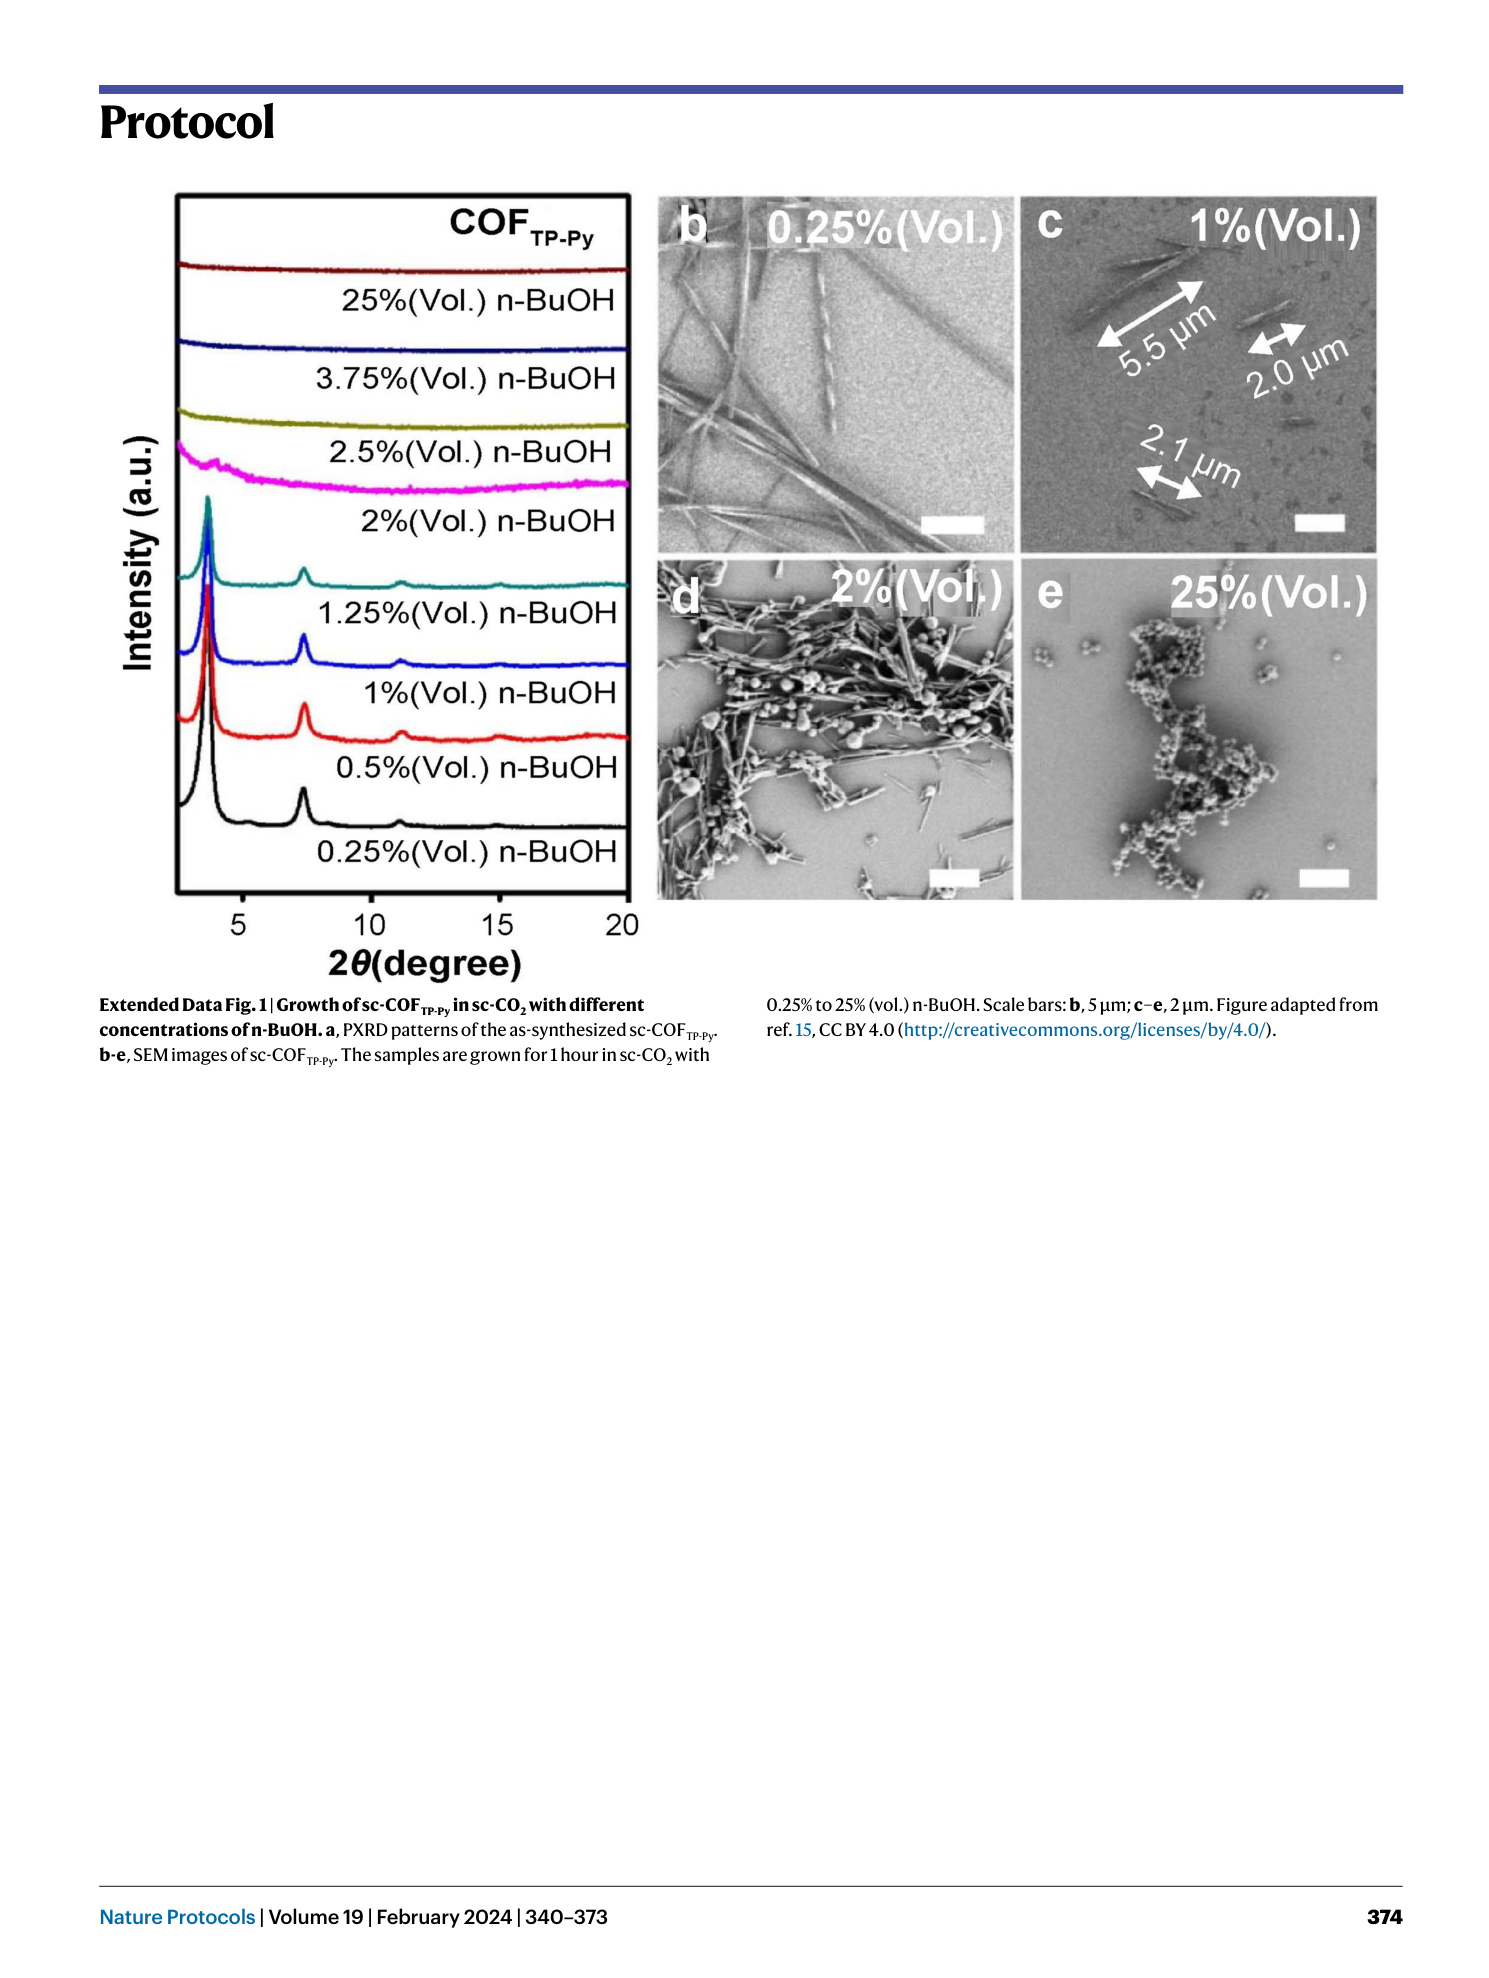
Extended Data Fig. 1 Growth of sc-COF TP-Py in sc-CO 2 with different concentrations of n-BuOH.
a , PXRD patterns of the as-synthesized sc-COF TP-Py . b-e , SEM images of sc-COF TP-Py . The samples are grown for 1 hour in sc-CO 2 with 0.25% to 25% (vol.) n-BuOH. Scale bars: b , 5 μm; c – e , 2 μm. Figure adapted from ref. 15 , CC BY 4.0 ( http://creativecommons.org/licenses/by/4.0/ ).
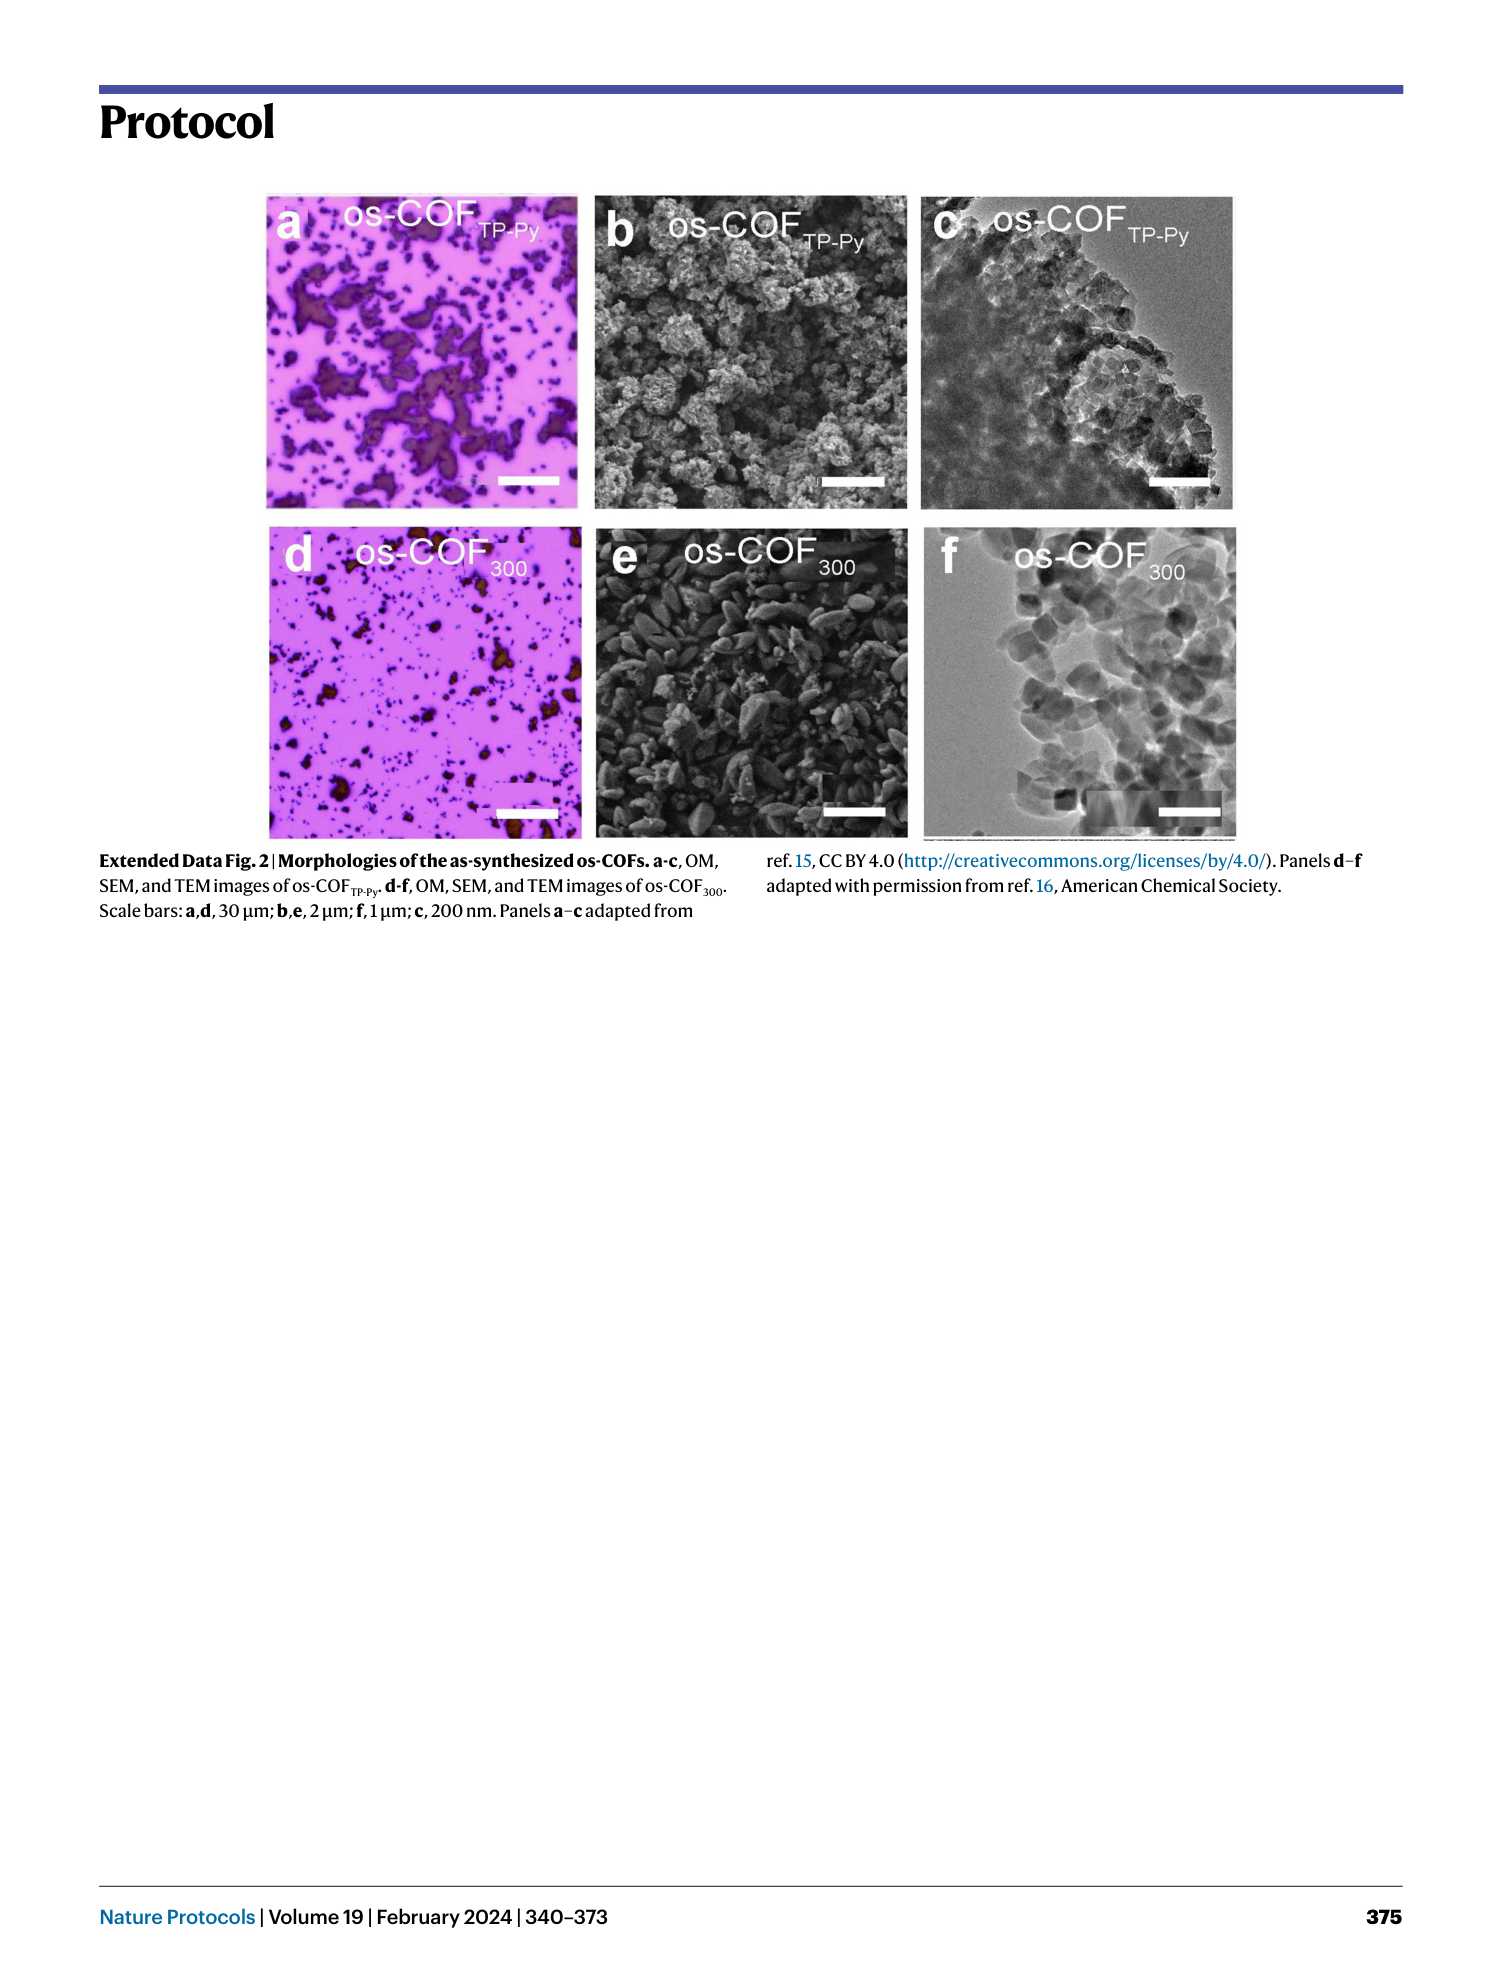
Extended Data Fig. 2 Morphologies of the as-synthesized os-COFs.
a-c , OM, SEM, and TEM images of os-COF TP-Py . d-f , OM, SEM, and TEM images of os-COF 300 . Scale bars: a , d , 30 μm; b , e , 2 μm; f , 1 μm; c , 200 nm. Panels a – c adapted from ref. 15 , CC BY 4.0 ( http://creativecommons.org/licenses/by/4.0/ ). Panels d – f adapted with permission from ref. 16 , American Chemical Society.
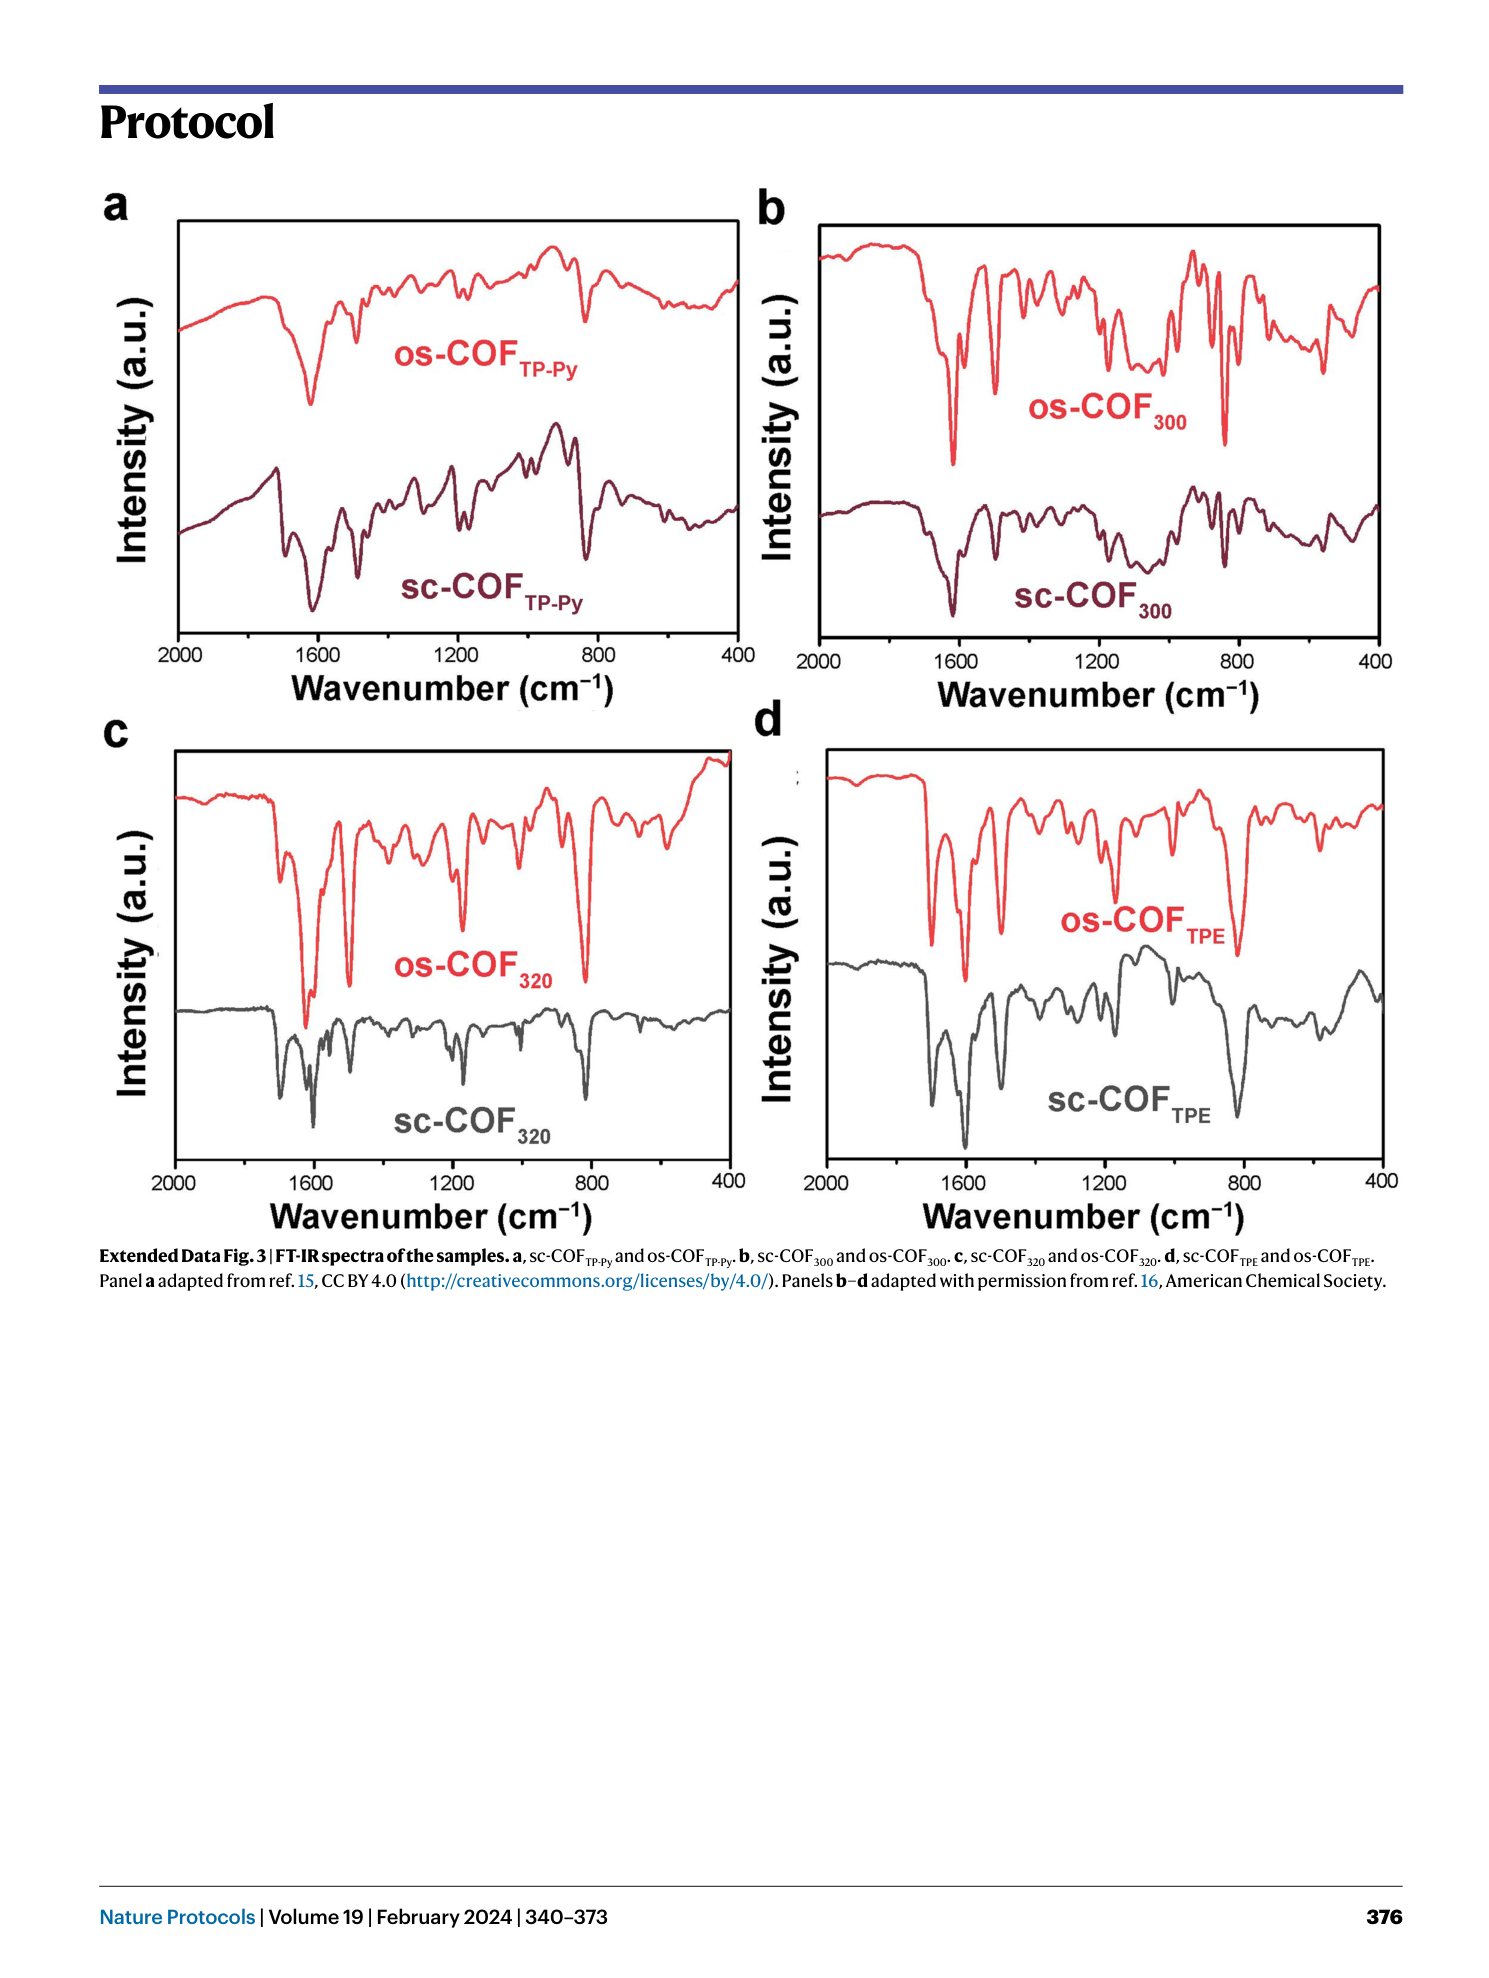
Extended Data Fig. 3 FT-IR spectra of the samples.
a , sc-COF TP-Py and os-COF TP-Py . b , sc-COF 300 and os-COF 300 . c , sc-COF 320 and os-COF 320 . d , sc-COF TPE and os-COF TPE . Panel a adapted from ref. 15 , CC BY 4.0 ( http://creativecommons.org/licenses/by/4.0/ ). Panels b – d adapted with permission from ref. 16 , American Chemical Society.
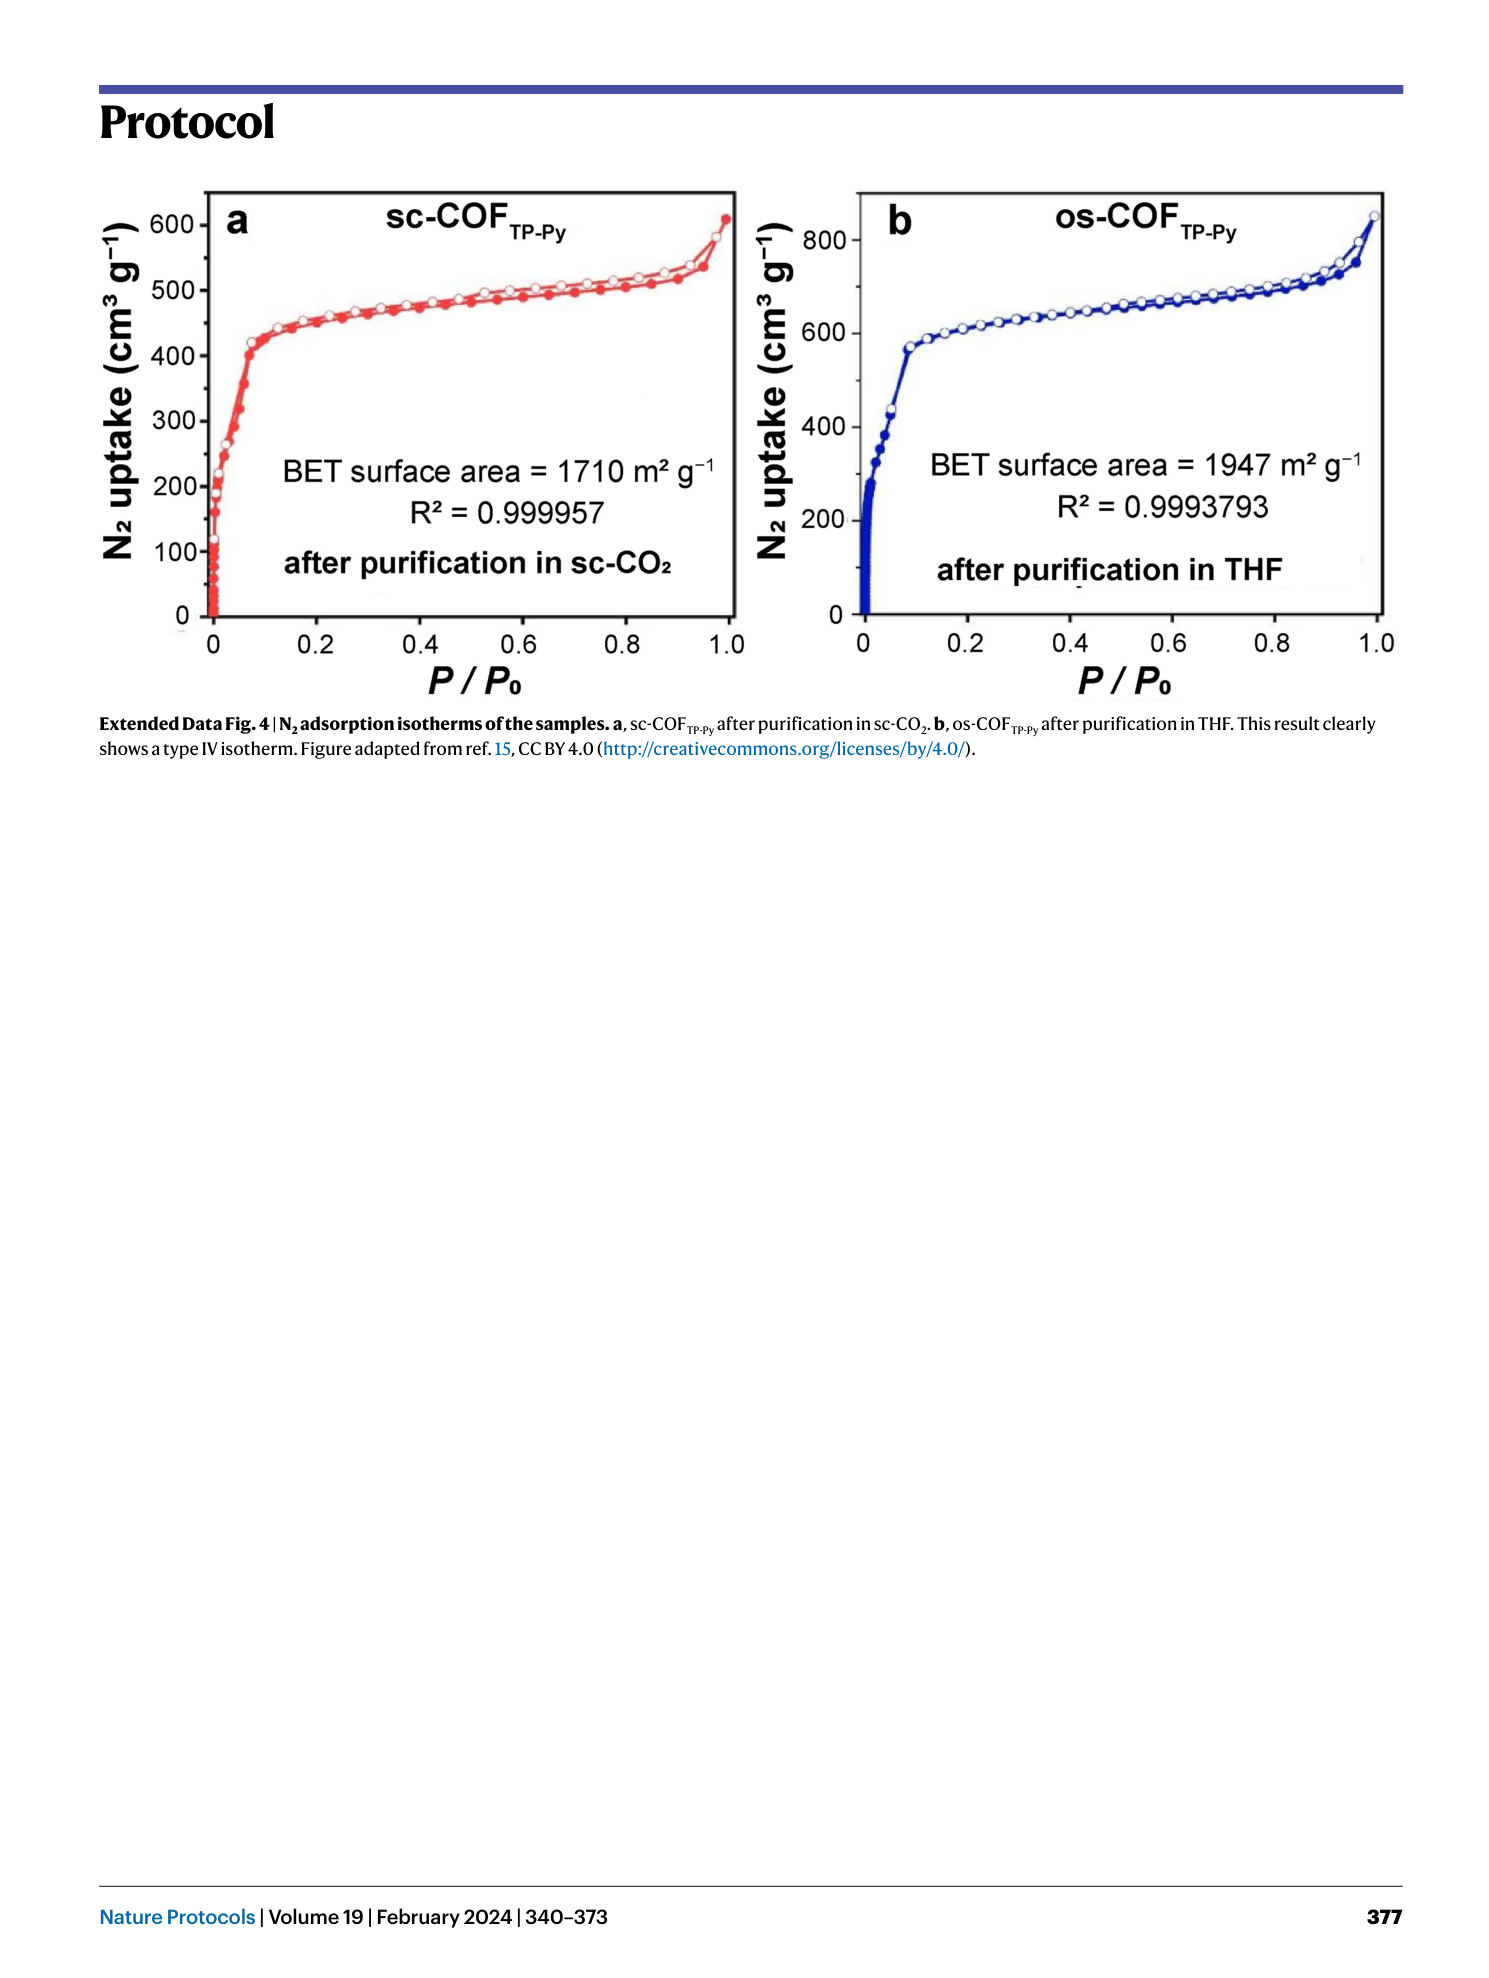
Extended Data Fig. 4 N 2 adsorption isotherms of the samples.
a , sc-COF TP-Py after purification in sc-CO 2 . b , os-COF TP-Py after purification in THF. This result clearly shows a type IV isotherm. Figure adapted from ref. 15 , CC BY 4.0 ( http://creativecommons.org/licenses/by/4.0/ ).
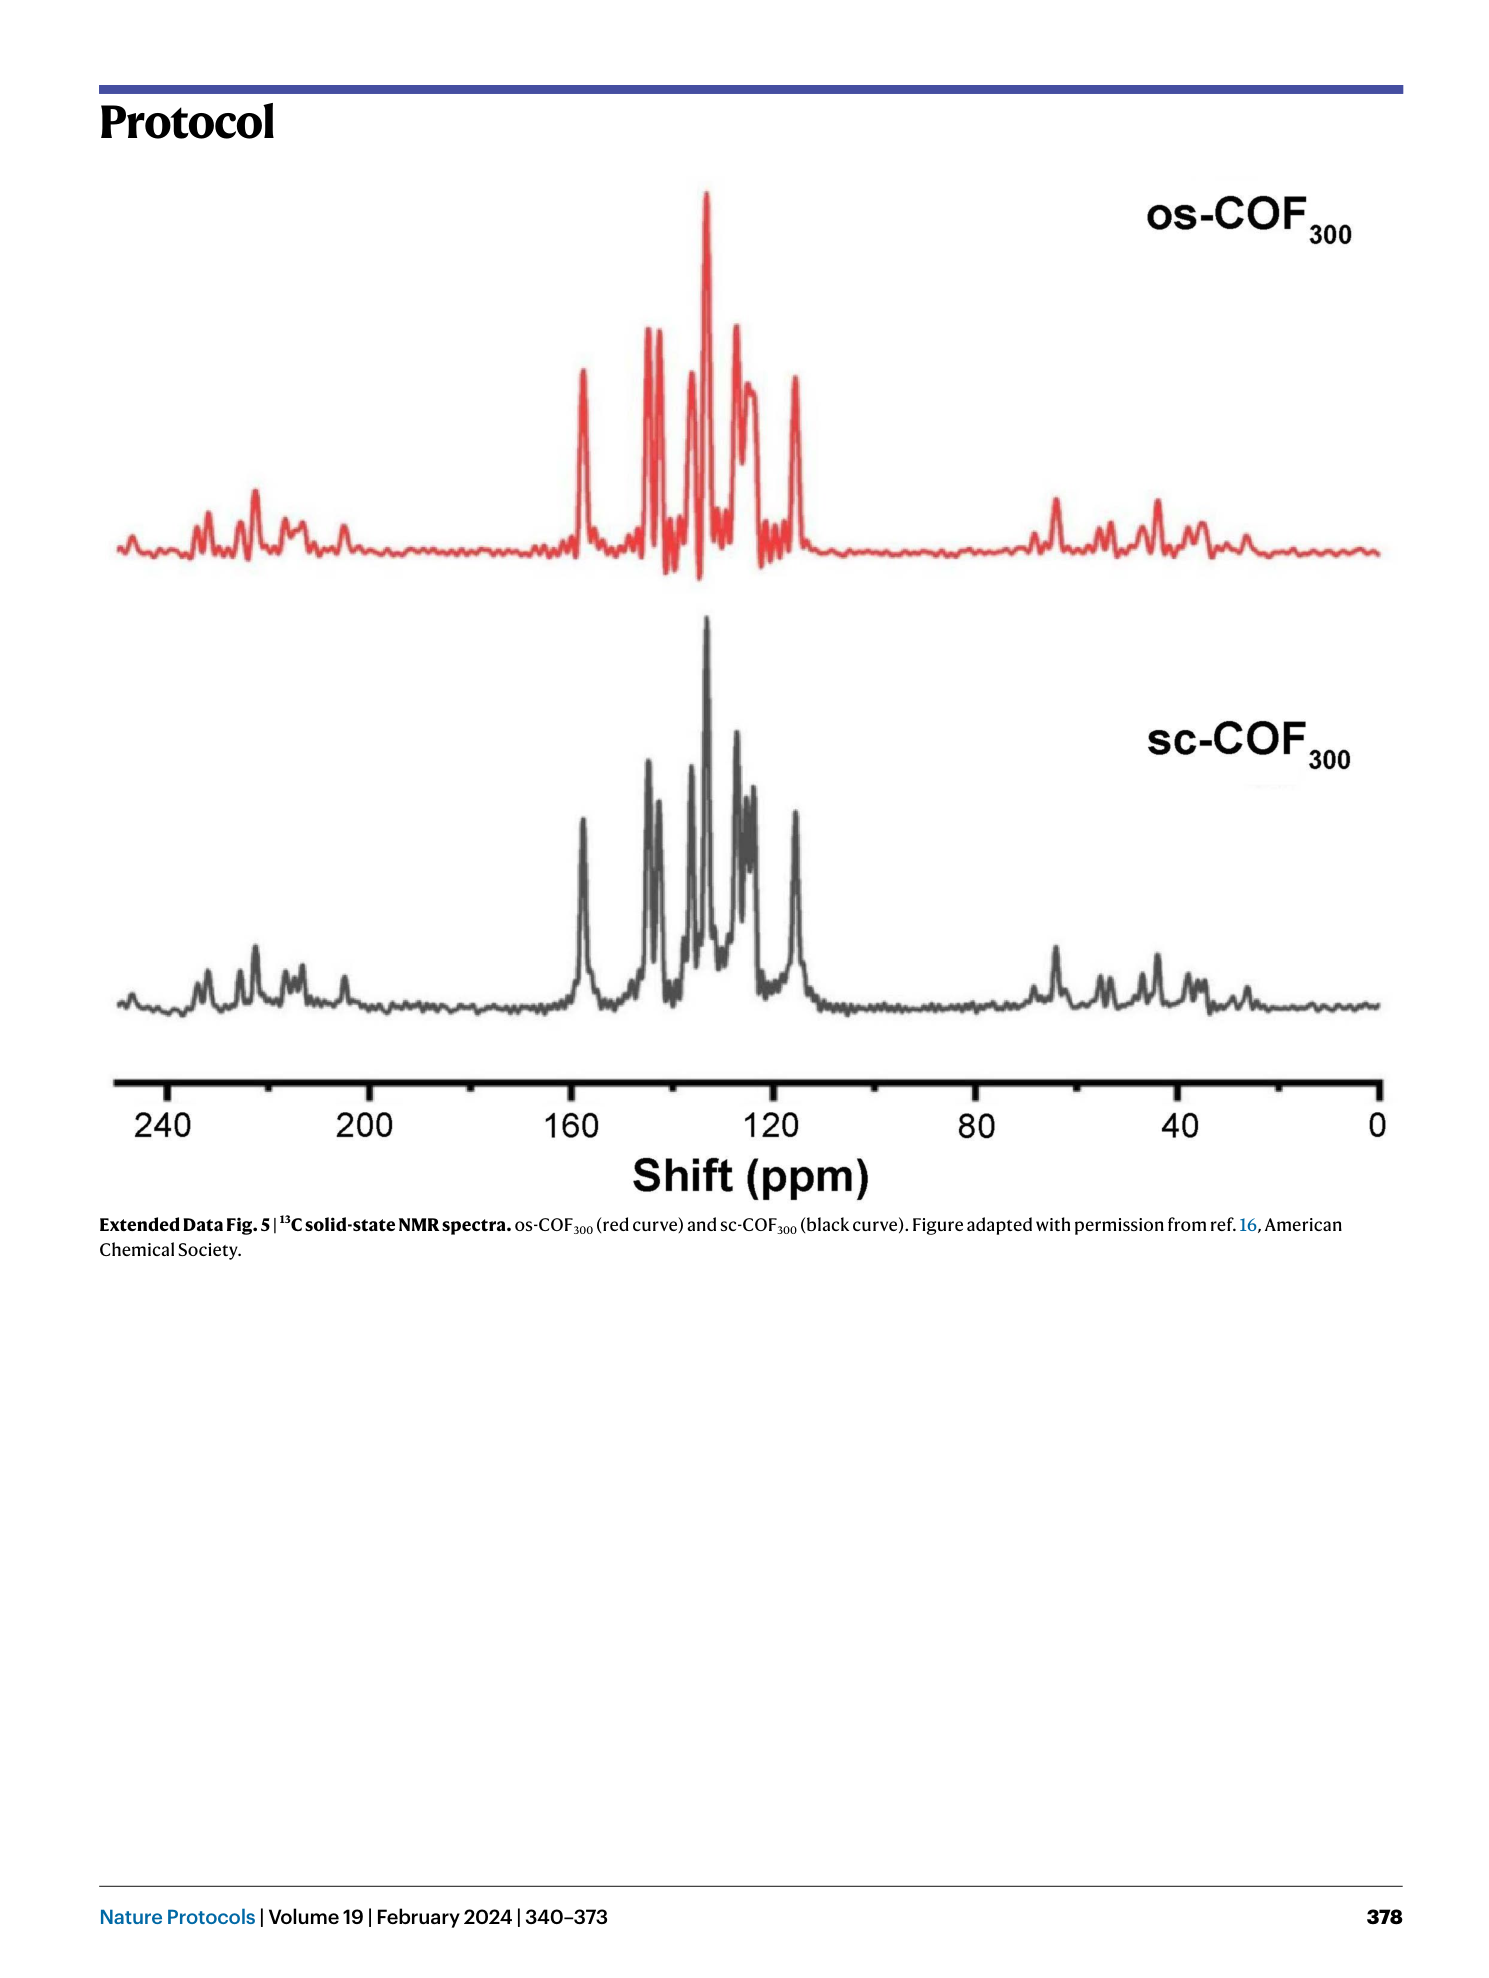
Extended Data Fig. 5 13 C solid-state NMR spectra.
os-COF 300 (red curve) and sc-COF 300 (black curve). Figure adapted with permission from ref. 16 , American Chemical Society.
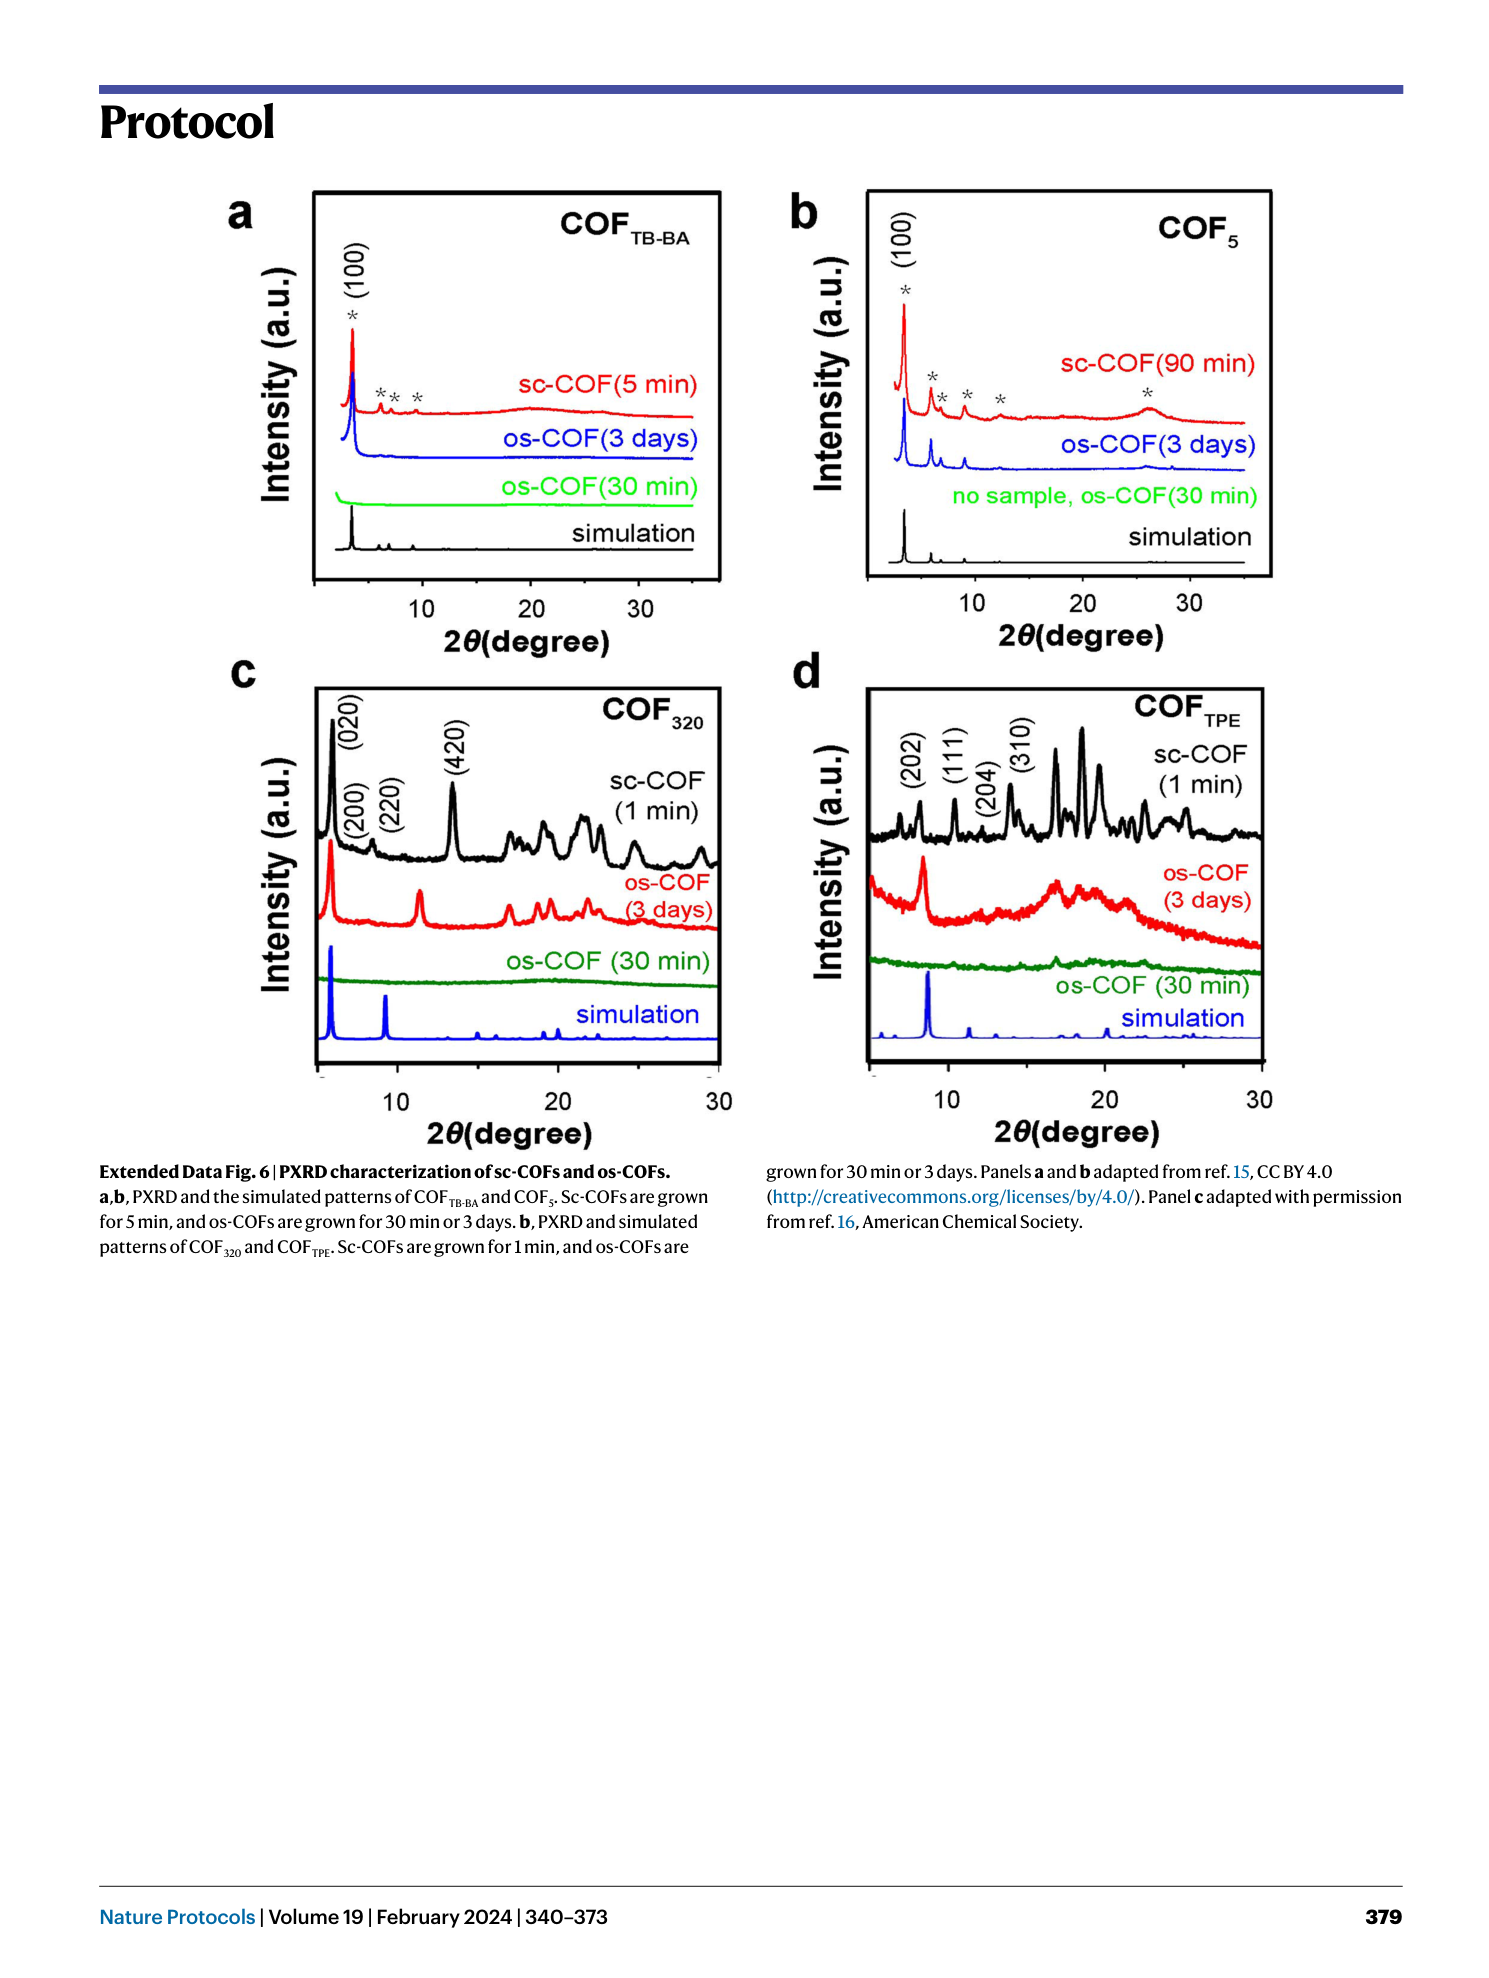
Extended Data Fig. 6 PXRD characterization of sc-COFs and os-COFs.
a , b , PXRD and the simulated patterns of COF TB-BA and COF 5 . Sc-COFs are grown for 5 min, and os-COFs are grown for 30 min or 3 days. b , PXRD and simulated patterns of COF 320 and COF TPE . Sc-COFs are grown for 1 min, and os-COFs are grown for 30 min or 3 days. Panels a and b adapted from ref. 15 , CC BY 4.0 ( http://creativecommons.org/licenses/by/4.0/ ). Panel c adapted with permission from ref. 16 , American Chemical Society.
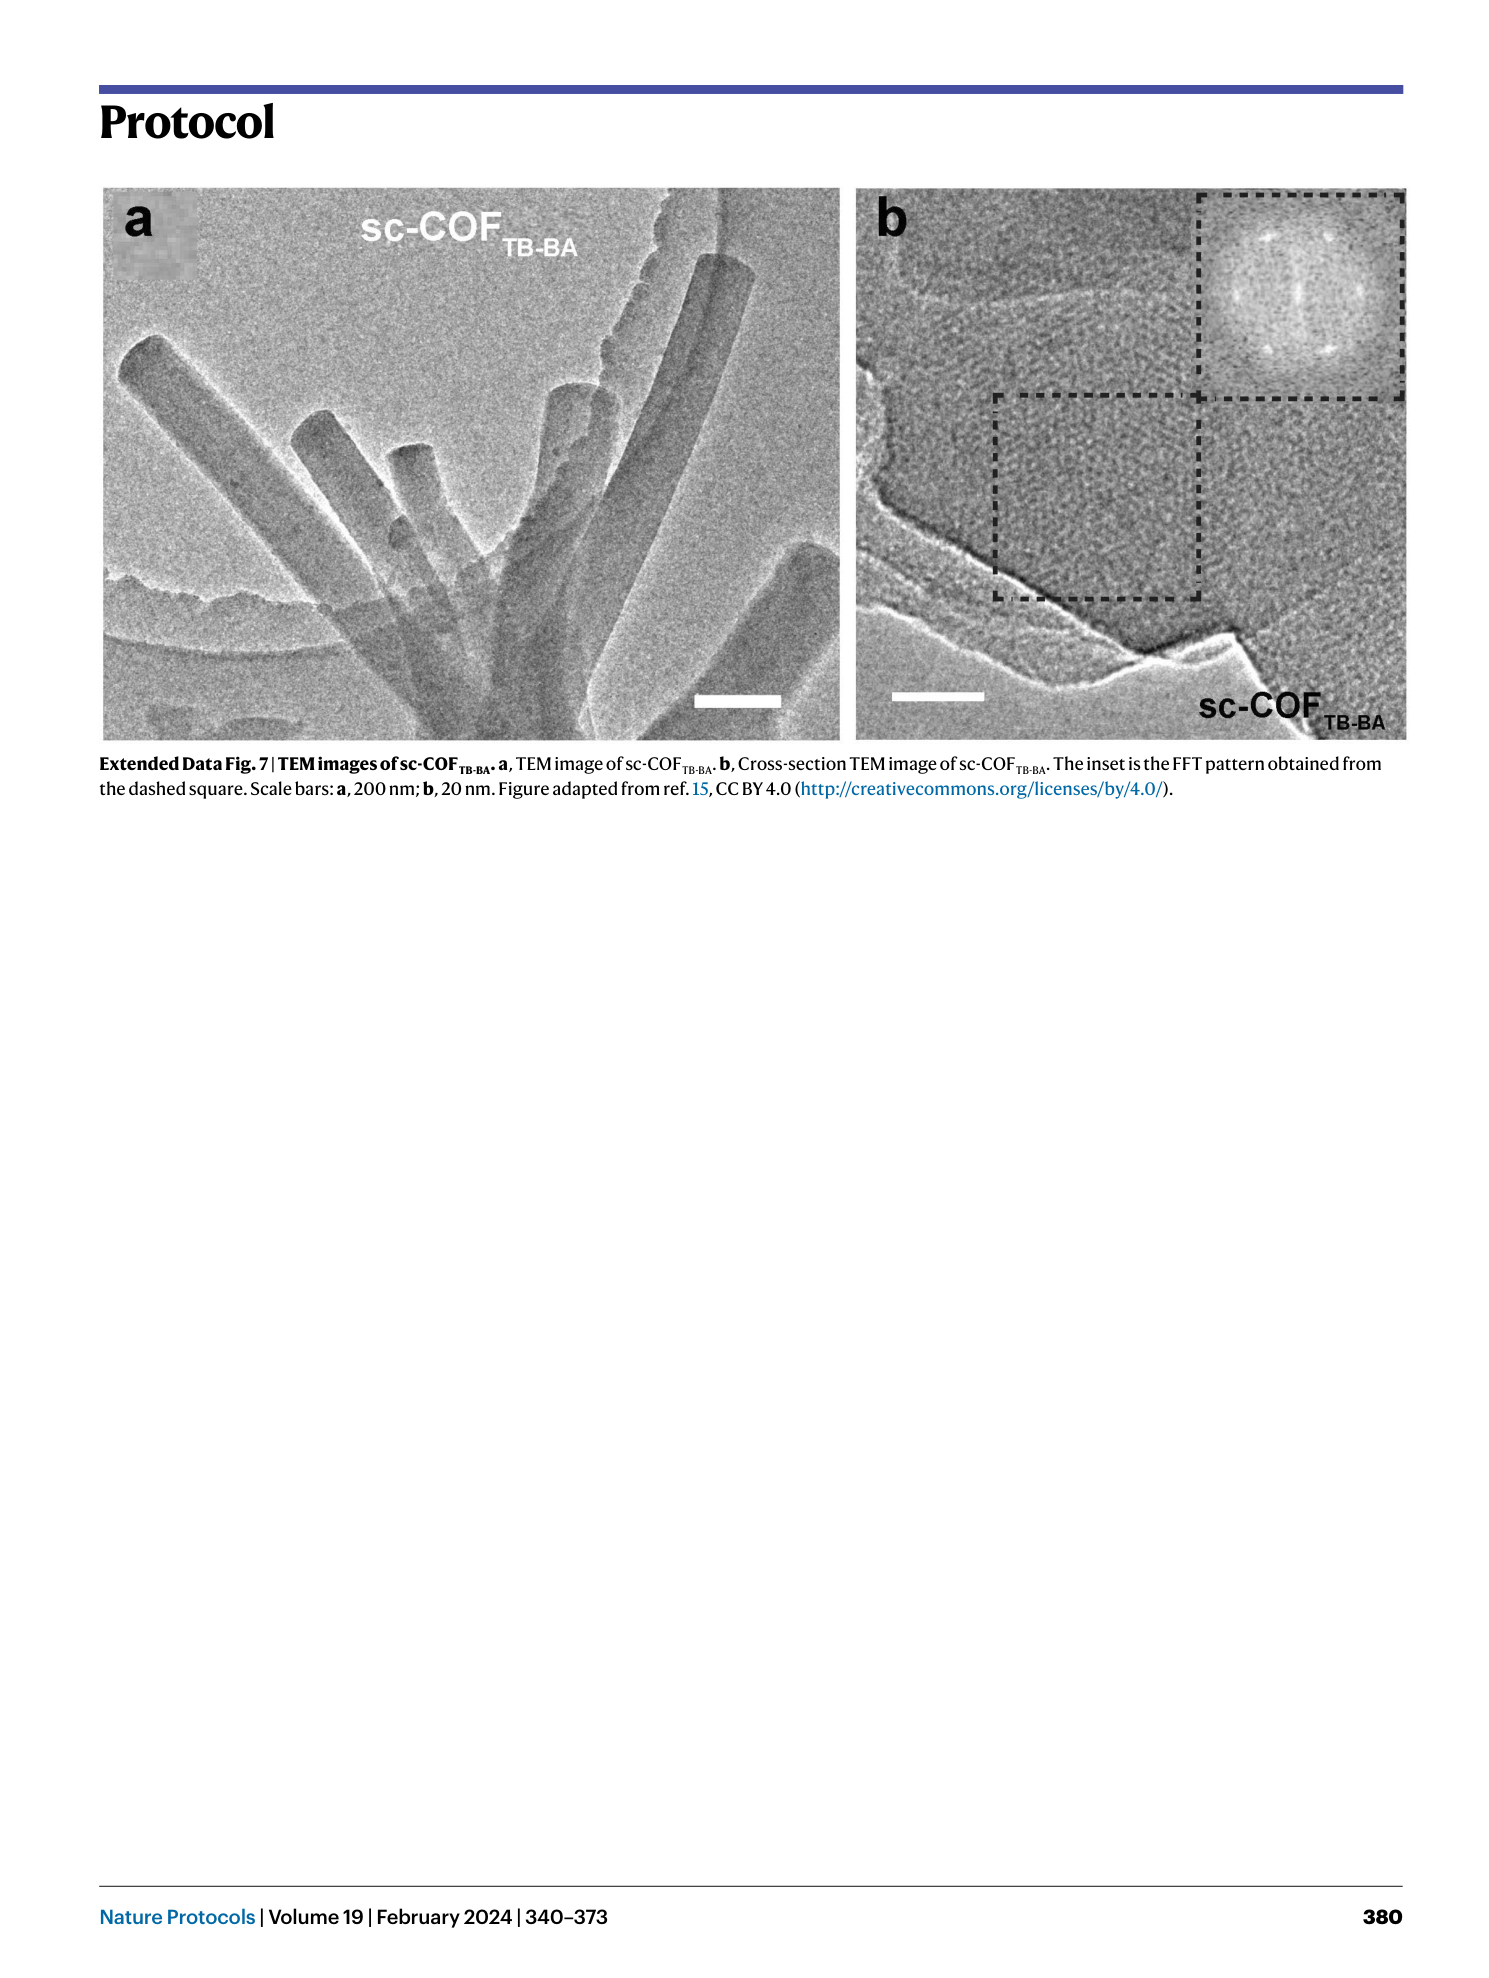
Extended Data Fig. 7 TEM images of sc-COF TB-BA .
a , TEM image of sc-COF TB-BA . b , Cross-section TEM image of sc-COF TB-BA . The inset is the FFT pattern obtained from the dashed square. Scale bars: a , 200 nm; b , 20 nm. Figure adapted from ref. 15 , CC BY 4.0 ( http://creativecommons.org/licenses/by/4.0/ ).
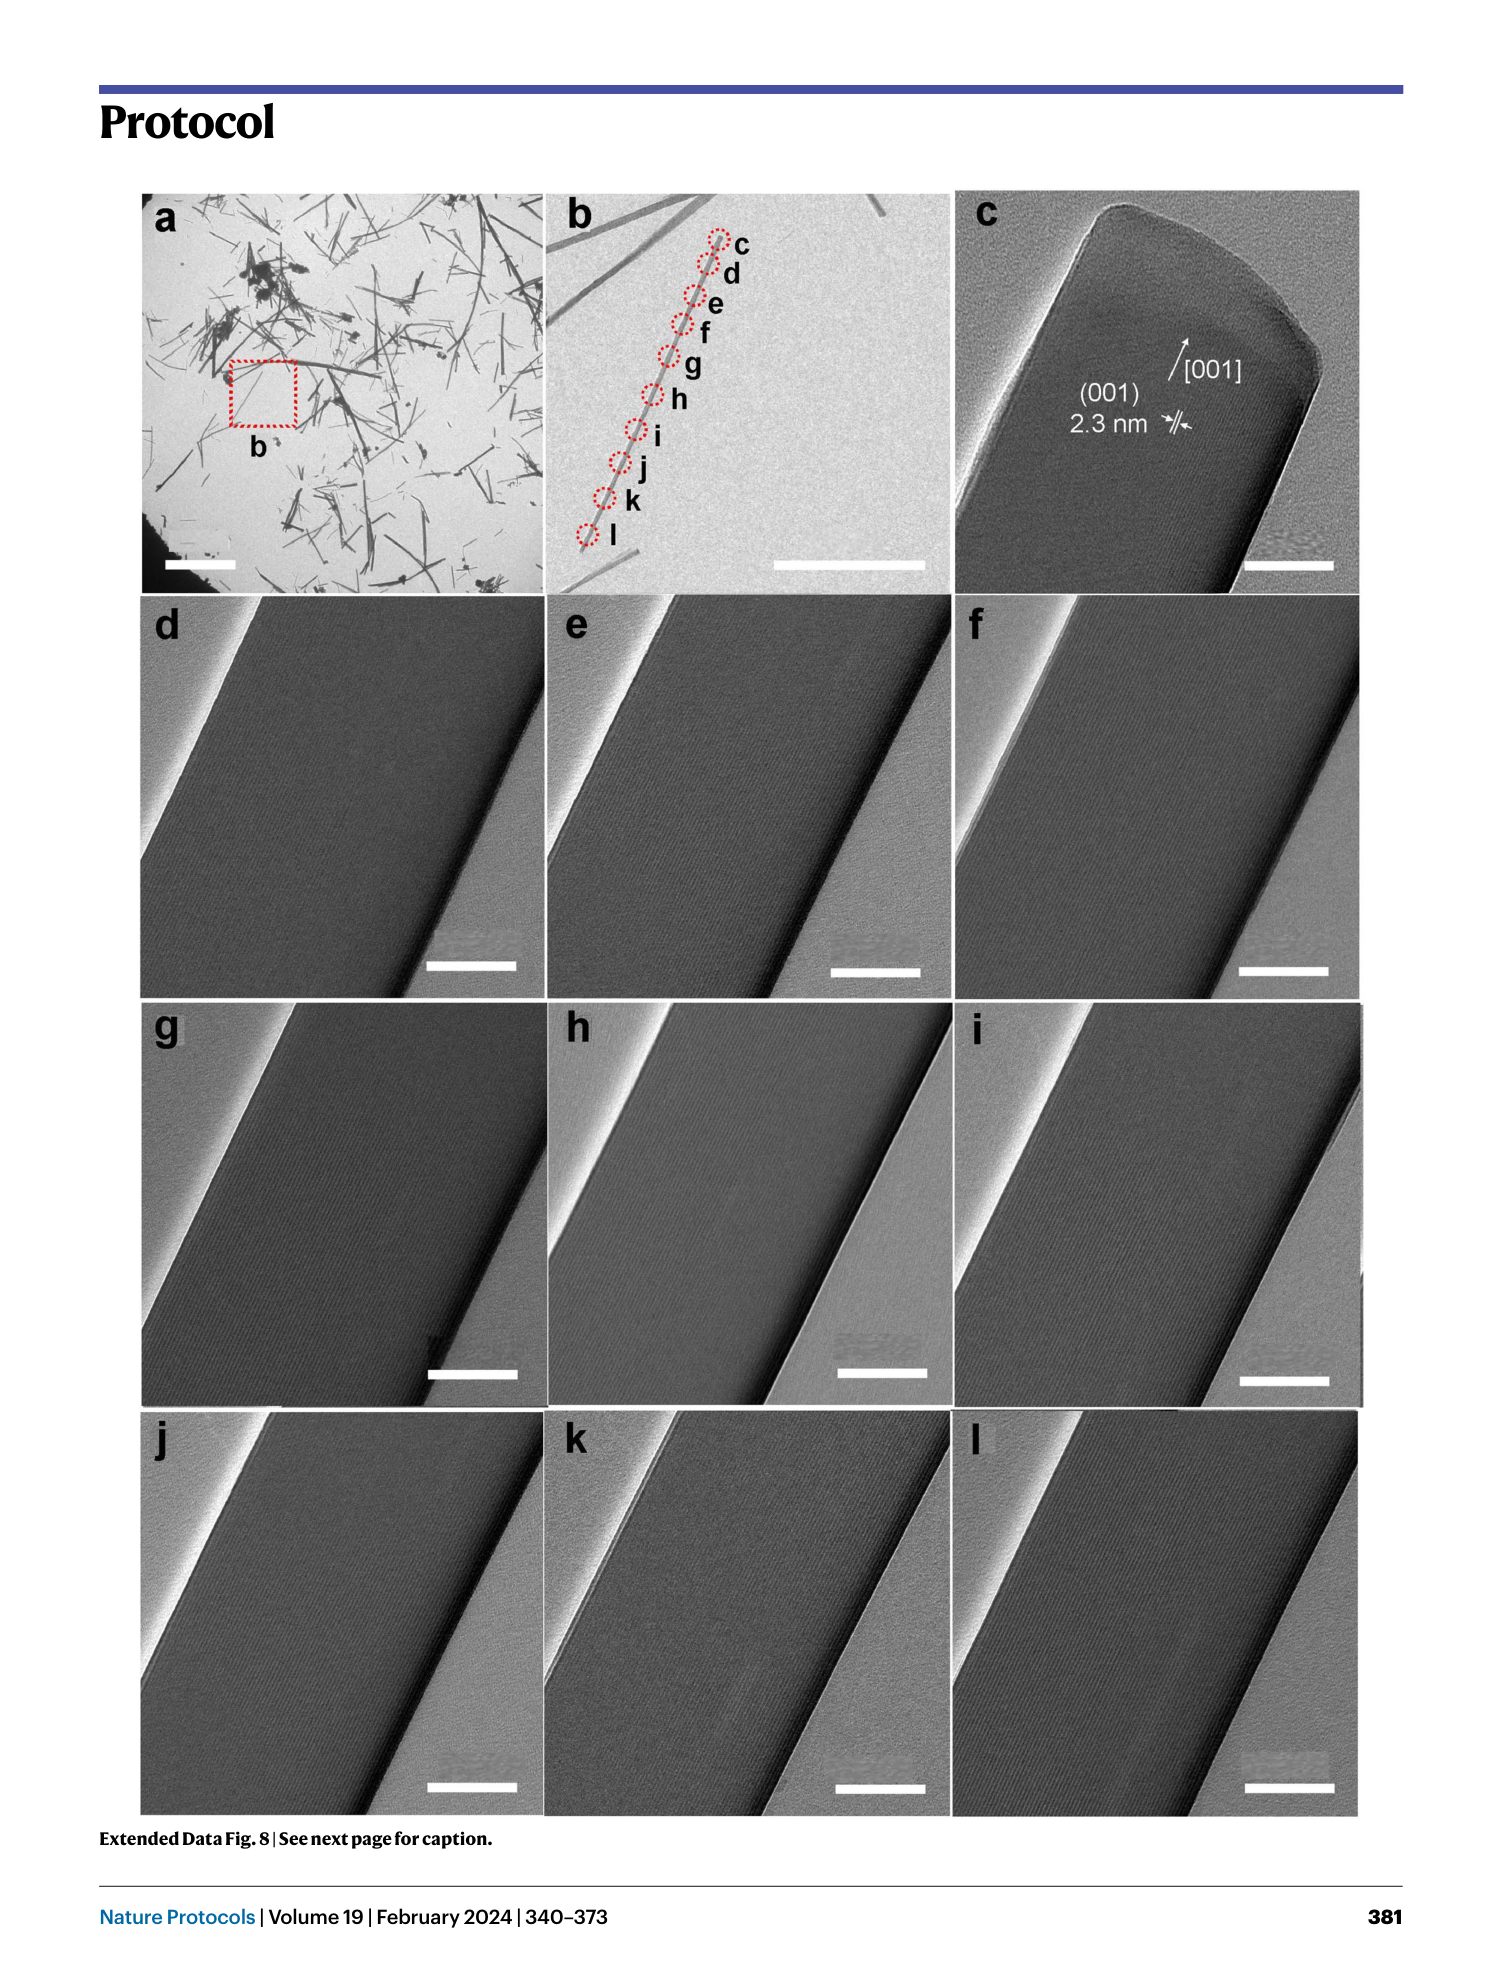
Extended Data Fig. 8 TEM images of a sc-COF TP-Py single crystal.
a , TEM image and b , enlarged image collected from the dashed area in a. c-l , HR-TEM images collected from the dashed areas in b . Scale bars: a , 10 μm; b , 5 μm; c – l , 50 nm. Figure adapted from ref. 15 , CC BY 4.0 ( http://creativecommons.org/licenses/by/4.0/ ).
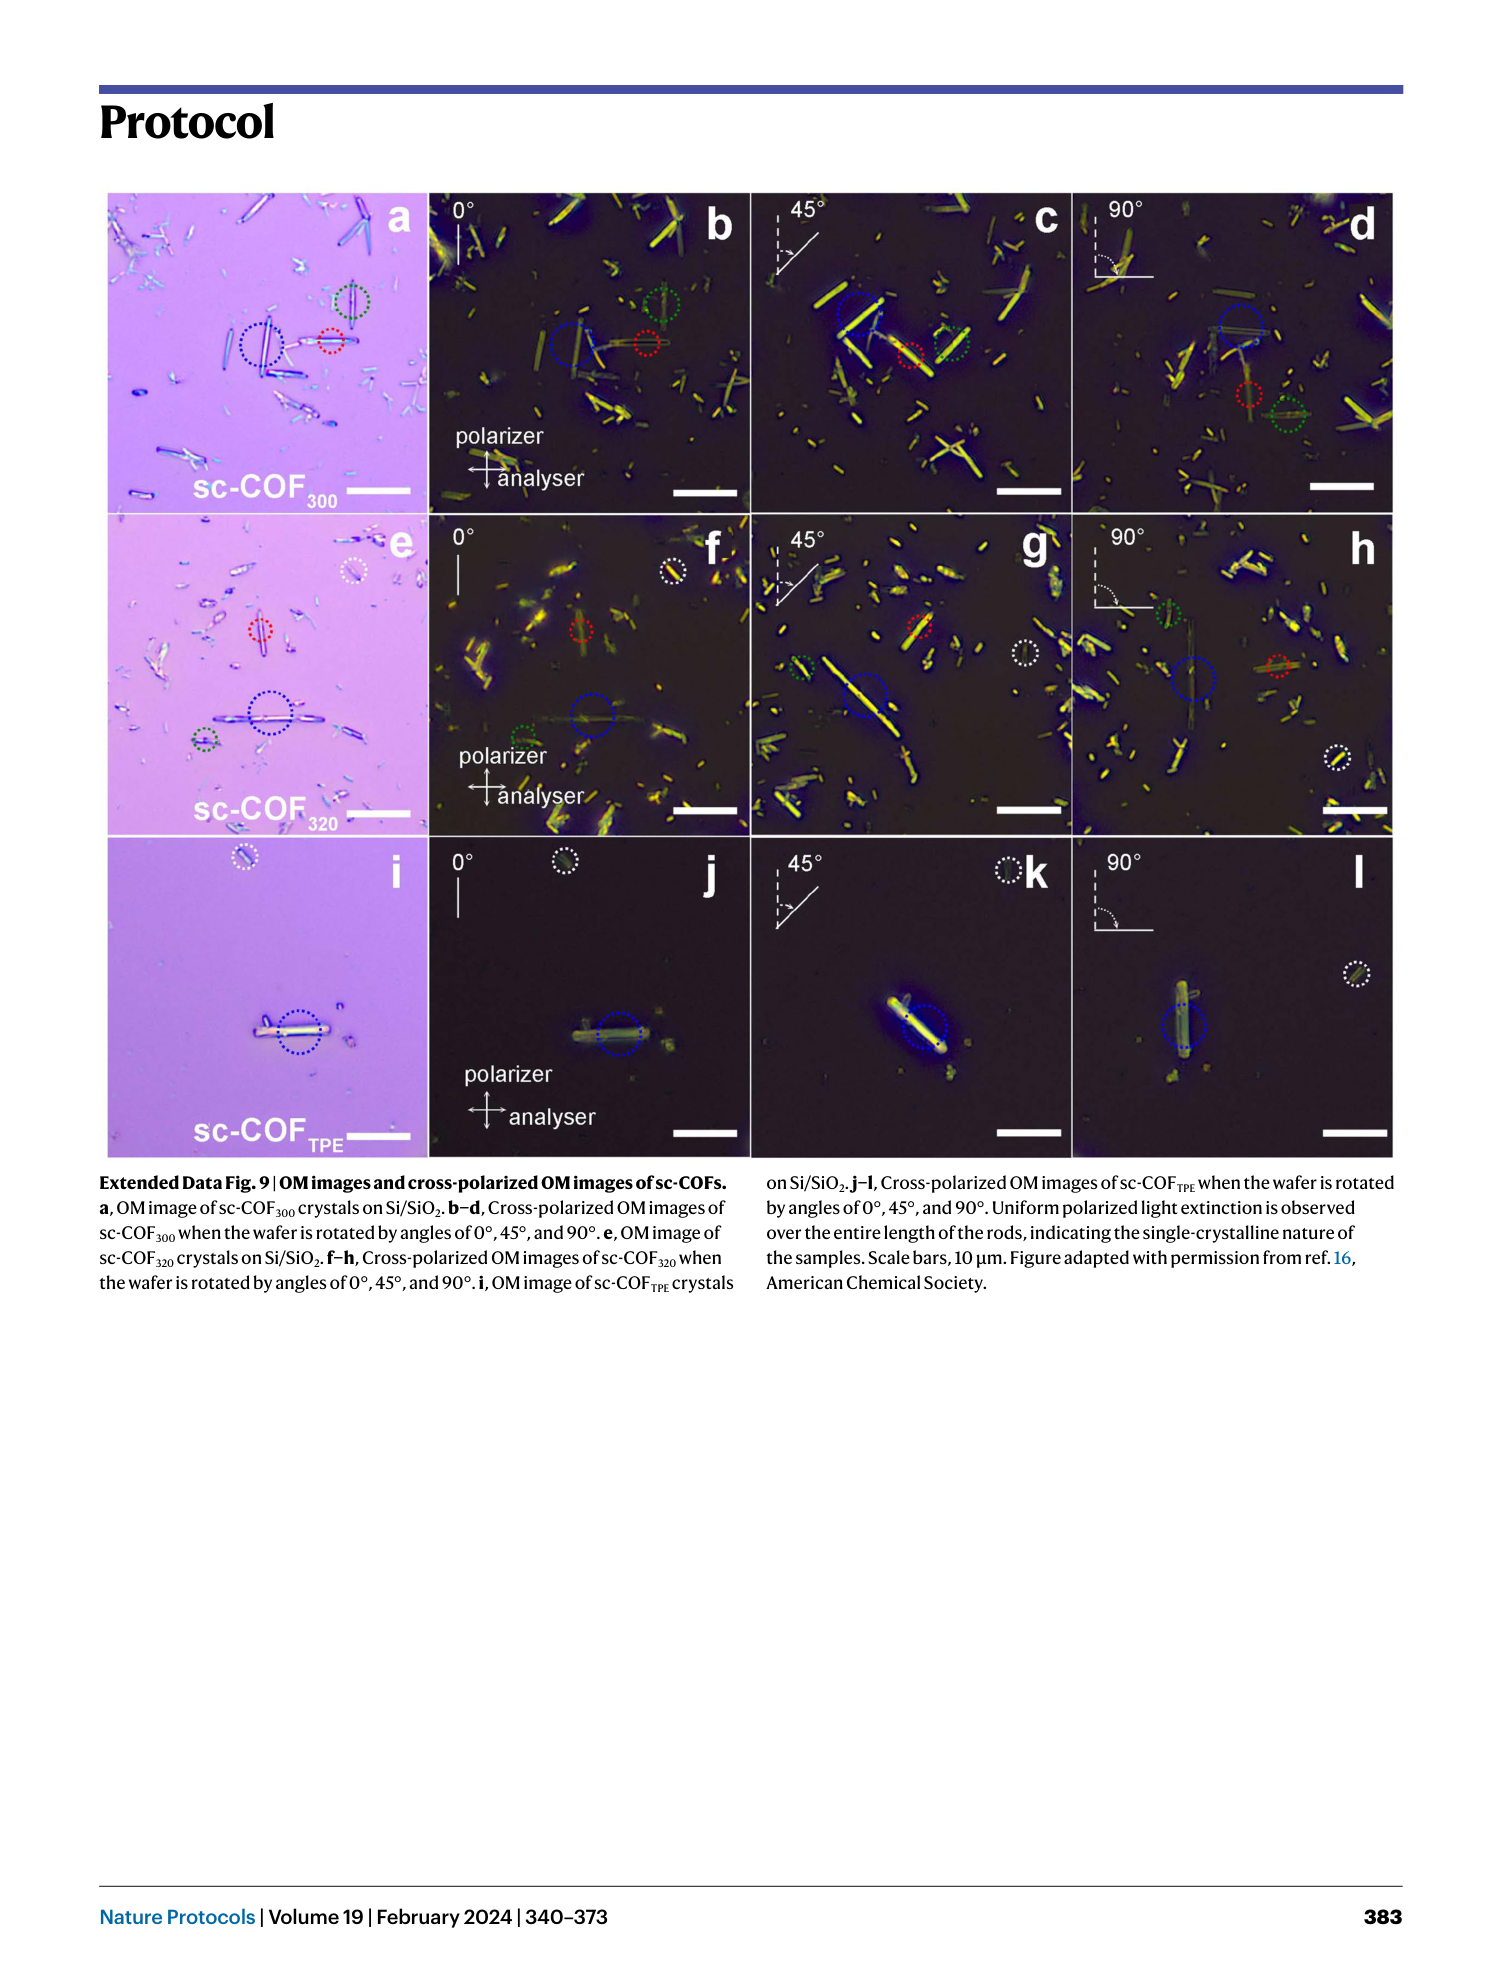
Extended Data Fig. 9 OM images and cross-polarized OM images of sc-COFs.
a , OM image of sc-COF 300 crystals on Si/SiO 2 . b−d , Cross-polarized OM images of sc-COF 300 when the wafer is rotated by angles of 0°, 45°, and 90°. e , OM image of sc-COF 320 crystals on Si/SiO 2 . f−h , Cross-polarized OM images of sc-COF 320 when the wafer is rotated by angles of 0°, 45°, and 90°. i , OM image of sc-COF TPE crystals on Si/SiO 2 . j−l , Cross-polarized OM images of sc-COF TPE when the wafer is rotated by angles of 0°, 45°, and 90°. Uniform polarized light extinction is observed over the entire length of the rods, indicating the single-crystalline nature of the samples. Scale bars, 10 μm. Figure adapted with permission from ref. 16 , American Chemical Society.
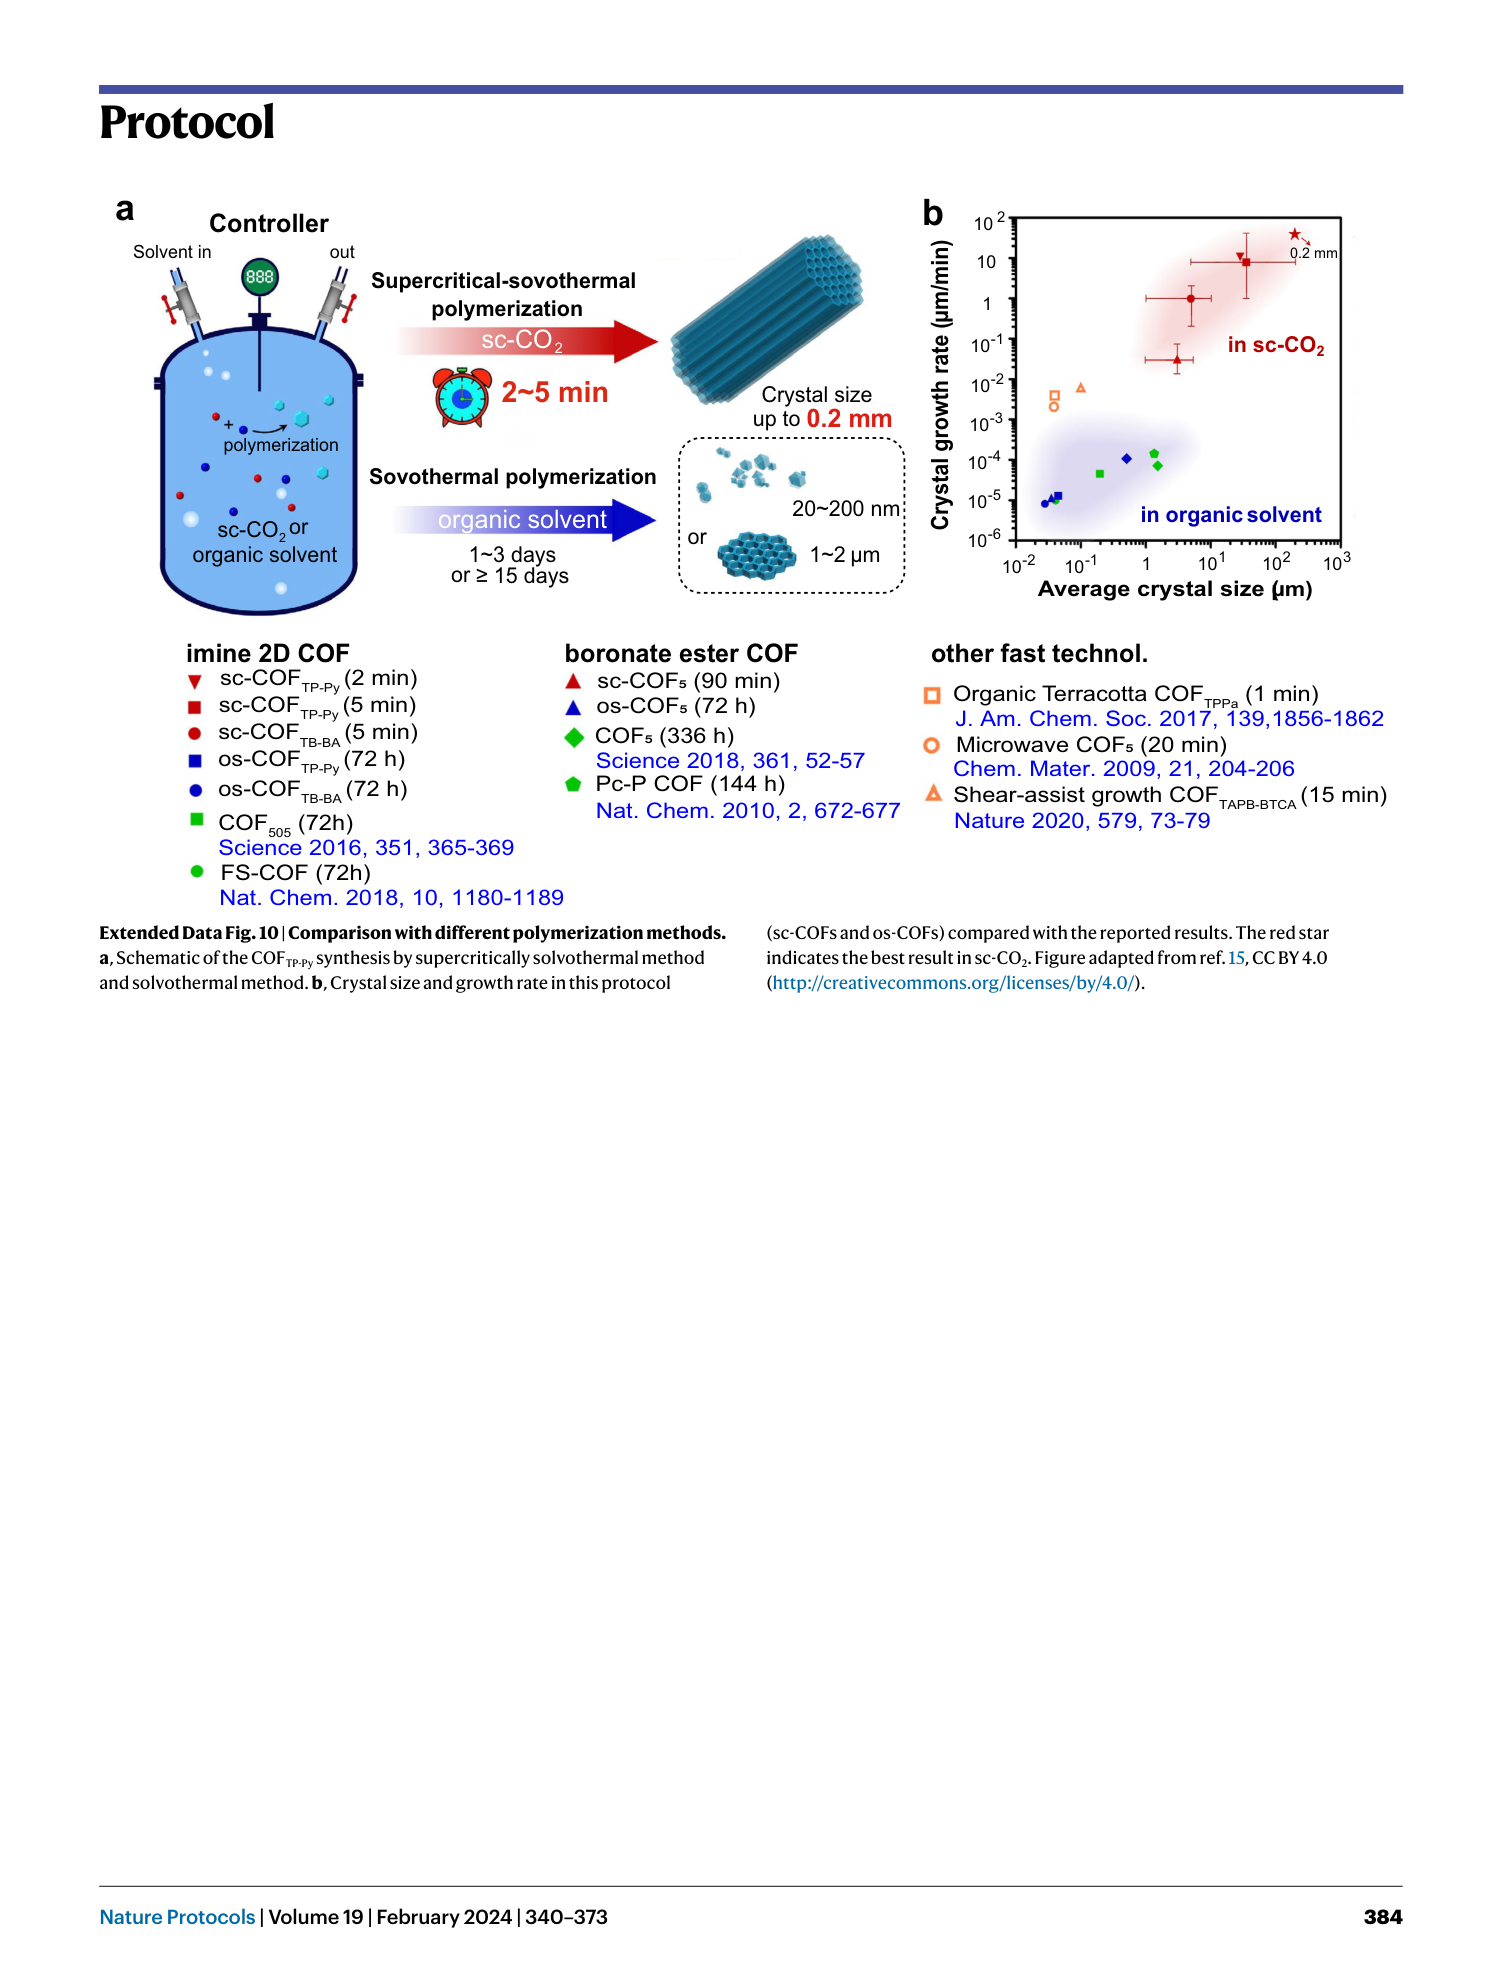
Extended Data Fig. 10 Comparison with different polymerization methods.
a , Schematic of the COF TP-Py synthesis by supercritically solvothermal method and solvothermal method. b , Crystal size and growth rate in this protocol (sc-COFs and os-COFs) compared with the reported results. The red star indicates the best result in sc-CO 2 . Figure adapted from ref. 15 , CC BY 4.0 ( http://creativecommons.org/licenses/by/4.0/ ).
