Quantitative immunoblot analysis of LRRK1 signalling pathway
Francesca Tonelli, Dario Alessi, Asad Malik, Athanasios Karapetsas
Abstract
Accurate, quantitative analysis of protein expression and modifications (such as phosphorylation) is critical when studying cell signalling. Here we describe our method for efficient immunoblotting analysis of the LRRK1 signalling pathway components in cell and mouse tissue extracts. Specifically, we immunoblot using rigorously validated and characterized antibodies for LRRK1-total, Rab7A and pS72 Rab7A, pT202/Y204 ERK1/2, phosphor(Ser)-PKC Substrates and GAPDH or Tubulin (loading controls), although the protocol described here can also be applied to different cell components. Included are procedures for sample preparation from cultured cells and mouse tissue, gel electrophoresis, protein transfer, and antibody incubation.
Steps
Preparation of lysates from cultured cells
4Room temperature culture media without Foetal bovine serum (FBS) into the dish. Pour off media from the culture dish and completely aspirate any residual media. Immediately add freshly prepared ice-cold lysis buffer, ensuring that the entire surface is covered by lysis buffer.
Immediately transfer the cell dishes to ice.
Scrape the cells on the dish using a cell lifter (Sigma-Aldrich CLS3008, or equivalent) to ensure all cells are detached from the dish.
Using a pipette, transfer cell lysate to an Eppendorf tube On ice.
Leave samples On ice for 0h 20m 0s to allow for efficient lysis.
Clarify lysates by centrifugation at 20800x g,4°C.
Transfer the supernatants into new Eppendorf tubes and discard the pellet. Keep the tubes On ice.
Preparation of samples for immunoblot analysis
Determine the protein concentration of cell or tissue lysates by Bradford assay according to the manufacturer’s instructions, performing measurements in triplicate.
Prepare samples for immunoblotting to achieve the same protein concentration for all samples (ideally, 0.5 to 2, depending on the sample at the lowest concentration) by combining the cell lysate with lysis buffer. Add a quarter of a volume of 4X SDS/LDS loading buffer freshly supplemented with beta-mercaptoethanol (i.e. for 7.5µL of lysate/lysis buffer mix, add 2.5µL of loading buffer). Mix by vortexing.
Incubate samples for 0h 5m 0s at 70°C heating block before immunoblot analysis.
SDS-polyacrylamide gel electrophoresis (SDS-PAGE)
Load samples onto a NuPAGE 4–12% Bis–Tris Midi Gel (ThermoFisherScientific, Cat#WG1402BOX or Cat#WG1403BOX), or a self-cast 10% Bis-Tris gel, alongside pre-stained molecular weight markers (ranging from 10 kDa to 250 kDa). Rinse wells carefully with running buffer before loading samples.
Electrophorese samples at 130V with MOPS SDS running buffer for 2h 0m 0s or until the blue dye runs off the gel.
Protein transfer (Wet electroblotting)
Equilibrate the gel, one piece of nitrocellulose membrane (GE Healthcare, Amersham Protran Supported 0.45 μm NC) and two pieces of filter paper (WhatmanTM 3MM Chr Chromatography Paper, or equivalent) (all of the same size as the gel) by pre-soaking them in transfer buffer.
Assemble the gel and membrane transfer stack in a tray filled with transfer buffer to ensure that all components are submerged during the assembling. Place one sponge pad inside the cassette holder (on the side that will be facing the cathode). Place one piece of filter paper on top of the sponge pad, followed by the gel, nitrocellulose membrane, another piece of filter paper and another sponge pad.
Carefully close the cassette holder and insert it in the transfer tank. Fill the tank with transfer buffer.
Electrophoretically transfer proteins from gel onto a nitrocellulose membrane at 100 V (constant voltage) for 1h 30m 0s 70On ice using a wet transfer system.
After transfer, stain membranes with Ponceau solution to assess transfer efficiency and general quality of the samples. If an image is required for record, the Ponceau-stained membraned can be scanned.
Each membrane can be divided into three sections by two horizontal cuts (one cut just above the 75 kDa ladder band and another cut between the 37.5 kDa and 25 kDa ladder bands) (Figure 1):
- ‘top section’ (from the top of the membrane to the 75 kDa marker) - to be probed for LRRK1
- ‘middle section’ (between the 75 kDa and the 37.5 kDa marker) - to be probed for GAPDH/tubulin (loading control)
- ‘bottom section’ (from the 37.5 kDa marker to the bottom of the membrane) - to be probed for pS72-Rab7A/Rab7A

Membrane blocking and antibody incubation
Destain membranes from Step 19 by washing with TBS-T and incubate in blocking solution for at least 0h 15m 0s at 70Room temperature on a see-saw rocker.
Rinse the membrane in TBS-T and incubate 0h 15m 0s at 4°C with primary antibodies (diluted in 5% (w/v) BSA in TBS-T to their working concentration – Table 1), as follows:
Table 1:
| A | B | C | D | E |
|---|---|---|---|---|
| Antibody Target | Company | Cat. number | Host species | Dilution |
| pS72 Rab7A | Abcam Inc. | MJF-38, Clone 1 | Rabbit | 1 ug/ml |
| Rab7A (Total) | Sigma | R8779 | Mouse | 1 ug/ml |
| pT202/Y204 ERK1/2 | Cell Signalling Technology | #9101 | Rabbit | 1 ug/ml |
| Phospho-(Ser) PKC Substrate Antibody | Cell Signalling Technology | #2261 | Rabbit | 1 ug/ml |
| LRRK1 (total) (C-terminus) | MRC-PPU Reagents and Services, University of Dundee | S405C | Sheep | 1 ug/ml |
| GAPDH | Antibodies Inc./NeuroMab | sc-32233 | Mouse | 1:5,000 |
| alpha-tubulin | Cell Signaling Technology | 3873 | Mouse | 1:5,000 |
After incubation with primary antibodies, wash membranes in TBS-T on a see-saw rocker (3 washes, 5-10 minutes per wash).
Incubate membranes with near-infrared fluorescent dye-labelled secondary antibodies (diluted to the working concentration: 1:20,000) for 1h 0m 0s at 4Room temperature on a see-saw rocker.
Table 2:
| A | B | C | D |
|---|---|---|---|
| Secondary Antibodies | Company | Cat. number | Notes |
| goat anti-mouse IRDye 680LT | LI-COR | 926-68020 | |
| goat anti-mouse IRDye 800CW | LI-COR | 926-32210 | |
| goat anti-rabbit IRDye 800CW | LI-COR | 926-32211 | |
| donkey anti-mouse IRDye 680LT | LI-COR | 926-68022 | |
| donkey anti-mouse IRDye 800CW | LI-COR | 926-32212 | |
| donkey anti-rabbit IRDye 800CW | LI-COR | 926-32213 | |
| donkey anti-goat IRDye 800CW | LI-COR | 926-32214 | Reacts with Sheep primary Abs |
Extensively wash membranes in TBS-T on a see-saw rocker (4 washes, 10-15 minutes per wash).
Image acquisition and Analysis
Protein bands are acquired via near infrared fluorescent detection using the Odyssey CLx Imaging System and the signal intensity quantified using the Image Studio Software.
Analyse immunoblotting data using a software for statistical analysis (Graphpad Prism, or equivalent).
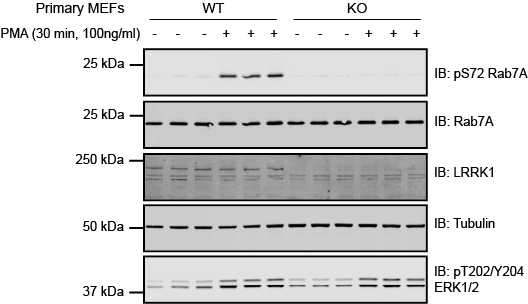
Figure 2. Representative results of quantitative immunoblotting analysis of pSer72 Rab7A/total Rab7A and total LRRK1 levels performed in extracts from wild-type (WT) and homozygous LRRK1 knock-out (KO) mouse embryonic fibroblasts treated +/- PKC activator PMA (100 ng/ml, 30 min) according to the protocol described here.
