NMR Spectroscopy of Large Functional RNAs: From Sample Preparation to Low-Gamma Detection
Robbin Schnieders, Robbin Schnieders, Bozana Knezic, Bozana Knezic, Heidi Zetzsche, Heidi Zetzsche, Alexey Sudakov, Alexey Sudakov, Tobias Matzel, Tobias Matzel, Christian Richter, Christian Richter, Martin Hengesbach, Martin Hengesbach, Harald Schwalbe, Harald Schwalbe, Boris Fürtig, Boris Fürtig
Abstract
NMR spectroscopy is a potent method for the structural and biophysical characterization of RNAs. The application of NMR spectroscopy is restricted in RNA size and most often requires isotope-labeled or even selectively labeled RNAs. Additionally, new NMR pulse sequences, such as the heteronuclear-detected NMR experiments, are introduced. We herein provide detailed protocols for the preparation of isotope-labeled RNA for NMR spectroscopy via in vitro transcription. This protocol covers all steps, from the preparation of DNA template to the transcription of milligram RNA quantities. Moreover, we present a protocol for a chemo-enzymatic approach to introduce a single modified nucleotide at any position of any RNA. Regarding NMR methodology, we share protocols for the implementation of a suite of heteronuclear-detected NMR experiments including 13C-detected experiments for ribose assignment and amino groups, the CN-spin filter heteronuclear single quantum coherence (HSQC) for imino groups and the 15N-detected band-selective excitation short transient transverse-relaxation-optimized spectroscopy (BEST-TROSY) experiment. © 2020 The Authors.
Basic Protocol 1 : Preparation of isotope-labeled RNA samples with in vitro transcription using T7 RNAP, DEAE chromatography, and RP-HPLC purification
Alternate Protocol 1 : Purification of isotope-labeled RNA from in vitro transcription with preparative PAGE
Alternate Protocol 2 : Purification of isotope-labeled RNA samples from in vitro transcription via centrifugal concentration
Support Protocol 1 : Preparation of DNA template from plasmid
Support Protocol 2 : Preparation of PCR DNA as template
Support Protocol 3 : Preparation of T7 RNA Polymerase (T7 RNAP)
Support Protocol 4 : Preparation of yeast inorganic pyrophosphatase (YIPP)
Basic Protocol 2 : Preparation of site-specific labeled RNAs using a chemo-enzymatic synthesis
Support Protocol 5 : Synthesis of modified nucleoside 3′,5′-bisphosphates
Support Protocol 6 : Preparation of T4 RNA Ligase 2
Support Protocol 7 : Setup of NMR spectrometer for heteronuclear-detected NMR experiments
Support Protocol 8 : IPAP and DIPAP for homonuclear decoupling
Basic Protocol 3 : 13C-detected 3D (H)CC-TOCSY, (H)CPC, and (H)CPC-CCH-TOCSY experiments for ribose assignment
Basic Protocol 4 : 13C-detected 2D CN-spin filter HSQC experiment
Basic Protocol 5 : 13C-detected C(N)H-HDQC experiment for the detection of amino groups
Support Protocol 9 : 13C-detected CN-HSQC experiment for amino groups
Basic Protocol 6 : 13C-detected “amino”-NOESY experiment
Basic Protocol 7 : 15N-detected BEST-TROSY experiment
INTRODUCTION
RNAs are macromolecules that play indispensable roles in the biological processes of all living organisms. Besides the well-known RNAs that are involved in coding and decoding of genes (mRNAs, tRNAs, and rRNAs), there is a plethora of functional, diverse classes of RNAs that are essential in regulation and expression, such as riboswitches (Winkler, Nahvi, & Breaker, 2002) and RNA thermometers (Altuvia, Kornitzer, Teff, & Oppenheim, 1989), to only name a few. To exert their biological function, RNAs have to adopt certain defined conformations described by distinct secondary and tertiary structures.
Among other techniques, NMR spectroscopy is one of the most powerful methods for studying RNA's structure and conformational dynamics in solution. This statement is illustrated by the fact that ∼40% of all current RNA structures were determined by NMR techniques (Berman et al., 2000). Besides structural information, information on dynamics (Dethoff, Petzold, Chugh, Casiano-negroni, & Al-hashimi, 2012), the interactions with other RNAs (Davis et al., 2005), proteins (Carlomagno, 2014), ions (Butcher, Allain, & Feigon, 2000), and small ligands (Reining et al., 2013) can be characterized by NMR spectroscopy. However, for RNAs, the NMR technique currently sets a size limitation to molecules of up to ∼150 nucleotides (nt) using site-selective labeling strategies (Alvarado et al., 2014).
For all NMR studies, the preparation of milligram quantities of RNA in an isotope-labeled form is a prerequisite. Isotope labeling can include 15N-only, 15N,13C as well as 15N,13C,2H, which are NMR active but non-radioactive isotopes enriched above their natural abundance of 0.3%, 1%, and 0.01%, respectively. While the incorporation of 13C,15N isotopes has little if any effect on RNA sample stability, 2H incorporation can change for example the thermal stability of an RNA of interest (Katz, Crespi, & Finkel, 1964). For the synthesis of isotope-labeled RNAs, both biochemical and chemical methods have been developed in the past. However, due to the restricted access to isotope-labeled building blocks required for chemical solid phase synthesis, biochemical synthesis that relies on the enzymatic in vitro transcription with DNA-dependent RNA polymerases has become the method of choice in many laboratories, also due to easier setup requirements.
The exact workflow of the biochemical synthesis of an RNA of interest is variable depending on the RNA to be investigated and the aim of the NMR spectroscopic study. In any case the synthesis may include the preparation of a set of required enzymes in house, the design and synthesis of a proper DNA template, and finally the purification of the RNA in order to make an appropriate NMR sample. When the characterization of an RNA that is >100 nt is planned, selective or segmental labeling strategies may be favorable due to fewer signals that are more readily identifiable. This labeling can be, for example, conducted enzymatically with ligation-based approaches as was demonstrated for segmentally labeled RNA (Duss, Lukavsky, & Allain, 2012; Tzakos, Easton, & Lukavsky, 2007).
NMR experiments that are based on the excitation and detection of 1H-nuclei (in the following referred to as “protons”) represent the current experimental gold standard for detailed NMR spectroscopic characterizations. This decision of using proton excitation and detection experiments results from the high gyromagnetic ratio and natural abundance of the 1H-isotope that concomitantly lead to a high sensitivity. On the other side, a low chemical shift dispersion due to the chemical similarity in building blocks, the small number of protons in the nucleobases of RNA as well as a rapid solvent exchange of, for example, imino protons, put limitations to proton-based NMR spectroscopy. Heteronuclear-detected NMR experiments represent valuable alternatives to overcome these restrictions as they exhibit a higher chemical shift dispersion and are not participating in the exchange processes mentioned.
Within this protocol, we provide a detailed guide on the preparation of isotope-labeled RNA for NMR studies by in vitro transcription with T7 RNA polymerase (Guillerez, Lopez, Proux, Launay, & Dreyfus, 2005). Because this process is very elaborate, we omit description of some standard procedures (e.g., how to conduct a denaturing polyacrylamide gel electrophoresis) at the same level of detail that is provided for the rest of our protocols. This is indicated in the appropriate place with references to other Current Protocols in Nucleic Acid Chemistry protocols that describe these standard methods in a detailed manner. Our description within this protocol covers the synthesis of the DNA template (Support Protocols 1 and 2), the optimization of the transcription reaction (Basic Protocol 1), the purification of the RNA (Basic Protocol 1, Alternate Protocols 1 and 2) as well as the expression and purification of several required enzymes within this process (Support Protocols 3 and 4). Furthermore, we provide a general guide on the ligation-based chemo-enzymatic synthesis of an RNA that is labeled or modified at a single position (Basic Protocol 2; Keyhani, Goldau, Blümler, Heckel, & Schwalbe, 2018). Here, the chemical synthesis of the required 3′,5′-nucleoside bisphosphate (Support Protocol 5), the ligation reactions with T4 RNA Ligases 1 and 2 as well as the expression and purification of T4 RNA Ligase 2 (Support Protocol 6) are described. Moreover, we provide protocols for carrying out heteronuclear-detected NMR experiments in general (Support Protocols 7 and 8) and describe how to set-up 13C-detected NMR experiments for the ribose assignment, namely (H)CC-total correlation spectroscopy (TOCSY), (H)CPC and (H)CPC-HCC-TOCSY experiments (Basic Protocol 3; Richter et al., 2010). Furthermore, a guide to set up a so-called CN-spin filter heteronuclear single quantum coherence (HSQC) experiment for the determination of the status of hydrogen bonding is provided (Basic Protocol 4; Fürtig et al., 2016). For the characterization of amino groups in RNA, we provide a protocol for the 13C-detected C(N)H-heteronuclear double-quantum correlation (HDQC) experiment (Basic Protocol 5, Support Protocol 9) as well as the “amino”-nuclear Overhauser effect spectroscopy (NOESY) experiment (Basic Protocol 6; Schnieders et al., 2019). With the first set of experiments, all amino resonances can be detected as sharp NMR signals. The latter experiment brings amino groups in direct structural context and yields correlations that are not accessible with 1H-detected experiments. Lastly, the application of the 15N-detected band-selective excitation short transient transverse-relaxation-optimized spectroscopy (BEST-TROSY) experiment for the imino groups is described (Basic Protocol 7; Schnieders et al., 2017).
STRATEGIC PLANNING
When approaching the synthesis and purification of a new RNA of interest for NMR spectroscopic analysis, several important decisions have to be made regarding construct design, labeling, purification strategy, and buffer composition. In this section we will address the different strategic options and will give a small guide on how to plan your RNA synthesis based on your specific requirements.
RNase-free working conditions
In contrast to other biomolecules, working with RNA poses its own challenges when it comes to sample handling. To protect against RNA viruses, humans have evolved a multitude of RNases, RNA degrading enzymes that are expressed on the skin and hairs. Therefore, additional precautions have to be taken to avoid RNase contamination that would subsequently lead to damage or degradation of the RNA sample produced in the laboratory. Those measures apply to personal lab behavior as well as chemicals, solutions, and labware used during RNA handling.
Most importantly, wear gloves at all times to meticulously avoid bringing your skin in direct or indirect contact with an RNA sample. Use consumables and chemicals that are certified to be RNase free by the manufacturer as much as possible. If no RNase-free option is commercially available, a few other protective measures can be taken to avoid RNase contamination. For liquids one can filter solutions prior to use with a cutoff of 1 to 2 kDa or add ribonuclease inhibitor (e.g., RNasin® by Promega) directly to the reaction mix. Instruments or labware can be treated with diethyl dicarbonate (DEPC) solution, and heat-proof glassware can also be heated to 200°C for 2 hr.
Construct design
Because in vitro transcription primarily utilizes T7 RNA polymerase (T7 RNAP) for RNA synthesis, one has to consider two crucial aspects for construct design. First, with the predominantly used (class III) T7 promoter sequence, the polymerase requires at least two guanosine residues as initiating nucleotides in order to transcribe with proper efficiency and yields are dramatically reduced in presence of other starting nucleotides.
Second, T7 RNAP tends to add one or sometimes even a few additional nucleotides at the 3′ end during run-off transcription, which leads to transcript inhomogeneity (Milligan, Groebe, Witherell, & Uhlenbeck, 1987; Milligan & Uhlenbeck, 1989). If this affects your synthesis yield or product homogeneity, both of these difficulties can be avoided by incorporating self-cleaving ribozymes 5′ and 3′ to your RNA sequence of interest (Schürer, Lang, Schuster, & Mörl, 2002). Moreover, a flanking ribozyme can also stabilize the transcription of an otherwise very short RNA product (≤10 nucleotides) that might be subject to abortive transcription initiation. Regarding a subsequent purification via reversed-phase HPLC (RP-HPLC), it is advisable to choose ribozymes that differ significantly in length from your RNA of interest (length difference >15 nt). For a more detailed explanation on the features of possible ribozyme cassettes and how to incorporate them into your sequence we recommend chapter 2 of The Handbook of RNA Biochemistry (Mörl & Hartmann, 2008).
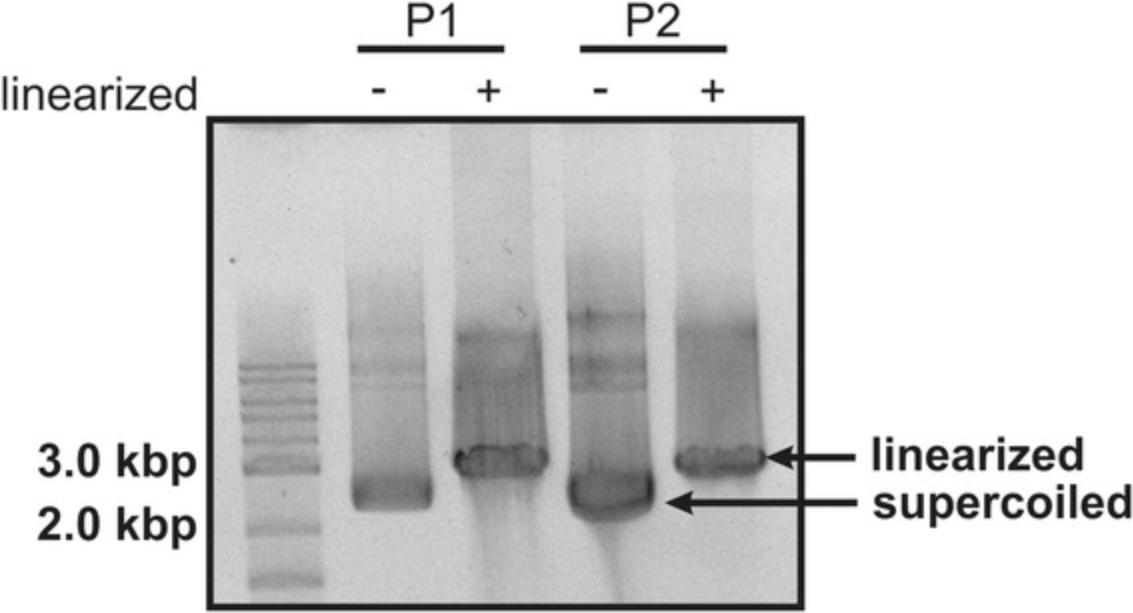
As illustrated in Figure 1, one can either use a linearized DNA plasmid (Support Protocol 1) or polymerase chain reaction (PCR) product (Support Protocol 2) as DNA template for in vitro transcription.
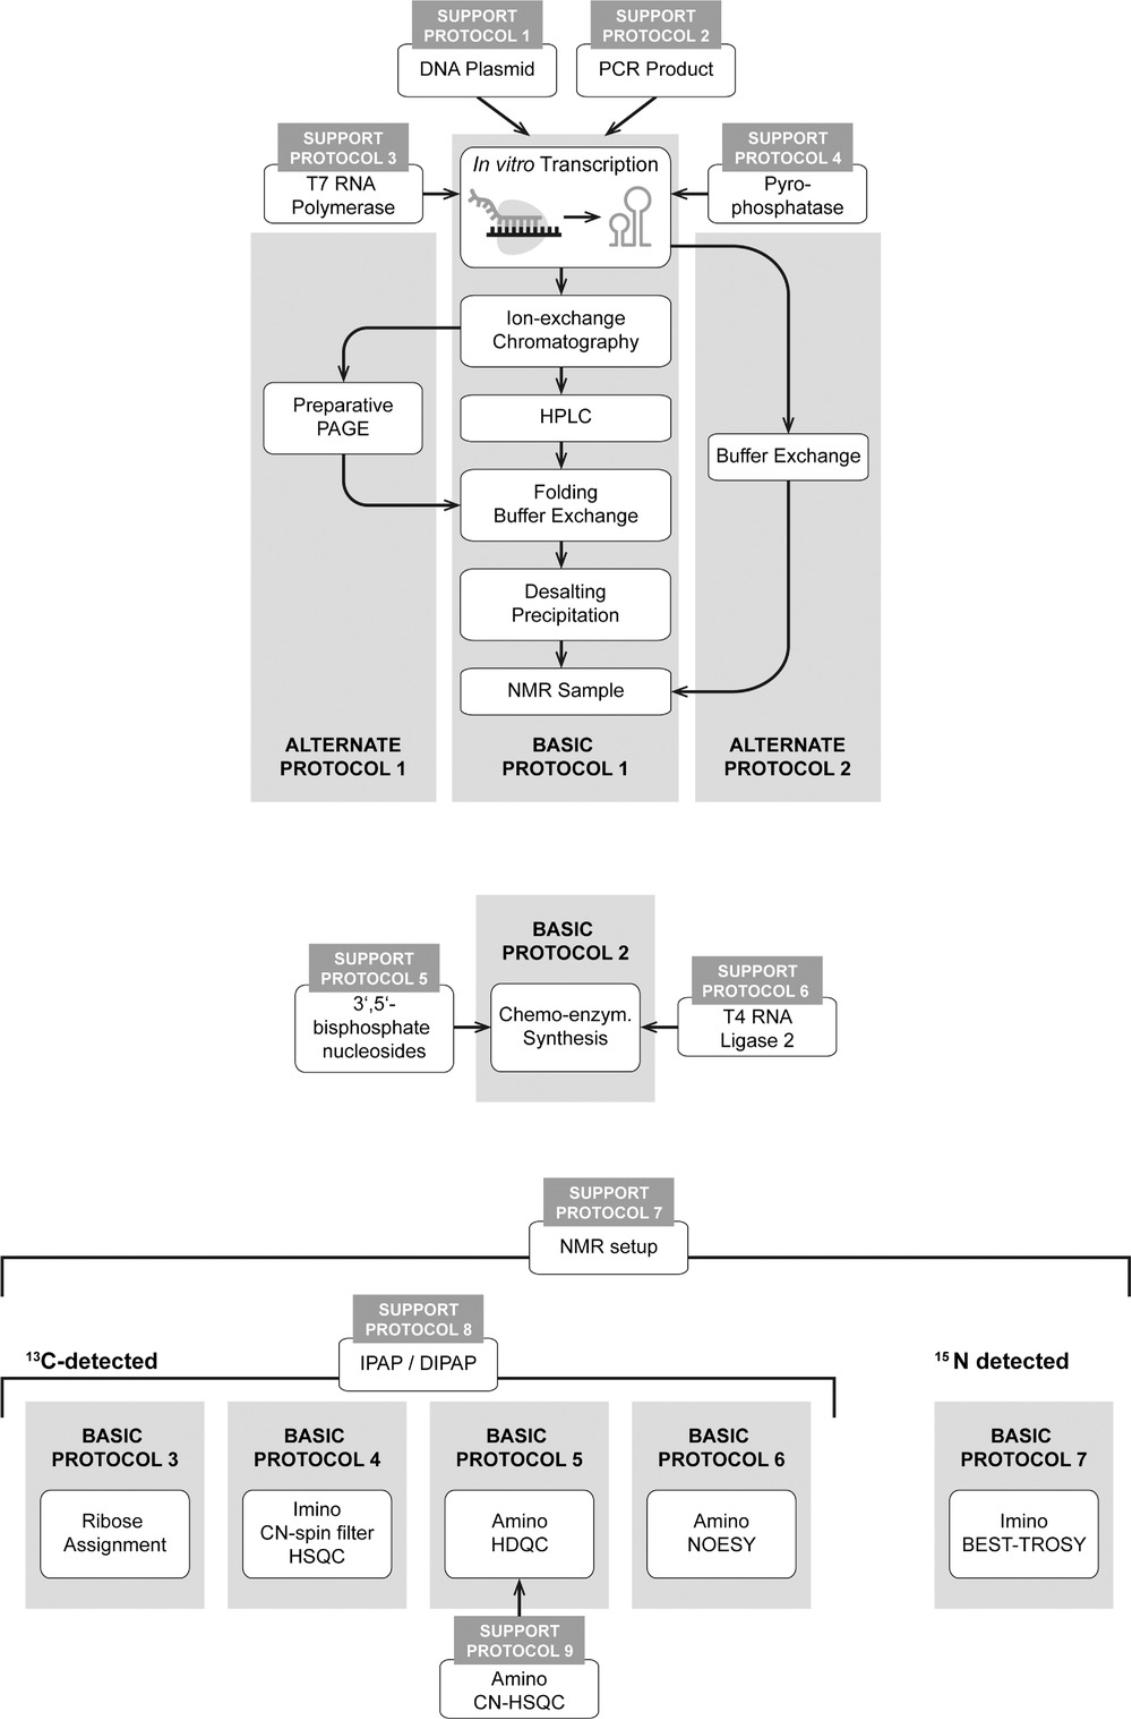
If the RNA transcription cassette is plasmid encoded, it should include a suitable restriction site at the 3′ end to produce run-off transcripts when the linearized plasmid is transcribed. Because DNA plasmid preparation requires cloning, amplification in bacterial cells, plasmid purification, and linearization, it is rather time consuming, while PCR is the considerably faster option. Nonetheless, we sometimes experience a higher transcription efficiency when using plasmid DNA over PCR amplified templates, which might be attributed to the polymerases’ ability to bind the DNA upstream of the T7 promoter and then slide along the strand until it reaches the promoter sequence. In the case of a PCR product this sequential scanning of the T7 RNAP is not possible, so only more direct encounters with the T7 promoter lead to transcription.
Isotope labeling
The labeling strategy for an RNA depends strongly on the objective of the study. For initial assessment of secondary structures via imino proton pattern or NOESY-based assignment of small RNAs, an unlabeled high-concentration sample (>250 µM) is often already sufficient. Moreover, the use of commercially available isotope-labeled rNTPs for NMR-scale RNA production can be rather expensive and should therefore only be considered when transcription and purification protocols are established, and scientific questions cannot be addressed with ¹H experiments.
With increasing RNA size, even proton-based assignments become more difficult due to spectral overlap. Here, more sophisticated heteronuclear NMR experiments can provide additional information on the nucleotide identity. 15N labeling of guanine and uracil residues for example will advance base-specific assignment of resonances through the use of 15N HSQC experiments, while 13C labeled nucleotides can aid in resolving resonances from aromatic and sugar protons via 13C HSQC experiments. Especially with RNAs of increasing length, it is advisable to selectively label only one or two types of nucleotides at a time to dramatically decrease signal overlap. In the case of more advanced structural analyses, full 13C and 15N labeling, sometimes combined with deuteration, is indispensable.
Furthermore, if your project requires a position-selective rather than a uniform isotope labeling strategy, we recommend utilizing the chemo-enzymatic synthesis approach described in Basic Protocol 2. This method not only allows for an incorporation of a single labeled nucleotide into an otherwise unlabeled RNA but also gives rise to RNA constructs that combine differently labeled segments into one strand.
RNA purification
For purification of the RNA to generate NMR samples of sufficient concentration and purity, three major routes are available.
Basic Protocol 1 describes a widely used chromatographic approach, where anion exchange fast protein liquid chromatography (FPLC) and “ion-pair” RP-HPLC are used to successively remove the T7 RNAP, DNA template, residual rNTPs and RNA byproducts including ribozymes from the RNA of interest. After the chromatographic steps, the RNA is freeze dried and desalted before being precipitated with LiClO4/acetone. Finally, the RNA is folded into ideally one homogenous conformation and transferred into a suitable NMR buffer. Note that refolding conditions may vary with the RNA of interest and therefore have to be determined individually. This purification strategy is applicable to RNAs within a wide range of sizes and structures.
If it is not possible to completely separate the ribozymes from your RNA of interest via RP-HPLC or if an HPLC instrument is not available, we recommend switching to a preparative polyacrylamide gel electrophoresis approach, as shown in Alternate Protocol 1. Here, the RNAs are separated in a large-scale denaturing gel electrophoresis and the RNA of interest is extracted from the gel matrix afterwards.
The quickest purification route is described in Alternate Protocol 2, where merely components of low molecular weight, such as Mg(OAc)₂ and residual rNTPs, are removed from the reaction mix and the buffer is exchanged by repeated washing cycles using centrifugal concentrators (Helmling et al., 2015). In this protocol, the conformation adopted by the RNA during transcription is largely maintained, because no denaturing purification steps are performed. Nonetheless, this method should only be utilized when the transcription produces a single RNA product, as byproduct RNAs like ribozymes are not separated from the RNA of interest. In this case, 3′-end homogeneity of the RNA is achieved through the use of 2′-methoxy modified primers during PCR. A PCR product carrying the 2′-methoxy modification at the 3′ end has shown to significantly increase product homogeneity for run-off transcription (Helmling et al., 2015). We recommend using this purification strategy for high throughput RNA structure analysis rather than titration experiments, because the presence of remaining T7 RNAP might interfere with ligand binding.
NMR buffer composition
RNA NMR samples are usually prepared in a buffer containing as few protons as possible (to avoid using deuterated buffer agents) and exhibiting a slightly acidic pH value (to guarantee long term stability of the sample and to reduce solvent exchange of labile protons). Typically, we use the following buffer composition as a starting point: 50 mM KCl, 25 mM K2HPO4/KH2PO4, and 5% (v/v) D2O at pH 6.2. Depending on the nature of your experiments and the investigated RNA, bivalent cations such as Mg²⁺ can be added to stabilize the RNA's structure. As a reference substance for ¹H spectra we recommend sodium trimethylsilylpropanesulfonate (DSS), as its proton chemical shift is neither temperature nor pH dependent. Further adjustments in salt and buffer composition or pH might be required for individual studies, especially if the RNA is investigated as a part of an RNA protein complex.
Basic Protocol 1: PREPARATION OF ISOTOPE-LABELED RNA SAMPLES WITH IN VITRO TRANSCRIPTION USING T7 RNAP, DEAE CHROMATOGRAPHY, AND RP-HPLC PURIFICATION
The analysis of RNAs via NMR spectroscopy requires preparation of a sample with sufficient amount of pure RNA. Typically, samples between 50 and 500 µM in 300 µl buffer volume are used, but higher sample concentrations can be advantageous provided correct folding conditions can be established. In the following, we describe a standard protocol for the preparation of isotope-labeled RNA for NMR applications using the T7 RNAP. This polymerase can be purchased or prepared in house; the respective instructions for the preparation are described in Support Protocol 3.In a first step, the DNA template from which the RNA will be transcribed is amplified. For the amplification two methods are available. The first requires a DNA plasmid, which is amplified in cells, linearized, and subsequently purified (Support Protocol 1). A second approach uses a DNA template produced by solid phase synthesis in combination with a PCR using Phusion® High-Fidelity DNA polymerase (Support Protocol 2). After DNA amplification, test-transcriptions are used to optimize reaction conditions to obtain the highest yield of the target RNA. Under these conditions the preparative transcription reaction can be performed and purified via diethylaminoethanol (DEAE) and RP-HPLC chromatography. Alternative procedures for the purification are shown in Alternate Protocols 1 and Alternate Protocol 2.
Materials
-
Double distilled water (ddH2O)
-
DNA template (see Support Protocols 1 and 2)
-
T7 RNA polymerase (T7 RNAP; see Support Protocol 3)
-
Yeast inorganic pyrophosphatase (YIPP; see Support Protocol 4)
-
500 mM tris/glutamate buffer, pH 8.1 (glutamic acid; Merck, cat. no. G1149)
-
Spermidine (Merck, cat. no. 85558)
-
Magnesium acetate (Mg(OAc)2; Carl Roth, cat. no. 0275.1)
-
Isotope-labeled rNTPs (Silantes/Eurisotop)
-
DTT (Carl Roth, cat. no. 6908.4)
-
Dimethyl sulfoxide (DMSO; Carl Roth, cat. no. A994.2)
-
Denaturing RNA loading buffer (see recipe)
-
Denaturing PAGE gel solution (see recipe)
-
Denaturing PAGE running buffer (1× TBE; see recipe)
-
Diethylaminoethyl-Sepharose (DEAE-Sepharose®; GE Healthcare, cat. no. 17-0709-01)
-
3 M sodium acetate (NaOAc), pH 5.5 (Carl Roth, cat. no. 6773.2)
-
0.1% (v/v) diethyl pyrocarbonate (DEPC; Carl Roth, cat. no. K028.2)
-
Absolute ethanol (Merck, cat. no. 32205-2.5L-M)
-
HPLC buffer A (50 mM potassium phosphate, pH 5.9, 2 mM tetrabutylammonium hydrogen sulfate)
-
HPLC buffer B (HPLC buffer A plus 60% acetonitrile; acetonitrile, Thermo Fisher Scientific, cat. no. A-0627/17)
-
2% (w/v) lithium perchlorate (LiClO4)/acetone (LiClO4, Acros Organics, cat. no. 194711000)
-
40% (v/v) glycerol (native RNA loading buffer; Carl Roth, cat. no. 3783.1)
-
Native PAGE gel solution (see recipe)
-
Native PAGE running buffer (1× TA; see recipe)
-
NMR buffer (see recipe)
-
Magnesium chloride (MgCl2; Carl Roth, cat. no. HN03.2)
-
Deuterium oxide (D2O; Deutero, cat. no. 00507)
-
3-(Trimethylsilyl)propane-1-sulfonate, sodium salt (DSS)
-
Incubator
-
Shaking incubator
-
PAGE casting chamber and glass plates (Biometra multigel from Analytik Jena Company)
-
Heat block
-
Glass column for DEAE-Sepharose ® (e.g., Econo)
-
UV/Vis spectrophotometer (NanoDrop One/One; Thermo Fisher Scientific)
-
Freezer (−20°C/−80°C)
-
Centrifuge (Megafuge 8R; Thermo Fisher Scientific)
-
Lyophilizer/centrifugal vacuum concentrator (Alpha 2-4, Christ; vacuum concentrator plus, Eppendorf)
-
Shaker
-
HPLC device (Elite LaChrom; VWR-Hitachi)
-
HPLC column (e.g., PerfectSil™ RP18, pore size: 300 Å, particle size: 5 µm, 10 × 250 mm)
-
Thin layer chromatography (TLC) plate (ALUGRAM® Xtra SIL G/UV; Macherey-Nagel)
-
Ultraviolet (UV) lamp, 245 nm (Hanau Fluotest; Heraeus)
-
Centrifugal concentrator (e.g., Vivaspin™, Sartorius™)
-
NMR tube (Deutero, Shigemi)
1.Work RNase free. Work on ice.
2.Prepare DNA template for in vitro transcription via plasmid amplification (see Support Protocol 1) or PCR (see Support Protocol 2).
3.Prepare T7 RNAP according to Support Protocol 3.
4.Prepare YIPP according to Support Protocol 4.
5.Prepare all stock solutions for the transcription reactions including all optimization reactions (see steps 7-12).
In vitro transcription
6.Check all test-transcriptions with an analytical denaturing PAGE (denat. PAGE).
7.Optimize transcription reaction (see step 13) on a test scale and start with optimization of the rNTP concentration relative to the Mg(OAc)2 concentration (Fig. 2).
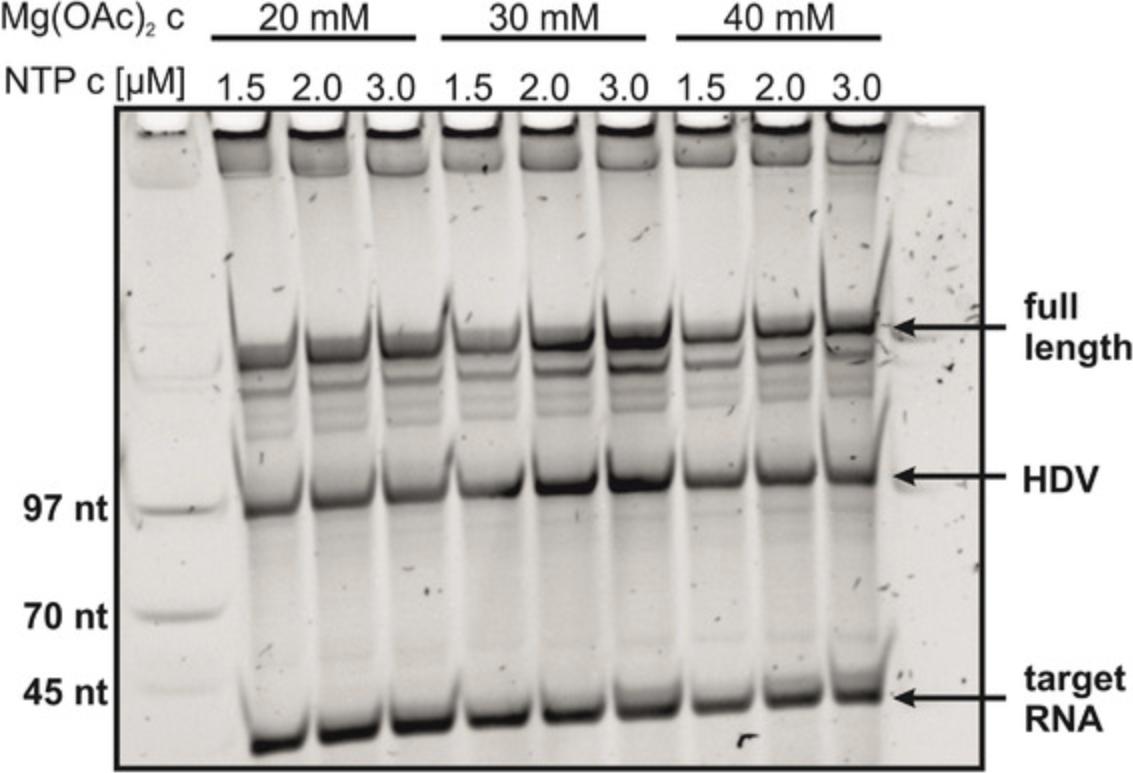
8.Optimize amount of DNA via test-transcriptions.
9.Perform test-transcriptions with up to 20% (v/v) DMSO.
10.Optimize incubation time at 37°C via a test-transcription.
11.Optimize tris/glutamate buffer concentration, if required. Use 100-200 mM tris/glutamate buffer.
12.Perform a test-transcription with the optimized parameters and isotope-labeled rNTPs.
13.Perform preparative transcription with the optimized conditions in a 50-ml reaction tube according to the pipetting scheme outlined in Table 1.
| Reagent | Quantity |
|---|---|
| ddH2O | Add up to 10-25 ml |
| Tris/glutamate buffer (pH 8.1) | 100-200 mM |
| Spermidine | 2 mM |
| Mg(OAc)2 | 5-60 mM |
| rNTPs | 2-5 mM |
| DTT | 20 mM |
| DNA | As optimized |
| DMSO | Up to 20% |
| YIPP | 9.6 µg/ml |
| T7 RNA polymerase | 20 µg/ml |
14.Incubate transcription reaction at 37°C and maximum 120 rpm as long as optimized.
15.Check whether target RNA has been transcribed with a denat. PAGE.
Anion exchange chromatography
16.Remove enzymes, DNA template, free rNTPs, and excess salt with DEAE chromatography using the following conditions:
-
Pour ∼10 ml DEAE sepharose resin into an empty chromatography column and let resin settle completely. Drain supernatant EtOH from DEAE column and wash with 20 ml ddH2O.
-
For inactivation of possible RNase contaminations, wash column with 50 ml 0.1% (v/v) DEPC and then incubate with 0.1% (v/v) DEPC overnight.
-
Drain the 0.1% (v/v) DEPC solution and wash column with 100 ml hot (∼60° to 90°C) ddH2O and equilibrate with 50 ml 0.1 M NaOAc.
Try to avoid disturbing the column resin by carefully pouring the water along the inner wall of the column. For each washing step, make sure resin is settled completely before starting elution.
- Centrifuge transcription reaction (15 min, 4,000 ×g, 4°C) and transfer supernatant onto the column.
Make sure that the resin is settled completely before starting elution.
Optional: Wash salt pellet with 5 ml H2O and centrifuge again for 15 min before pooling both supernatants.
- Collect flowthrough in 10 ml fractions. Load and elute successively with 50 ml of 0.6 M, 1.0 M, 2.0 M, and 3.0 M NaOAc solution.
Expect RNA to elute at around 2 M NaOAc.
17.Use UV/vis absorption spectroscopy to identify fractions with a high absorption at 260 nm and check the corresponding fractions on an analytical denat. PAGE to determine RNA containing fractions.
18.Dilute salt concentration of the product fractions with ddH2O to 0.3-0.6 M NaOAc.
19.Add four volumes of ice-cold absolute ethanol to the product fractions.
20.Incubate at −80°C overnight.
21.Centrifuge at 10,000 × g and 4°C for 30-60 min.
22.Remove supernatant and keep it for further precipitation.
23.Air dry pellet or use a vacuum concentrator for 2 min and reconstitute RNA pellet in ∼1 ml ddH2O. An OD260 of ∼100 is suitable.
24.Purify RNA sample via HPLC. Suitable gradients for different RNA lengths we use in our labs are shown in Tables 2 and 3. In this case an ion-pair RP HPLC with the PerfectSil RP18 column is used at 60°C, which fits for RNA lengths of up to 180 nt. This column is equilibrated with HPLC buffer A for 10-15 min and a flow rate of 5 ml/min is usually used. A different device or another column may require a slightly modified gradient.
| Time (min) | HPLC buffer A (%) | HPLC buffer B (%) |
|---|---|---|
| 0 | 100 | 0 |
| 5 | 67 | 33 |
| 30 | 63 | 37 |
| 45 | 0 | 100 |
| Time (min) | HPLC buffer A (%) | HPLC buffer (%) |
|---|---|---|
| 0 | 100 | 0 |
| 5 | 55 | 45 |
| 30 | 50 | 50 |
| 45 | 0 | 100 |
25.Remove HPLC buffer with a lyophilizer or centrifugal vacuum concentrator.
26.Reconstitute pellet in 1 ml ddH2O.
27.Add five volumes of 2% (w/v) LiClO4/acetone and incubate 2 hr at −20°C.
28.Centrifuge at 10,000 × g and 4°C for 30-60 min.
29.Remove supernatant and reconstitute pellet in ddH2O or NMR buffer depending on the folding method.
Folding and buffer exchange
The folding protocol might need to be adapted for each individual RNA construct. Therefore, some common folding pathways are introduced here. The RNA can be folded in water or in NMR buffer as well as at a high or low RNA concentration. Take into account that high salt and RNA concentrations can induce dimerization. Do not freeze the sample after folding.
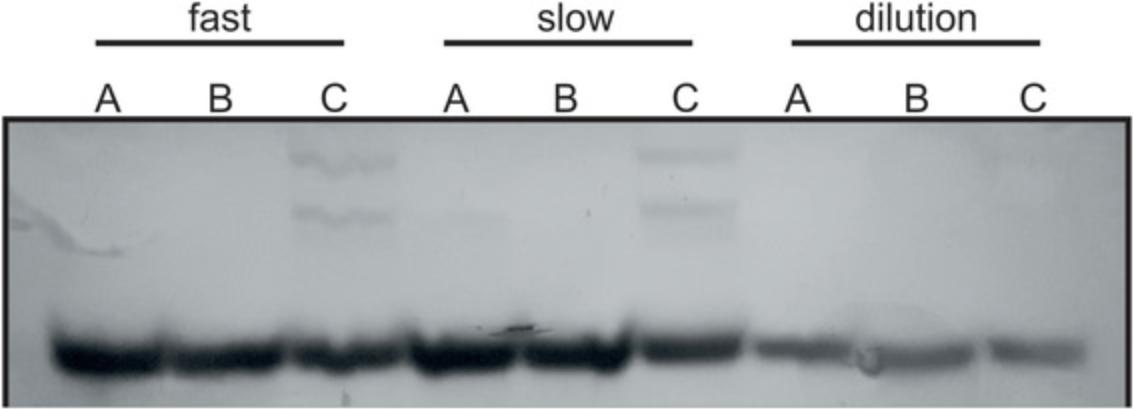
30.Check for a homogenous fold via a native PAGE. The loaded sample has to have a concentration of an NMR sample (>100 µM). Load 500 nmol RNA. Use UV shadowing to reveal the bands.
31.Optimize folding conditions for the target RNA if they are unknown and check via a native PAGE.
32.Fold RNA sample into a single conformation. Folding can either occur now or in step 40.
33.Prepare a centrifugal concentrator as described in the device manual.
34.Transfer RNA sample into NMR buffer using the centrifugal concentrator and centrifuge at the recommended speed.
35.Refill centrifugal concentrator with NMR buffer and mix it carefully with a pipet to not damage the concentrator membrane. Then, centrifuge it to obtain one-tenth of the volume.
36.Repeat step 35 three to ten times to remove remaining salts.
37.Centrifuge after the last iteration to reduce the volume to 200-300 µl.
38.Remove RNA from the centrifugal concentrator via a pipet.
39.Determine RNA concentration via UV/vis absorption spectroscopy.
40.Fold RNA unless it was folded before and check the final fold via a native PAGE (see step 30 and Fig. 3).
41.Add MgCl2 if required, unless it was added before.
42.Add 5% D2O and 100 µM DSS to the RNA sample.
43.Wash the Shigemi tube with ddH2O and incubate it with a 0.1% (v/v) DEPC solution overnight. Repeatedly wash tube with ddH2O (at least five times or more) and dry it via a lyophilizer or drying oven.
44.Fill the Shigemi tube with the NMR sample (optimal filling height: 300 µl) and place the insert above the sample so that no air bubbles are trapped between the insert and the sample.
45.Seal the Shigemi tube with sealing film (e.g., Parafilm) and label the tube. Store sample at 4°C.
46.Perform essential NMR experiments (e.g., 1H 1D, 1H 2D NOESY, 1H,15N-HSQC) for the assignment of the RNA. For basic NMR experiments for RNA, we refer to the review article: NMR spectroscopy of RNA (Fürtig, Richter, Wöhnert, & Schwalbe, 2003). For more sophisticated heteronuclear experiments see Basic Protocols 3-7.
Alternate Protocol 1: PURIFICATION OF ISOTOPE-LABELED RNA FROM IN VITRO TRANSCRIPTION WITH PREPARATIVE PAGE
Alternate Protocol 1 describes a second approach for the purification of isotope-labeled RNAs from in vitro transcription. This method utilizes preparative PAGE instead of RP-HPLC and is therefore an alternative if no HPLC device is available or if the device does not separate the target RNA product sufficiently from byproducts (Current Protocols article: Hengesbach et al., 2008; Petrov, Wu, Puglisi, & Puglisi, 2013). This protocol starts after the successful in vitro transcription of the target RNA and yields a pure NMR sample. This method is not suitable if the NMR sample has to be free of any acrylamide impurities, which might be eluted together with RNA from the preparative PAGE. If acrylamide affects the results, an HPLC run to separate it from the RNA is inevitable.
Additional Materials (see also Basic Protocol 1)
-
Double distilled water (ddH2O)
-
Diethylaminoethyl-Sepharose (DEAE-Sepharose®; GE Healthcare, cat. no. 17-0709-01)
-
3 M sodium acetate (NaOAc), pH 5.5 (Carl Roth, cat. no. 6773.2)
-
0.1% (v/v) diethyl pyrocarbonate (DEPC; Carl Roth, cat. no. K028.2)
-
Denaturing PAGE gel solution, 8%-15% (see recipe)
-
Formamide (denaturing RNA loading buffer for preparative PAGE; Merck, cat. no. 47671)
-
Denaturing PAGE running buffer (1× TBE; see recipe)
-
Dye-containing loading buffer (see recipe)
-
Elution buffer: 0.3 M sodium acetate (NaOAc), pH 5.5
-
Absolute ethanol (Merck, cat. no. 32205-2.5L-M)
-
UV/Vis spectrophotometer (NanoDrop One/One; Thermo Fisher Scientific)
-
NAP™ column (GE Healthcare)
-
Glass column for DEAE-Sepharose® (e.g., Econo)
-
Centrifugal concentrator (e.g., Vivaspin™, Sartorius™)
-
Sterile filters, 0.2 µm (Carl Roth)
-
PAGE casting chamber and glass plates (Biometra multigel; Analytik Jena Company)
-
Heat block
-
Sterile surface
-
Thin layer chromatography (TLC) plate (ALUGRAM® Xtra SIL G/UV; Macherey-Nagel)
-
UV lamp, 245 nm (Hanau Fluotest; Heraeus)
-
Sterile scalpel
-
Syringe
-
Shaker
-
Freezer (−20°C/−80°C)
-
Centrifuge (Megafuge 8R; Thermo Fisher Scientific)
-
Centrifugal vacuum concentrator (Vacuum concentrator plus; Eppendorf)
NOTE : This protocol starts with the purification of a previously transcribed RNA. For the in vitro transcription, refer to Basic Protocol 1, steps 1-15.
1.Work RNase free.
2.Transcribe RNA as described in Basic Protocol 1, steps 1-15.
3.Determine amount of RNA and sample volume which has to be purified and check which PAGE size fits the RNA sample. Take into account the additional formamide (see step 9 below) and the required separation efficiency, e.g., the size difference between product bands.
4.Remove free rNTPs and excess salt from the transcription reaction either via DEAE chromatography according to Basic Protocol 1, a NAP column, or via a centrifugal concentrator.
5.Prepare TBE buffer as needed for your PAGE casting device.
6.Prepare 8%-15% PAGE gel solution and filter with sterile filters (0.2 µm).
7.Set PAGE glass plates and check for leakage.
8.Add ammonium persulfate (APS) and TEMED to the PAGE gel solution to start polymerization immediately before pouring.
9.Add at least 0.5 volumes of formamide to your sample and denature RNA 3-5 min at 95°C.
10.Set gel into the PAGE device. If using a maxi gel, pre-run gel for 30 min.
11.Add 20 µl dye-containing loading buffer in one spare gel pocket to determine gel-running progress.
12.Load denatured RNA sample into free gel pockets.
13.Run preparative PAGE.
14.Remove gel from glass plates and place it onto a sterile surface.
15.Place a fluorescent TLC plate underneath the gel.
16.Check for a UV shadow caused by the RNA using a UV lamp (245 nm). Identify desired RNA band and mark band with a sterile scalpel.
17.Cut the desired band out of the gel and then cut into small pieces.
18.Mix gel pieces with 10-20 ml elution buffer and press the mix through a syringe.
19.Shake gel pieces at 4°-25°C overnight to elute RNA into the elution buffer.
20.Filter elution buffer with a sterile filter (0.2 µm) and keep gel pieces for further elution.
21.Add two-and-a-half to four volumes of ice-cold absolute ethanol to precipitate RNA and place mixture at −20°C overnight.
22.Centrifuge at 10,000 × g and 4°C for 30-60 min.
23.Remove supernatant and keep it for further precipitation.
24.Air dry pellet or dry via a vacuum concentrator for 2 min and reconstitute it in ddH2O.
25.Proceed with folding, buffer exchange, and NMR sample preparation as described in Basic Protocol 1, steps 30-46.
Alternate Protocol 2: PURIFICATION OF ISOTOPE-LABELED RNA SAMPLES FROM IN VITRO TRANSCRIPTION VIA CENTRIFUGAL CONCENTRATION
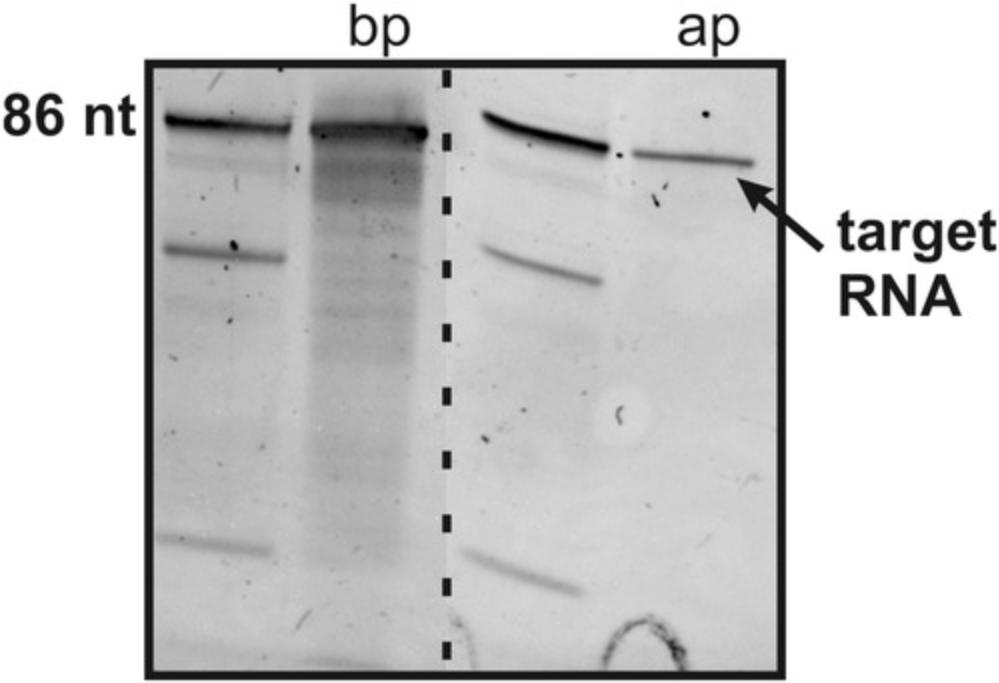
This Alternate Protocol 2 describes a fast purification method for isotope-labeled RNAs from in vitro transcription using a centrifugal concentrator (see Fig. 4). It is the quickest purification method among the purification strategies described within this protocol. However, this method should only be applied when the transcription produces a single RNA product, as byproduct RNAs or other transcribed RNAs such as ribozymes are not separated. Therefore, it is important to generate 3′-end homogeneity of the transcribed RNA by using PCR DNA templates with 2′-O -methyl-modifications at the last two nucleotides of the 5′ end (Helmling et al., 2015; Kao, Zheng, & Rüdisser, 1999; Support Protocol 2). We also advise that this purification procedure not be used for NMR titration experiments, because remaining enzymes in solution might interfere with ligand binding.
Materials
- Transcribed RNA (see Basic Protocol 1, steps 1-15)
- Double distilled water (ddH2O)
- 500 mM tris/glutamate buffer, pH 8.1 (glutamic acid; Merck, cat. no. G1149)
- NMR buffer (see recipe)
- Denaturing RNA loading buffer (see recipe)
- Denaturing PAGE gel solution (see recipe)
- Denaturing PAGE running buffer (1× TBE; see recipe)
- Centrifugal concentrator (e.g., Vivaspin™, Sartorius™)
- Centrifuge (Megafuge 8R; Thermo Fisher Scientific)
- UV/Vis spectrophotometer (NanoDrop One/One; Thermo Fisher Scientific)
- PAGE casting chamber and glass plates (Biometra multigel; Analytik Jena Company)
- Heat block
1.Prepare centrifugal concentrator as described in the device manual.
2.Remove precipitated magnesium pyrophosphate by centrifuging the transcription mixture at 3,000 × g for 5 min at room temperature. Then, transfer supernatant to the centrifugal concentrator.
3.Wash transcription mixture with 5 ml tris/glutamate buffer (pH 8.1) to remove remaining pyrophosphate.
4.Concentrate solution to 1.0-0.3 ml and wash with 60-160 ml NMR buffer depending on the transcription scale.
5.Analyze flowthrough and the solution above the membrane (target RNA) by UV/vis absorption spectroscopy and analytical denaturing PAGE to ensure that no RNA has passed through the membrane of the centrifugal concentrator.
6.In the last washing step, concentrate solution to 200-300 µl and remove RNA from the centrifugal concentrator with a pipet.
7.Determine RNA concentration via UV/vis absorption spectroscopy.
8.Proceed with folding and NMR sample preparation as described in Basic Protocol 1, steps 30-46.
Support Protocol 1: PREPARATION OF DNA TEMPLATE FROM PLASMID
Every DNA-dependent RNA polymerase used in an in vitro transcription requires a DNA template from which the sequence can be read and an RNA strand can be synthesized. A commonly used template is a linearized DNA plasmid encoding the RNA transcription cassette. With the linearization directly downstream of the transcription cassette no transcription terminator is required but instead the polymerase will create run-off transcripts (Diaz, Rong, McAllister, & Durbin, 1996). In this Support Protocol 1, we provide step-by-step instructions on how to prepare a plasmid DNA template.
Materials
-
Double distilled water (ddH2O)
-
Competent DH5α Escherichia coli cells (e.g., New England Biolabs)
-
SOC medium (supplied with competent cells for plasmid transformation)
-
LB-agar plates with 100 µg/ml ampicillin
-
LB medium (see recipe)
-
100 mg/ml ampicillin
-
50% glycerol (for glycerol stock; see step 6)
-
Plasmid DNA purification kit (e.g., Macherey Nagel)
-
Restriction enzyme (e.g., New England BioLabs)
-
10× CutSmart® reaction buffer (New England Biolabs, cat. no. B7204S; supplied with enzyme)
-
Agarose gel solution (see recipe)
-
DNA loading buffer (e.g., Gel Loading Dye: Purple, New England Biolabs or see recipe)
-
DNA running buffer (1× TAE; see recipe)
-
Phenol-chloroform-isoamyl alcohol (PCI) solution (e.g., ROTI®, cat. no. A156.1)
-
Chloroform (Thermo Fisher Scientific, cat. no. 10293850)
-
3 M sodium acetate (NaOAc), pH 5.5
-
Absolute ethanol (Merck, cat. no. 32205-2.5L-M)
-
2-Propanol (VWR Chemicals, cat. no. 20842.330)
-
Shaking incubator
-
UV/Vis spectrophotometer (NanoDrop One/One; Thermo Fisher Scientific)
-
Centrifuge (Megafuge 8R; Thermo Fisher Scientific)
-
Agarose gel casting chamber and glass plates
-
Freezer (−20°C/−80°C)
Transformation and amplification
This protocol assumes the previous successful insertion of the RNA transcription cassette into a suitable bacterial plasmid. Any plasmid with a (class III) T7 promoter sequence and ampicillin resistance should be suitable.
1.Perform plasmid transformation into competent DH5α E. coli cells according to manufacturer instructions.
2.Prepare 5 ml, 50 ml, and 1 L LB medium with 100 µg/ml ampicillin in appropriate flasks.
3.Pick an isolated clone from the LB-agar plate (e.g., with a sterile pipet tip) and transfer into the 5-ml culture flask.
4.Grow cells ∼4-6 hr at 37°C and 120 rpm before transferring the 5-ml starter culture into 50 ml starter culture. Incubate the 50-ml culture at 37°C and 120 rpm overnight.
5.Measure OD600 of the starter culture and transfer the appropriate volume into the main culture to adjust the initial OD600 to ∼0.1.
6.Incubate the main culture another 6-10 hr at 37°C and 120 rpm.
7.Centrifuge culture medium at 4,000 × g for 15 min and 4°C to harvest cells.
8.Isolate plasmid DNA according to the instructions of a plasmid DNA purification kit.
Linearization
9.Perform a restriction digestion on an analytical scale of 50 µl. For this, prepare a reaction mix according to the protocol in Table 4.
10.Mix all reaction components with the enzyme being the last component to be added.
| Reagent | Quantity |
|---|---|
| Restriction enzyme | 10 units |
| 10× Cutsmart reaction buffer | 5 µl (1×) |
| DNA plasmid | 1 µg |
| ddH2O | Add up to 50 µl |
11.Incubate digestion reaction 1 hr at the temperature optimal for the restriction enzyme.
12.Verify linearization efficiency with a gel electrophoresis using a 1% agarose gel. Apply ∼150 ng of DNA per sample.
13.After successful test linearization, prepare a preparative scale digestion. Calculate the amount of enzyme required to digest the total amount of plasmid (e.g., 1 U/µg DNA). Consult the manufacturer specifications and protocols of your individual enzyme if necessary.
Phenol-chloroform-isoamyl alcohol extraction
14.Add one volume of PCI solution to the digestion reaction solution and mix vigorously before centrifuging for 10 min at 9,000 × g at 4°C.
15.Carefully transfer aqueous phase (top phase) into a new tube and repeat extraction again with one volume of fresh PCI. Transfer aqueous phase again into a new tube.
16.Add one volume of chloroform to the aqueous phase. Mix thoroughly and centrifuge for 10 min at 9,000 × g. Carefully transfer aqueous phase (top phase) into a new tube.
17.Add one-tenth volume of 3 M NaOAc to the aqueous phase, mix, and precipitate with 0.7 volumes of 2-propanol or 2.5 volumes of absolute ethanol. Incubate at −20°C for 1 hr.
18.Centrifuge 30 min at 9,000 × g and 4°C, carefully decant supernatant, and wash pellet with 5 ml 70% ethanol, before centrifuging again for 15 min at 4°C and 9.000 × g.
19.Decant supernatant and air dry pellet 5-10 min. Resolve DNA in ∼500-2,000 µl ddH2O.
20.Determine concentration via UV/vis absorption at 260 nm and perform an agarose gel electrophoresis with linearized plasmid and undigested plasmid as a control.
Support Protocol 2: PREPARATION OF PCR DNA AS TEMPLATE
PCR is a fast and convenient method for the amplification of DNAs (Mullis et al., 1986). The template DNA for this method is usually purchased or synthesized in house by solid phase synthesis. The correct design of this template DNA is described in Strategic Planning. If 3′ homogeneity is required, using 2′-O -methyl modified reverse primers is an alternative solution to the application of ribozymes. The methoxy group at the 5′ end of the PCR template DNA stops the transcription because it destabilizes the complex between the polymerase and the template, preventing non-templated RNA synthesis (Kao et al., 1999).
For a maximum amount of pure PCR product, reaction conditions such as the primer, template, and MgCl2 concentrations have to be optimized. Furthermore, the annealing temperature has to be optimized in order to obtain a high yield of product DNA. All optimizations and the procedure for a successful PCR are described within this support protocol.
Materials
-
Double distilled water (ddH2O)
-
PCR template DNA (Eurofins Genomics)
-
Forward DNA primer (Eurofins Genomics)
-
Reverse DNA primer (Eurofins Genomics)
-
Phusion® High-Fidelity DNA Polymerase (New England Biolabs, cat. no. M0530)
-
Phusion high-fidelity (HF)/GC buffer (New England Biolabs, cat. no. B0518S/B0519S)
-
dNTPs (New England Biolabs, cat. no. N0447L)
-
Native PAGE gel solution for DNA (see recipe)
-
Agarose gel solution (see recipe)
-
DNA loading buffer (e.g., Gel Loading Dye: Purple, New England Biolabs or see recipe)
-
DNA running buffer (1× TAE; see recipe)
-
Dimethyl sulfoxide (DMSO)
-
Thermocycler (Biometra Tone; Analytik Jena Company)
-
Agarose gel casting chamber and glass plates
-
PAGE casting chamber and glass plates (Biometra multigel; Analytik Jena Company)
-
Freezer (−20°C/−80°C)
1.Design PCR template DNA (see Strategic Planning) and the primers. Purchase constructs or prepare them via solid phase synthesis (e.g., Eurofins Genomics).
2.Reconstitute lyophilized PCR template DNA with ddH2O to obtain a concentration of 100 µM.
3.Reconstitute lyophilized primers with ddH2O to obtain a concentration of 100 µM.
4.Check the following optimization steps on a native PAGE for DNA or an agarose gel.
5.Optimize annealing temperature and the number of cycles (Fig. 6). Optimize elongation time according to the template length. An exemplary program is shown in Table 5.

| Step | Temperature | Time |
|---|---|---|
| 1. Denaturing | 98°C | 2 min |
| 2. Annealing | 50°-60°C | 20 s |
| 3. Elongation | 72°C | 15 s |
| 4. Denaturing | 98°C | 10 s |
| 5. Go to step 2. | Repeat 20-30 times |
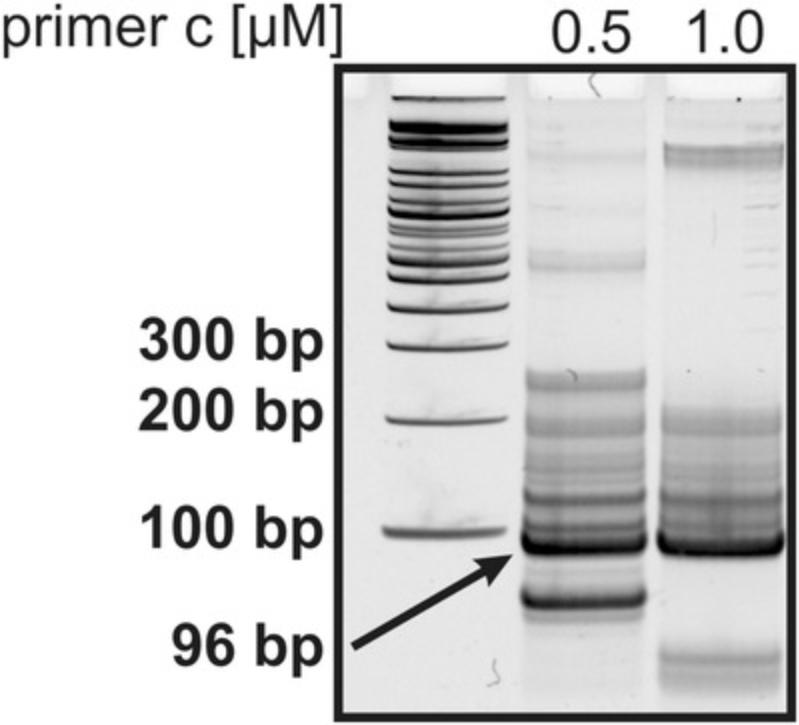
6.Optimize primer concentrations to maximize the yield of target DNA (Fig. 7). Try 0.5-1.0 µM for each primer.
7.Optimize PCR template DNA concentration to maximize the yield of target DNA and to avoid additional byproduct (see Troubleshooting). Try 1-3 ng/µl template.
8.Optimize DMSO concentration in case of byproducts to facilitate the binding of the primers. Use up to 3% DMSO.
9.Determine amount of DNA required for the preparative transcription reaction.
10.Set a master mix with all reagents in a 2-ml reaction tube as shown in the pipetting scheme (Table 6) and distribute to PCR reaction tubes. Each tube should contain 50 µl reaction mixture.
| Reagent | Quantity |
|---|---|
| ddH2O | To target volume |
| HF/GC buffer | 1× |
| PCR template DNA | 1-3 ng/µl |
| Forward primer | 0.5-1.0 µM |
| Reverse primer | 0.5-1.0 µM |
| dNTP mix | 200 µM |
| DMSO (optional) | Up to 3% |
| Phusion DNAP | 1 U/50 µl PCR |
11.Perform a PCR with the optimized conditions.
12.Combine samples from the individual PCR reaction tubes and run an analytical agarose gel electrophoresis or a native PAGE for DNA to confirm a successful reaction.
13.Use PCR product directly for transcription without any purification steps in case of single pure product.
Support Protocol 3: PREPARATION OF T7 RNA POLYMERASE (T7 RNAP)
Although T7 RNAP is commercially available, purchasing the amount required for an in vitro RNA transcription in NMR scale can be quite expensive. This support protocol provides a cost-saving and straightforward alternative to the commercial product. Furthermore, we recommend using the P266L mutant of T7 RNAP since it significantly improves in vitro transcription, particularly from templates carrying unfavorable initial sequences (Guillerez et al., 2005).
Materials
-
BL21 DE3 E. coli cells carrying pBH161 plasmid (plasmid was a gift from M. Dreyfus, CNRS, Paris, France; cells supplied by New England Biolabs)
-
LB or TB medium (see recipe)
-
100 mg/ml ampicillin
-
Antifoam Y-30 emulsion (e.g., MilliporeSigma)
-
1 M IPTG
-
T7 RNAP buffer A (see recipe)
-
T7 RNAP buffer B (see recipe)
-
SDS stacking and resolving gel (see recipe)
-
SDS running buffer (see recipe)
-
SDS sample buffer (see recipe)
-
Coomassie staining solution (see recipe)
-
T7 RNAP buffer C (see recipe)
-
Glycerol (Carl Roth, cat. no. 3783.1)
-
Shaking incubator
-
UV/Vis spectrophotometer (NanoDrop One/One; Thermo Fisher Scientific)
-
Centrifuge (Megafuge 8R; Thermo Fisher Scientific)
-
High-pressure homogenization (e.g., Microfluidizer® M-110 P; Microfluidics)
-
FPLC system
-
5-ml Ni-NTA affinity column (e.g., GE HisTrap HP 5 ml column)
-
SDS casting chamber and glass plates (XCell SureLock Mini-Cell Electrophoresis System)
-
Preparative size exclusion column (e.g., GE HiLoad 26/600 Superdex 200 pg gel filtration column)
-
Freezer (−20°C/−80°C)
Expression and cell harvest
1.Prepare 50 ml starter culture and 1 L main culture containing LB or TB medium with 100 µg/ml ampicillin.
2.Inoculate starter culture with a glycerol stock of BL21 DE3 E. coli cells containing the pBH161 plasmid and incubate at 37°C and 120 rpm overnight.
3.Measure OD600 of the starter culture and transfer the appropriate volume into the main culture to adjust initial OD600 to ∼0.1.
4.Incubate main culture at 37°C and 120 rpm until OD600 of 0.6-0.8 for LB medium or 1-2 for TB medium is reached.
5.Add IPTG to a final concentration of 0.5 mM to induce protein expression.
6.Grow cells at 37°C until OD600 of 10-15 is reached. This usually takes 3 hr more.
7.Centrifuge culture medium at 4,000 × g and 4°C for 15 min to harvest cell pellet.
Purification
Perform all purification steps at 4°C.
8.Resuspend cell pellet in T7 RNAP buffer A (∼25 ml lysate per 1 L cell culture).
9.Lyse cell suspension via high-pressure homogenization.
10.Centrifuge lysate at >35,000 × g for 30 min at 4°C.
11.Decant supernatant and filter with 0.8-µm pore size if precipitates are visible.
12.Equilibrate a 5-ml Ni-NTA column with ten column volumes (CV) T7 RNAP buffer A.
13.Load protein solution onto the column.
14.Wash column with ten CV T7 RNAP buffer A.
15.Wash column with ten CV 5% T7 RNAP buffer B.
16.Wash column with ten CV 10% T7 RNAP buffer B.
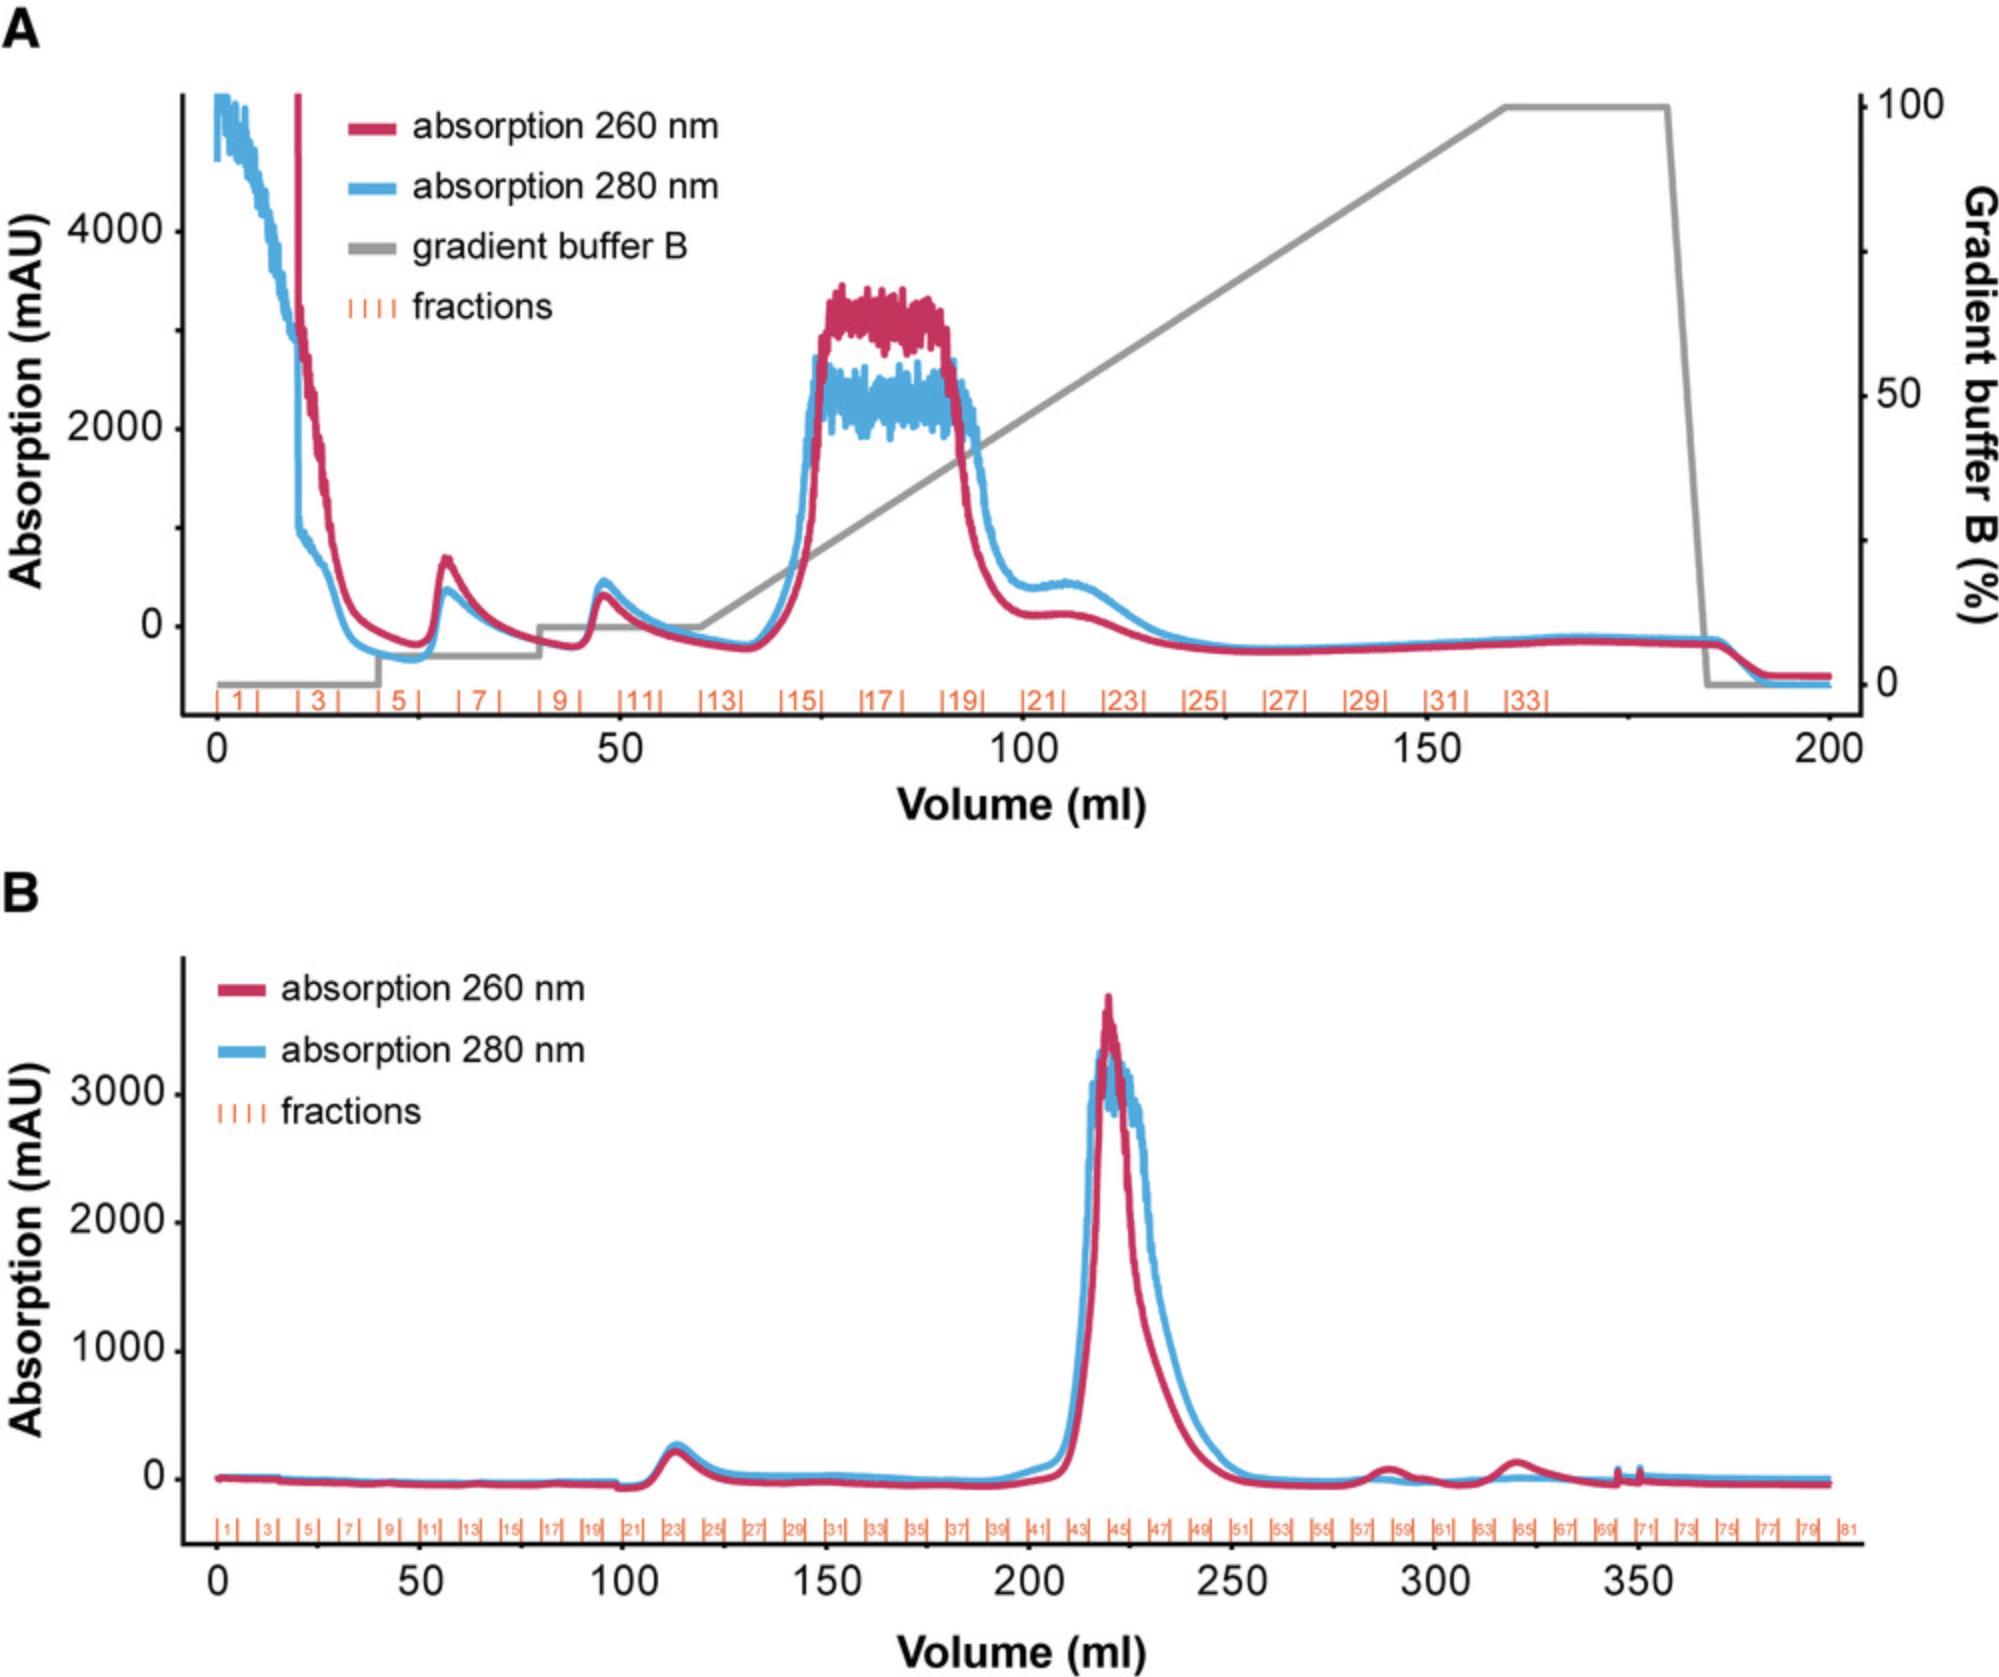
17.Apply a gradient of 100% T7 RNAP buffer B over 100 ml and collect eluate in fractions of 5 ml (see Fig. 8A for reference).
18.Run a 12% SDS-PAGE of all fractions and pool fractions that contain T7 RNAP (see Fig. 9A for reference).

19.Equilibrate a gel filtration column with 1.5 CV 2.5× T7 RNAP buffer C.
20.Load T7 RNAP onto the size exclusion column.
21.Elute with one CV of 2.5× T7 RNAP buffer C and collect eluate in fractions of 5 ml (see Fig. 8B for reference).
22.Run a 12% SDS-PAGE of all fractions and pool fractions that contain T7 RNAP (see Fig. 9B for reference).
23.Check selected fractions for RNase contamination by incubating an analytical amount of each fraction with ∼15 pg of RNA of choice overnight at room temperature or for 4 hr at 37°C. Also include a control sample without protein. Check on a denaturing PAGE if the RNA is still intact. The RNA band should be distinct and sharp. A smeared RNA band or fragmentation into smaller RNAs is an indication of RNase digestion. Pool protein that does not show any signs of RNase activity.
24.Adjust protein concentration to 6 mg/ml with 2.5× T7 RNAP buffer C.
25.Add glycerol to a final concentration of 60% (final protein concentration: 2.4 mg/ml; 1× T7 RNAP buffer C), aliquot, and store the enzyme at –80°C.
Support Protocol 4: PREPARATION OF YEAST INORGANIC PYROPHOSPHATASE (YIPP)
The RNA yield of a transcription is strongly dependent on the Mg2+ ion concentration in the reaction mixture. The formation of pyrophosphate leads to a precipitation of magnesium pyrophosphate concomitantly decreasing the concentration of Mg2+ ions in the solution. Because the folding of ribozymes and the activity of the T7 RNAP is dependent on Mg2+ ions, their concentration should be kept stable during the transcription (Karlsson, Baronti, & Petzold, 2020). To achieve this stability, 9.6 µg/ml YIPP can be used to decompose pyrophosphate to monophosphate, thereby preventing the removal of magnesium by precipitation (Kunitz, 1952).
Materials
-
pET-21a(+)-IPP1-His plasmid (plasmid was a gift from Sebastian Maerkl; Addgene, plasmid #118978, see Lavickova & Maerkl, 2019)
-
LB medium (see recipe)
-
100 mg/ml ampicillin
-
BL21(DE3) Competent E. coli cells (New England Biolabs)
-
1 M IPTG
-
YIPP buffer A (see recipe)
-
YIPP buffer B (see recipe)
-
SDS stacking and resolving gel (see recipe)
-
SDS running buffer (see recipe)
-
SDS sample buffer (see recipe)
-
Coomassie staining solution (see recipe)
-
YIPP buffer C (see recipe)
-
YIPP buffer D (see recipe)
-
Glycerol (Carl Roth, cat. no. 3783.1)
-
Shaking incubator
-
UV/Vis spectrophotometer (NanoDrop One/One; Thermo Fisher Scientific)
-
Centrifuge (Megafuge 8R; Thermo Fisher Scientific)
-
High-pressure homogenization (e.g; Microfluidizer® M-110 P; Microfluidics)
-
FPLC system
-
5-ml Ni-NTA affinity column (e.g., GE HisTrap HP 5 ml column)
-
SDS casting chamber and glass plates (XCell SureLock Mini-Cell Electrophoresis System)
-
Preparative size exclusion column (e.g., GE HiLoad 26/600 Superdex 75 pg gel filtration column)
-
Freezer (−20°C/−80°C)
Expression and cell harvest
Based on previous expressions, 1 L LB medium yields between 35-40 mg of purified protein.
1.Prepare 50 ml starter culture and 1 L main culture containing 2× LB medium and 100 µg/ml ampicillin.
2.Inoculate starter culture with a glycerol stock of BL21 DE3 E. coli cells containing pET-21a(+)-IPP1-His plasmid and incubate at 37°C and 160 rpm overnight.
3.Measure OD600 of the starter culture and transfer the appropriate volume into the main culture to adjust initial OD600 to ∼0.1.
4.Incubate main culture at 37°C and 130 rpm until OD600 of 0.6-0.8 is reached.
5.Add a final concentration of 1 mM IPTG to induce protein expression.
6.Grow cells for another 5 hr at 37°C.
7.Centrifuge culture medium at 4,000 × g for 30 min and 4°C to harvest cell pellet.
Purification
To maintain the thermostability of the enzyme, it is recommended that all purification steps are performed at 4°C.
8.Resuspend cell pellet in YIPP buffer A (∼25 ml lysate per 1 L cell culture).
9.Lyse cell suspension via high-pressure homogenization.
- Centrifuge lysate at >35,000 × g for 30 min.
10.Decant supernatant and filter with 0.8-µm pore size if precipitates are visible.
11.Equilibrate a 5-ml Ni-NTA column with ten CV of YIPP buffer A.
12.Load protein solution onto the column.
13.Wash column with ten CV of YIPP buffer A.
14.Elute with a gradient of YIPP buffer B (0%‑100% over 50 min) and collect eluate in fractions of 5 ml (see Support Protocol 3, Fig. 8A for reference).
15.Run a 15% SDS-PAGE of all fractions and pool fractions that contain YIPP (33.2 kDa; see Support Protocol 3, Fig. 9A for reference).
16.Equilibrate size exclusion column with 1.5 CV of YIPP buffer C.
17.Load YIPP solution onto the size exclusion column.
18.Elute with one CV of YIPP buffer C and collect eluate in fractions of 5 ml (see Support Protocol 3, Fig. 8B for reference).
19.Run a 15% SDS-PAGE of all fractions and pool fractions that contain YIPP (see Support Protocol 3, Fig. 9B for reference).
20.Check YIPP-containing fractions for RNase contamination by incubating an analytical amount of each fraction with ∼15 pg of RNA of choice overnight at room temperature or for 4 hr at 37°C. Also include a control sample without protein. Check on a denaturing PAGE if the RNA is still intact. The RNA band should be distinct and sharp. A smeared RNA band or fragmentation into smaller RNAs is an indication of RNase digestion. Pool protein that does not show any signs of RNase activity.
21.Dialyze combined fractions twice (1 hr each) against 1 L of 2× YIPP buffer D.
22.Adjust concentration to ∼2.4 mg/ml using centrifugal concentration.
23.Add 50% (v/v) glycerol to reach a final stock concentration of 1.2 mg/ml.
24.Aliquot and store the enzyme at –20°C.
Basic Protocol 2: PREPARATION OF SITE-SPECIFIC LABELED RNAs USING A CHEMO-ENZYMATIC SYNTHESIS
The NMR spectroscopic characterization of increasingly long RNAs is hampered by an increased resonance overlap. This problem can potentially be avoided by site-specific labeling methods. However, the most commonly used method for these purposes, solid phase synthesis, is limited to ∼50 nt (Jud & Micura, 2017). Herein, we provide a protocol for the chemo-enzymatic synthesis of RNAs that contain a single modified/labeled nucleotide at a desired position without any size limitation. By the site-specific incorporation of 13C, 15N labeled or unnatural modified nucleosides, such as 19F or 13C-methoxy groups, the signal abundance is dramatically reduced and spectra with single signals can be obtained (Keyhani et al., 2018). Using this method, it is even possible to incorporate modified nucleosides carrying sterically demanding modifications such as photoremovable protecting groups (e.g., ortho-nitrophenylethyl) or photoswitches (e.g., azobenzene).
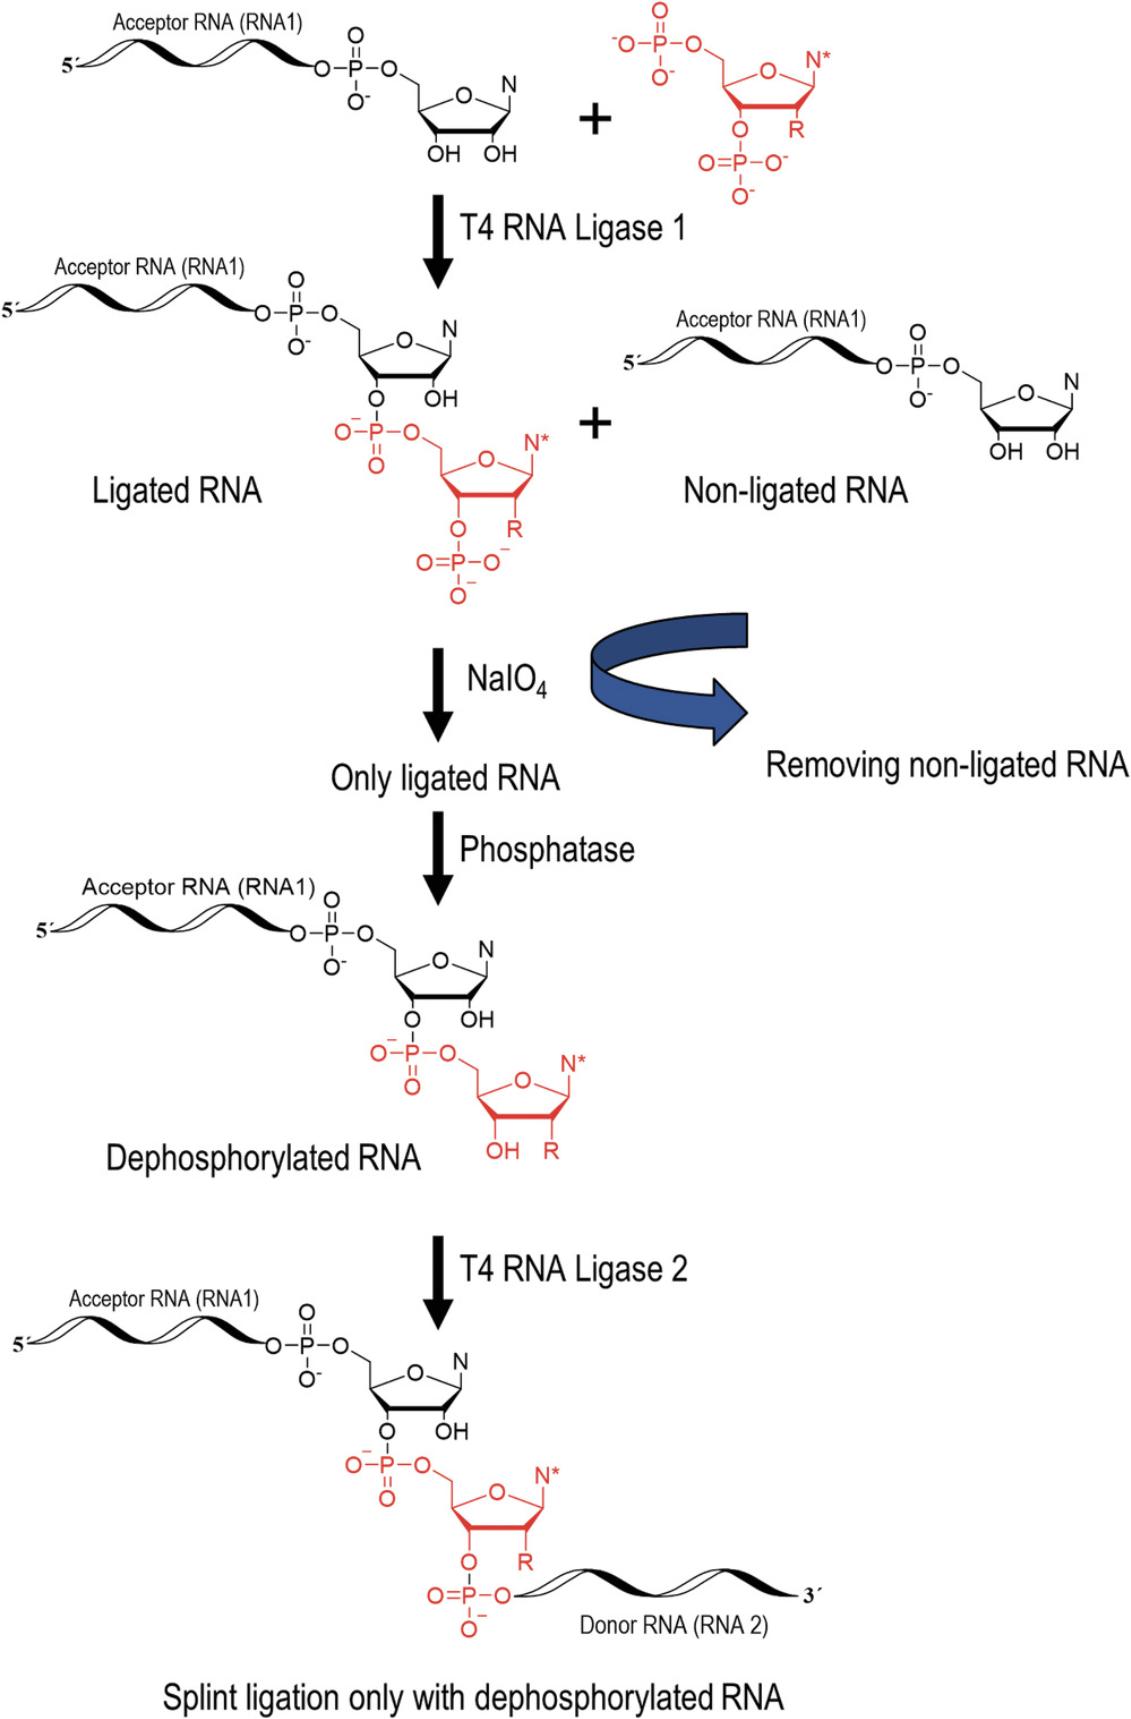
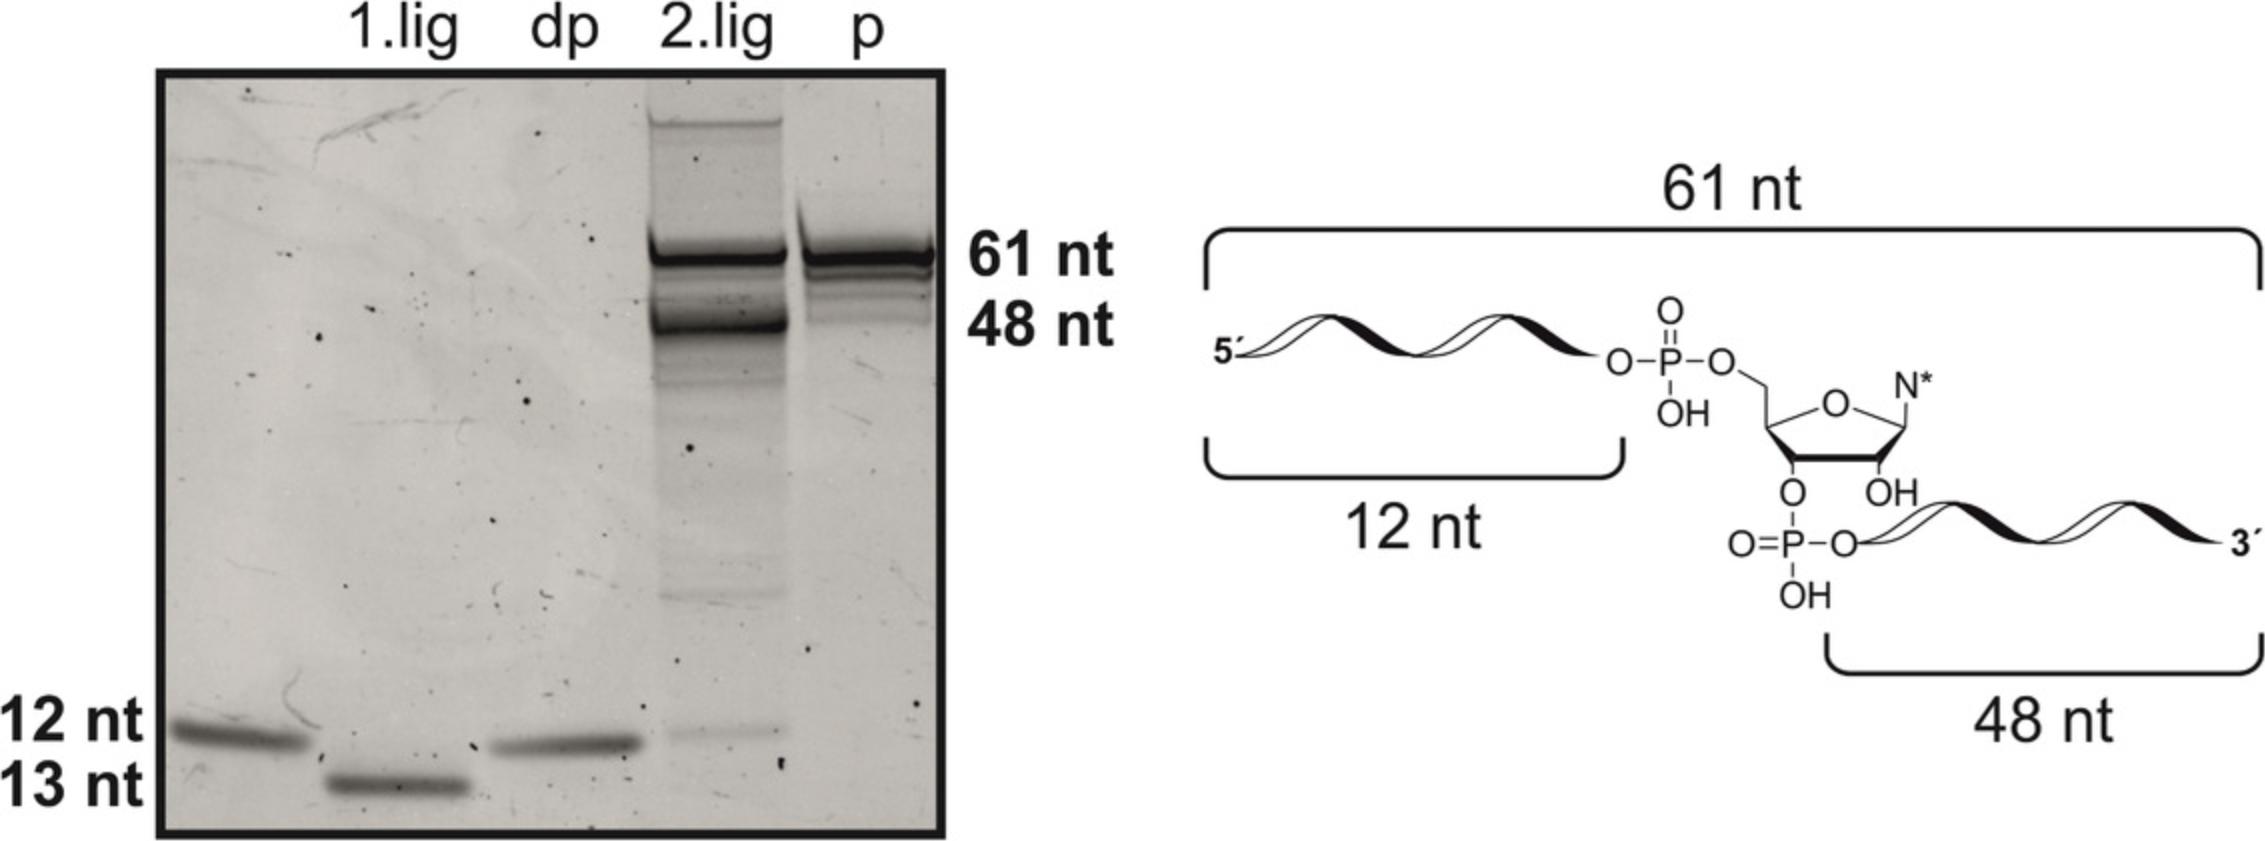
The site-specific incorporation of a modified nucleotide into an RNA involves three enzymatic steps (enzymatic pathway in Fig. 10). The first step is a 3′ extension of the acceptor RNA strand (RNA 1) with the modified nucleoside 3′,5′-bisphosphate (for synthesis see Support Protocol 5) using T4 RNA Ligase 1 (T4 Rnl1). Further extensions are blocked by the phosphate group at the 3′ position of the modified nucleotide. The ligation mixture can be either purified by RP-HPLC or the non-ligated RNA can be oxidized by NaIO4 to remove it from the enzymatic pathway. The phosphate group at the 3′ position is removed by a phosphatase and the RNA is (splint) ligated with the 5′-phosphorylated donor RNA strand (RNA 2) in presence of a DNA splint by T4 RNA Ligase 2 (T4 Rnl2; for enzyme preparation see Support Protocol 6). The RNA is purified, e.g., by RP-HPLC. The enzymes can be purchased commercially, however, we recommend preparing T4 Rnl2 in house due to the significant cost factor and observed higher ligation efficiency as described in Support Protocol 6.
Materials
-
Double distilled water (ddH2O)
-
3′,5′-Bisphosphate nucleoside (see Support Protocol 5)
-
Acceptor RNA (RNA 1) with an OH group at the 3′ end (see Basic Protocol 1)
-
Donor RNA (RNA 2) with a phosphate group at the 5′ end (Eurofins Genomics or see Basic Protocol 1)
-
DNA splint (Eurofins Genomics)
-
T4 Polynucleotide Kinase (T4 PNK; New England Biolabs, cat. no. M0201S)
-
T4 RNA Ligase 1 (New England Biolabs, cat. no. M0204S)
-
T4 RNA Ligase 1 buffer (supplied with the T4 RNA Ligase 1)
-
Phosphatase and respective buffer (e.g., shrimp alkaline phosphatase; e.g New England Biolabs, cat. no. M0371S)
-
10× CutSmart® reaction buffer (New England Biolabs, cat. no. B7204S; supplied with shrimp alkaline phosphatase)
-
T4 RNA Ligase 2 (see Support Protocol 6; New England Biolabs, cat. no. M0239S)
-
T4 DNA Ligase buffer (New England Biolabs, cat. no. B0202S)
-
DMSO (Carl Roth, cat. no. A994.2)
-
ATP (MilliporeSigma, cat. no. A6419-1G)
-
Phenol-chloroform-isoamyl alcohol (PCI) solution (e.g., ROTI®, cat. no. A156.1)
-
Chloroform (Thermo Fisher Scientific, cat. no. 10293850)
-
Sodium periodate (NaIO4; Carl Roth, cat. no. 2603.1)
-
50% (v/v) ethylene glycol (Grüssing, cat. no. 103081000U)
-
3 M sodium acetate (NaOAc), pH 5.5 (Carl Roth, cat. no. 6773.2)
-
Absolute ethanol (Merck, cat. no. 32205-2.5L-M)
-
Denaturing RNA loading buffer (see recipe)
-
Denaturing PAGE gel solution (see recipe)
-
Denaturing PAGE running buffer (1× TBE; see recipe)
-
DNase and appropriate buffer (e.g., Turbo™ DNase, Thermo Fisher Scientific, cat. no. AM2238)
-
Hexafluoro-2-propanol (HFIP; Fluorochem, cat. no. 003409)
-
Methanol (Thermo Fisher Scientific, cat. no. M/4000/17)
-
Materials for preparative PAGE (see Alternate Protocol 1)
-
Shaking incubator
-
Centrifuge (Megafuge 8R; Thermo Fisher Scientific)
-
Centrifugal concentrator (e.g., Vivaspin™, Sartorius™)
-
Freezer (−20°C/−80°C)
-
Lyophilizer/centrifugal vacuum concentrator (Alpha 2-4, Christ; vacuum concentrator plus, Eppendorf)
-
UV/Vis spectrophotometer (NanoDrop One/One; Thermo Fisher Scientific)
-
PAGE casting chamber and glass plates (Biometra multigel; Analytik Jena Company)
-
Heat block
-
HPLC device (Elite LaChrom; VWR-Hitachi)
-
HPLC column (e.g., XBridge Peptide BEH C18: 300 Å, 3.5 µm, 4.6 × 250 mm)
1.Prepare a modified nucleoside 3′,5′-bisphosphate as described in Support Protocol 5.
2.Prepare acceptor RNA strand (RNA 1) and donor RNA strand (RNA 2) as described in Basic Protocol 1, steps 1-27 or purchase them commercially.
3.Prepare DNA splint for the last enzymatic step or purchase it commercially.
4.Perform a 5′-phosphorylation of the donor RNA strand (RNA 2), e.g., with T4 polynucleotide kinase (T4 PNK). Follow the manufacturers protocol.
5.We recommend purchase of T4 RNA Ligase 1 (T4 Rnl1) and the phosphatase commercially and preparation of T4 RNA Ligase 2 (T4 Rnl2) in house as described in Support Protocol 6.
3′ extension of the acceptor RNA (RNA 1)
6.Prepare ligation mixture that includes all components from Table 7.Incubate ligation mixture at 37°C and 300 rpm overnight. In addition, prepare a negative control without T4 Rnl1.
| Reagent | Quantity |
|---|---|
| Acceptor RNA (RNA 1) | 50 µM |
| 3′,5′-Bisphosphate nucleoside | 200 µM |
| T4 RNA Ligase buffer | 1× |
| DMSO | 20% |
| T4 RNA Ligase 1 | 10 units per nmol RNA |
| ATP | 1 mM |
| ddH2O | Add up to 50-200 µl |
7.Perform PCI extraction to remove T4 Rnl1.
8.Add one volume of PCI solution to the reaction solution and mix vigorously. Centrifuge 10 min at 10,000 × g and 4°C.
9.Carefully transfer aqueous phase (upper phase) into a new tube and repeat extraction with one volume of fresh PCI solution.
10.Add one volume of chloroform to the aqueous phase (to remove phenol traces) and mix thoroughly. Centrifuge 10 min at 10,000 × g and 4°C. Carefully transfer aqueous phase (upper phase) into a fresh reaction tube.
11.Prepare centrifugal concentrator as described in the device manual.
12.Transfer RNA in the centrifugal concentrator and centrifuge at the recommended speed to remove ligation buffer.
13.Perform oxidation with NaIO4 to remove non-ligated RNA from the enzymatic pathway. Oxidize the “step 1 negative control.” The pipetting scheme for the oxidation is demonstrated in Table 8.Incubate reaction 1 hr and 300 rpm at room temperature (23°C).
| Reagent | Quantity |
|---|---|
| RNA | 30 µM |
| NaIO4 | 50 mM |
| ddH2O | Add up to 150-200 µl |
14.Quench oxidation reaction by adding 0.5 volumes of 50% (v/v) ethylene glycol. Incubate mixture 5 min at 300 rpm.
15.Add NaOAc solution (pH 5.5) to the aqueous phase to a final concentration of 0.3 M. Add 2.5 volumes of cold absolute ethanol and incubate at least 6 hr at −20°C.
16.Centrifuge at 8,000 × g and 4°C for 40 min. Remove supernatant and keep it for further precipitation.
17.Air dry the pellet (15-30 min) or/and use a vacuum concentrator for 2 min.
18.Reconstitute RNA pellet in 50-200 µl ddH2O.
19.Analyze RNA by UV/vis absorption spectroscopy and analytical denaturing PAGE.
Dephosphorylation of the ligated RNA
20.For the dephosphorylation with, e.g., quick calf intestinal alkaline phosphatase (CIP), Antarctic phosphatase (AnP), or shrimp alkaline phosphatase (rSAP), see the respective phosphatase manufacturer's manual. Dephosphorylate “step 1 negative control” as well.
| Reagent | Quantity |
|---|---|
| Ligated RNA | 20-40 µM |
| CutSmart® buffer | 1× |
| rSAP | 1 unit for 500 pmol RNA |
| ddH2O | Add up to 50-100 µl |
21.Perform PCI extraction to remove phosphatase as described in steps 3-6.
22.Perform an ethanol precipitation as described in steps 11-13.
23.Reconstitute RNA pellet in 50-100 µl ddH2O.
24.Analyze RNA by UV/vis absorption spectroscopy and analytical denaturing PAGE.
Splinted ligation of the dephosphorylated RNA with donor RNA (RNA 2)
25.Prepare mixture for the splinted ligation according to Table 10.Splint ligate the “step 1 negative control” as well. Additionally, prepare a negative control without T4 Rnl2.
| Reagent | Quantity |
|---|---|
| Dephosphorylated RNA | 1-8 µM |
| Donor RNA (RNA 2) | 1-8 µM |
| DNA Splint | 1-8 µM |
| T4 DNA ligase buffer | 1× |
| ddH2O | Add up to 50-1,000 µl |
| Ratio for optimization (Dephosphorylated RNA/Donor RNA/DNA Splint) | 1:1:1, 1:2:1, 2:1:2, 1:1:2 |
26.Heat sample to 80°C for 4 min.
27.Cool sample to 37°C over 10 min.
28.Incubate 15 min at 37°C and 300 rpm.
29.Add 1% (v/v) in-house produced T4 Rnl2 (2 mg/ml) and incubate reaction for another 2-3 hr at 37°C and 300 rpm.
30.Perform PCI extraction as described in steps 3-6.
31.Perform ethanol precipitation as described in steps 11-13.
32.Reconstitute RNA pellet in 20-200 µl ddH2O.
33.Remove DNA splint with a DNase, e.g., Turbo™ DNase. Follow the manufacturer's manual.
34.Analyze RNA by analytical denat. PAGE. Apply an RNA sample with RNA 1 and RNA 2 to the denat. PAGE as a reference.
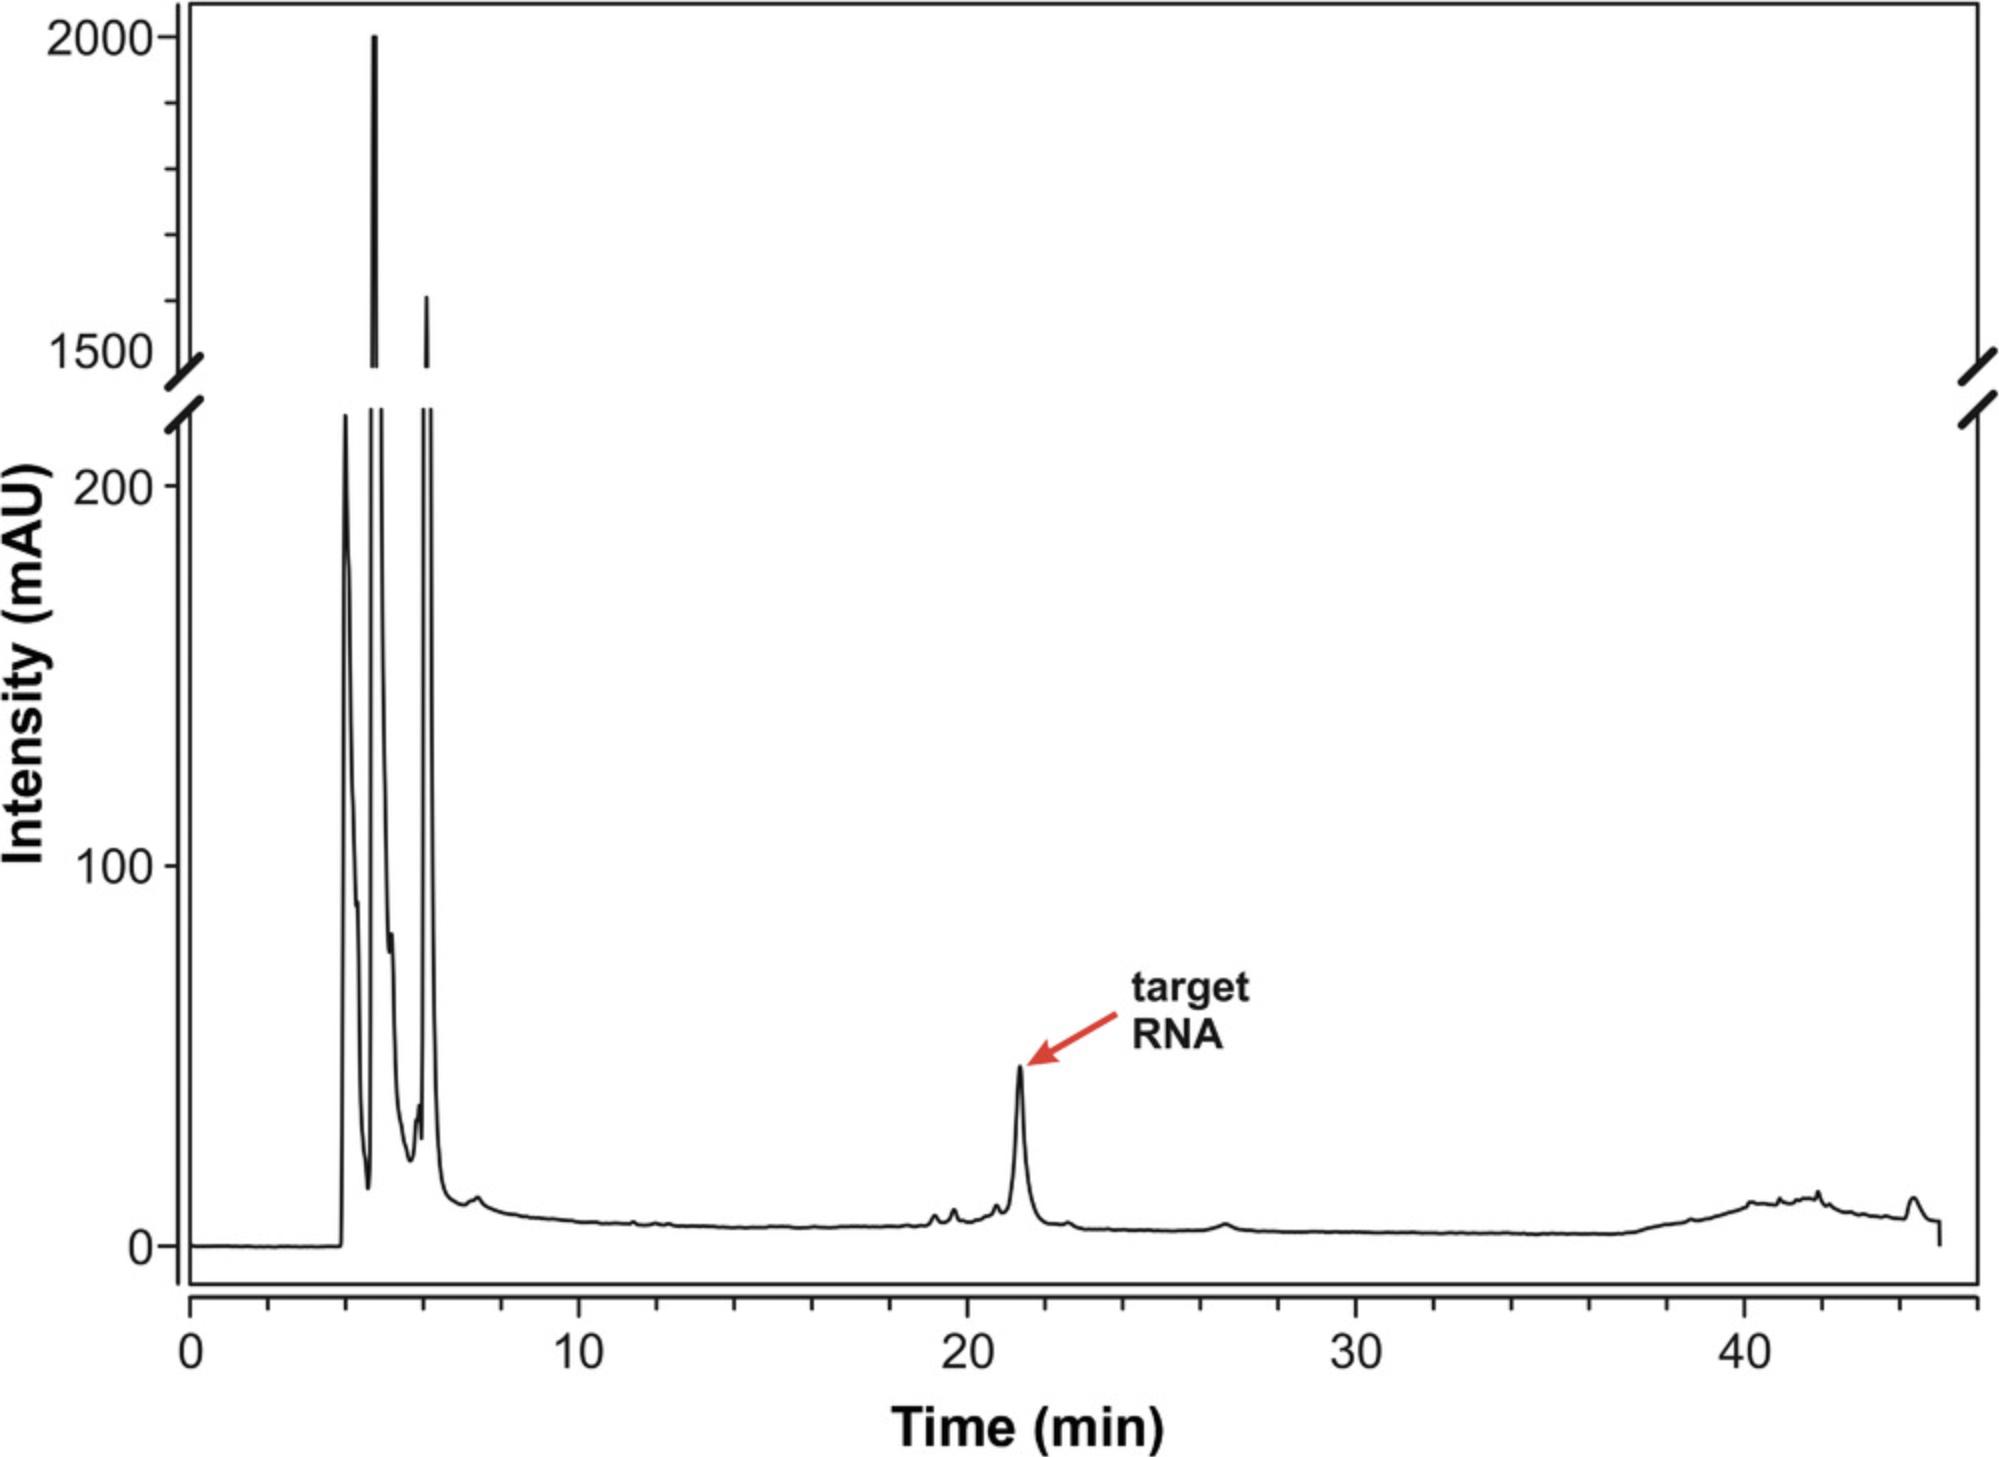
35.Purify product RNA by RP-HPLC at 60°C.
| Time (min) | HFIP buffer (%) | Methanol (%) |
|---|---|---|
| 0 | 95 | 5 |
| 2 | 95 | 5 |
| 30 | 54.5 | 45.5 |
| 32 | 0 | 100 |
36.Remove RP-HPLC buffer via lyophilizer or centrifugal vacuum concentrator.
37.Reconstitute pellet in 20-200 µl ddH2O.
38.Analyze fractions by analytical denaturing PAGE.
39.Combine fractions containing clean product.
40.Fold RNA into a single conformation and prepare NMR sample as described in Basic Protocol 1, steps 30-46.
Support Protocol 5: SYNTHESIS OF MODIFIED NUCLEOSIDE 3′,5′-BISPHOSPHATES
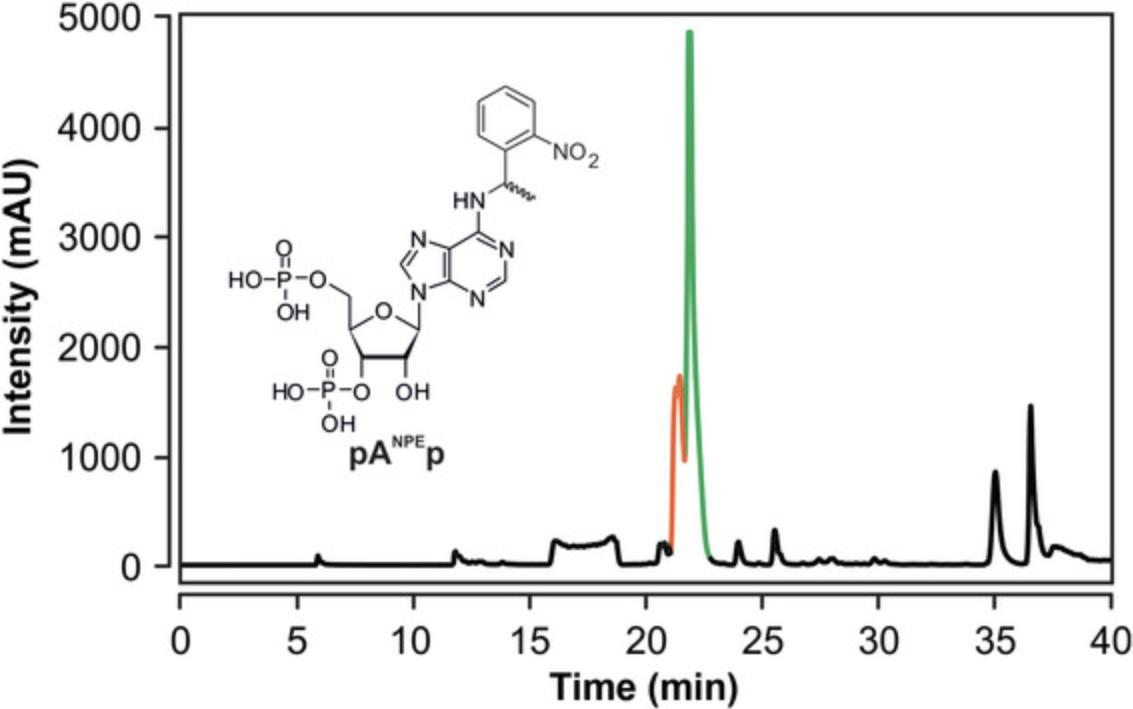
The modified nucleosides require a phosphate group at the 3′,5′ positions for site-specific incorporation into the RNA as described in Basic Protocol 2.This support protocol describes the synthesis of a modified nucleoside 3′,5′-bisphosphate (Barrio et al., 1978; Fig. 13).

Materials
-
Modified nucleoside (see Basic Protocol 2)
-
Inert gas (e.g., argon)
-
0.1% (v/v) diethyl pyrocarbonate (DEPC; Carl Roth, cat. no. K028.2)
-
Triethylamine (VWR Chemicals, cat. no. 28745.296)
-
Triethylammonium bicarbonate buffer (TEAB), 1.0 M, pH 8.0
-
Triethylammonium bicarbonate buffer (TEAB), 0.4 M, pH 8.0
-
Diphosphoryl chloride (MilliporeSigma, cat. no. 381829-5ML)
-
Double distilled water (ddH2O)
-
2-Propanol (VWR Chemicals, cat. no. 20842.330)
-
25% ammonia solution (NH3; VWR Chemicals, cat. no. 1133.1000)
-
Schlenk tube
-
Immersion chiller (FT902; Julabo)
-
Thin layer chromatography (TLC; ALUGRAM® Xtra SIL G/UV; Macherey-Nagel)
-
UV lamp, 245 and 365 nm (UVGL-58; Analytik Jena Company)
-
Lyophilizer/centrifugal vacuum concentrator (Alpha 2-4, Christ; vacuum concentrator plus, Eppendorf)
-
HPLC device (Elite LaChrom, VWR-Hitachi)
-
HPLC column (e.g., MZ Aqua Perfect, 100 Å, 5 µm; 4.6 × 250 mm: analytical; 10 × 250 mm: preparative)
-
UV/Vis spectrophotometer (NanoDrop One/One; Thermo Fisher Scientific)
-
Freezer (−20°C/−80°C)
1.Perform synthesis under a protective atmosphere for exclusion of water (e.g., argon).
2.Prepare 1 M TEAB buffer. Adjust pH to 8.0 with dry ice.
3.Prepare 0.4 M TEAB buffer. Adjust pH to 8.0 with dry ice.
4.Cool modified nucleoside to −12°C in a Schlenk tube.
5.Add ten equivalents of diphosphoryl chloride and stir 4-6 hr at −12°C.
6.Check reaction progress by TLC.
7.After complete conversion of the starting material (3-6 hr), slowly add ice (two to three pieces) to the reaction mixture.
8.Adjust pH to 6.5 (use pH paper) with pre-chilled 1.0 M TEAB buffer (pH 8.0).
9.Reduce reaction volume (3-5 ml for a 100-mg scale) with a centrifugal vacuum concentrator at 4°C.
10.Purify with RP-HPLC at room temperature.
| Time (min) | 0.4 M TEAB (%) | Acetonitrile (%) |
|---|---|---|
| 0 | 100 | 0 |
| 10 | 100 | 0 |
| 40 | 70 | 30 |
| 50 | 50 | 50 |
11.Determine fractions containing product by mass spectrometry and pool them.
12.Remove RP-HPLC buffer (triethylamine) via co-evaporation and reconstitute pellet in 10 ml ddH2O.
13.Repeat step 12 seven to ten times with an analytical amount of the substance that is analyzed via NMR spectroscopy. Ligation yield is not affected by triethylamine. To remove triethylamine, three to five cycles of co-evaporation are sufficient.
14.Determine concentration with UV/vis absorption spectroscopy.
15.Characterize product by mass spectrometry and NMR spectroscopy (1H-1D, 13C-1D, 31P-1D, 1H,1H-correlation spectroscopy [COSY], 1H,13C-HSQC, 1H,31P-HMBC).
16.Store product at −20°C in the absence of light.
Support Protocol 6: PREPARATION OF T4 RNA LIGASE 2
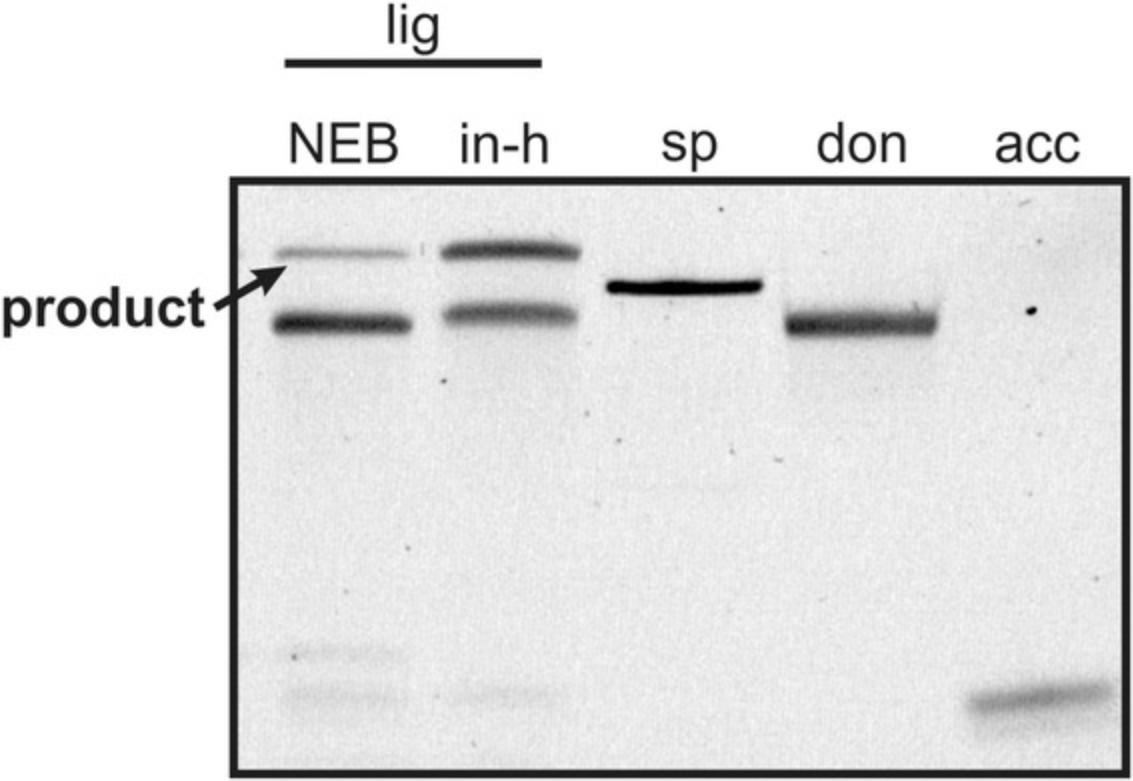
T4 RNA Ligase 2 (T4 Rnl2; Ho & Shuman, 2002) is used for Basic Protocol 2 and is commercially available. If purchasing, make sure the ligase has 2′,3′cycP esterase activity. However, purchasing the ligase is very costly. Therefore, this straightforward protocol provides an alternative for an in-house preparation of the enzyme. Our tests showed that the in-house produced T4 Rnl2 is even more efficient than the purchased T4 Rnl2 (Fig. 15).
Materials
-
LB medium (see recipe)
-
100 mg/ml ampicillin
-
BL21(DE3) Competent E. coli cells (New England BioLabs)
-
pET-RNL2 plasmid (plasmid was a gift from S. Shuman, The Sloan-Kettering Institute, New York)
-
Antifoam Y-30 emulsion (e.g., MilliporeSigma)
-
1 M IPTG
-
T4 RNA Ligase 2 (Rnl2) buffer A (see recipe)
-
T4 RNA Ligase 2 (Rnl2) buffer B (see recipe)
-
T7 RNAP buffer A (see recipe)
-
SDS stacking and resolving gel (see recipe)
-
SDS running buffer (see recipe)
-
SDS sample buffer (see recipe)
-
Coomassie staining solution (see recipe)
-
T4 RNA Ligase 2 (Rnl2) buffer C (see recipe)
-
Glycerol (Carl Roth, cat. no. 3783.1)
-
Shaking incubator
-
UV/Vis spectrophotometer (NanoDrop One/One; Thermo Fisher Scientific)
-
Centrifuge (Megafuge 8R; Thermo Fisher Scientific)
-
High-pressure homogenization (e.g., Microfluidizer® M-110 P; Microfluidics)
-
FPLC system
-
5-ml Ni-NTA affinity column (e.g., GE HisTrap HP, 5-ml column)
-
SDS casting chamber and glass plates (XCell SureLock Mini-Cell Electrophoresis System)
-
Preparative size exclusion column (e.g., GE HiLoad 26/600 Superdex 200 pg)
-
Freezer (−20°C/−80°C)
Expression and cell harvest
1.Prepare 200 ml starter culture and 1 L main culture containing LB medium and 100 µg/ml ampicillin.
2.Inoculate starter culture with a glycerol stock of BL21 DE3 E. coli cells containing the pET-RNL2 plasmid and incubate at 37°C and 160 rpm overnight.
3.Measure OD600 of the starter culture and transfer the appropriate volume into the main culture to adjust the initial OD600 to ∼0.1.
4.Incubate main culture at 37°C and 130 rpm until OD600 of 0.8 is reached.
5.Add IPTG to a final concentration of 1 mM to induce protein expression.
6.Grow cells at 37°C until OD600 of 2 is reached. This usually takes 6 hr in total.
7.Centrifuge culture medium at 4,000 × g and 4°C for 15 min to harvest cell pellet.
Purification
Perform all purification steps at 4°C.
8.Resuspend cell pellet in T4 RNA Ligase 2 buffer A (∼25 ml lysate per 1 L cell culture).
9.Lyse cell suspension via high-pressure homogenization.
10.Centrifuge lysate at 35,000 × g and 4°C for 30 min.
11.Decant and filter supernatant.
12.Equilibrate a 5-ml Ni-NTA column with ten CV of T4 RNA Ligase 2 buffer A.
13.Load protein solution onto the column.
14.Wash column with ten CV of T4 Rnl2 buffer A.
15.Wash column with ten CV of 4% T4 Rnl2 buffer B.
16.Elute with a gradient of T4 Rnl2 buffer B (0% to 100% over 50 min) and collect eluate in fractions of 2.5 ml.
17.Run a 12% SDS-PAGE of all fractions and pool fractions that contain T4 Rnl2 (42 kDa).
18.Equilibrate a size exclusion column with 1.1 CV of T4 Rnl2 buffer C.
19.Load T4 Rnl2 solution onto the size exclusion column.
20.Elute with 1.1 CV of T4 Rnl2 buffer C and collect eluate in fractions of 5 ml.
21.Run a 12% SDS-PAGE of all fractions and pick fractions that contain T4 Rnl2.
22.Check selected fractions for RNase contamination by incubating an analytical amount of each fraction with ∼15 pg of RNA of choice overnight at room temperature or for 4 hr at 37°C. Also include a control sample without protein. Check on a denaturing PAGE if the RNA is still intact. The RNA band should be distinct and sharp. A smeared RNA band or fragmentation into smaller RNAs is an indication of RNase digestion. Pool protein that does not show any signs of RNase activity. Adjust concentration to 4 mg/ml using a centrifugal concentrator.
23.Add 50% glycerol for a final stock concentration of 2.0 mg/ml.
24.Aliquot and store the enzyme T4 Rnl2 at −20°C.
Heteronuclear-detected NMR experiments for RNA
The following protocols describe the implementation of several 13C- and 15N-detected NMR experiments for RNA. These include experiments for chemical shift assignment of 1H and 13C atoms of the ribose ring, the CN-spin filter HSQC experiment for imino and the C(N)H-HDQC as well as the “amino”-NOESY for amino groups. The selection is complemented with a protocol for execution of the 15N-detected BEST-TROSY experiment. For all experiments, Topspin parameter sets are provided, which were generated at 600 MHz and need to be adapted using the command “paracon” at the respective spectrometer. Also note that the provided pulse sequences are not necessarily compatible with the “getprosol” command.
Support Protocol 7: SETUP OF NMR SPECTROMETER FOR HETERONUCLEAR-DETECTED NMR EXPERIMENTS
This support protocol describes the general procedure, which should be conducted in advance every time when the acquisition of heteronuclear-detected NMR experiments is planned. Consequently, it is to be applied before the experiments described in Basic Protocols 3-7 are conducted.
Materials
-
≥0.5 mM RNA sample (300 μl) of interest (see Basic Protocols 1 and 2; Alternate Protocols 1 and 2)
-
NMR spectrometer (equipped preferably with a z -axis gradient 13C, 15N [1H]-TXO cryogenic probe; alternatively, a z -axis gradient 1H, [13C, 15N]-TCI cryogenic probe)
1.Set NMR spectrometer to the desired temperature, equip NMR tube with a spinner, place NMR sample in the spectrometer, and let it equilibrate for ∼10 min.
2.Conduct the following steps in order to set up the NMR spectrometer.
-
Tuning and matching: All channels should be tuned and matched from high to low gyromagnetic ratio for the recommended probes in this protocol (1H,13C,2H,15N). Recheck all channels if the necessary adjustments were large. For optimal sensitivity, tuning and matching should be on point for the channel, where the direct detection takes place (usually13C).
-
Shimming: Import a recent shim file, which matches your sample conditions including type of NMR tube, salt concentration, and temperature. Conduct automatic shimming until the quality of the shim is considered good (line width of, e.g., DSS ∼1 Hz).
-
Determine1H 90° pulses.
We usually determine the1H pulse automatically or in a simple one-pulse 1D experiment by conducting a 360° pulse and varying the pulse length until the remaining signal is at the zero crossing. Set the1H carrier frequency on the water resonance (4.7 ppm).
- Determine13C and15N 90° pulses and set the carrier frequency on-resonant.
The determination of the correct 90° pulse length for13C and15N is based on SOFAST HMQC (Schanda & Brutscher,2005). Read in parameter set pulse_calib13C with pulse sequence decp90_sfhmqc.ric (13C) or parameter set pulse_calib15N with pulse sequence decp90f3_sfhmqc.ric (15N). Both sequences are modified from Bruker pulse library. Enter the previously determined1H 90° pulse and a default pulse for13C/15N. Set constant 11 (cnst11) to 1 and record the experiment with an appropriate number of transients (e.g., 8). Processing should give you a 1D spectrum with signal. Set the phase correction 0 order manually or with the command apk0. This value should not be changed during the further calibration procedure. Set cnst11 to 2 and repeat the experiment. Here, all signals should be at the zero-crossing point. Change the length of the13C/15N 90° pulse until the leftover signal is minimal. With newer hardware (Bruker AVIII and higher), this decoupler X-nuclei pulses, determined by the method described above, can be transferred to the observe channel. For older hardware, the 90°pulse needs to be checked in13C/15N 1D experiments. The shape pulse can also be calculated from these values, either directly in the pulse sequence or via the PROSOL table (see Bruker manual).
3.Check the quality of your NMR sample and the shim by recording reference experiments like 1H-1D and 13C/15N-HSQC experiments.
Support Protocol 8: IPAP AND DIPAP FOR HOMONUCLEAR DECOUPLING
As usually uniformly 13C-labeled RNAs are used for carbon-direct detected NMR experiments, methods to decouple homonuclear 1J CC scalar couplings are needed. This can be achieved using in-phase anti-phase (IPAP; Hammarstroem & Otting, 1994; Ottiger, Delaglio, & Bax, 1998) or S3E (Meissner, Duus, & Sørensen, 1997) schemes as well as selective decoupling sequences during acquisition or maximum entropy reconstruction (Hoch, Stern, & Mobli, 2011; Serber et al., 2000). As we usually work with IPAP and double IPAP (DIPAP) sequences, we will describe the general procedure on how to set them up in the following protocol. This Support Protocol is thus relevant for Basic Protocols 3-6.
Materials
-
≥0.5 mM RNA sample (300 μl) of interest (see Basic Protocols 1 and 2; Alternate Protocols 1 and 2)
-
NMR spectrometer equipped preferably with a z -axis gradient 13C, 15N [1H]-TXO cryogenic probe; alternatively, a z -axis gradient 1H, [13C, 15N]-TCI cryogenic probe
1.Before starting measurements, the following information is needed:
-
Are one/two (IPAP/DIPAP) sequences for homonuclear decoupling needed? This depends on the number of carbon atoms which need to be decoupled and whether their chemical shifts and coupling constants are different from each other. For an overview, see Fiala & Sklenár,2007.
-
What is the size of the1JCCcoupling constants (Fiala & Sklenár,2007)?
-
What is the chemical shift of the carbon nucleus that is detected (13Con) and what is/are the chemical shift(s) of the one(s) which is/are decoupled (13Coff/13Coff; Fiala & Sklenár,2007)?
Based on this information, the IPAP parameters will be determined in step 4.
2.If not already the case, include IPAP/DIPAP sequence in the pulse sequence of interest either during the last insensitive nuclei enhancement by polarization transfer (INEPT) step (IPAP, Fig. 16A; DIPAP, Fig. 16C) or as a separate element.
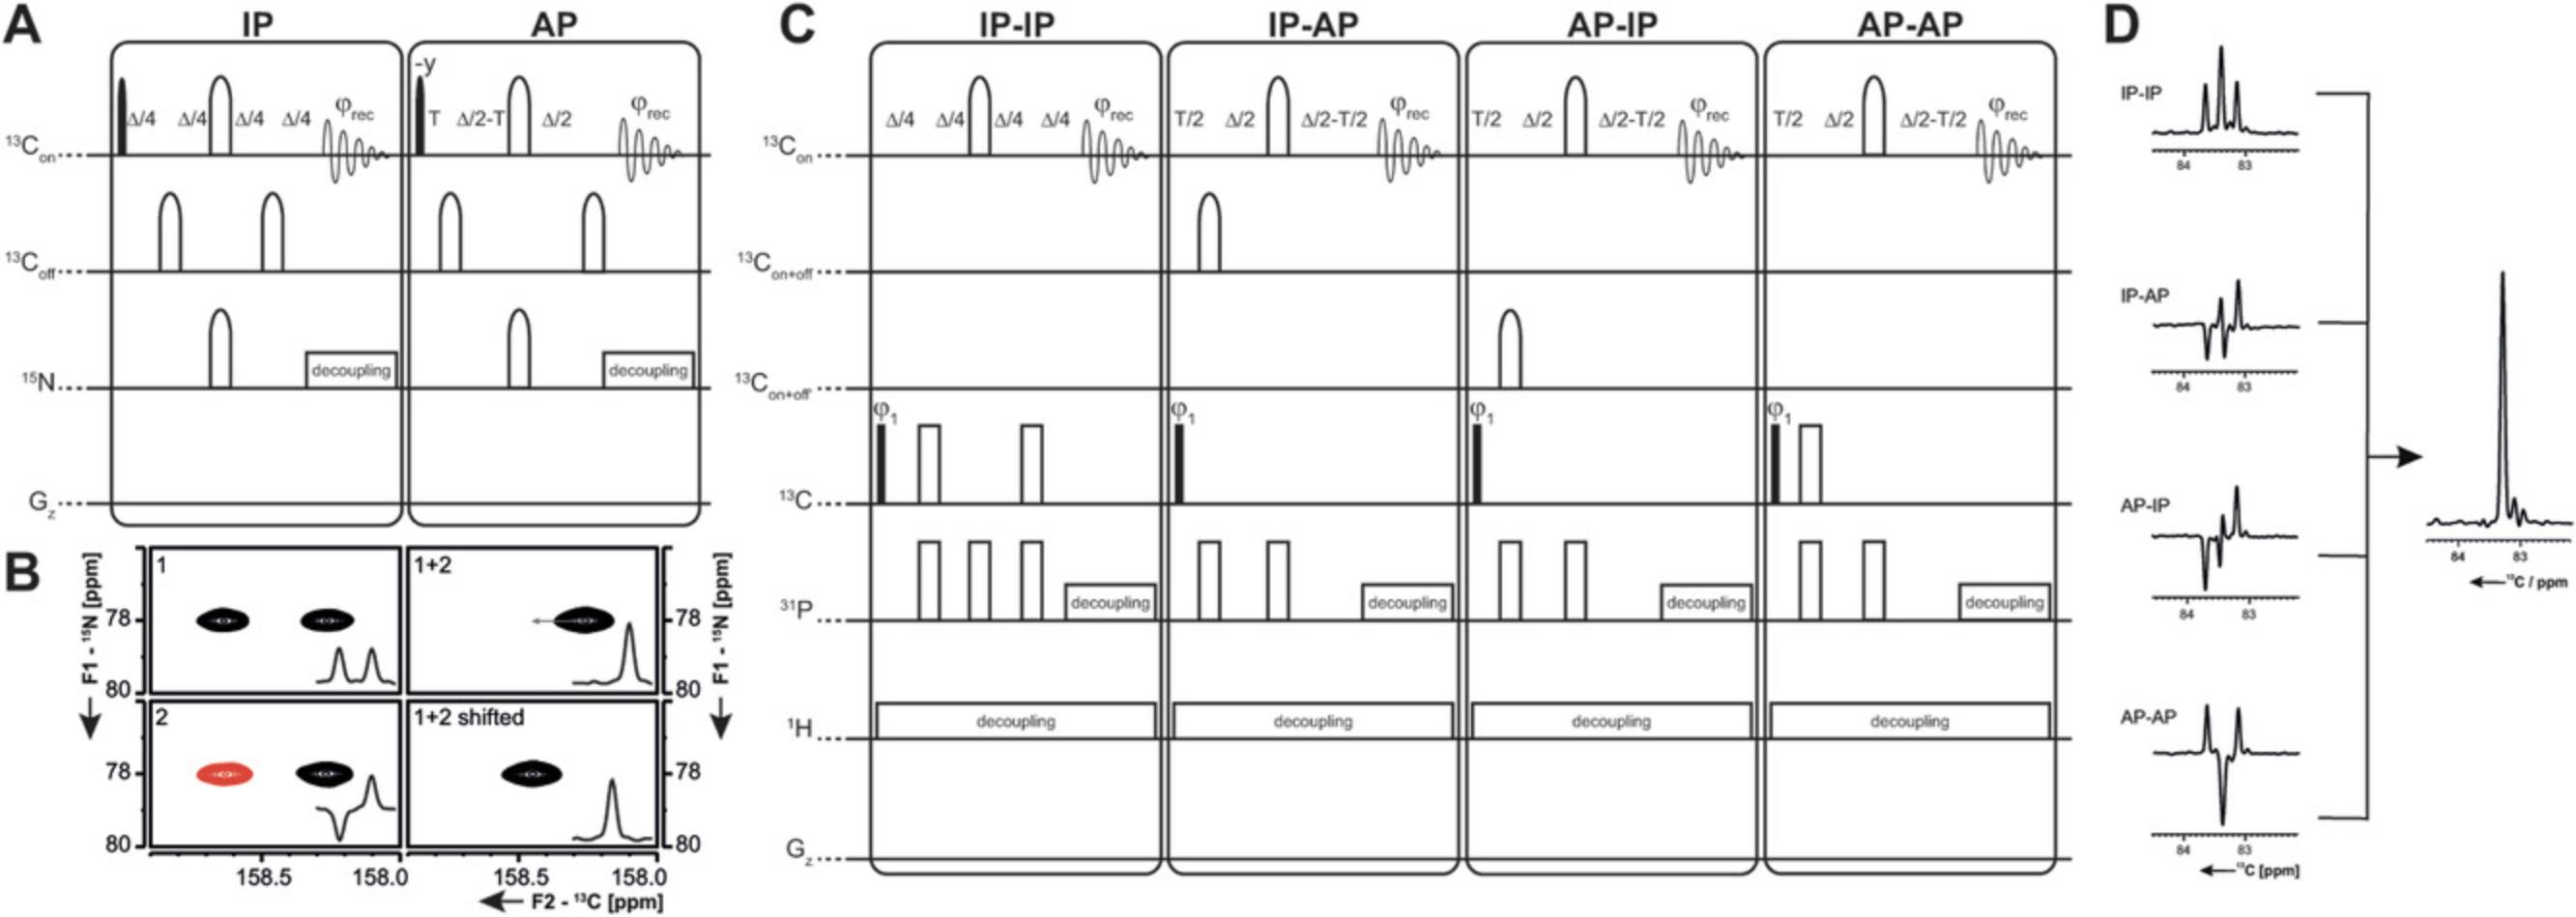
3.Set up NMR spectrometer according to Support Protocol 7.
4.Choose pulse shapes, carrier frequencies, and pulse length for on- and off-resonant carbon pulses. Those parameters are summarized in Table 13 (IPAP) and Table 14 (DIPAP) for all possible carbon atoms in RNA.
| Observed carbon | Decoupled carbon | 13Con | 13C selective pulse 180° | 13C selective pulse 90° | 13Coff offset | Delay T | |
|---|---|---|---|---|---|---|---|
| A | C6b | C5 | 158 ppm | Q3 400 µs | Q5 600 µs | −8,000 Hz | 3.3 ms |
| C4c | C5 | 150 ppm | Q3 750 µs | Q5 900 µs | −6,400 Hz | 4.1 ms | |
| G | C6d | C5 | 157 ppm | Q3 380 µs | Q5 560 µs | −8,600 Hz | 2.8 ms |
| C4c | C5 | 150 ppm | Q3 750 µs | Q5 900 µs | −6,400 Hz | 4.1 ms | |
| C | C6c | C5 | 140 ppm | Q3 750 µs | - | −9,000 Hz | 3.8 ms |
| C4b | C5 | 167 ppm | Q3 400 µs | Q5 600 µs | −14,400 Hz | 4.5 ms | |
| U | C6c | C5 | 140 ppm | Q3 750 µs | - | −8,000 Hz | 3.8 ms |
| C4c | C5 | 167 ppm | Q3 750 µs | Q5 940 µs | −13,400 Hz | 3.9 ms | |
| Ribose | C1′e | C2′ | 90 ppm | Q3 1500 µs | - | −4,000 Hz | 6.3 ms |
| C5′e | C4′ | 82 ppm | Reburp 2,000 µs (C3′, C4′) | - | −1,000 Hz (C3′, C4′) | 6.3 ms | |
| Reburp 4,900 µs (C4′, C5′) | 0 Hz/−4,000 Hz (C4′/C5′) | ||||||
| A and C | C6 and C4b | C5 and C5 | 162 ppm | Q3 400 µs | Q5 600 µs | −11,000 Hz | 3.9 ms |
- a
Pulse lengths, shapes, offsets, and IPAP time T were taken from literature references listed below. All parameters are calculated for an 800 MHz NMR spectrometer.
- b
Schnieders et al., 2019.
- c
Fiala & Sklenár, 2007.
- d
Fürtig et al., 2016.
- e
Richter et al., 2010.
| Observed carbon | Decoupled carbon | 13Con | 13C selective pulse 180° | 13C selective pulse 90° | 13Coff/off offset | Delay T | |
|---|---|---|---|---|---|---|---|
| G | C5 | C4 and C6 | 119 ppm | Q3.surbop 500 µs (C5) | Q5 1,000 µs (C5) | −11,500 Hz (C6) | 7.7 ms (C5-C6) |
| Q3.surbop 900 µs (C6) | 4,600Hz (C4+C5) | 5.7 ms (C5-C4) | |||||
| Reburp 600 µs (C4+C5) | |||||||
| Ribose | C4′ | C5′ and C3′ | 82 ppm | Reburp 4,900 µs (C4′) | - | −1,000 Hz (C3′,C4′) | 6.3 ms |
| Reburp 2,000 µs (C3′,C4′) | 0 Hz/−4,000 Hz (C4′/C5′) | ||||||
| Reburp 4,900 µs (C4′,C5′) |
- a
Pulse lengths, shapes, offsets, and IPAP time T were taken from Richter et al., 2010.
5.Choose delays Δ and T, where Δ = 1/21J CX and T = 1/41J CC (Tables 13 and 14).
6.Record the experiment of interest. Conduct the experiment with double/quadruple of the desired points and half/quarter of the desired transients for IPAP/DIPAP, respectively.
7.Processing: As experiments with IPAP/DIPAP are recorded in an interleaved manner and the decoupling is based on a combination of in-phase and anti-phase doublets/quadruplets (Fig. 16B and D), the in-phase (IP) and anti-phase (AP) spectra need to be split first. After splitting, they need to be processed and combined. Shift the resulting spectrum by 0.5 × 1J CC to the correct chemical shift.
Basic Protocol 3: 13C-DETECTED 3D (H)CC-TOCSY, (H)CPC, AND (H)CPC-CCH-TOCSY EXPERIMENTS FOR RIBOSE ASSIGNMENT
NMR spectroscopy of large RNAs but also proteins is often difficult as the signal-to-noise ratio (S/N) deteriorates with larger molecular weight of the RNA of interest, which is caused by the following main points. With an increased molecular weight the number of signals increases, which concomitantly leads to resonance overlap. For RNA, this resonance overlap is particularly pronounced for 1H-nuclei due to a poor chemical shift dispersion. Furthermore, an increased transverse relaxation rate leads to signal broadening, which is especially prominent for 1H-nuclei as well. When conducting 13C-detected NMR experiments these problems can be substantially reduced. 13C nuclei feature a higher chemical shift dispersion and at the same time exhibit more favorable relaxation properties. To exploit these properties also in the assignment of the ribose moiety, where resonance overlap is particularly problematic, a set of experiments was developed by Richter et al., (2010). Here, we will provide a detailed guide on how to set up the 13C-detected (H)CC-TOCSY, (H)CPC, and (H)CPC-CCH-TOCSY experiments (coherence transfer pathway in Fig. 17).
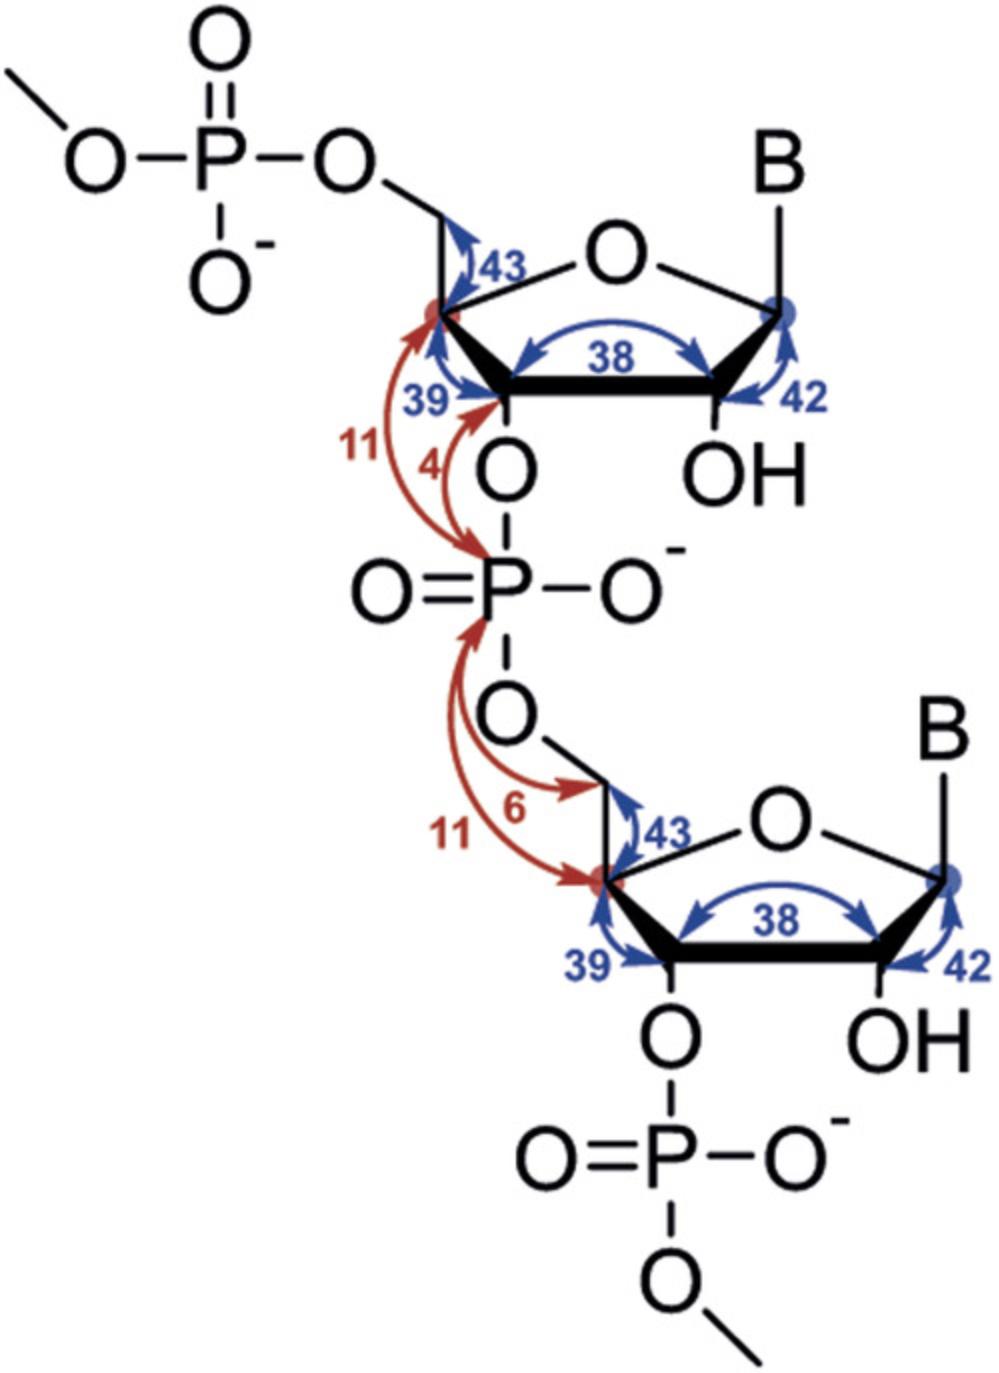
Materials
-
≥0.5 mM uniformly 13C-labeled RNA (see Basic Protocol 1)
-
NMR buffer (see recipe)
-
Other RNA specific requirements like Mg2+ ions or small molecule ligands
-
NMR tube (e.g., Shigemi)
-
NMR spectrometer equipped preferably with a z -axis gradient 13C, 15N [1H]-TXO cryogenic probe; alternatively a z -axis gradient 1H, [13C, 15N]-TCI cryogenic probe
1.Set up the NMR spectrometer according to Support Protocol 7.
2.Record a 1H,13C-HSQC spectrum of the ribose region as a reference spectrum.
3D (H)CC-TOCSY experiment
3.Load parameter set c_3D-hCC-TOCSY-H1′C1′ with pulse sequence c_HC1ccflopsy.ric.
4.Use IPAP for homonuclear decoupling according to Support Protocol 8, applying the pulse lengths listed in Table 13.
5.Adjust TOCSY transfer length depending on the desired correlations.
6.Choose carrier frequencies according to the resonance distribution.
7.Adjust number of transients and points and test the experiment by recording the first increment. Check whether the S/N is sufficient. If not, adjust number of transients.
8.If available, you may apply non-uniform sampling (NUS).
9.When the experiment is completed, process spectrum as described in Support Protocol 8 (sample data: Fig. 18A).
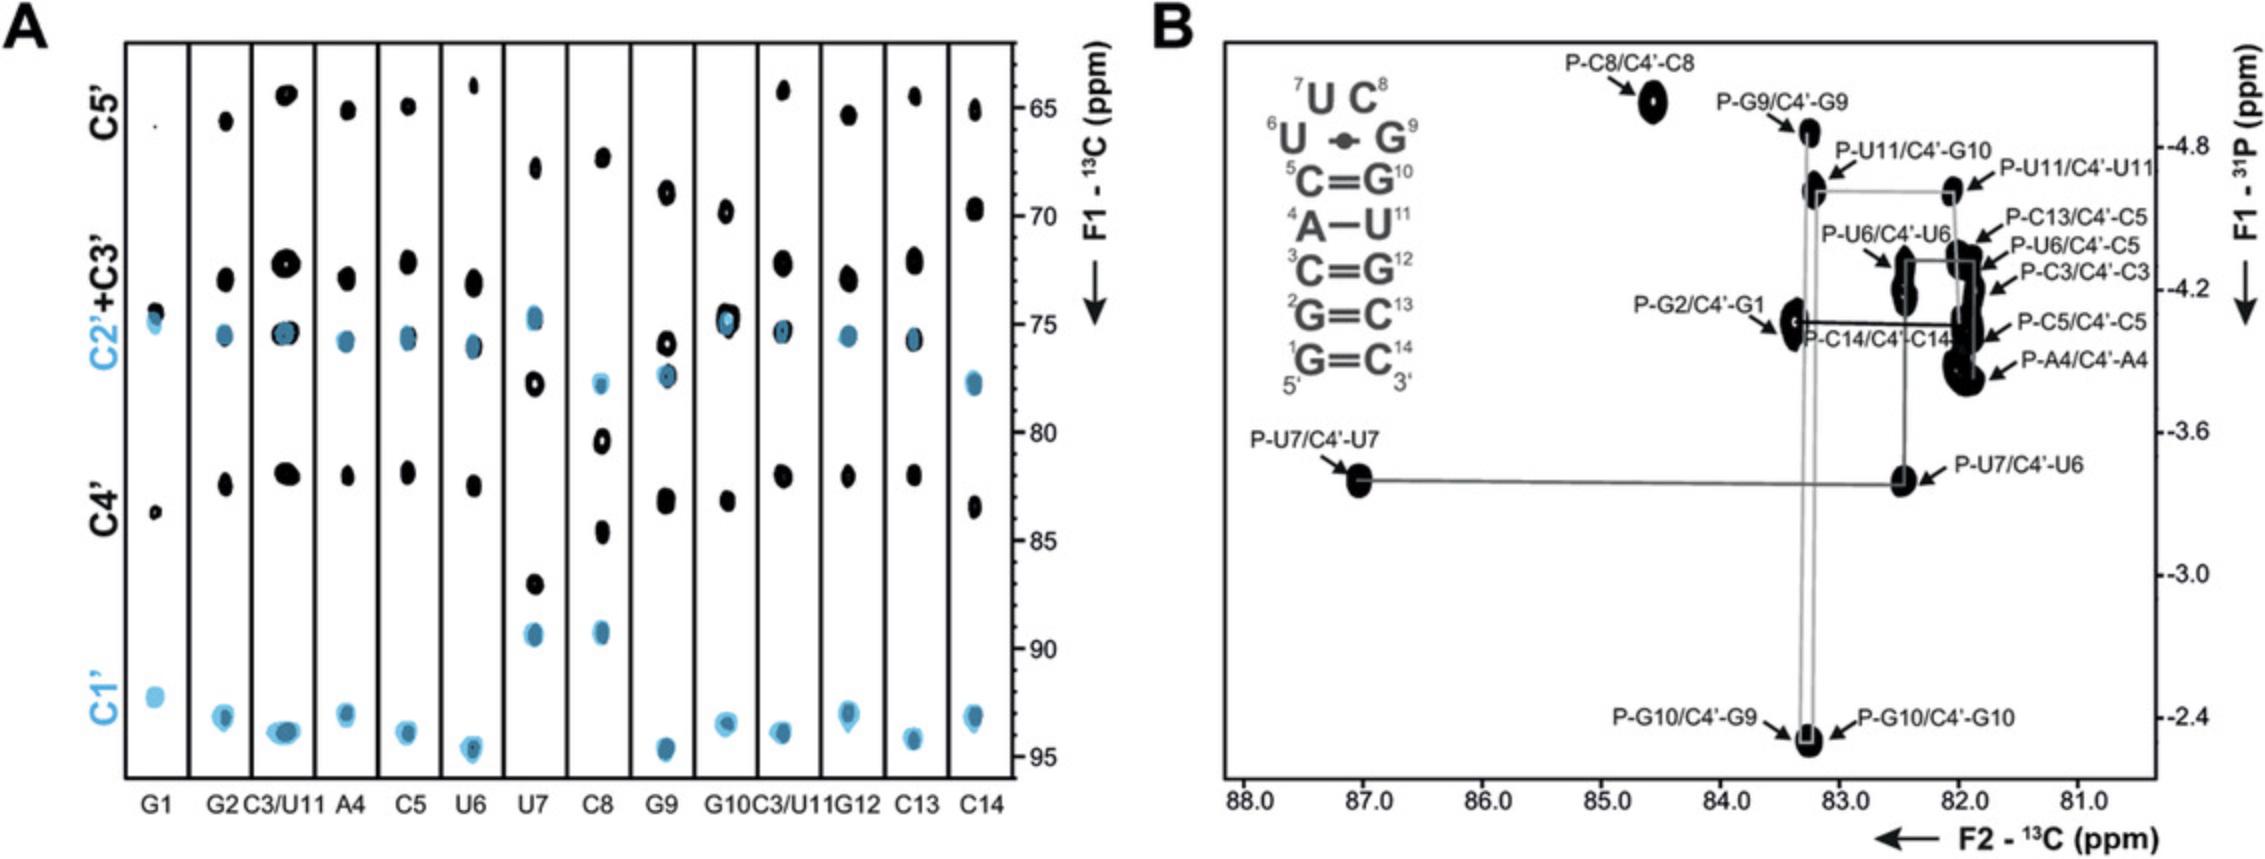
2D (H)CPC experiment
10.Include the non-standard selective pulse for C4′ and C5′, which is used for the DIPAP step (see Supporting Information), to the list of shapes.
11.Test pulse in a 1D experiment by loading parameter set C13PGF2igF3se2d with pulse sequence zgpgf2igf3se2d.t1.
12.Load parameter set c_2D-hCPC with pulse sequence c_HCPC.t14.
13.Choose carrier frequencies according to the resonance distribution.
14.Set cnst2 to 166 Hz (1J CH coupling).
15.For DIPAP, choose shaped pulses for sp21 (Reburp.1000), sp28 (Reburp.1000), and sp29 (reburp_c4c5bs_2.1000) as well as pulse lengths for p23 (2 ms, 600 MHz) and p25 (6.5 ms, 600 MHz) according to the magnetic field strength.
16.Adjust number of transients and points and test the experiment by recording the first increment. Check whether the S/N is sufficient. If not, adjust number of transients.
17.If available, you may apply non-uniform sampling (NUS).
18.Processing: Process spectrum as described in Support Protocol 8 (sample data: Fig. 18B).
2D (H)CPC-CCH-TOCSY experiment
19.Load parameter set c_3D-hCC-TOCSY-H1′C1′ with pulse sequence c_HC1ccflopsy.
20.Set TOCSY mixing time to 32 ms.
21.Set cnst2 to 166 Hz (1J CH coupling).
22.Set carrier frequencies according to the resonance distribution.
23.For IPAP, choose Q3 shapes for sp24 (C1′ selective) and sp27 (C2′ selective) as well as pulse lengths for p12 (2 ms, 600 MHz) according to the magnetic field strength.
24.Adjust number of transients and points and test the experiment by recording the first increment. Check whether the S/N is sufficient. If not, adjust number of transients.
25.If available, you may apply non-uniform sampling (NUS).
26.Processing: Process spectrum as described in Support Protocol 8.
Basic Protocol 4: 13C-DETECTED 2D CN-SPIN FILTER HSQC EXPERIMENT
NMR spectroscopy of RNA usually focuses on the imino proton resonance as a reporter for base pairing. The reason is that it is only observable when protected through a hydrogen bond. Otherwise, it rapidly exchanges with solvent water and the resonance is broadened beyond detectability. While this allows quick secondary structure determination, any information about flexible regions of the RNA is not available. With the 13C-detected CN-spin filter HSQC experiment, however, those flexible regions are accessible as here the detection happens on carbon (Fürtig et al., 2016). Moreover, the status of hydrogen bonding of any imino-proton-carrying nucleobase (G or U) can be determined as signal intensities are modulated depending on the imino proton exchange rate (Fig. 19B). The schematic coherence transfer in Figure 19A shows that this experiment is composed of a CN-transfer step that is succeeded by an NH spin filter element. The differences in signal intensity result from a modulation of the observed scalar 1J NH coupling on the imino proton exchange rate. If the proton exchange is slow, the 1J NH coupling can evolve during the spin filter element. However, if the imino proton exchange with solvent water is fast, scalar relaxation of the second kind leads to a decoupling of the scalar coupling which results to no effect on the signal intensity (Fig. 19B).
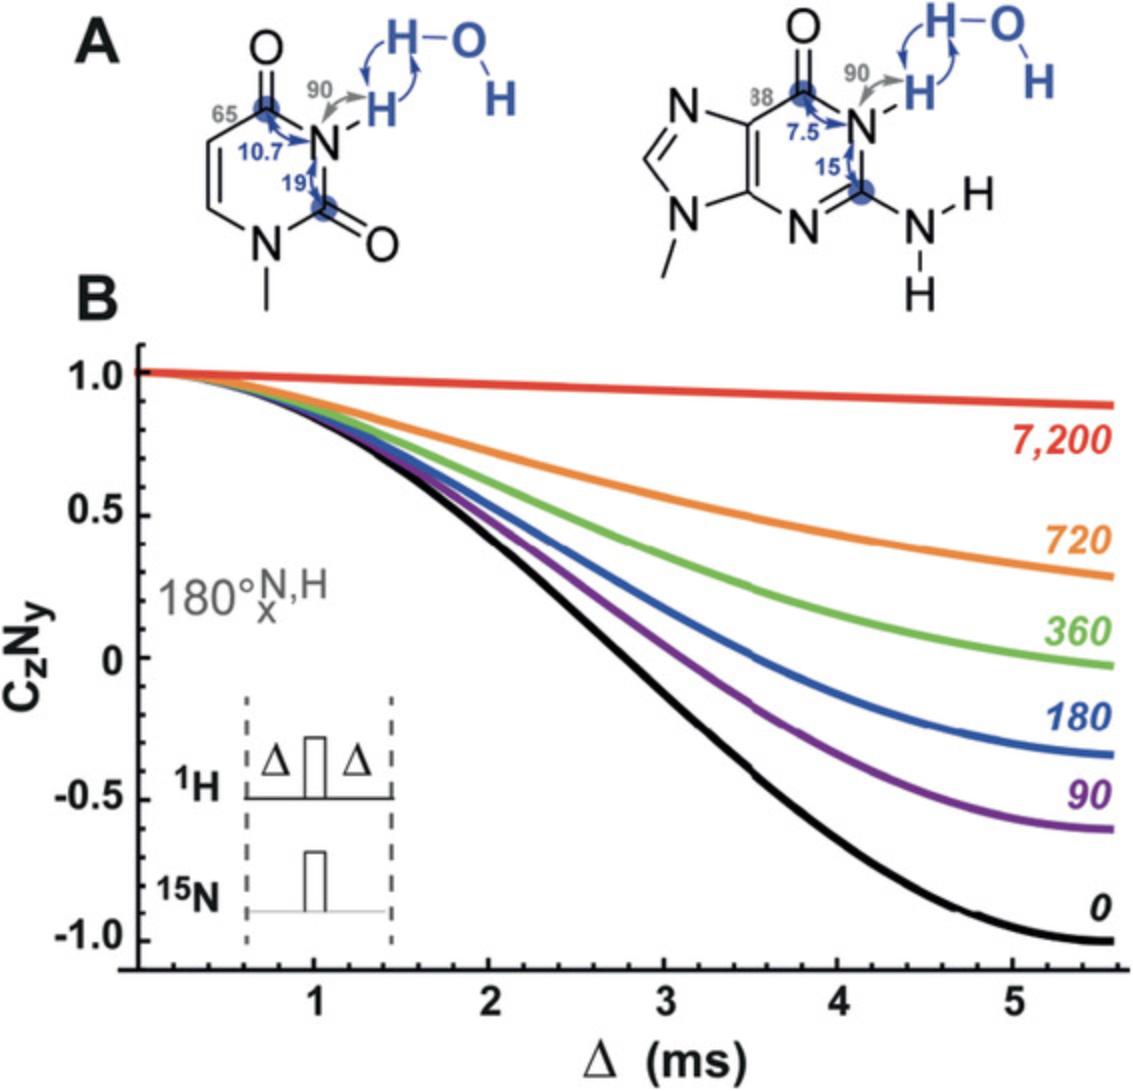
Materials
-
≥0.5 mM RNA sample with 13C,15N-labeled imino group containing nucleotide of interest (G or U) or uniformly 13C,15N-labeled RNA (see Basic Protocol 1)
-
NMR buffer (see recipe)
-
Other RNA specific requirements like Mg2+ ions or small molecule ligands
-
NMR tube (e.g., Shigemi)
-
NMR spectrometer equipped preferably with a z -axis gradient 13C, 15N [1H]-TXO cryogenic probe; alternatively, a z -axis gradient 1H, [13C, 15N]-TCI cryogenic probe
1.Set up NMR spectrometer according to Support Protocol 7.
2.Record a 1H,15N-HSQC spectrum of the imino region for comparison (Fig. 20A).
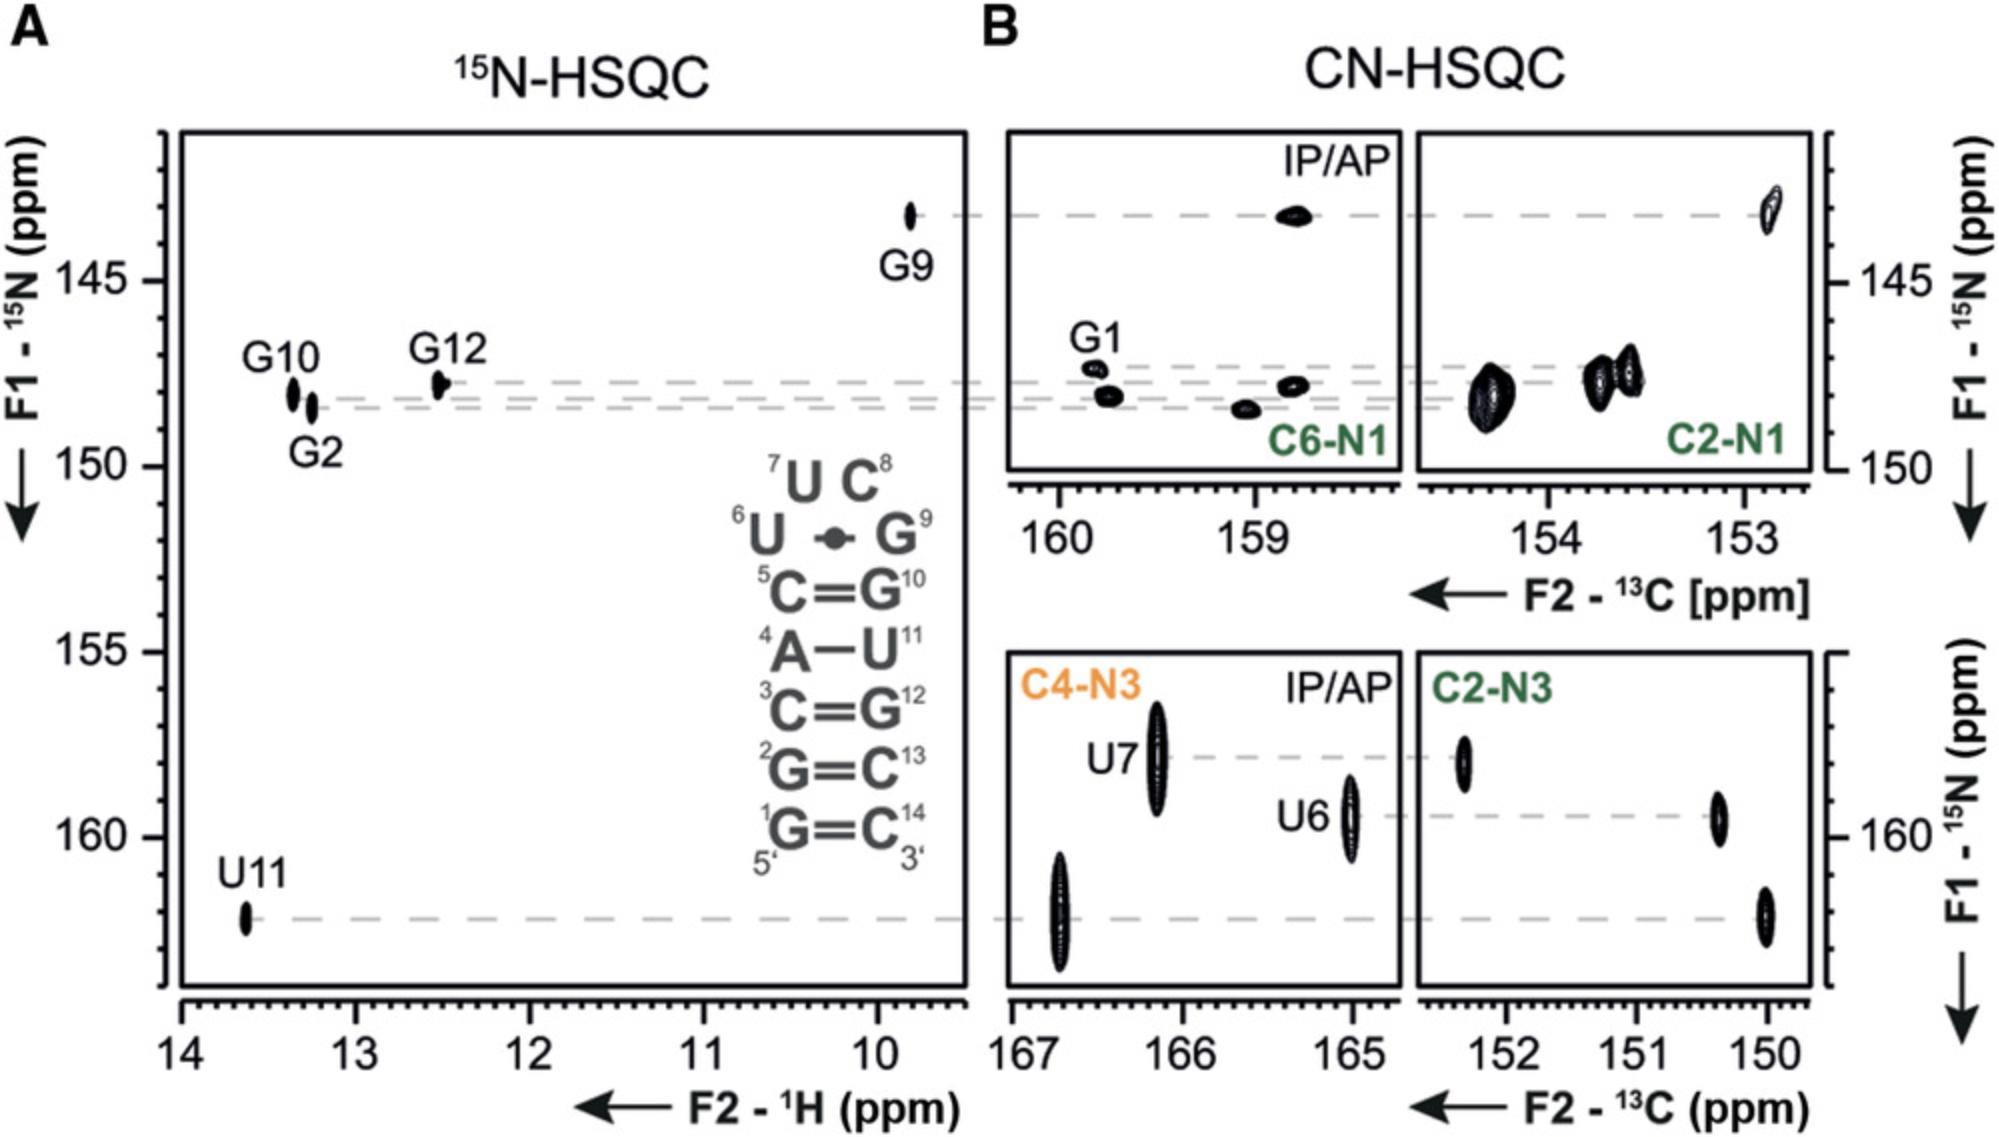
3.Record 13C-detected CN-HSQC spectra in order to optimize the CN-transfer time, which depends on the desired correlations for G (C2N1 or C6N1) or U (C2N3 or C4N3).
| G | U | |||
|---|---|---|---|---|
| C2N1 | C6N1 | C2N3 | C4N3 | |
| 1JCN | 27 Hz | 27 Hz | 27 Hz | 17 Hz |
| 13C carrier | 156 ppm | 161 ppm | 154 ppm | 169 ppm |
| 15N carrier | 147 ppm | 160 ppm | ||
- a
Note that chemical shifts are referenced.
4.Set up 2D CN-HSQC experiment using the optimized transfer time. Use IPAP sequences for homonuclear decoupling if needed (G-C6N1 and U-C4N3) and implement them according to Support Protocol 8. Set carrier frequencies and spectral windows according to the correlations of interest (Table 13). Check whether the number of transients is sufficient in the first increment of the CN-HSQC experiment. Compare spectra with a standard 1H,15N-HSQC spectrum of the imino region (Fig. 20A and B).
5.Load parameter set C_CON_SQXF or C_CON_IASQXF (IPAP) with the pulse sequences c_con_sqxf and c_con_iasqxf, respectively. Set the delay for the CN-transfer as optimized in the CN-HSQC experiment. If necessary, use IPAP sequences as conducted for the CN-HSQC experiment or according to Support Protocol 8. Use a 1J NH coupling constant of 90 Hz to calculate spin filter delay (1/1J NH).
6.Processing: If IPAP schemes were used, process spectra according to Support Protocol 8. If this was not the case, simple 2D processing can be applied.
7.Data interpretation: Based on the signal intensities in this 2D experiment, the status of hydrogen bonding can be estimated.
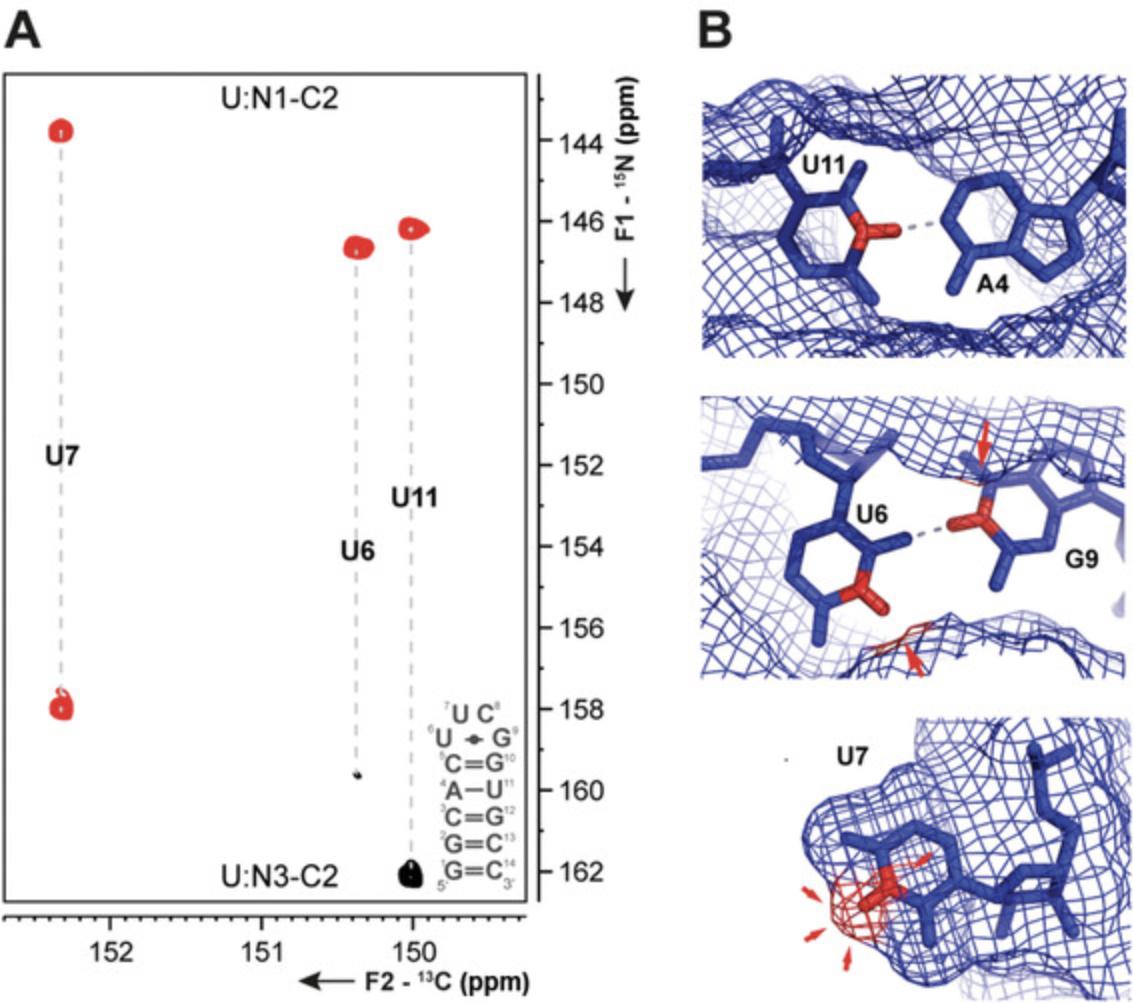
Basic Protocol 5: 13C-DETECTED C(N)H-HDQC EXPERIMENT FOR THE DETECTION OF AMINO GROUPS
Amino groups are important functional groups in RNA and are known to be involved in many different kinds of interactions due to their hydrogen bonding potential. However, NMR spectroscopy of RNA often sets a focus on the characterization of the imino protons as their resonances are well dispersed and allow a fast secondary structure determination. The resonances of amino groups on the other hand exhibit—especially for guanosines and adenosines—very broad lines, which are often beyond detectability. The reason for this is a partially restricted rotation around the C-NH2 bond that is regularly in the intermediate exchange regime on the NMR time scale (Mueller, Legault, & Pardi, 1995). By moving away from 1H-direct detection to 13C-detected NMR experiments and by evolving 1H double quantum (DQ) coherence, the effect of the rotation on the signal line shapes is diminished in the C(N)H-HDQC experiment (Fig. 22A; Schnieders et al., 2019). With this experiment, one is able to detect a full set of sharp amino resonances for all of the amino-group bearing nucleotides. The experiment combines a CN-HSQC with an additional NH transfer (magnetization transfer, Fig. 22B) where 1H-double quantum coherence is selected and evolved in the indirect dimension. As described in the Support Protocol 8, homonuclear 1J CC coupling in adenosines and cytidines is decoupled using IPAP sequences. This protocol will explain step by step how to successfully set this experiment up and what to consider.
![Details are in the caption following the image (A) Pulse scheme of the <sup>13</sup>C-detected C(N)H-HDQC experiment with IPAP sequence for homonuclear CC-decoupling in adenosines and cytidines. Rectangular 90° and 180° pulses are indicated by narrow filled and wide-open bars, respectively. Semi-elliptic narrow filled bars represent selective 90° pulses (<sup>13</sup>C Q5 600 µs at 800 MHz). Selective 180° pulses (<sup>13</sup>C Q3 400 µs, on- or off-resonant, and <sup>15</sup>N Reburp [Geen & Freeman, 1991] 1.2 ms at 800 MHz) and gradients are shown as semi-elliptic wide-open shapes. The default phase is x. <sup>15</sup>N nuclei are decoupled during acquisition using asynchronous GARP4 sequences (Shaka et al., 1985). Gradient pulses were applied for 1 ms with a smoothed square amplitude (SMSQ10.100) and 100% gradient strength corresponds to 53 G/cm. The t<sub>1</sub>-time was incremented with half of the dwell time. Frequency discrimination in the indirect dimension φ<sub>3</sub> was cycled with 45°. Pulse phases, delays, and gradient strengths are as follows: φ<sub>1</sub> = x, -x, φ<sub>2</sub> = (4)x, (4)(-x), φ<sub>3</sub> = (2)x, (2)y, (2)(-x), (2)(-y), φ<sub>4</sub> = (8)x, (8)(-x), φ<sub>rec</sub> = x, (2)(-x), x, -x, (2)x, (2)(-x), (2)x, -x, x, (2)(-x), x, Δ = 1/2<sup>1</sup>J<sub>CN</sub> = 19.23 ms, Δ<sub>1</sub> = 1/2<sup>1</sup>J<sub>NH</sub> = 4.17 ms, T = 1/4<sup>1</sup>J<sub>CC</sub> = 4.5 ms (cytidine) or 3.3 ms (adenosine), 50% (g<sub>1</sub>), 60% (g<sub>2</sub>), 48% (g<sub>3</sub>), and 35% (g<sub>4</sub>). (B) Schematic magnetization transfer pathway of the C(N)H-HDQC experiment for A (top), G (bottom), and C (middle). The size of the <sup>1</sup>J<sub>CN</sub> and <sup>1</sup>J<sub>NH</sub> scalar couplings is indicated. Coupling constants, which are used for IPAP decoupling schemes are depicted in gray. The carbon where detection happens is marked with a circle. The rotation of the protons around the CN bond is indicated with a red elliptic line. Both of the schemes were adapted from Schnieders et al., 2019, 2020. HDQC, heteronuclear double-quantum correlation; IPAP, in-phase anti-phase.](https://static.yanyin.tech/literature_test/cpnc116-fig-0022-m.jpg)
Materials
-
≥0.5 mM RNA sample with 13C,15N-labeled amino group containing nucleotide of interest (G, C, or A) or uniformly 13C,15N-labeled RNA (see Basic Protocol 1)
-
NMR buffer (see recipe)
-
Other RNA specific requirements like Mg2+ ions or small molecule ligands
-
NMR tube (e.g., Shigemi)
-
NMR spectrometer equipped preferably with a z -axis gradient 13C, 15N [1H]-TXO cryogenic probe; alternatively, a z -axis gradient 1H, [13C, 15N]-TCI cryogenic probe
1.Prepare NMR spectrometer according to Support Protocol 7.
2.Record a 1H,15N-HSQC spectrum of the amino region to get information about resonance distribution and quality of the sample (Fig. 23A). The recommended pulse scheme includes a CPMG-like element for the HN transfer (Mueller et al., 1995; Mulder, Spronk, Slijper, Kaptein, & Boelens, 1996).
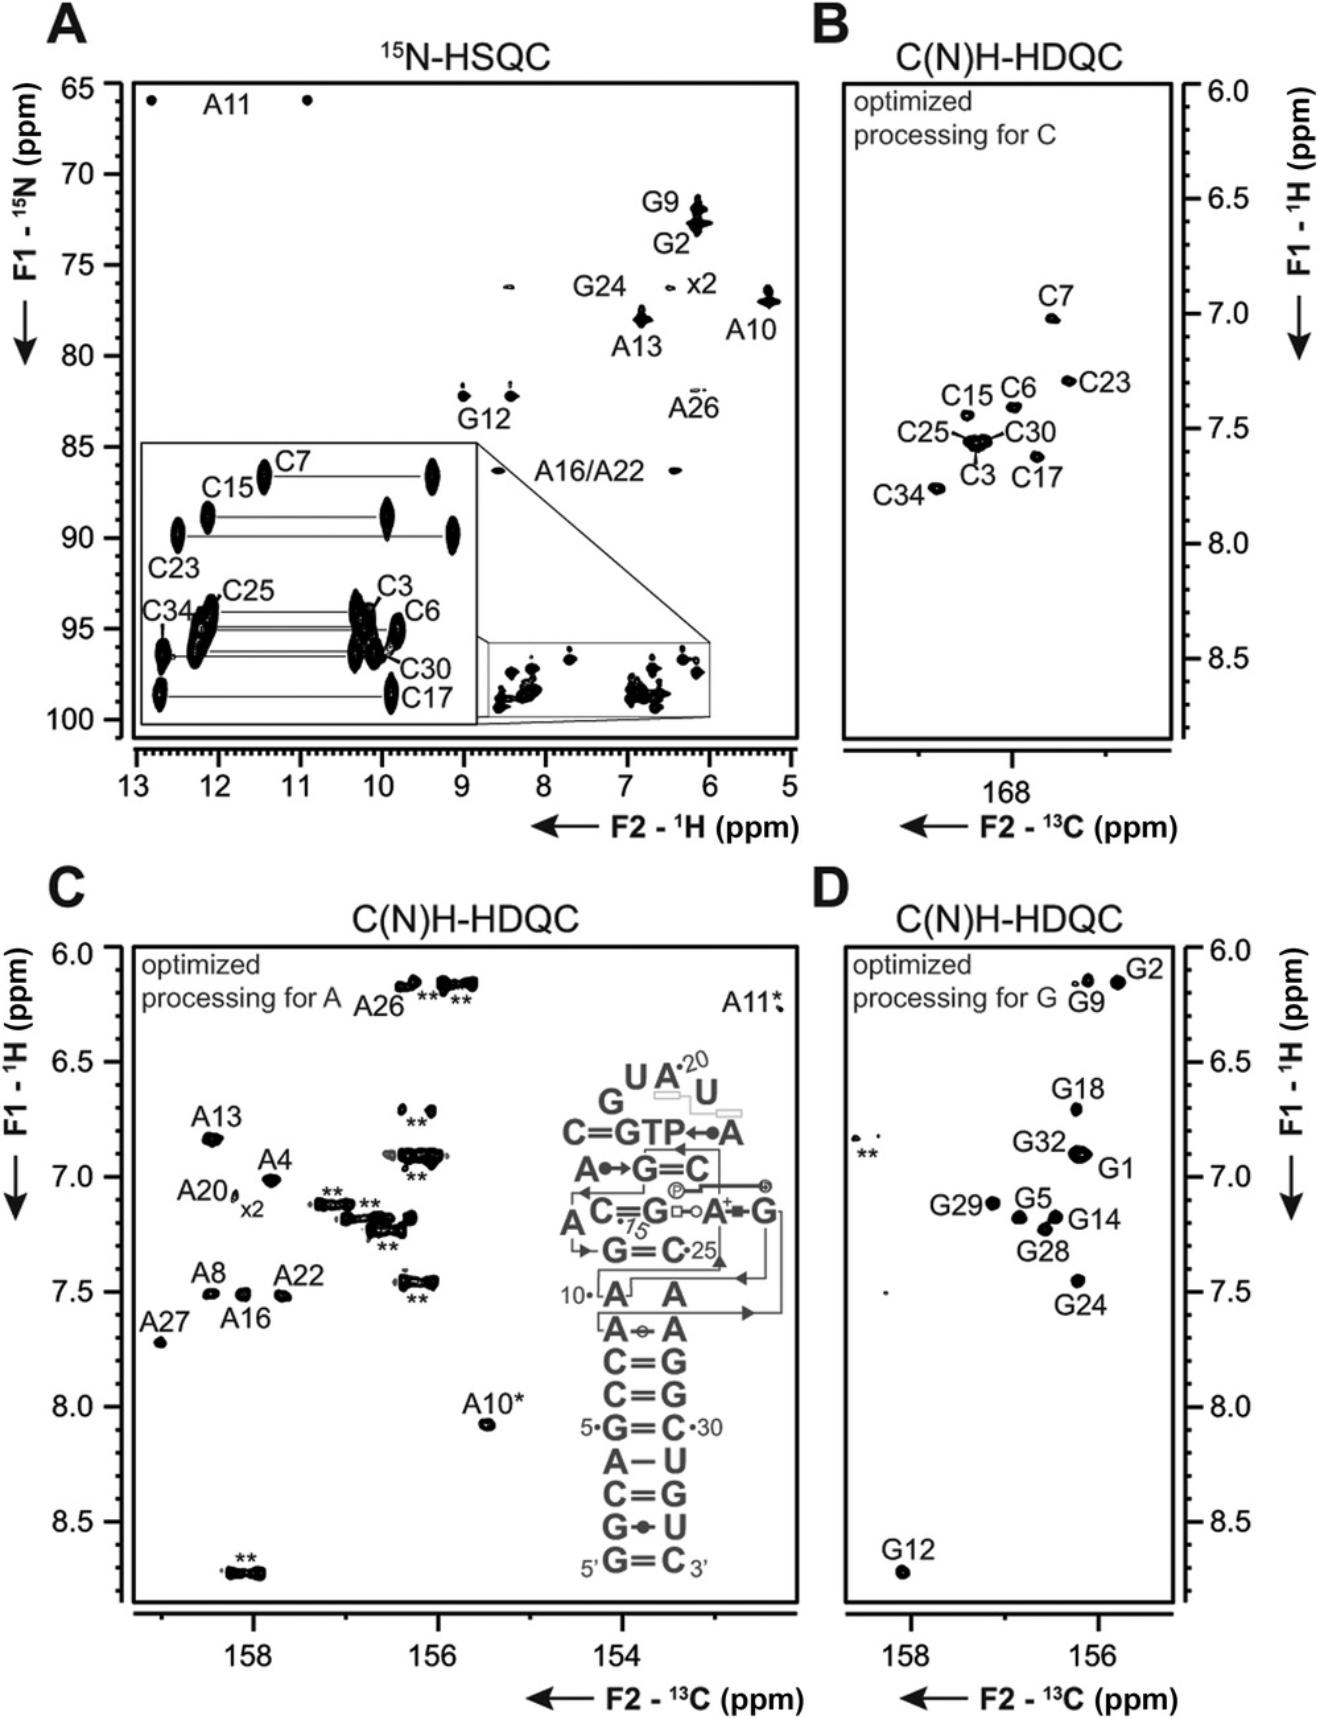
3.Record a 13C-detected 2D CN-HSQC spectrum of the amino region as described in Support Protocol 9, to optimize the CN-transfer step and the IPAP for homonuclear CC-decoupling.
4.Set up the 13C-detected C(N)H-HDQC (parameter set C_CNH_DQSP/C_CNH_IADQSP [IPAP], pulse sequence c_cnh_dqsp/c_cnh_iadqsp) experiment with optimized CN-transfer and selective pulses from the CN-HSQC experiment (Support Protocol 9).
5.Process your spectra separately for C, A, and G according to Support Protocol 8.
6.Evaluate HDQC spectra (Fig. 23B, C, and D) in combination with the CN-HSQC (Fiala & Sklenár, 2007) and 15N-HSQC spectra. For completion of resonance assignment, HNCO type experiments (for G), the TROSY relayed HCCH-COSY experiment (for A; Simon, Zanier, & Sattler, 2001), 1H,1H-NOESY experiments (mainly for C), and non-selective CN-HSQC experiments with different CN-transfer times can be acquired.
Support Protocol 9: 13C-DETECTED CN-HSQC EXPERIMENT FOR AMINO GROUPS
In order to optimize parameters for the carbon direct-detected C(N)H-HDQC experiment and to assign resonances in this experiment, an amino selective CN-HSQC experiment should be conducted. Parameters which are to be optimized are the CN-transfer time and the IPAP sequence depending on the nucleotide type of interest (G, A, or C).
Materials
-
≥0.5 mM RNA sample with 13C,15N-labeled amino group containing nucleotide of interest (G, C, or A) or uniformly 13C,15N-labeled RNA (see Basic Protocol 1)
-
NMR buffer (see recipe)
-
Other RNA specific requirements like Mg2+ ions or small molecule ligands
-
NMR tube (e.g., Shigemi)
-
NMR spectrometer equipped preferably with a z -axis gradient 13C, 15N [1H]-TXO cryogenic probe; alternatively, a z -axis gradient 1H, [13C, 15N]-TCI cryogenic probe
1.Prepare NMR spectrometer according to Support Protocol 7.
2.Load parameter set C_CON_SQSP_NH2 with pulse program c_con_sqsp_NH2.
3.Choose selective 180° pulses.
4.Optimize CN-transfer. In theory, the time for the CN-transfer equals 1/2 J CN.
To determine the time with the maximum transfer efficiency, record the first increment of this 2D CN-HSQC experiment with a high number of transients (e.g., 1,024) for several transfer times (e.g., 12-40 ms). Comparison of integrals within the different regions then yields the optimized transfer times for the respective nucleotide type (Fig. 24). Optimized transfer times that we determined for a 14-nt RNA are depicted in Table 16.
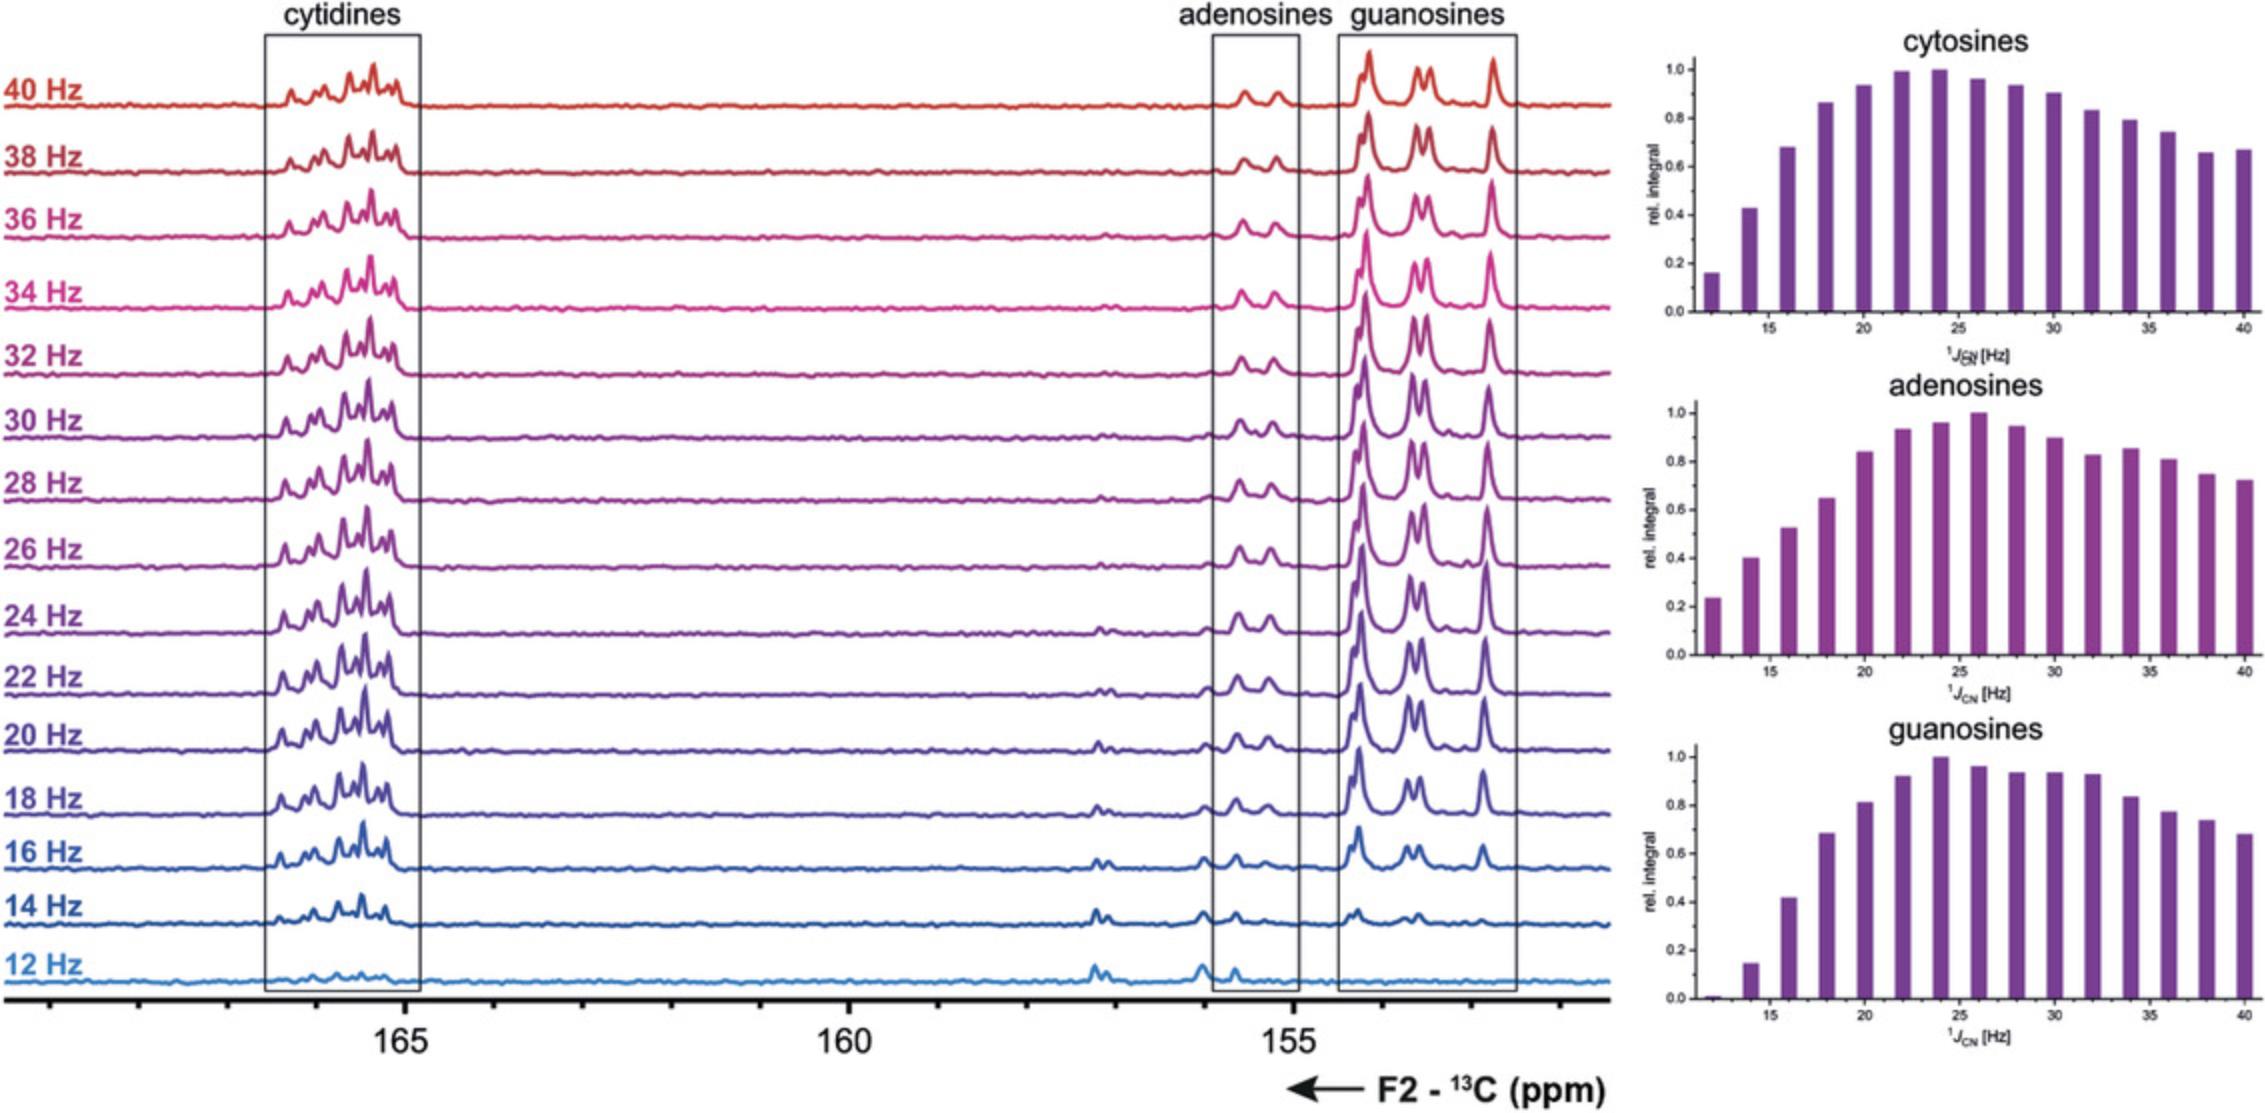
| Guanosines | Cytidines | Adenosines | |
|---|---|---|---|
| 1/21JCN | 20.8 ms | 19.2 ms | 19.2 ms |
5.Load parameter set C_CON_IASQSP_NH2 with pulse sequence c_con_iasqsp_NH2 to include the IPAP sequence for homonuclear CC-decoupling in adenosines and cytidines according to Support Protocol 8. As the 1J CC coupling constants differ in A and C from 75 to 55 Hz, respectively, best results are achieved when their correlations are recorded in separate experiments. However, it is also possible to use an IPAP delay with an intermediate 1J CC coupling constant of 65 Hz (see also Table 13 in Support Protocol 8). Use the 180° selective pulses as in the non-IPAP version. We use Q5 shapes for the selective 90° carbon pulse and in our hands 600 µs works well at 800 MHz. Set offset for the off-resonant 13C-pulse (Table 13 in Support Protocol 8). Here, we use −11,000 Hz at 800 MHz.
6.Process spectra as described in Support Protocol 8 while using the correct 1J CC coupling constants for C and A even if an intermediate IPAP delay was used. If no homonuclear coupling is present as is the case for G, spectra have to be processed differently as described in Support Protocol 8 (Fig. 25).
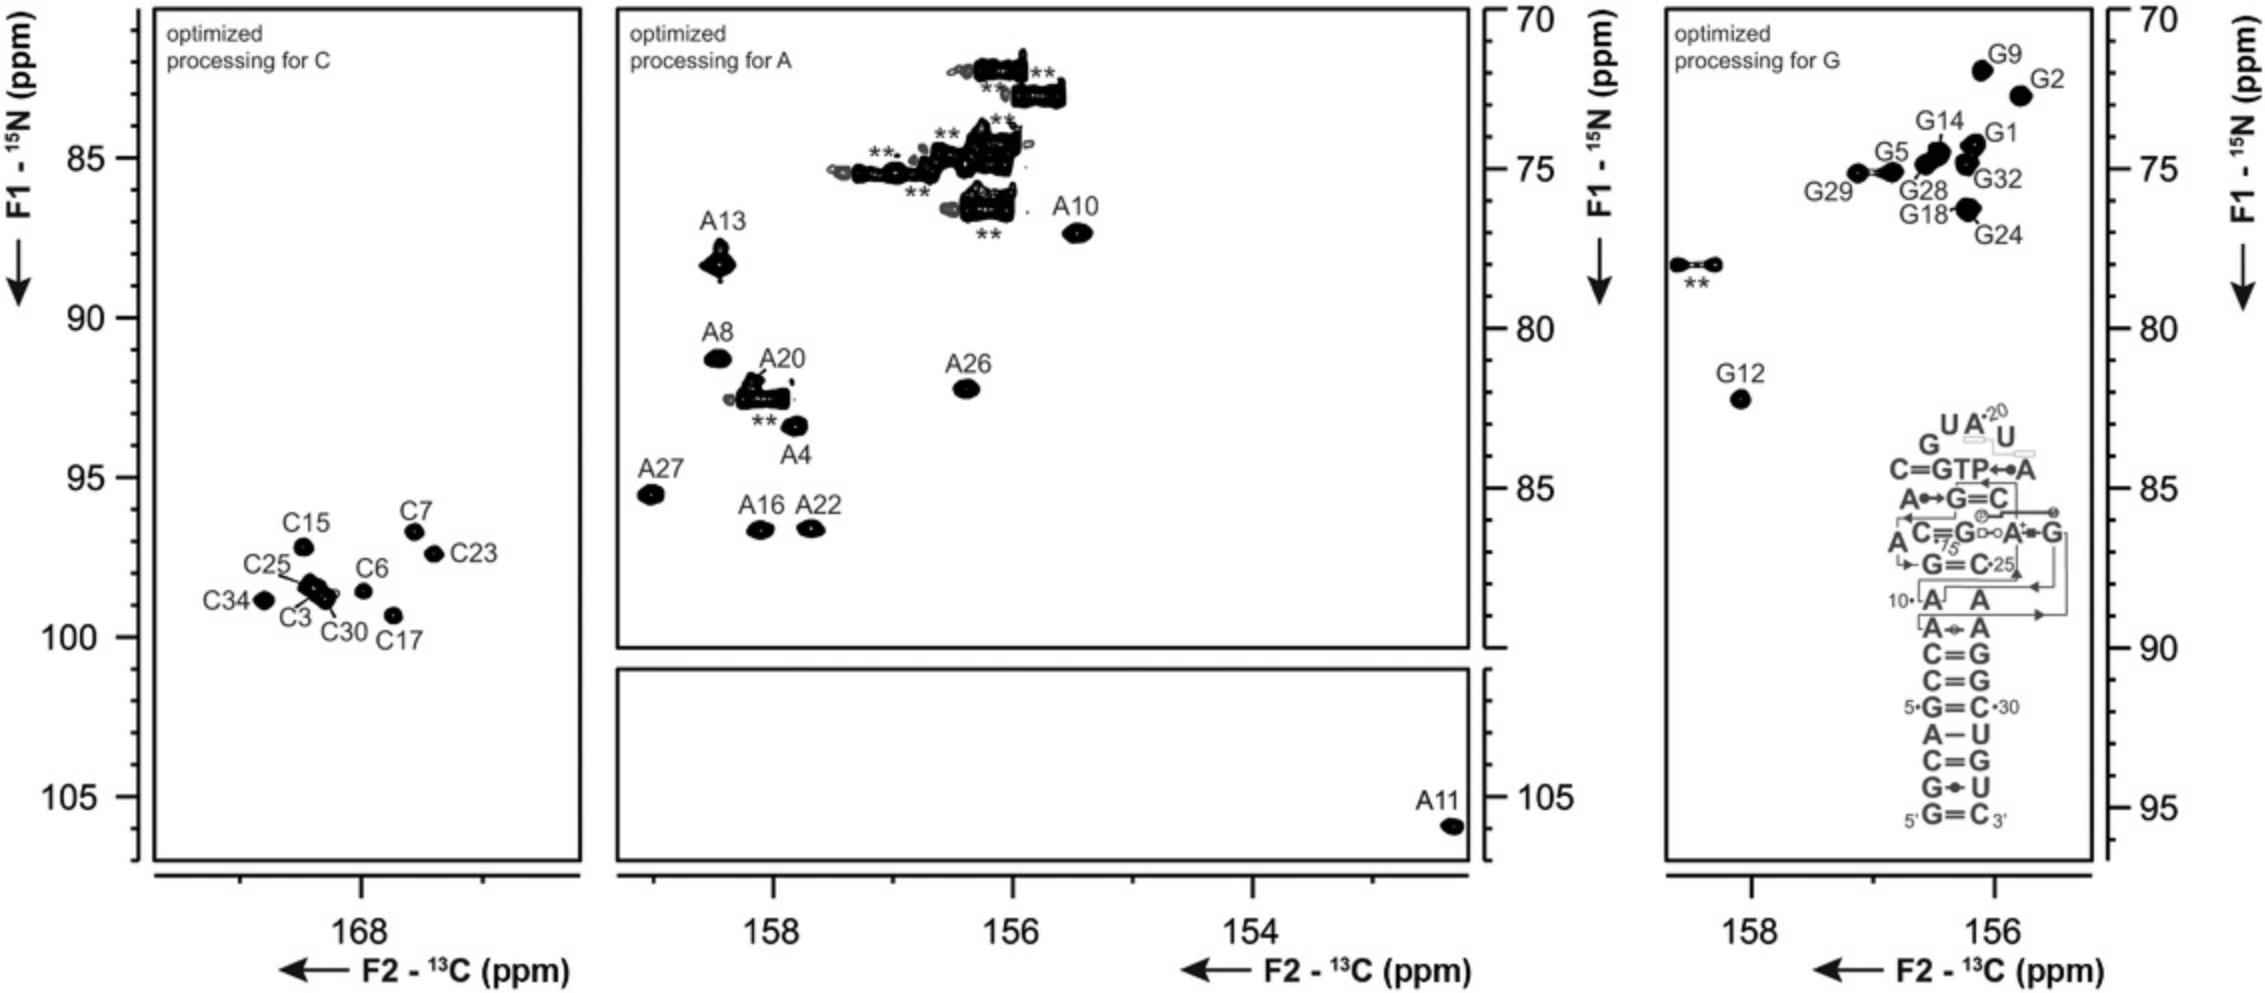
Basic Protocol 6: 13C-DETECTED “AMINO”-NOESY EXPERIMENT
Due to the inherently low proton density, structural characterization of RNA often suffers from a low number of inter-residual long-range nuclear Overhauser effect (NOE) contacts. Imino and amino protons are often involved in exchange processes that do not allow their detection, which in turn reduces the number of available NOE contacts even further. In amino groups, this exchange process is a restricted rotation around the C-NH2 bond, which is often in an intermediate exchange regime on the NMR timescale. This broadens the signals beyond detectability as soon as the amino proton coherence is in the transverse plane. The “amino”-NOESY experiment partly removes this effect by moving away from 1H-detection towards 13C direct detection and by spin-locking the 1H coherence in a HN-TOCSY transfer (Fig. 26). With this experiment, additional NOE contacts can be determined which are not accessible using any other conventional NOESY experiment. Especially, inter-residual H1′-to-amino-group contacts are of high interest and can improve RNA structure calculations where a limited number of NOE contacts is available. We will describe how to set up two variants of this “amino”-NOESY experiment, one with and one without a 13C filter, in this basic protocol. The experiment with 13C filter only selects for NOE contacts to 13C-bound protons, while the other one is not selective.
![Details are in the caption following the image (A) Pulse scheme of the “amino”-NOESY experiment with optional <sup>13</sup>C filter (red) and IPAP scheme for homonuclear decoupling. Narrow filled bars represent 90° pulses, rectangular 180° pulses are shown as wide open bars. All pulse lengths are at 800 MHz. Gradients and selective 180° pulses (<sup>13</sup>C Q3 400 μs, on- or off-resonant and <sup>15</sup>N Reburp [Geen & Freeman, 1991] 1.2 ms) are shown as semi-elliptic unfilled shapes. Semi-elliptic narrow filled shapes represent selective 90° pulses (<sup>13</sup>C Q5 600 μs, on resonant). The default phase is x. <sup>15</sup>N nuclei were decoupled using asynchronous GARP4 sequences (Shaka et al., 1985) during acquisition. Gradient pulses were applied for 1 ms with smoothed square amplitude (SMSQ10.100) and 100% gradient strength corresponds to 53 G/cm. Pulse phases, delays, and gradient strengths are as follows: φ<sub>1</sub> = x, -x, φ<sub>2</sub> = (4)x, (4)(-x), φ<sub>3</sub> = (2)x, (2)(-x), φ<sub>4</sub> = (8)x, (8)(-x), φ<sub>rec</sub> = x, (2)(-x), x, -x, (2)x, (2)(-x), (2)x, -x, x, (2)(-x), x, -x, (2)x, -x, x, (2)(-x), (2) x, (2)(-x), x, -x, (2)x, -x, Δ = 1/2<sup>1</sup>J<sub>CN</sub> = 19.23 ms, Δ<sub>2</sub> = 1/<sup>1</sup>J<sub>CH</sub> = 6.25 ms, t<sub>m</sub> = 150 ms, T = 1/4<sup>1</sup>J<sub>CC</sub> = 4.5 ms (cytidine) or 3.3 ms (adenosine) and 35% (g<sub>1</sub>). The DIPSI-3 scheme was applied for 7.8 ms at 3.6 kHz. (B) Schematic magnetization transfer pathway for the “amino”-NOESY experiment with optional <sup>13</sup>C filter. Scalar coupling constants and the detected coherences are annotated. If not stated otherwise the transfer method is INEPT. The figure has been adapted from Schnieders et al., 2019. NOESY, nuclear Overhauser effect spectroscopy; IPAP, in-phase anti-phase; INEPT, insensitive nuclei enhancement by polarization transfer.](https://static.yanyin.tech/literature_test/cpnc116-fig-0026-m.jpg)
Materials
-
≥0.5 mM RNA sample with 13C,15N-labeled amino group containing nucleotide of interest (G, C, or A) or uniformly 13C,15N-labeled RNA (see Basic Protocol 1)
-
NMR buffer (see recipe)
-
Other RNA specific requirements like Mg2+ ions or small molecule ligands
-
NMR tube (e.g., Shigemi)
-
NMR spectrometer equipped preferably with a z -axis gradient 13C, 15N [1H]-TXO cryogenic probe; alternatively a z -axis gradient 1H, [13C, 15N]-TCI cryogenic probe
1.Conduct steps 1-3 from Basic Protocol 5.
2.Load parameter set C_NOESYIASQSPCPXF with pulse sequence c_noesyiasqspcp or if only contacts to 13C-bound protons are desired, load parameter set C_NOESYIASQSPCPXF with pulse sequence c_noesyiasqspcpxf.
3.Set selective pulses, CN-transfer delay, and IPAP delay as determined in the CN-HSQC experiment.
4.Set NOESY mixing time (D8).
5.Set HN-TOCSY pulses.
6.Set carrier frequency and spectral window in the indirect dimension depending on the NOE contacts of interest.
7.Set number of transients and number of points.
8.Start measurement and check whether the S/N is sufficient after a couple of increments.
9.Process spectra according to Support Protocol 8.
10.Assign NOESY spectrum (Fig. 27) using CN-HSQC, 15N-HSQC, 1H,1H-NOESY, and HNCO-type spectra.
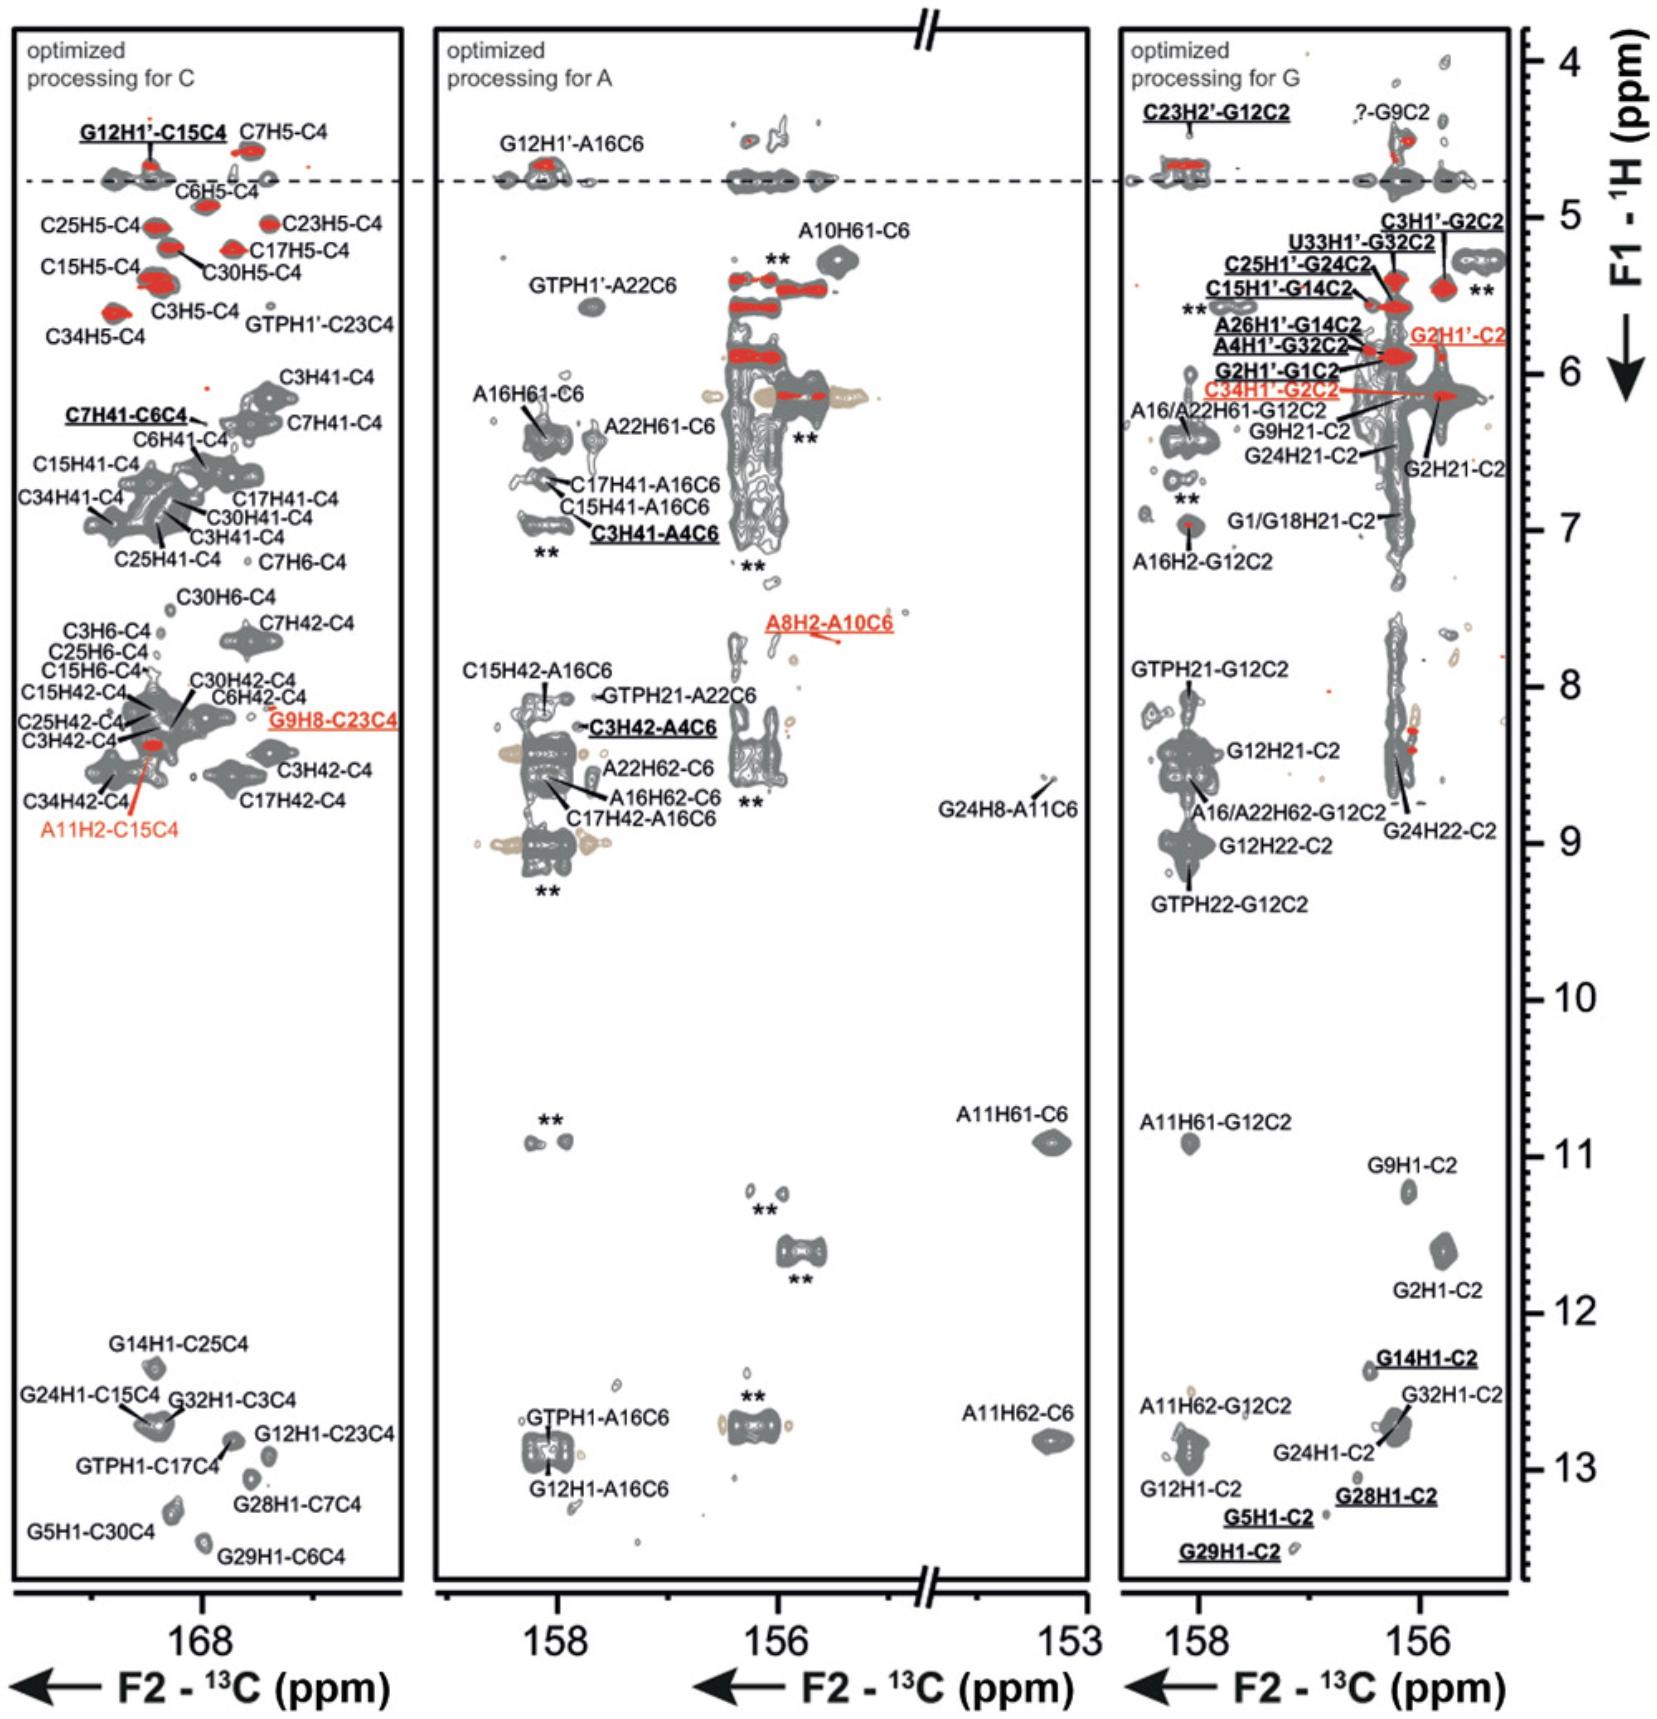
11.Include the newly determined NOE contacts in a structure calculation.
Basic Protocol 7: 15N-DETECTED BEST-TROSY EXPERIMENT
Despite the disadvantage in loss of sensitivity, 15N-direct detection can become interesting due to the favorable relaxation behavior of 15N-nuclei when it comes to molecules with a large rotational correlation time (Fig. 28). Therefore, several 15N-detected HN correlation experiments were tested on RNA and the effect of the molecular size on sensitivity, resolution, and relaxation behavior was investigated. The most sensitive 15N-detected HN correlation experiment, the 15N-detected BEST-TROSY experiment, is described in this basic protocol.
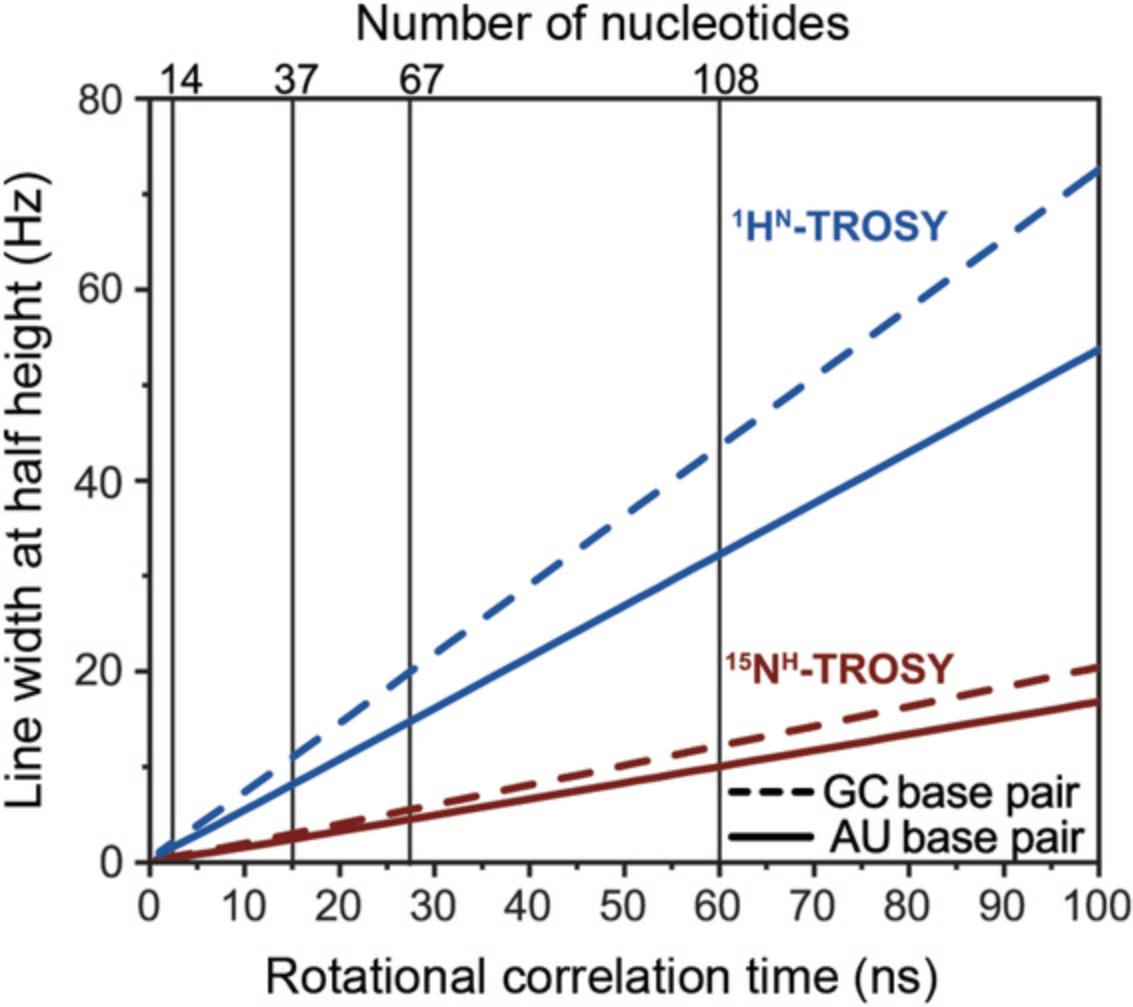
Materials
-
≥0.5 mM RNA sample with 15N-labeled imino group containing nucleotide of interest (G or U) or uniformly 15N-/ 13C,15N-labeled RNA (see Basic Protocol 1)
-
NMR buffer (see recipe)
-
Other RNA specific requirements like Mg2+ ions or small molecule ligands
-
NMR tube (e.g., Shigemi)
-
NMR spectrometer equipped preferably with a z -axis gradient 13C, 15N [1H]-TXO cryogenic probe; alternatively, a z -axis gradient 1H, [13C, 15N]-TCI cryogenic probe
1.Prepare spectrometer according to Support Protocol 7.
2.Record a 1H-detected 1H,15N-BEST-TROSY reference spectrum in order to check the quality of the NMR sample and to determine carrier frequencies and spectral windows for the 15N-detected BEST-TROSY experiment.
3.Load parameter set N_HNBTROSY_F2IG_TS21 with pulse sequence n_hnbtrosy_f2ig_ts21.
4.If the sample is not 13C-labeled, leave out the carbon decoupling.
5.Set shapes and lengths for the selective pulses.
6.Set carrier frequencies and spectral windows as determined in the 1H-detected BEST-TROSY experiment. Note that the resolution in the direct dimension should be as high as possible due to the very sharp lines in the 15N-dimension.
7.Set number of transients.
8.Start experiment and check whether the S/N is sufficient in the first increment (Fig. 29).
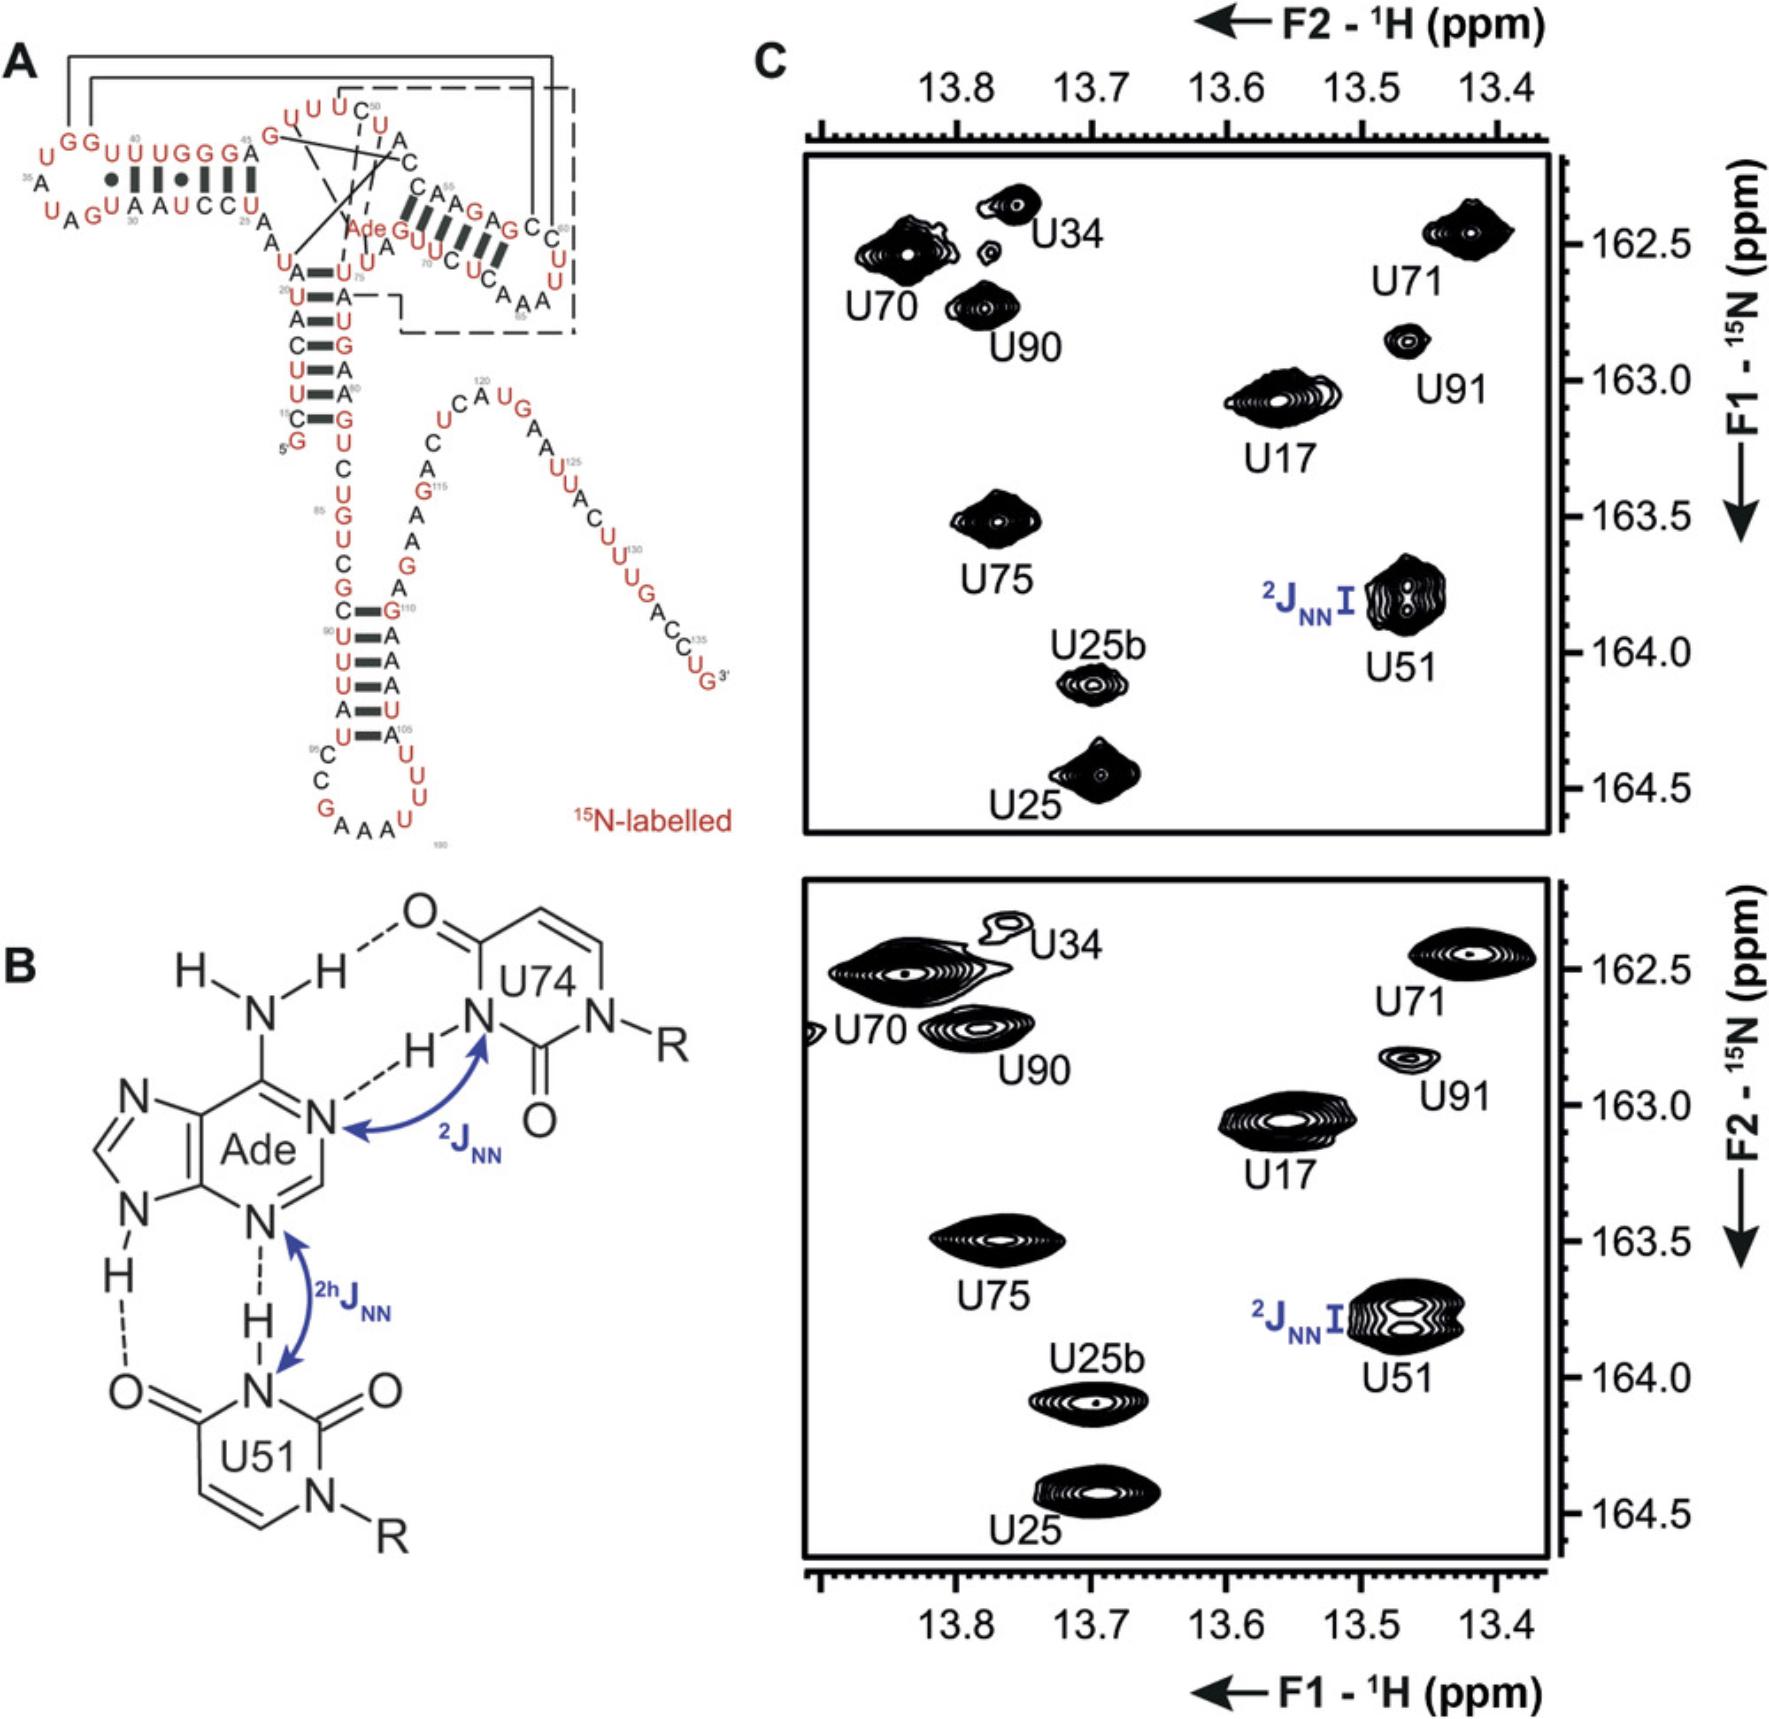
REAGENTS AND SOLUTIONS
Autoclave water prior to preparation of the respective solution. Sterile filter all solutions and buffers.
Agarose gel solution
- ddH2O
- 1× TAE
- 1%-1.5% (w/v) agarose
- Store at room temperature for up to 1 year.
About 0.5 L is sufficient for one gel.
Coomassie staining solution
- 10% (v/v) ethanol
- 5% (v/v) acetic acid
- 0.0025% (w/v) Coomassie brilliant blue G250
- 0.0025% (w/v) Coomassie brilliant blue R250
- Store at room temperature for up to 1 year.
1 L is sufficient for 10-20 gels.
DNA loading buffer, 5×
- ddH2O
- 40% (v/v) glycerol
- 0.1% bromophenol blue
- 0.1% xylene cyanol
- Store at room temperature for up to 1 year.
1 ml is sufficient for 100-200 gel samples.
DNA running buffer (1× TAE)
- ddH2O
- 40 mM Tris base
- 20 mM acetic acid
- 10 mM EDTA
- Mix and adjust pH to 8.0.
- Store at 4°C for up to 1 year.
- About 0.5 L is sufficient for one gel.
Denaturing PAGE gel solution
- ddH2O
- 1× TBE
- 8%-20% (v/v) acrylamide (Carl Roth, cat. no. A124.2)
- 7 M urea
- To start polymerization add:
- 0.1% (w/v) ammonium persulfate (APS)
- 0.1% (v/v) tetramethylethylenediamine (TEMED; Carl Roth, cat.no. 2367.2)
- Store at 4°C for up to 1 year.
About 10 ml is sufficient for one gel.
Denaturing PAGE running buffer (1× TBE)
- ddH2O
- 91 mM Tris base (Thermo Fisher Scientific, cat. no. BP1525)
- 2.7 mM EDTA (Carl Roth, cat.no. CN06.3)
- 89 mM boric acid (Merck, cat.no. B0394)
- Store at 4°C for up to 1 year.
About 0.5 L is sufficient for one PAGE.
Denaturing RNA loading buffer
- 90% (v/v) formamide (Merck, cat. no. 47671)
- 10% (v/v) 10× TBE
- 0.1% bromophenol blue
- 0.1% xylene cyanol
- Store at room temperature for up to 1 year.
1 ml is sufficient for 100-200 gel samples.
LB medium
- 5 g/L yeast extract
- 10 g/L tryptone
- 5 g/L NaCl
- Autoclave 15 min at 121°C to sterilize. Allow to cool before making additions, such as antibiotics, if desired.
- Store at room temperature for up to 1 year without antibiotics.
Native PAGE gel solution
- ddH2O
- 1× TA
- 10% (v/v) acrylamide
- To start polymerization add:
- 0.1% (w/v) ammonium persulfate (APS)
- 0.1% (v/v) tetramethylethylenediamine (TEMED)
- Store at 4°C for up to 1 year.
- About 10 ml is sufficient for one gel.
Native PAGE gel solution for DNA
- ddH2O
- 1× TAE
- 8%-15% (v/v) acrylamide
- To start polymerization add:
- 0.1% (w/v) ammonium persulfate (APS)
- 0.1% (v/v) tetramethylethylenediamine (TEMED)
- Store at 4°C for up to 1 year.
10 ml is sufficient for one gel.
Native PAGE running buffer (1× TA)
- ddH2O
- 50 mM tris acetate
- 100 mM sodium acetate
- pH 8.2
- Store at 4°C for up to 1 year.
About 0.5 L is sufficient for one PAGE.
NMR buffer
- ddH2O
- 25 mM potassium phosphate buffer (K2HPO4/KH2PO4; Carl Roth, cat. no. P749.2/3904.1)
- 50 mM KCl (optional)
- MgCl2 (depending on folding protocol; optional)
- pH 6.2
- Store at room temperature for up to 1 year.
20-100 ml is sufficient for one RNA.
SDS resolving gel
- 8%-15% (v/v) acrylamide/bisacrylamide (29:1)
- 0.375 M Tris·HCl
- 0.1% (w/v) APS
- 0.1%(v/v) TEMED
- Mix and adjust pH to 8.8
- Store at 4°C for up to 1 year.
About 10 ml is sufficient for one gel.
SDS running buffer
- 25 mM Tris
- 250 mM glycine
- 1% (v/v) SDS
- Store at room temperature for up to 1 year.
0.5 L is sufficient for one gel.
SDS sample buffer, 2×
- 0.25 M Tris·HCl
- 4% (w/v) SDS
- 20% (v/v) glycerol
- 10% (v/v) 2-mercaptoethanol
- 0.25% (w/v) bromphenol blue
- Mix and adjust pH to 6.8
- Store at −20°C for up to 1 year.
1 ml is sufficient for 100-200 gel samples.
SDS stacking gel
- 5% (v/v) acrylamide/bisacrylamide (29:1)
- 0.25 M Tris·HCl
- 0.1% (w/v) APS
- 0.1%(v/v) TEMED
- Mix and adjust pH to 6.8
- Store at 4°C for up to 1 year.
About 10 ml is sufficient for one gel.
T4 RNA Ligase 2 (Rnl2) buffer A
- 250 mM NaCl
- 50 mM Tris·HCl
- 10% (w/v) sucrose
- 0.1% (v/v) Triton X-100
- Protease inhibitor cocktail (EDTA free)
- Mix and adjust pH to 7.5.
- Filter and degas. Add 1 mM DTT (reducing agent) directly prior to use; 1 L is sufficient for one purification.
- Store at room temperature for up to 2 weeks.
T4 RNA Ligase 2 (Rnl2) buffer B
- 250 mM NaCl
- 50 mM Tris·HCl
- 10% (v/v) glycerol
- 500 mM imidazole
- 0.05% (v/v) Triton X-100
- Mix and adjust pH to 8.
- Filter and degas. Add 1 mM DTT (reducing agent) directly prior to use; 0.5 L is sufficient for one purification.
- Store at room temperature for up to 2 weeks.
T4 RNA Ligase 2 (Rnl2) buffer C
- 100 mM KCl
- 20 mM Tris·HCl
- 70 mM (NH4)2SO4
- 0.2 mM EDTA
- Mix and adjust pH to 7.7.
- Filter and degas; 1 L is sufficient for one purification.
- Store at room temperature for up to 2 weeks.
T7 RNAP buffer A
- 400 mM NaCl
- 50 mM Tris·HCl
- 20 mM imidazole
- Protease inhibitor cocktail (EDTA free)
- Mix and adjust pH to 8.1.
- Filter and degas.
- Store at 4°C for 6 months.
- Add 5 mM 2-mercaptoethanol (reducing agent) directly prior to use; 2 L is sufficient for one purification.
T7 RNAP buffer B
- 400 mM NaCl
- 50 mM Tris·HCl
- 500 mM imidazole
- Protease inhibitor cocktail (EDTA free)
- Mix and adjust pH to 8.1. Filter and degas.
- Store at 4°C for 6 months.
- Add 5 mM 2-mercaptoethanol (reducing agent) directly prior to use; 1 L is sufficient for one purification.
T7 RNAP buffer C
- 150 mM NaCl
- 20 mM Na2HPO4/NaH2PO4
- 1 mM EDTA
- Mix and adjust pH to 7.7. Filter and degas.
- Store at 4°C for 6 months.
- Add 5 mM DTT (reducing agent) directly prior to use; 2 L is sufficient for one purification.
TB medium
- 24 g/L yeast extract
- 12 g/L tryptone
- 4 ml/L glycerol
- 17 mM KH2PO4
- 72 mM K2HPO4
- Mix and adjust pH to pH 7.4.
- Autoclave 15 min at 121°C to sterilize. Allow to cool before making additions, such as antibiotics, if desired.
- Store at room temperature for up to 1 year without antibiotics.
YIPP buffer A
- 50 mM Tris·HCl
- 300 mM NaCl
- 10 mM imidazole
- Mix and adjust pH to 8.0.
- Store at 4°C for 6 months.
- Filter and degas. Add 1 mM DTT (reducing agent) directly prior to use; 1 L is sufficient for one purification.
YIPP buffer B
- 50 mM Tris·HCl
- 300 mM NaCl
- 500 mM imidazole
- Mix and adjust pH to 8.0.
- Store at 4°C for 6 months.
- Filter and degas. Add 1 mM DTT (reducing agent) directly prior to use; 0.5 L is sufficient for one purification.
YIPP buffer C
- 25 mM K2HPO4/KH2PO4 (e.g., Carl Roth, cat. no. P749.2/3904.1)
- 150 mM KCl
- Mix and adjust pH to 7.2.
- Store at room temperature for up to 1 year.
- Filter and degas. Add 1 mM DTT (reducing agent) directly prior to use; 1 L is sufficient for one purification.
YIPP buffer D
- 50 mM Tris·HCl
- 100 mM KCl
- 0.1 mM EDTA
- 50% (v/v) glycerol
- Mix and adjust pH to 8.0.
- Store at room temperature for up to 2 weeks.
- Filter and degas. Add 1 mM DTT (reducing agent) directly prior to use; 2 L is sufficient for one purification.
COMMENTARY
Background Information
Because this protocol covers a wide range of different methods from sample preparation to NMR experiments, the different historical backgrounds will be briefly summarized in the following sections.
Preparation of 13C,15N-labeled RNA
13C,15N-isotope labeling is usually inevitable for NMR structure determination and often also required if functional studies are conducted. There are two methods, which are used for these purposes, namely solid phase synthesis and in vitro transcription using T7 RNA polymerase. Solid phase synthesis requires phosphoramidites and was first conducted to yield an isotope-labeled RNA in 1994 using 13C-labeled building blocks (Quant et al., 1994). As this method is limited in molecular size and needs a costly apparatus, the in vitro transcription with T7 RNA polymerase represents a commonly used alternative. This enzymatic method can be conducted using 13C,15N-labeled rNTPs, which was first reported in 1992 (Batey, Inada, Kujawinski, Puglisi, & Williamson, 1992; Nikonowicz et al., 1992). The isotope-labeled rNTPs are commercially available nowadays.
Synthesis of selectively labeled RNA
Due to the poor chemical diversity in building blocks, the increased amount of resonances and the signal broadening, NMR spectra of RNAs >50 nt usually exhibit severe resonance overlap. To avoid this, methods to segmentally or selectively label RNAs are being developed either using solid phase synthesis or enzymatic methods. As reported in 1996, the segmental deuterium labeling of an RNA via solid phase synthesis was crucial for the assignment of the respective NMR spectra (Földesi, Yamakage, Nilsson, Maltseva, & Chattopadhyaya, 1996). However, the size limitation brought along with this approach can be negotiated and/or avoided by applying enzymatic methods. Segmental isotopic labeling with T4 DNA ligase was first performed in 1996 and yielded a partially 15N-labeled RNA (Xu, Lapham, & Crothers, 1996). To improve this approach to an extent where the site specific labeling or modification of an RNA is possible, in 2018 a chemo-enzymatic pathway was used to implement 13C,15N-labeled nucleosides as well as nucleosides provided with photoactivatable groups and azobenzene (Keyhani et al., 2018).
Heteronuclear-detected NMR experiments for RNA
Heteronuclear-detected NMR experiments are nowadays possible as there has been a constant development in cryogenic probes (Kovacs, Moskau, & Spraul, 2005) as well as probes optimized for heteronuclear detection schemes. The era of heteronuclear-detected multidimensional NMR experiments for RNA started in 2007 with two almost simultaneously published articles by Farès, Amata, and Carlomagno (2007) and by Fiala and Sklenár (2007). Both works develop NMR experiments for the chemical shift assignment of the quaternary carbons in the nucleobases of RNA. In 1H-detected NMR experiments these resonances are only accessible employing many transfer steps, which in turn reduces sensitivity, particularly for larger RNA molecules. Farès et al. (2007) developed a set of 1H-excited and 13C-detected NMR experiments with reduced transfer times for the carbon chemical shift assignment of the nucleobase. Furthermore, they revealed a correlation of several nucleobase carbon chemical shifts to the structural context (base pairing, stacking) of the respective nucleotide. Fiala and Sklenár (2007) developed a set of experiments for the measurement of J CC coupling constants. Furthermore, they presented a 13C-excited and 13C-detected 13C,15N-HSQC experiment that can be used for an almost complete resonance assignment of the nucleobase through a correlation of the C-N fragments, while completely evading long transfer times. Therefore, this experiment is commonly applied for the nucleobase assignment of RNA (Wolter et al., 2019).
Critical Parameters
Basic Protocol 1: Preparation of isotope-labeled RNA
Probably the most important parameter in the production of RNA is to work with very clean equipment and reagents to avoid RNase contamination. If possible, sterile products should be used. Wherever this is not feasible, reagents, consumables, and flasks should be autoclaved or treated with 0.1% DEPC solution. Along the same lines, all home-made or purchased enzymes should not only be tested for functionality but also for RNase contamination on a test scale prior to usage. However, degradation is not only a problem during the sample preparation but also afterwards. Thus, RNAs should be stored at low temperatures (4°C) and checked for degradation in the case of long storage times. Furthermore, when the preparation of an isotope-labeled RNA is planned, the scale-up of the transcription reaction should first be conducted using unlabeled rNTPs to check whether the final yield is sufficient.
Basic Protocol 2: Preparation of site-specific labeled RNAs
In addition to the critical parameters listed above for Basic Protocol 1, the synthesis of 3′,5′-bisphosphate nucleosides for Basic Protocol 2 requires the corresponding labeled or modified starting material. Here the purity and integrity of each reagent should be checked prior to use via NMR measurements and mass spectra. Furthermore, the laboratory should be equipped for working under a protective atmosphere as the synthesis of the nucleoside 3′,5′-bisphosphate has to be performed with the exclusion of water.
Basic Protocols 3–7: Heteronuclear-detected NMR experiments on RNA
As the major drawback in heteronuclear-detected NMR experiments is the low sensitivity, it is very important to conduct the experiments under the best possible conditions. A parameter which can be easily controlled is the RNA concentration, which should be as high as possible, as the S/N scales directly with the sample concentration. In addition, the NMR spectrometer that is used for heteronuclear detection should at least be equipped with a cryogenic probe and best with a cryogenic probe optimized for heteronuclear detection. Along the same lines, the setup of the spectrometer should be always performed thoroughly, as the sensitivity drops with inaccurate settings.
Troubleshooting
For troubleshooting the protocols contained in this article, see Table 17 (Support Protocol 2), Table 18 (Support Protocols 3, 4, and 6), Table 19 (Alternate Protocol 2), Table 20 (Basic Protocol 2), Table 21 (Support Protocol 5), and Table 22 (Basic Protocols 3, 4, 5, 6, and 7).
| Problem | Possible reasons | Solution |
|---|---|---|
| Product smear on the analytical gel/no clean band on the analytical gel |
Too much template used Many side products |
Use less template or dilute template (1:10; 1:100; 1:1000) Use fewer cycles |
| Low product yield |
Specificity of primer binding is low GC rich sequence DNA is too long or too complex |
Optimize annealing temperature Optimize MgCl2 concentration (purchased PCR buffer may contain MgCl2 already) Try GC buffer for GC rich sequences, long templates, or complex structures |
| No product at all | PCR does not work |
Check primer and template sequences Check PCR program for the cycler and order of steps |
| Problem | Possible reasons | Solution |
|---|---|---|
| Cells grow slowly/poorly |
Wrong medium composition Initial OD significantly lower than 0.1 Cryostock cells dead Cold medium might slow cell growth Wrong plasmid/antibiotic Insufficient aeration |
Check recipe Check OD at beginning Test expression on small scale (5 ml) and new transformation, if necessary Preheat medium to expression temperature Check plasmid (sequencing) Increase shaking, add antifoaming agent |
| Low protein yield despite good cell growth |
No protein expression Protein degradation/export Incomplete cell lysis |
Check expression vector/IPTG stock, check aeration or foaming of medium Lower expression time/temperature Extend homogenization cycles |
| No protein after column (Ni-NTA or SEC) |
Protein did not bind to column Wrong buffer composition (buffers swapped) |
Regenerate column, check flowthrough Check recipe/prepare new buffers |
| Bad separation on column or protein band in flowthrough |
Column binding capacity exceeded Column material old/used Equilibration step not done thoroughly Broken column |
Use column with larger bed volume Regenerate column Perform all equilibration steps as described in the protocol Regenerate column/use a new one |
| Protein band runs high in SDS gels | Aggregation/dimerization |
Check if reducing agent was added to buffer Ensure temperature is at 4°C |
| Protein inactive/unstable after storage |
Wrong pH or salt concentration/no glycerol in storage buffer Protein was stored too long at room temperature |
Check recipe/measure pH Store at −20°C |
| Problem | Possible reasons | Solution |
|---|---|---|
| Slow flowthrough per centrifugation step | High RNA concentration |
Increase temperature to 15°C during centrifugation and mix solution over membrane with a pipet In case of further problems see Troubleshooting in the device manual |
| Problem | Possible reasons | Solution |
|---|---|---|
| Ligation efficiency is low |
Too low/high ATP concentration Low 3′,5′-bisphosphate concentration T4 RNA Ligase 1 is inactive |
Adjust ATP concentration to 1 mM Use larger excess of 3′,5′-bisphosphate Verify ligase activity; purchase a new T4 RNA Ligase 1 stock, if necessary |
| Oxidation with NaIO4 does not work |
DTT was not completely removed NaIO4 is inactive |
Remove DTT by centrifugal concentrator Prepare a fresh NaIO4 solution from a new stock |
| RNA degradation during splint ligation with T4 RNA Ligase 2 |
Degradation is construct dependent RNase contamination |
Check solutions and components for an RNase contamination |
| RNA degradation during DNase digestion | RNA digestion by DNase | Shorter incubation time, RNase contamination of DNase stock |
| Problem | Possible reasons | Solution |
|---|---|---|
| 3′,5′-bisphosphate product is not detectable in mass spectrum after HPLC purification |
Byproducts are not separated completely The reaction temperature was not constant Reaction apparatus was not dry Diphosphoryl chloride is hydrolyzed |
Perform a test ligation, only 3′,5′-bisphosphate nucleosides will be incorporated by T4 RNA Ligase 1 Make sure reaction temperature is −12°C ± 2°C Heat reaction apparatus (drying oven) Use a new stock of diphosphoryl chloride or try a larger excess (15 equivalents) |
| Problem | Possible reasons | Solution |
|---|---|---|
| IPAP decoupling is not working |
Pulse length incorrect Carrier frequency offset incorrect Delay incorrect Processing |
Check with Table 13, calculate band width of excitation Recheck chemical shifts of off- and on-resonant 13C nuclei. Do pulses hit all desired nuclei? Recheck 1JCC coupling; if that is correct, measure 1JCC coupling in a coupled 13C-1D Sometimes AP spectrum needs scaling with regard to IP spectrum; change scaling factor and see whether the result improves |
| Insufficient S/N |
NMR spectrometer not sensitive enough for 13C detection General settings incorrect Experiment settings incorrect RNA concentration not sufficient |
Change to a spectrometer with higher sensitivity for 13C nuclei Check general set up and run a CN-HSQC experiment to test the sensitivity Recheck all delays and pulses; record the first increment with a high number of transients (e.g., 2,048) and check for signal Increase RNA concentration, if possible; otherwise increase number of transients and if this is not feasible, the experiment might not be sensitive enough for the current experimental set up |
Understanding Results
Basic Protocol 1
The analysis of the test transcriptions demonstrates which condition is ideal for the RNA to be transcribed at. The respective PAGE gel should show a band with the size of the target RNA and optimization should lead to a maximum of band intensity. It is favorable to optimize the byproducts to a low band intensity albeit it is not essential in case of eventual purification by HPLC or preparative PAGE (Basic Protocol 1 and Alternate Protocol 1). The transcription conditions have to result in a sharp band for the target RNA without any byproducts if the fast purification via centrifugal concentrator is used (Alternate Protocol 2). The preparative transcription and purification should finally yield 60 to 300 nmol in about 300 µl, depending on the type of labeling and the RNA sequence.
Support Protocol 1
The concentration of extracted DNA plasmid can be easily quantified via UV/vis absorption at 260 nm. Because the isolation procedure of plasmid DNA from bacterial cells can be performed with a highly optimized commercially available kit, the expected yields can range from 2 to 8 mg DNA per liter LB medium. Variability in the yield can occur based on the copy number of the specific plasmid used and the total amount of cells grown. The efficiency of the restriction digestion, which is analyzed visually via agarose gel, can be expected to give quantitative amounts of linearized plasmid. With careful execution, only ∼5% to 10% of DNA will be lost in the subsequent extraction.
Support Protocol 2
The exact amount of DNA after a successful preparative PCR is not determinable because the DNA must not be purified for further transcription reactions. But if necessary, it is possible to estimate the amount of DNA via a native PAGE. One may do so by adding a standard DNA ladder to the PAGE. An average amount of DNA amplified by preparative PCR is 1 nmol (about 60 µg of a 100-bp DNA). A native PAGE further will show if the PCR results in pure target product or if byproducts are present. The PCR should be optimized to yield a maximum band intensity of target product and a minimum band intensity of byproduct. In this case, the byproduct does not have to be removed if it is not transcribed or if RP-HPLC or a preparative PAGE are applied subsequently.
Support Protocol 3
With a protein yield of ∼4 to 8 mg of pure T7 RNA polymerase per liter medium, this protocol provides an easy and cost-effective alternative to the commercially available enzyme. Enzyme concentration can be measured via UV/vis absorption at 280 nm and enzyme activity should be tested in analytical scale transcriptions. Even after 1.5 hr of transcription incubation, an analytical RNA PAGE should show significant amounts of synthesized RNA.
Support Protocol 4
The protein purification protocol described here provides the possibility to express and purify highly active YIPP for in vitro transcription of RNA. Expected yields are 35 to 40 mg of protein per 1 liter LB medium, which is enough for 29 to 33 ml of ready to use stock solution. The purity of the protein can be analyzed via SDS-PAGE or analytical FPLC. The protein activity can be tested via small scale in vitro transcription with transcription buffer as a reference. In the case of an active protein, the transcription reaction should be a clear solution in contrast to the cloudiness of the reference sample.
Basic Protocol 2
After the ligation with a modified nucleotide, the small acceptor RNA (RNA 1; <17 nt) will move faster during the gel electrophoresis because of the additional negative charge of the 3′-end phosphate group. A dephosphorylated RNA will move more slowly during the gel electrophoresis because of the additional nucleotide without a 3′-end phosphate group. For a larger acceptor RNA (>17 nt) no difference will be visible in the gel electrophoresis. The splint ligation with the donor RNA (RNA 2) will show a significantly larger RNA product, which should be detectable via gel electrophoresis.
Support Protocol 5
The yield depends on the type and position of the modification. The modified nucleoside 3′,5′-bisphosphate is characterized by mass spectrometry and NMR spectroscopy. Byproducts like 2′,5′-bisphosphate, mono- or triphosphate nucleosides often cannot be separated via HPLC. In case of characterization difficulties, a test ligation should be performed with T4 RNA Ligase 1 and a short acceptor RNA (<17 nt). A positive ligation result will indicate that the synthesis was successful. Byproducts will not be accepted by the T4 RNA Ligase 1.
Support Protocol 8
The implementation of an IPAP/DIPAP sequence should always lead to a completely decoupled singlet signal of the desired carbon atom.
Basic Protocol 3
The (H)CC-TOCSY experiment yields a spectrum in which the C1′ atoms are correlated to all other carbon atoms of the same ribose ring. This information can be used for a sequential assignment in the (H)CPC and (H)CPC-CCH-TOCSY experiments. In the (H)CPC spectrum, the 31P nucleus is correlated to C5′ and C4′ in 3′ as well as to C3′ and C4′ in the 5′ direction. The (H)CPC-CCH-TOCSY experiment yields correlations between the 31P nucleus and both of the C1′ atoms of the adjacent ribose moieties. Thus, by combining the information obtained in the three experiments, a full resonance assignment of the ribose carbon atoms can be obtained.
Basic Protocol 4
Using the CN-spinfilter HSQC information, the status of hydrogen bonding can be obtained. This information can be extracted from the signal intensities of the imino nitrogen resonances in the C-N correlated spectrum. In case of hydrogen bonding, the sign of the corresponding resonance is inverted as opposed to the remaining resonances. If the imino proton is not involved in hydrogen bonding, the resonance stays unperturbed. Consequently, it might happen that resonances of nucleobases in rather unstable hydrogen bonding do not give rise to a signal as they are at the zero crossing.
Basic Protocol 5
Using the C(N)H-HDQC experiment, a C-H correlated spectrum should be obtained. This spectrum should yield a sharp resonance for each guanosine, adenosine, and cytidine in the sequence. The experiment usually works most reliably for guanosines.
Support Protocol 9
In the amino-selective CN-HSQC spectrum, C-N correlations of all amino groups are obtained. If a correlation is not visible using this experiment (for possible reasons see Troubleshooting), neither will it be in the C(N)H-HDQC spectrum.
Basic Protocol 6
In the C-H correlated “amino”-NOESY spectrum, contacts to spatially close protons or 13C-bound protons (filtered version) and amino groups are detected. In the version without carbon filter, broad single quantum diagonal peaks might appear. In helical parts of an RNA, inter-residual correlations between guanosine amino groups and preceding as well as cross-strand H1′ protons are expected. Correlations might be used in structure calculations as upper distance restraints (6.5 Å).
Basic Protocol 7
The 15N-detected BEST-TROSY experiment yields analogous information as compared to its 1H-detected counterpart. Thus, one resonance for each imino proton, which is sufficiently protected from fast solvent exchange, is expected.
Time Considerations
See Table 23 for times required to perform the protocols included in this article.
| Basic Protocol 1 | 10 days |
| Alternate Protocol 1 | 3 days |
| Alternate Protocol 2 | 1-2 days |
| Support Protocol 1 | 4-5 days |
| Support Protocol 2 | 1 day |
| Support Protocol 3 | 3-4 days |
| Support Protocol 4 | 5-7 days |
| Basic Protocol 2 | 8-9 days |
| Support Protocol 5 | 7-10 days |
| Support Protocol 6 | 5-7 days |
| Support Protocol 7 | 1-2 hr |
| Support Protocol 8 | Depends on the experiment in which the IPAP sequence is embedded |
| Basic Protocol 3 | 1 day ((H)CC-TOCSY), ∼ 1.5 day ((H)CPC), ∼2.5 days ((H)CPC-CCH-TOCSY) |
| Basic Protocol 4 | Depends on sample concentration and RNA length (e.g., for 500 µM 14-nt RNA ∼1.5 days per experiment) |
| Basic Protocol 5 | Depends on sample concentration and RNA length (e.g., for 500 μM 14-nt RNA ∼20 hr) |
| Support Protocol 9 | ∼30 min per 1D, depending on sample concentration and RNA length (e.g., for 980 µM 34-nt RNA ∼10 hr per experiment) |
| Basic Protocol 6 | Depends on sample concentration and RNA length (e.g., for 980 µM 34-nt RNA ∼1 day and 15 hr per experiment) |
| Basic Protocol 7 | Depends on sample concentration and RNA length (e.g., for 500 µM 14-nt RNA ∼12 hr per experiment) |
Acknowledgments
Work at BMRZ is supported by the state of Hesse (Hessisches Ministerum fϋr Wissenschaft und Kunst). R.S. is recipient of a stipend of the Fonds der Chemischen Industrie. H.S. and M.H. are supported by the Deutsche Forschungsgemeinschaft (DFG) in the collaborative research center 902. B.K., H.S., and B.F. are supported by the DFG in graduate school CLiC (GRK 1986, Complex Light Control). We want to thank S. Shuman for the T4 RNA Ligase 2 plasmid, M. Dreyfus for the T7 RNA polymerase plasmid, and Sebastian Maerkl for the YIPP plasmid. Open access funding enabled and organized by Projekt DEAL.
Author Contributions
Robbin Schnieders : Conceptualization; data curation; formal analysis; resources; visualization; writing-original draft; writing-review & editing. Bozana Knezic : Conceptualization; data curation; visualization; writing-original draft; writing-review & editing. Heidi Zetzsche : Conceptualization; data curation; visualization; writing-original draft; writing-review & editing. Alexey Sudakov : Conceptualization; data curation; visualization; writing-original draft; writing-review & editing. Tobias Matzel : Conceptualization; data curation; visualization; writing-original draft; writing-review & editing. Christian Richter : Conceptualization; data curation; resources; visualization; writing-original draft; writing-review & editing. Martin Hengesbach : Conceptualization; data curation; funding acquisition; methodology; writing-original draft; writing-review & editing. Harald Schwalbe : Conceptualization; funding acquisition; methodology; project administration; writing-review & editing. Boris Fürtig : Conceptualization; data curation; funding acquisition; methodology; resources; visualization; writing-original draft; writing-review & editing.
Supporting Information
| Filename | Description |
|---|---|
| SupportingInformation.zip145.9 KB | Supporting Information. |
Please note: The publisher is not responsible for the content or functionality of any supporting information supplied by the authors. Any queries (other than missing content) should be directed to the corresponding author for the article.
Literature Cited
- Altuvia, S., Kornitzer, D., Teff, D., & Oppenheim, A. B. (1989). Alternative mRNA structures of the c111 gene of bacteriophage lambda determine the rate of its translation initiation. Journal of Molecular Biology , 210, 265–280. doi: 10.1016/0022-2836(89)90329-X.
- Alvarado, L. J., Leblanc, R. M., Longhini, A. P., Keane, S. C., Jain, N., Yildiz, Z. F., … Dayie, T. K. (2014). Regio-selective chemical-enzymatic synthesis of pyrimidine nucleotides facilitates RNA structure and dynamics studies. ChemBioChem , 15, 1573–1577. doi: 10.1002/cbic.201402130.
- Andrus, A., & Kuimelis, R. G. (2000). Polyacrylamide gel electrophoresis (PAGE) of synthetic nucleic acids. Current Protocols in Nucleic Acid Chemistry , 10.4.1–10.4.10. doi:10.1002/0471142700.nc1004s01.
- Barrio, J. R., Barrio, M., del, C. G., Leonard, N. J., England, T. E., & Uhlenbeck, O. C. (1978). Synthesis of modified nucleoside 3′,5′-bisphosphates and their incorporation into oligoribonucleotides with T4 RNA ligase. Biochemistry , 17(11), 2077–2081. doi: 10.1021/bi00604a009.
- Batey, R. T., Inada, M., Kujawinski, E., Puglisi, J. D., & Williamson, J. R. (1992). Preparation of isotopically labeled ribonucleotides for multidimensional NMR spectroscopy of RNA. Nucleic Acids Research , 20(17), 4515–4523. doi: 10.1093/nar/20.17.4515.
- Berman, H. M., Westbrook, J., Feng, Z., Gilliland, G., Bhat, T. N., Weissig, H., … Bourne, P. E. (2000). The protein data bank. Nucleic Acids Research , 28(1), 235–242. doi: 10.1093/nar/28.1.235.
- Butcher, S. E., Allain, F. H. T., & Feigon, J. (2000). Determination of metal ion binding sites within the hairpin ribozyme domains by NMR. Biochemistry , 39(9), 2174–2182. doi: 10.1021/bi9923454.
- Carlomagno, T. (2014). Present and future of NMR for RNA–protein complexes : A perspective of integrated structural biology. Journal of Magnetic Resonance , 241, 126–136. doi: 10.1016/j.jmr.2013.10.007.
- Davis, J. H., Tonelli, M., Scott, L. G., Jaeger, L., Williamson, J. R., & Butcher, S. E. (2005). RNA helical packing in solution: NMR structure of a 30 kDa GAAA tetraloop-receptor complex. Journal of Molecular Biology , 351(2), 371–382. doi: 10.1016/j.jmb.2005.05.069.
- de la Torre, J. G., Huertas, M. L., & Carrasco, B. (2000). HYDRONMR: Prediction of NMR relaxation of globular proteins from atomic-level structures and hydrodynamic calculations. Journal of Magnetic Resonance , 147, 138–146. doi: 10.1006/jmre.2000.2170.
- Dethoff, E. A., Petzold, K., Chugh, J., Casiano-negroni, A., & Al-hashimi, H. M. (2012). Visualizing transient low-populated structures of RNA. Nature , 491(7426), 724–728. doi: 10.1038/nature11498.
- Diaz, G. A., Rong, M., McAllister, W. T., & Durbin, R. K. (1996). The stability of abortively cycling T7 RNA polymerase complexes depends upon template conformation. Biochemistry , 35(33), 10837–10843. doi: 10.1021/bi960488+.
- Duss, O., Lukavsky, P. J., & Allain, F. H. T. (2012). isotope labeling and segmental labeling of larger RNAs for NMR structural studies. Isotope Labeling in Biomolecular NMR, Advances in Experimental Medicine and Biology , 992, 121–142. doi: 10.1007/978-94-007-4954-2.
- Farès, C., Amata, I., & Carlomagno, T. (2007). 13C-detection in RNA bases: Revealing structure-chemical shift relationships. Journal of the American Chemical Society , 129(17), 15814–15823. doi: 10.1021/ja0727417.
- Fiala, R., & Sklenár, V. (2007). 13C-detected NMR experiments for measuring chemical shifts and coupling constants in nucleic acid bases. Journal of Biomolecular NMR , 39(2), 153–163. doi: 10.1007/s10858-007-9184-4.
- Földesi, A., Yamakage, S. I., Nilsson, F. P. R., Maltseva, T. V., & Chattopadhyaya, J. (1996). The use of non-uniform deuterium labelling [‘NMR-window’] to study the NMR structure of a 21 mer RNA hairpin. Nucleic Acids Research , 24(7), 1187–1194. doi: 10.1093/nar/24.7.1187.
- Fürtig, B., Richter, C., Wöhnert, J., & Schwalbe, H. (2003). NMR spectroscopy of RNA. ChemBioChem , 4(10), 936–962. doi: 10.1002/cbic.200300700.
- Fürtig, B., Schnieders, R., Richter, C., Zetzsche, H., Keyhani, S., Helmling, C., … Schwalbe, H. (2016). Direct 13C-detected NMR experiments for mapping and characterization of hydrogen bonds in RNA. Journal of Biomolecular NMR , 64, 207–221. doi: 10.1007/s10858-016-0021-5.
- Geen, H., & Freeman, R. (1991). Band-selective radiofrequency pulses. Journal of Magnetic Resonance , 93(1), 93–141.
- Guillerez, J., Lopez, P. J., Proux, F., Launay, H., & Dreyfus, M. (2005). A mutation in T7 RNA polymerase that facilitates promoter clearance. Proceedings of the National Academy of Sciences of the United States of America , 102(17), 5958–5963. doi: 10.1073/pnas.0407141102.
- Hammarstroem, A., & Otting, G. (1994). Improved spectral resolution in 1H NMR spectroscopy by homonuclear semiselective shaped pulse decoupling during acquisition. Journal of the American Chemical Society , 116, 8847–8848. doi: 10.1021/ja00098a070.
- Helmling, C., Keyhani, S., Sochor, F., Fürtig, B., Hengesbach, M., & Schwalbe, H. (2015). Rapid NMR screening of RNA secondary structure and binding. Journal of Biomolecular NMR , 63, 67–76. doi: 10.1007/s10858-015-9967-y.
- Hengesbach, M., Kobitski, A., Voigts-Hoffmann, F., Frauer, C., Nienhaus, G. U., & Helm, M. (2008). RNA intramolecular dynamics by single-molecule FRET. Current Protocols in Nucleic Acid Chemistry , 34, 11.12.1–11.12.22. doi: 10.1002/0471142700.nc1112s34.
- Ho, C. K., & Shuman, S. (2002). Bacteriophage T4 RNA ligase 2 (gp24.1) exemplifies a family of RNA ligases found in all phylogenetic domains. Proceedings of the National Academy of Sciences of the United States of America , 99(20), 12709–12714. doi: 10.1073/pnas.192184699.
- Hoch, J. C., Stern, A. S., & Mobli, M. (2011). Maximum entropy reconstruction. Encyclopedia of Magnetic Resonance , 2(4). doi: 10.1002/9780470034590.emrstm0299.pub2 .
- Imai, S., Kumar, P., Hellen, C. U. T., Souza, V. M. D., & Wagner, G. (2016). An accurately preorganized IRES RNA structure enables eIF4G capture for initiation of viral translation. Nature Structural and Molecular Biology , 23(9), 859–864. doi: 10.1038/nsmb.3280.
- Jud, L., & Micura, R. (2017). An unconventional acid-labile nucleobase protection concept for guanosine phosphoramidites in RNA solid-phase synthesis. Chemistry - A European Journal , 23, 3406–3413. doi: 10.1002/chem.201605056.
- Kao, C., Zheng, M., & Rüdisser, S. (1999). A simple and efficient method to reduce nontemplated nucleotide addition at the 3′ terminus of RNAs transcribed by T7 RNA polymerase. RNA , 5(9), 1268–1272. doi: 10.1017/S1355838299991033.
- Karlsson, H., Baronti, L., & Petzold, K. (2020). A robust and versatile method for production and purification of large-scale RNA samples for structural biology. RNA , 26(8), rna.075697.120. doi: 10.1261/rna.075697.120.
- Katz, J. J., Crespi, H. L., & Finkel, A. J. (1964). Isotope effects in fully deuterated hexoses, proteins and nucleic acids. Pure Applied Chemistry , 8, 471–481. doi: 10.1351/pac196408030471.
- Keyhani, S., Goldau, T., Blümler, A., Heckel, A., & Schwalbe, H. (2018). Chemo-enzymatic synthesis of position-specifically modified RNA for biophysical studies including light control and NMR spectroscopy. Angewandte Chemie - International Edition , 57, 12017–12021. doi: 10.1002/anie.201807125.
- Kovacs, H., Moskau, D., & Spraul, M. (2005). Cryogenically cooled probes — A leap in NMR technology. Progress in Nuclear Magnetic Resonance Spectroscopy , 46, 131–155. doi: 10.1016/j.pnmrs.2005.03.001.
- Kunitz, M. (1952). Crystalline inorganic pyrophosphatase isolated. The Journal of General Physiology , 35(3), 423–450. doi: 10.1085/jgp.35.3.423.
- Lavickova, B., & Maerkl, S. J. (2019). A simple, robust, and low-cost method to produce the PURE cell-free system. ACS Synthetic Biology , 8, 455–462. doi: 10.1021/acssynbio.8b00427.
- Meissner, A., Duus, J. Ø., & Sørensen, O. W. (1997). Spin-state-selective excitation. Application for E. COSY-type measurement of J HH coupling constants. Journal of Magnetic Resonance , 128, 92–97. doi: 10.1006/jmre.1997.1213.
- Milligan, J. F., Groebe, D. R., Witherell, G. W., & Uhlenbeck, O. C. (1987). Oligonucleotide synthesis using T7 RNA polymerase and synthetic DNA templates. Nucleic Acids Research , 15(21), 8783–8798. doi: 10.1093/nar/15.21.8783.
- Milligan, J. F., & Uhlenbeck, O. C. (1989). Synthesis of small RNAs using T7 RNA polymerase. Methods in Enzymology , 180(C), 51–62. doi: 10.1016/0076-6879(89)80091-6.
- Mörl, M., & Hartmann, R. K. (2008). Production of RNAs with homogeneous 5′ and 3′ ends. In R. K. Hartmann, A. Bindereif, A. Schön, & E. Westhof (Eds.), Handbook of RNA Biochemistry. Weinheim, Germany: Wiley-VCH. doi: 10.1002/9783527619504.ch2.
- Mueller, L., Legault, P., & Pardi, A. (1995). Improved RNA structure determination by detection of NOE contacts to exchange-broadened amino protons. Journal of the American Chemical Society , 117(45), 11043–11048. doi: 10.1021/ja00150a001.
- Mulder, F. A. A., Spronk, C. A. E. M., Slijper, M., Kaptein, R., & Boelens, R. (1996). Improved HSQC experiments for the observation of exchange broadened signals. Journal of Biomolecular NMR , 8, 223–228. doi: 10.1007/BF00211169.
- Mullis, K., Faloona, F., Scharf, S., Saiki, R., Horn, G., & Erlich, H. (1986). Specific enzymatic amplification of DNA in vitro: The polymerase chain reaction. Cold Spring Harbor Symposia on Quantitative Biology , 51, 263–273. doi: 10.1101/SQB.1986.051.01.032.
- Nikonowicz, E. P., Sirr, A., Legault, P., Jucker, F. M., Baer, L. M., & Pardi, A. (1992). Preparation of 13C and 15N labelled RNAs for heteronuclear multi-dimensional NMR studies. Nucleic Acids Research , 20(17), 4507–4513. doi: 10.1093/nar/20.17.4507.
- Nozinovic, S., Fürtig, B., Jonker, H. R. A., Richter, C., & Schwalbe, H. (2010). High-resolution NMR structure of an RNA model system: The 14-mer cUUCGg tetraloop hairpin RNA. Nucleic Acids Research , 38(2), 683–694. doi: 10.1093/nar/gkp956.
- Ottiger, M., Delaglio, F., & Bax, A. (1998). Measurement of J and dipolar couplings from simplified two-dimensional NMR spectra. Journal of Magnetic Resonance , 131, 373–378. doi: 10.1006/jmre.1998.1361.
- Petrov, A., Wu, T., Puglisi, E. V., & Puglisi, J. D. (2013). RNA purification by preparative polyacrylamide gel electrophoresis. In J. Lorsch (Ed.), Methods in Enzymology (Vol. 530, pp. 315-330). Amsterdam: Elsevier. doi: 10.1016/B978-0-12-420037-1.00017-8.
- Quant, S., Wechselberger, R. W., Wolter, M. A., Wörner, K.-H., Schell, P., Engels, J. W., … Schwalbe, H. (1994). Chemical synthesis of 13C-labelled monomers for the solid-phase and template controlled enzymatic synthesis of DNA and RNA oligomers. Tetrahedron Letters , 35(36), 6649–6652. doi: 10.1016/S0040-4039(00)73458-7.
- Reining, A., Nozinovic, S., Schlepckow, K., Buhr, F., Fürtig, B., & Schwalbe, H. (2013). Three-state mechanism couples ligand and temperature sensing in riboswitches. Nature , 499(7458), 355–359. doi: 10.1038/nature12378.
- Richter, C., Kovacs, H., Buck, J., Wacker, A., Fürtig, B., Bermel, W., & Schwalbe, H. (2010). 13C-direct detected NMR experiments for the sequential J-based resonance assignment of RNA oligonucleotides. Journal of Biomolecular NMR , 47(4), 259–269. doi: 10.1007/s10858-010-9429-5.
- Schanda, P., & Brutscher, B. (2005). Very fast two-dimensional NMR spectroscopy for real-time investigation of dynamic events in proteins on the time scale of seconds. Journal of the American Chemical Society , 127(22), 8014–8015. doi: 10.1021/ja051306e.
- Schnieders, R., Keyhani, S., Schwalbe, H., & Fürtig, B. (2020). More than proton detection—new avenues for NMR spectroscopy of RNA. Chemistry - A European Journal , 26(1), 102–113. doi: 10.1002/chem.201903355.
- Schnieders, R., Richter, C., Warhaut, S., De Jesus, V., Keyhani, S., Duchardt-Ferner, E., … Fürtig, B. (2017). Evaluation of 15N-detected H–N correlation experiments on increasingly large RNAs. Journal of Biomolecular NMR , 69(1), 31–44. doi: 10.1007/s10858-017-0132-7.
- Schnieders, R., Wolter, A. C., Richter, C., Wöhnert, J., Schwalbe, H., & Fürtig, B. (2019). Novel 13C-detected NMR experiments for the precise detection of RNA structure. Angewandte Chemie - International Edition , 58, 9140–9144. doi: 10.1002/anie.201904057.
- Schürer, H., Lang, K., Schuster, J., & Mörl, M. (2002). A universal method to produce in vitro transcripts with homogeneous 3′ ends. Nucleic Acids Research , 30(12), e56. doi: 10.1093/nar/gnf055.
- Serber, Z., Richter, C., Moskau, D., Bo, J., Gerfin, T., Marek, D., … Dötsch, V. (2000). New carbon-detected protein NMR experiments using cryoprobes. Journal of the American Chemical Society , 122(7), 3554–3555. doi: 10.1021/ja991371m.
- Serganov, A., Yuan, Y., Pikovskaya, O., Polonskaia, A., Malinina, L., Phan, A. T., … Patel, D. J. (2004). Structural basis for discriminative regulation of gene expression by adenine- and guanine-sensing mRNAs. Chemistry and Biology , 11, 1729–1741. doi: 10.1016/j.chembiol.2004.11.018.
- Shaka, A. J., Barker, P. B., & Freeman, R. (1985). Computer-optimized decoupling scheme for wideband applications and low-level operation. Journal of Magnetic Resonance , 64(3), 547–552. doi: 10.1016/0022-2364(85)90122-2.
- Simon, B., Zanier, K., & Sattler, M. (2001). A TROSY relayed HCCH-COSY experiment for correlating adenine H2/H8 resonances in uniformly 13C-labeled RNA molecules. Journal of Biomolecular NMR , 20, 173–176. doi: 10.1023/A:1011214914452.
- Tzakos, A. G., Easton, L. E., & Lukavsky, P. J. (2007). Preparation of large RNA oligonucleotides with complementary isotope-labeled segments for NMR structural studies. Nature Protocols , 2(9), 2139–2147. doi: 10.1038/nprot.2007.306.
- Winkler, W., Nahvi, A., & Breaker, R. R. (2002). Thiamine derivatives bind messenger RNAs directly to regulate bacterial gene expression. Nature , 419, 952–956. doi: 10.1038/nature01145.
- Wolter, A. C., Duchardt-Ferner, E., Nasiri, A. H., Hantke, K., Wunderlich, C. H., Kreutz, C., & Wöhnert, J. (2016). NMR resonance assignments for the class II GTP binding RNA aptamer in complex with GTP. Biomolecular NMR Assignments , 10, 101–105. doi: 10.1007/s12104-015-9646-7.
- Wolter, A. C., Pianu, A., Kremser, J., Strebitzer, E., Schnieders, R., Fürtig, B., … Wöhnert, J. (2019). NMR resonance assignments for the GTP-binding RNA aptamer 9-12 in complex with GTP. Biomolecular NMR Assignments , 13, 281–286. doi: 10.1007/s12104-019-09892-z.
- Wolter, A. C., Weickhmann, A. K., Nasiri, A. H., Hantke, K., Ohlenschläger, O., Wunderlich, C. H., … Wöhnert, J. (2017). A stably protonated adenine nucleotide with a highly shifted pKa value stabilizes the tertiary structure of a GTP-binding RNA aptamer. Angewandte Chemie - International Edition , 56, 401–404. doi: 10.1002/anie.201609184.
- Xu, J., Lapham, J., & Crothers, D. M. (1996). Determining RNA solution structure by segmental isotopic labeling and NMR: Application to Caenorhabditis elegans spliced leader RNA 1. Proceedings of the National Academy of Sciences of the United States of America , 93(1), 44–48. doi: 10.1073/pnas.93.1.44.
- Zhou, Z., Kümmerle, R., Qiu, X., Redwine, D., Cong, R., Taha, A., … Winniford, B. (2007). A new decoupling method for accurate quantification of polyethylene copolymer composition and triad sequence distribution with 13C NMR. Journal of Magnetic Resonance (San Diego, Calif. : 1997) , 187(2), 225–233. doi: 10.1016/j.jmr.2007.05.005.
- Ziegeler, M., Cevec, M., Richter, C., & Schwalbe, H. (2012). NMR studies of HAR1 RNA secondary structures reveal conformational dynamics in the human RNA. ChemBioChem , 13, 2100–2112. doi: 10.1002/cbic.201200401.
Citing Literature
Number of times cited according to CrossRef: 7
- J. Tassilo Grün, Jihyun Kim, Sundaresan Jayanthi, Adonis Lupulescu, E̅riks Kupče, Harald Schwalbe, Lucio Frydman, Identifying and Overcoming Artifacts in 1 H-Based Saturation Transfer NOE NMR Experiments , Journal of the American Chemical Society, 10.1021/jacs.2c13087, 145 , 11, (6289-6298), (2023).
- Alexey Sudakov, Bozana Knezic, Martin Hengesbach, Boris Fürtig, Elke Stirnal, Harald Schwalbe, Site‐Specific Labeling of RNAs with Modified and 19F‐Labeled Nucleotides by Chemo‐Enzymatic Synthesis, Chemistry – A European Journal, 10.1002/chem.202203368, 29 , 25, (2023).
- Harindranath Kadavath, Roland Riek, TROSY , Two‐Dimensional (2D) NMR Methods, 10.1002/9781119806721.ch12, (365-393), (2023).
- Francois-Xavier Theillet, In-Cell Structural Biology by NMR: The Benefits of the Atomic Scale, Chemical Reviews, 10.1021/acs.chemrev.1c00937, 122 , 10, (9497-9570), (2022).
- Klara R. Mertinkus, J. Tassilo Grün, Nadide Altincekic, Jasleen Kaur Bains, Betül Ceylan, Jan-Peter Ferner, Lucio Frydman, Boris Fürtig, Martin Hengesbach, Katharina F. Hohmann, Daniel Hymon, Jihyun Kim, Božana Knezic, Mihajlo Novakovic, Andreas Oxenfarth, Stephen A. Peter, Nusrat S. Qureshi, Christian Richter, Tali Scherf, Andreas Schlundt, Robbin Schnieders, Harald Schwalbe, Elke Stirnal, Alexey Sudakov, Jennifer Vögele, Anna Wacker, Julia E. Weigand, Julia Wirmer-Bartoschek, Maria A. Wirtz Martin, Jens Wöhnert, 1H, 13C and 15N chemical shift assignment of the stem-loops 5b + c from the 5′-UTR of SARS-CoV-2, Biomolecular NMR Assignments, 10.1007/s12104-021-10053-4, 16 , 1, (17-25), (2022).
- Bozana Knezic, Sara Keyhani‐Goldau, Harald Schwalbe, Mapping the Conformational Landscape of the Neutral Network of RNA Sequences That Connect Two Functional Distinctly Different Ribozymes, ChemBioChem, 10.1002/cbic.202200022, 23 , 7, (2022).
- Sudeshna Manna, Vyankat A. Sontakke, Seergazhi G. Srivatsan, Incorporation and Utility of a Responsive Ribonucleoside Analogue in Probing the Conformation of a Viral RNA Motif by Fluorescence and 19F NMR Spectroscopy, ChemBioChem, 10.1002/cbic.202100601, 23 , 3, (2021).

