Live Imaging and Quantification of Neutrophil Extracellular Trap Formation
Lakmali Munasinghage Silva, Lakmali Munasinghage Silva, Niki Moutsopoulos, Niki Moutsopoulos, Thomas H. Bugge, Thomas H. Bugge, Andrew Doyle, Andrew Doyle
Abstract
NeutrophilExtracellular Trap (NET) formation (NETosis) is a unique process that occurs in response to numerous stimuli. To investigate NETosis, we created a method that can be used easily without the need for complex programming abilities and commercial software packages. This article describes a fully automated assay to quantify NETosis using fluorescence live imaging on an automated widefield inverted microscope. Herein, we describe (1) sample preparation, (2) required equipment for automated acquisition, and finally (3) analysis of NETosis using the readily available image analysis software Fiji (ImageJ2). This protocol can be adapted to evaluate NETosis after different stimuli, and can be easily modified to allow high-throughput acquisition and analysis using a multi-well plate format. Published 2021. This article is a U.S. Government work and is in the public domain in the USA. Current Protocols published by Wiley Periodicals LLC.
Basic Protocol 1 : Neutrophil isolation and plate setup
Basic Protocol 2 : Microscope and acquisition setup for automated high throughput imaging
Basic Protocol 3 : Analysis of NETosis and apoptosis data
INTRODUCTION
Neutrophils constitute the first wave of the cellullar immune response to tissue injury. They respond to microbial invasion via three distinct defense mechanisms including: (1) phagocytosis of pathogens, (2) degranulation releasing cytotoxic compounds, and (3) neutrophil extracellular trap formation (NETosis; Brinkmann et al., 2004). NETosis is a unique process in which activated neutrophils extrude their decondensed chromatin to produce web-like structures that are composed of DNA, histones, and granular proteins. These sticky webs trap and kill the invading pathogens extracellularly, but also cause considerable tissue damage. NETs can be induced by multiple pathogens including Gram-positive bacteria such as Staphylococcus aureus (Fuchs et al., 2007) and Streptococcus pyogenes (Buchanan et al., 2006); Gram-negative bacteria such as Escherichia coli (Grinberg, Elazar, Rosenshine, & Shpigel, 2008), Shigella flexneri (Brinkmann & Zychlinsky, 2012), Yersinia enterocolitica (Casutt-Meyer et al., 2010), and Yersinia pseudotuberculosis (Casutt-Meyer et al., 2010); viruses such as HIV-1 (Saitoh et al., 2012); and other organisms (Brinkmann & Zychlinsky, 2012).
In neutrophils cultured ex vivo, the formation of NETs can be induced by chemicals such as phorbol-12-myristate-13-acetate (PMA) and calcium ionophores (Kaplan & Radic, 2012). Moreover, neutrophils are known to engage with components of the extracellular matrix (ECM) through integrins, leading to their activation.
To facilitate the study of NETosis, we present a robust method that uses live-cell fluorescence staining and automatic image segmentation to determine the percentage of NET-forming neutrophils. The DNA-intercalating dye Hoechst is used to determine the number of cells per field of view. As a cell-impermeant dye, SYTOX Green enters the cell upon loss of membrane integrity and binds to DNA, whereupon its fluorescence intensity increases >500-fold, thereby acting as a marker to differentiate dead and live cells. Loss of cell membrane integrity and extracellular DNA release is a hallmark of NETosis and allows us to detect all neutrophils that are undergoing death either by NETosis or other means. By combined analysis of the shape and size of cells stained with SYTOX Green, we have designed an automated technique to determine the percentage of NETosing cells.
This method does not require a sophisticated optical setup, and image analysis is performed with the public domain software Fiji (ImageJ2). The protocol will be useful to provide results that are adequately standardized to allow comparison of data sets that were generated in different laboratories.
Basic Protocol 1: NEUTROPHIL ISOLATION AND PLATE SETUP
In this protocol, we will describe the basic steps for human neutrophil isolation from heparinized blood and image chamber/μ-Slide setup used for imaging of neutrophil extracellular trap (NET) formation, as discussed in Basic Protocol 2 and further on in the article. Herein, we have used fibrin as the matrix for neutrophil adherence in an 8-well μ-Slide (Ibidi). However, any matrix of preference (e.g.: poly-L-lysine) could be used in a 12- or 96-well plate format.
Materials
-
Matrix of choice: 0.60 μg/ml human fibrinogen (EMD Millipore, cat. no. 341578)
-
Thrombin from human plasma (Millipore Sigma)
-
DMEM medium (Gibco, cat. no. 21063)
-
Blocking buffer: 1% non-fat dry milk powder (LabScientific, cat. no. M0841) in 1× phosphate-buffered saline (PBS without Ca or Mg (Gibco, cat. no. 10010-031)
-
Samples: heparinized human blood
-
Ficoll-Paque Premium (GE Healthcare)
-
Dextran (Spectrum Chemical, cat. no. D1004)
-
Hypotonic red blood cell lysis buffer: 13.6 ml 10× PBS (Gibco, 70011-044) in 600 ml water
-
Re-equilibration buffer: 108.1 ml 10× PBS (Gibco, cat. no. 70011-044) in 500 ml water
-
Live/Dead Cell Viability assay (Invitrogen)
-
Anti−mouse CD15 (HI98; Invitrogen); CD16 (3G8; BioLegend); CD11B (ICRF44; BD Horizon); and CD45 (HI30; BioLegend)
-
Hoechst 33342 (ThermoFisher Scientific, cat. no. 62249)
-
FluoroBrite™ DMEM (ThermoFisher Scientific, cat. no. A1896701)
-
SYTOX™ Green Nucleic Acid Stain (ThermoFisher Scientific, cat. no. S7020)
-
Phorbol myristate acetate (PMA; Millipore Sigma, cat. no. P8139)
-
4% paraformaldehyde (PFA; Sigma) in 1× PBS
-
5% bovine serum albumin (Fraction V, Sigma) in PBS
-
anti-MPO antibody (Abcam, cat. no. ab65871)
-
anti Cit-H3 antibody (Abcam, cat. no. ab5103)
-
Alexa Fluor® 647-conjugated AffiniPure F(ab′)2 anti-rabbit (Jackson ImmunoResearch, cat. no. 711 606 152)
-
DAPI (Sigma, cat. no. 28718-90-3)
-
8-well μ-Slides (Ibidi)
-
Humidified 5% CO2 incubator
-
Biosafety cabinet
-
50-ml conical tubes
-
Centrifuge with swinging-bucket rotor
-
FACS Fortessa cytometer (BD Biosciences)
-
FlowJo software (Tree Star)
-
Nikon A1R+ confocal microscope (also see Basic Protocol 2)
-
NIS-Elements software (Nikon)
Matrix coating of wells
1.Coat 8 well μ-Slides with fibrin (0.60 μg/ml human fibrinogen + 5 U/ml human thrombin; 200 μl per well in DMEM) at 37°C overnight in a humidified 5% CO2 incubator.
2.Wash and block µ-Slides:
-
Wash off excess thrombin with three times with DMEM.
-
If the effect of matrix-neutrophil binding on NETosis is assessed, block nonspecific binding sites using appropriate blocking agent: here, we use 1% nonfat dry milk (1 hr) at room temperature.
-
Wash slides three times with DMEM. Perform the washing steps carefully by adding the washing solution to the wall but not the middle of the well, so that the matrix is not washed off. Avoid touching the matrix with the tip during all steps to prevent accidental scratches (which will be visible during imaging and affect cell adhesion).
-
Dry washed µ-Slides for 15 min inside a biosafety cabinet before use.
µ-Slides were made fresh before each experiment to avoid drying and cracking of the coating and to assure efficient neutrophil binding.
Neutrophil isolation
Human neutrophils are isolated from heparinized peripheral blood using density gradients of Ficoll-Paque Premium.
3.Mix heparinized human blood (10 ml) with 15 ml of 1× PBS without Ca or Mg. Place 12 ml of Ficoll-Paque in a 50-ml conical tube and layer blood carefully on top of the Ficoll-Paque to avoid mixing.
4.Centrifuge 30 min at 500 × g , room temperature, with no acceleration or deceleration.
5.Aspirate mononuclear cells, remaining plasma, and Ficoll-Plaque Premium from the tube, leaving the PMN and erythrocyte-rich pellet.
6.Resuspend the pellet with 1× PBS (no Ca or Mg) for a final volume of 20 ml. Add 20 ml of 3% dextran, and mix by inverting 6-8 times.
7.Keep the tubes at room temperature for 20 min to allow the erythrocytes to sediment.
8.Transfer the PMN-rich supernatant to a new tube and dilute with up to 50 ml of 1× PBS (no Ca or Mg).
9.Centrifuge the PMN-rich supernatant 10 min at 300 × g , room temperature, and aspirate the supernatant.
10.Lyse the remaining erythrocytes by mixing with 10 ml of hypotonic lysis buffer by inverting for 1 min, followed by the quick addition of 10 ml re-equilibration buffer.
11.Dilute further with 30 ml 1× PBS (no Ca or Mg). Centrifuge the tubes 10 min at 300 × g , room temperature, and resuspend the pellet in DMEM at a 2.5 × 10⁴ cells/ml concentration.
12.Rest neutrophils at room temperature for 30 min before plating as described in step 14 (this resting step improves the quality of cells).
13.To confirm the viability and purity of isolated neutrophils, stain a million cells with the Live/Dead Cell Viability assay, and stain cell surface markers with the following anti-mouse antibodies at 1:200 dilution per 106 cells: CD15 (HI98; Invitrogen); CD16 (3G8; BioLegend); CD11B (ICRF44; BD Horizon); and CD45 (HI30; BioLegend). Analyze samples using a FACS Fortessa cytometer and FlowJo software.
Neutrophil extracellular trap formation
14.Mix the prepared cell suspension (2 ml of 2.5 × 10⁴ cells/ml) with 2 μl Hoechst for a final concentration of 1 μg/ml (stock concentration 1 mg/ml), and add a 200-μl aliquot per well. Shake the μ-slide perpendicularly so that the cells are dispersed equally throughout the well. Do not swirl the slide, as that will make the cells clump in the middle. Incubate cells at 37°C for 30 min in a humidified incubator.
15.Decant the Hoechst solution by inverting the μ-slide onto a paper towel and tapping gently, wash wells with 200 μl FluoroBrite DMEM to remove non-adherent cells, and supplement with 200 μl of FluoroBrite DMEM containing 0.2 μM SYTOX Green with or without 15 nM PMA.
16.For confirmation of NETosis:
-
Fix cells with 4% PFA for 10 min followed by washing with 1× PBS (do not add any solution to the middle of the well; instead add onto the inner wall gently).
-
Block with 5% bovine serum albumin in PBS for 1 hr.
-
Incubate cells with primary antibodies at 1:500 dilution (anti-MPO and anti Cit-H3) for 1 hr at room temperature, and wash three times in 1× PBS.
-
Add secondary antibody [Alexa Fluor®647-conjugated AffiniPure F(ab′)2anti-rabbit; diluted 1:1000] and DAPI (diluted 1:1000) for 1 hr at room temperature.
-
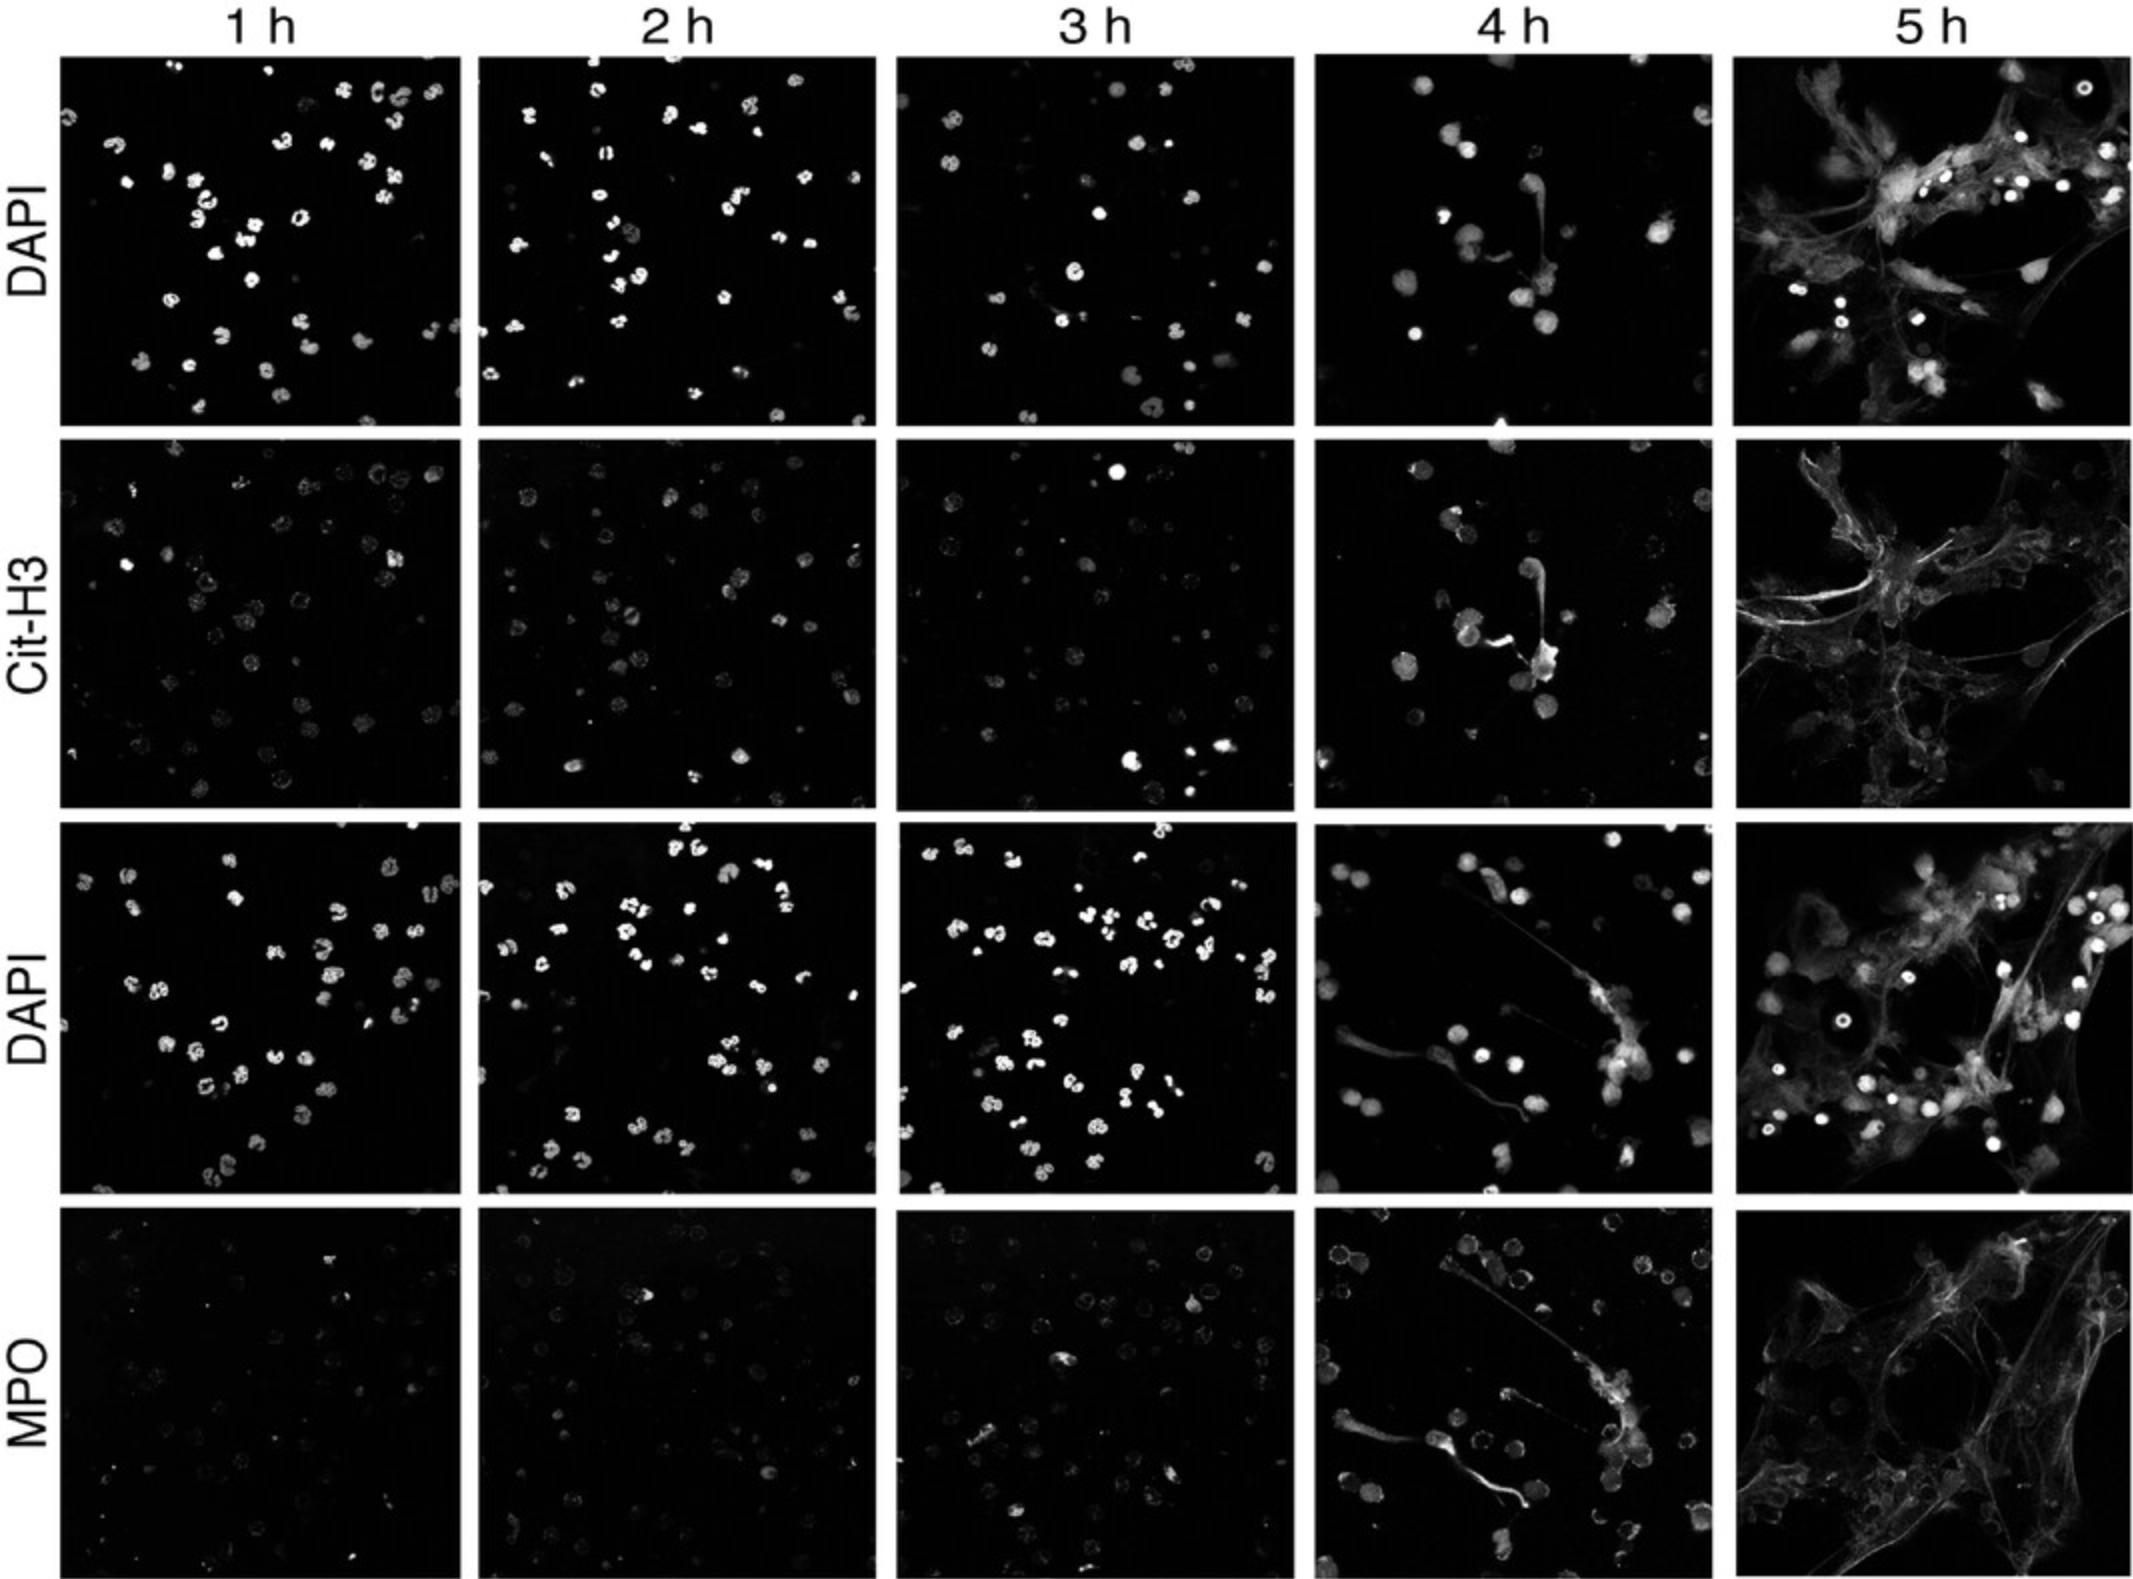
Wash cells in 1× PBS three times. Capture images on an inverted Nikon A1R+ confocal microscope (20× in air or 60× under oil immersion) using NIS-Elements software or any other comparable confocal system (Fig.1).
See Basic Protocol2for microscopy setup.
Basic Protocol 2: MICROSCOPE AND ACQUISITION SETUP FOR AUTOMATED HIGH-THROUGHPUT IMAGING
In this protocol, we will detail the microscope equipment required for collecting NETosis and apoptosis data in an automated manner. Discussed within this section will be the equipment necessary for performing the acquisition, which includes cameras, an automated microscope, an automated XY stage, shutters, light sources, and software. The nuances of each component will briefly be discussed as well. This will be followed by a step-by-step protocol detailing how to set up the system to use an 8-well Ibidi dish to acquire appropriate images. From this, a 96-well plate can be extrapolated.
While it is possible to perform these experiments using either a laser-scanning confocal or a spinning disk confocal, or other high-end microscope system, there are several advantages to a widefield microscope for image/data acquisition. First and foremost is dimensionality. The lack of a third dimension for proper analysis means confocality is not required. Second is sensitivity. Cameras today are highly efficient at light collection, with between 70% and 96% quantum efficiency (QE) depending on the type of sensor. Photomultiplier tubes in laser scanning confocals have quantum efficiencies (QEs) of nearly 25% for common multi-alkali detectors and up to 50% for high-sensitivity GaAsP detectors. In addition, the use of a pinhole greatly reduces light throughput to the detector. The latter also applies to a spinning disk system. Third is the speed factor. For a non-resonant confocal, a 1024 × 1024 resolution two-color image can take between 1 and 2 s, while a widefield system with a high-sensitivity camera can easily achieve 2× greater (2048 × 2048) resolution within 1 s, which includes the time to move a slow filter turret. The final consideration is price. Laser-based confocals (laser scanning or spinning disk versions) average
Materials
- Automated inverted widefield microscope (Nikon TI-E with perfect focus system is used here)
- XY translational microscope stage with sub-micron accuracy (Nikon, ASI, Prior, Ludl, etc.), universal stage insert, and 4-slide insert (optional)
- 20-40× Plan Apo high-numerical-aperture (0.75 used here) air objective
- LED-based white light source (SOLA Light engine used here)
- Chroma or Semrock DAPI and GFP filter cubes
- Hamamatsu Flash 4 version 3 Scientific CMOS (or similar camera)
- Computer workstation (single 64-bit 3.0 GHz processor or higher, multiple hard drives, 4 TB combined or greater, 16 or higher GB RAM, low-end Nvidia graphics card; HP Z Series or Dell Dimensions)
- Acquisition software (NIS elements used here)
- Environmental chamber (custom-made system by Precision Plastics that includes heat, humidification and CO2 control)
- 8-well Ibidi µ-Slide prepared as in Basic Protocol 1
Automated inverted widefield microscope
Automation of the microscope components is key to building a high-throughput system, allowing switching of fluorescent filter cubes to illuminate and detect the multiple dyes used in these experiments and reducing the user's need to oversee the entire process. We have found that an autofocus mechanism that can detect the coverslip surface and offset the focal plane helps to (1) keep the sample in focus and (2) reduce the number of images acquired, which in turn allows more XY positions to be observed between each timepoint. Autofocus also helps the user to “set it and forget it,” whereas systems without autofocus are prone to thermal drift and may require the user to reset the Z position multiple times. If autofocus is not a part of the system, several companies sell “add-on” systems, or a small Z-stack can be taken to insure proper data acquisition.
XY translational microscope stage
Due to the lower magnification (discussed below) used in these experiments, rotatory encoders and a submicron accuracy are sufficient for repeated movement of multiple positions. Highly accurate stages having linear encoders and repeatability of tenths of nanometers are not necessary. These items increase the price nearly two-fold. If you are unsure of the stage accuracy, ask your local microscope representative for help. Accuracy and speed often go hand in hand: the faster the movement, the less accurate the movement becomes. Most stages can be set at a specific rate of movement within your acquisition software. Lowering the rate of movement will often improve the accuracy if there are issues.
Objective and light path
For most high-throughput applications, lower-magnification objectives are best for collecting as many data points as possible. We recommend choosing a high-numerical-aperture air objective for these experiments. The long working distance (distance between the front lens and the focal plane) of an air objective allows for the large movements needed when using well plates. The numerical aperture (NA) of an objective is an indicator of its ability to gather light and resolve detail, especially in the Z dimension. The higher the NA, the greater the detail and light gathering. Stay away from phase-contrast objectives that have lower NAs and that have a phase ring within the light path. In addition, remove any Nomarski prisms associated with differential interference contrast (DIC) imaging. These will reduce light-collection efficiency. In the protocols described in this article, we determined that 20× to 40× magnification is sufficient for acquisition and analysis. However, this may be dependent on the resolution of your camera (see below).
Epifluorescent light source
We recommend the use of LED (light-emitting diode) white light sources. While these light sources are more expensive initially than mercury, xenon, or metal halide lamps (>$4000.00 USD), LEDs have the advantage of longevity. LEDs average greater than 10,000 hr of lifetime, compared to several hundred for a mercury light source. In addition, unlike other bulb-based sources, LEDs can be shut off between acquiring individual images, meaning the LEDs will likely last the lifetime of the microscope (∼20 years). Because the spectrum of LED and other light sources can vary, be sure to choose a version that has high output at your required wavelength. Here, we require high emission centered at 365 nm for Hoechst, and 488 nm for SYTOX Green dyes.
Camera
The most commonly used cameras have shifted from CCD (charge-coupled device) chips to sCMOS (scientific complementary metal-oxide semiconductor). sCMOS-based cameras have low read noise (having a background noise level below 1 electron), large pixel arrays (1024 or greater), fast acquisition speeds (30 frames per second or faster), and relatively high QE percentages (73%-95%). Recently, back-thinned chips (where the chip is “sliced” very thin to allow more light gathering) have led to QEs comparable to those of electron multiplication (EM) CCDs, but without the high noise. The pixels themselves can vary greatly, from 4.25 × 4.25 to 11 × 11 µm; a higher number increases the total number of photons that each collects (full-well capacity), but at the cost of XY resolution. If purchasing a camera, ask your microscope representative to demonstrate a camera so you can compare and contrast the best camera for your purpose. Here, we use sCMOS with 6.5 × 6.5-µm pixels in a 2048 × 2048 array with a QE of ∼76%.
Computer workstation
For widefield microscope setup as an “acquisition only” system, where data analysis is performed elsewhere, high RAM, dual processors, and fast M.2 hard drives are not needed. These are only necessary for high-end analysis systems. We recommend a single mid-speed processor (3+ GHz), 16-32 GB of RAM, and a low- to mid-level graphics card such as an Nvidia Quadro P2000 to P4000, but two separate hard drives, one for computing and programs and the other for data storage. It is preferred that the program drive be solid state (SATA or M.2) and the data drive be 2-4 TB minimum with a 7200-rpm speed. RAID hard drives are not necessary. The other consideration is the number of USB and PCI express slots needed for component control. In general, the HP Z series or the Dell Precision lines are good choices. For an analysis system, high RAM, dual processors, fast M.2 hard drives will help increase speed.
Acquisition software
There are many options for control of acquisition including those developed by the major microscope companies (cellSens, NIS-Elements, Zen, LAS X), third-party software (MetaMorph, Visiview, Image Pro, IPLab, Microvolution), and freeware (Micro-Manager). Excluding Micro-Manager, each costs upwards of $10,000 (USD) and many are modular, where you can purchase a time-lapse module, etc. All are possible choices, but their use may depend on your microscope platform. It is also important to ask experts and software companies whether your specific camera, stage, shutter, etc., can be controlled by their software so that integration issues are minimal. Here we are using NIS-Elements from Nikon for acquisition.
Environmental chamber
Environmental control is a requirement for any long-term time-lapse experimentation. Most culture media require CO2 for proper pH balance, while cellular function can slow below 37°C. We recommend enclosed systems, either locally as a stage-plate incubator or a “Hot Box” that encloses the microscope so humidity can also be controlled and medium does not evaporate, causing an increase in medium osmolarity. It can take 2-3 hr for the entire microscope to come to temperature equilibrium, so plan ahead. Chambers made of black polymethacrylate also reduce the effects of stray room light on imaging quality.
Image acquisition
For these experiments, timing is everything, so being prepared with a workflow ahead of time is important. For a single 8-well Ibidi µ-Slide, we use a 4-slide holder because it holds the sample in a specific position with respect to the XY stage, firmly (not shown). If using a universal holder for a single µ-Slide, we recommend positioning one side of the holder to the extreme left or right (Fig. 2A). This allows for more repeatable positioning each time and the possibility of reusing saved positions in the future. The workflow below should help the user quickly find the sample. A short “Image acquisition cheat sheet” can be found at the end of this section and is meant for the user to print and bring to the microscope as a reminder of the following detailed workflow.
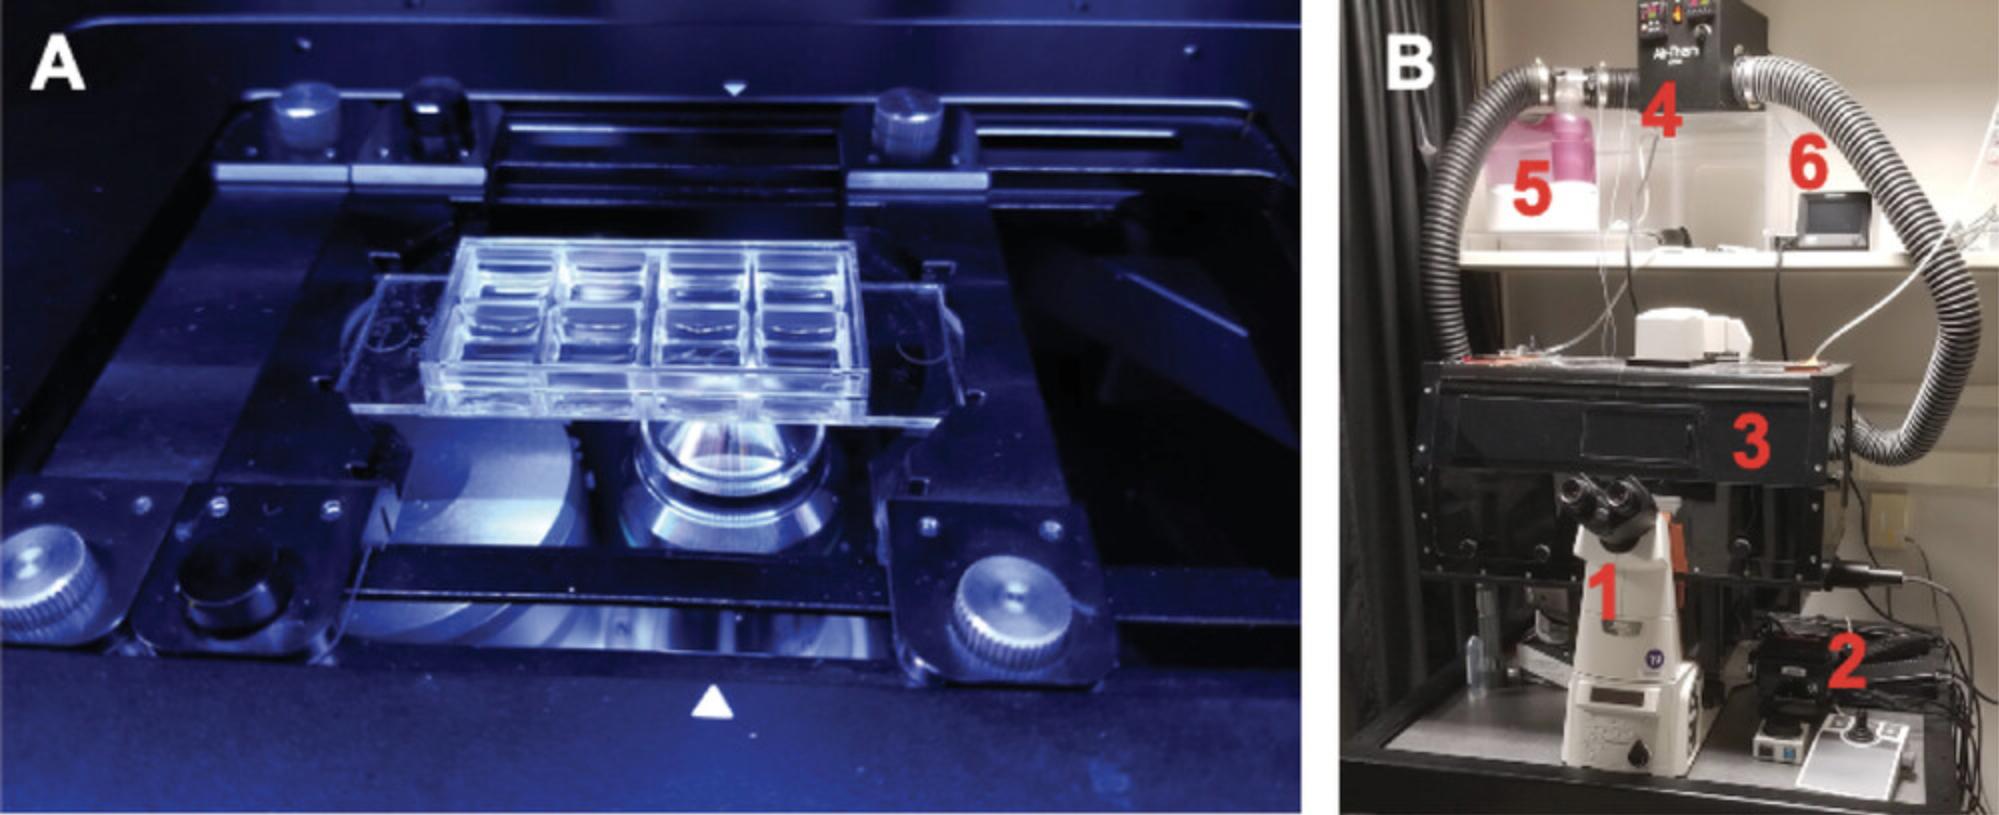
1.Environmental chamber (Fig. 2B): Turn this on in advance to allow the metal and glass components of the microscope to reach an equilibrium.
2.Turn on microscope components, then open the software.
3.Bring your prepared samples into the environmental chamber and insert them into the sample holder in the proper orientation. In addition, bring your imaging medium containing the PMA or PMA plus agonists/antagonists into the chamber so there is no change in medium temperature when adding it later.
4.Prior to searching for your cells, it is best to set up your autosaving ahead of time (if available). Create a new folder in the data named by the date (we use a year-month-day order, so all files are in numerical and chronological order). Name the experiment file using the date followed by annotations (for example 200701neut-pma-15, etc.) to depict the experiment type. This will help identify files for analysis later. However, keep these short (under 100 characters). Windows can often have issues transferring files with long names.
5.Next, begin to search for your sample.
6.Before setting other positions for imaging, it is best to set your imaging channel properties. Start with your exposure time at 200 ms and a low light intensity, preferably below 5%. Be sure to have a signal-to-noise ratio (SNR) of 50 or greater for both the Hoechst and the SYTOX Green channel. A low SNR value can lead to poor data analysis. See the section below describing how to calculate quickly and achieve a good SNR.
7.Now you can set the other positions.
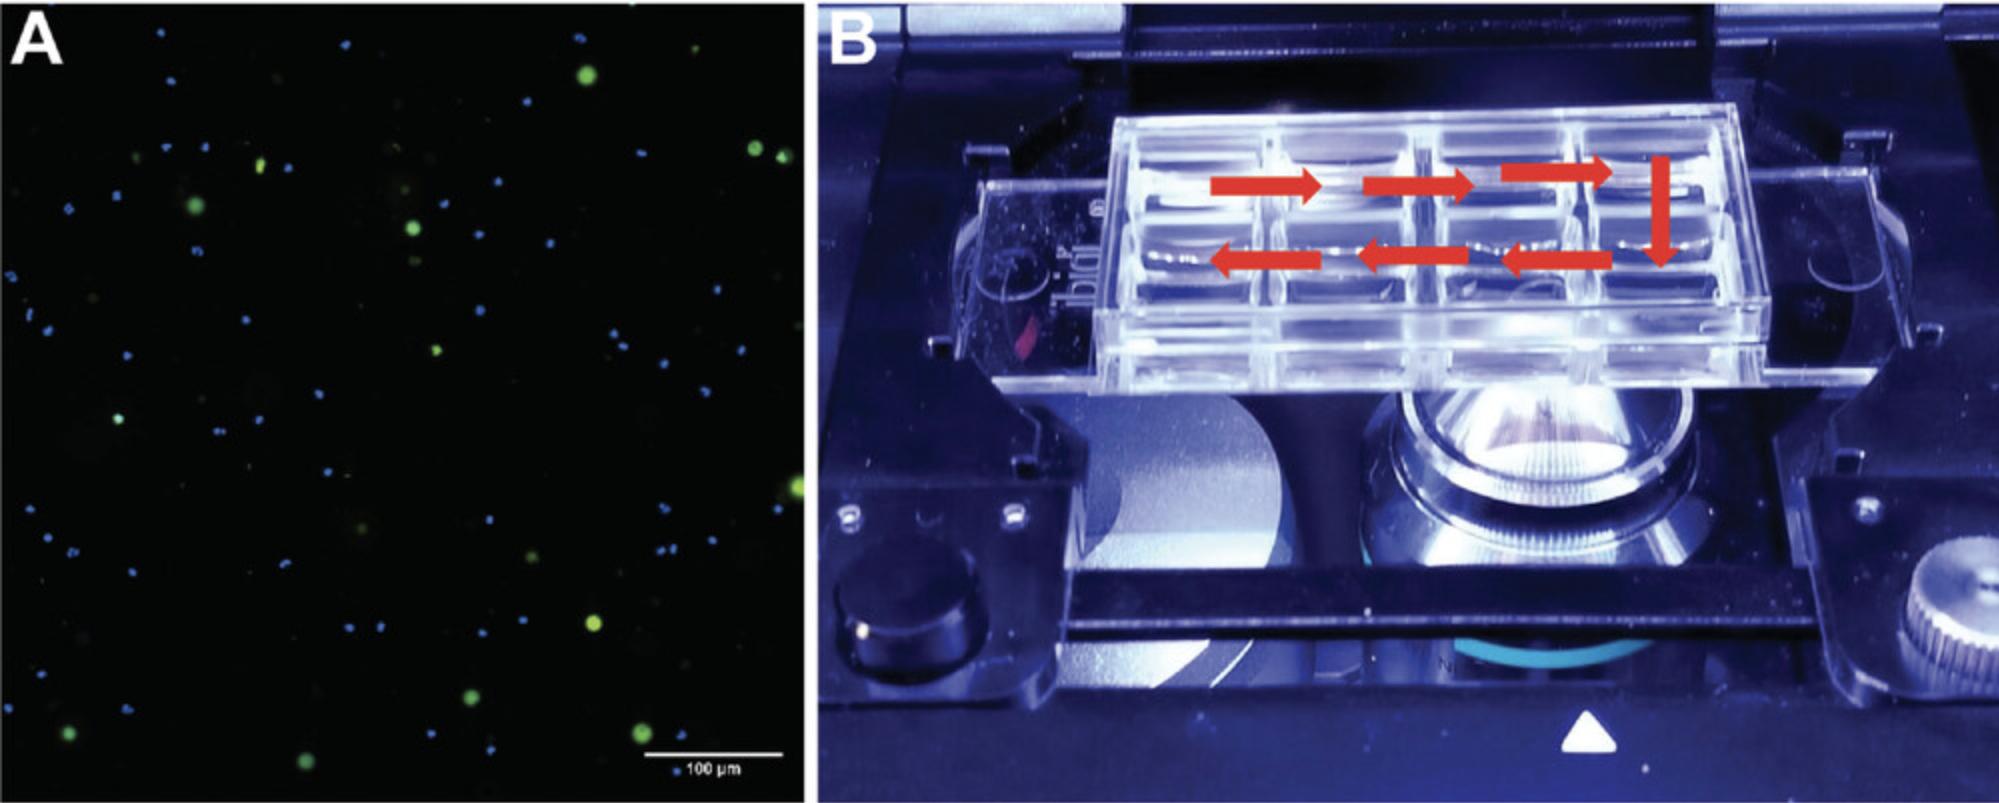
8.In some software (such as Nikon NIS-Elements and Zeiss Zen), positions can be saved separately, generating one file for each position. We suggest applying this prior to starting acquisition. Alternatively, it is possible to tile a single position in each well (2 × 2 for example). If applying this tactic, it is recommended that each tile be separated after acquisition.
9.Set the time series for the appropriate amount of time or frames (here 5-hr) and the delay between timepoints (here 5 min). You may find that your experiments require fewer timepoints. Adjust the time delay if you deem this necessary. We do suggest running your experiments longer than you think necessary, since you cannot easily add frames to the end of an experiment, but you can easily remove frames.
10.Before you press the “Run” or “Start acquisition” button, it is crucial to recheck at least one position per well, to be sure that the focus is properly set. Reset the position if necessary. After several frames (3-5), pause the acquisition, remove the chamber lid, and add the PMA. Carefully replace the chamber top and continue the acquisition. Because issues often occur in the early timepoints of a time series, such as thermal drift, that require resetting of Z positions (most software packages will allow these adjusts when the software is paused), check your sample once during the first 30 min after adding the PMA.
Image acquisition: Setting your imaging parameters to achieve good signal-to-noise ratios (SNR)
Key to image analysis is achieving a high SNR. If you are new to imaging, getting an appropriate SNR can be frustrating, especially with live samples. Here we define the SNR in the simplest manner: dye brightness divided by the background or black area of the image. With a camera-based widefield system, there are two ways to effectively enhance your signal: exposure time and light intensity. Because these samples are living, it is best to follow the “slow and low” principle by imaging more slowly (longer exposure time) and using lower-intensity light so as not to cause premature apoptosis. Because every microscope system is different, we recommend starting with a low light intensity (5% of total output) and an intermediate exposure time (200 ms). The minimum SNR should be greater than 50 for optimal widefield imaging. In contrast, confocal microscopy requires a far lower SNR (10-20) due to the blocking of out-of-focus blur The best way to quickly test this when setting up is to take a snapshot of the sample and set the image histogram (also known as a look-up table or LUT) to your minimum and maximum intensities (see Fig. 4A and B). The histogram shows the frequency of a specific grayscale intensity value that appears in the image. For the samples used here, the highest frequency (Y-axis) in a fluorescence image with a low cell population can be considered the background, while the highest intensity (X-axis) is the signal. Ultimately, what tells you if your settings are appropriate is whether the data can be analyzed. If your sample requires a long exposure and high light intensity, then you may need to increase the amount of dye prior to imaging.
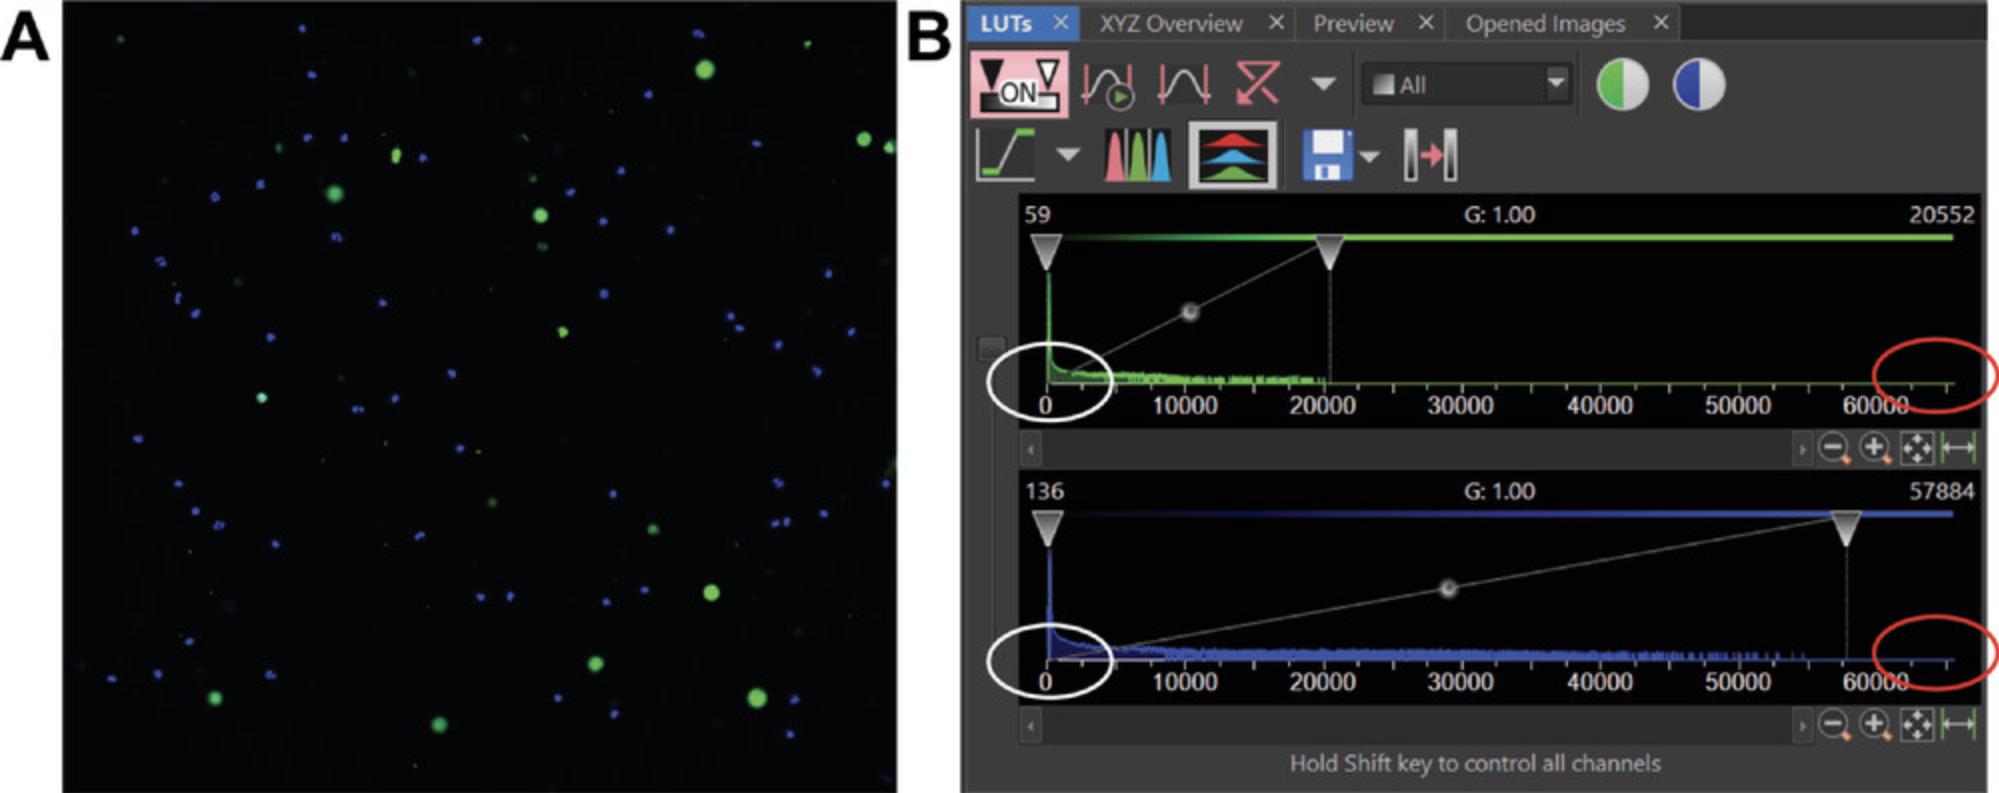
Image acquisition cheat sheet:
1.Turn on the environmental chamber heater and humidifier 2-3 hr in advance of imaging (3- min to 1 hr if using a stage-top plate).
2.Turn on microscope components and open software.
3.Insert sample in the proper orientation.
4.Set your data to autosave and add a new folder with the current date. Name the experiment using date and experiment type.
5.Find sample via Hoechst imaging channel using low light levels (10% or less power). Once the surface is found, set autofocus for ease of lateral movement.
6.Set imaging channel properties: exposure time, light intensity, binning. Be sure to have a signal-to-noise ratio of 100 or greater for each channel.
7.Set the XY stage movements to displace by one entire chamber. Set 3-4 positions per well with autofocus engaged. Alternatively open a series of preset positions using the first image at 0, 0.
8.Set the acquisition to separate different positions; split tiles at the end.
9.Set the timer series for the appropriate amount of time or frames (here 5-hr) and the delay between timepoints (here 5 min).
10.Start image acquisition. After several frames (3-5), pause the acquisition and add the PMA. Carefully replace the chamber top. Continue the acquisition.
Basic Protocol 3: ANALYSIS Of NETosis AND APOPTOSIS DATA
Once you have collected the two-channel, Hoechst, and SYTOX Green, you can start with our analysis methodology. These measurements could be calculated manually with almost any imaging software. However, here we use Fiji (ImageJ2) to align, create a “NETosis only” channel through image subtraction (described below), concatenate data in hour-specific increments, “threshold” or mask the images, analyze the cellular data using particle analysis, and then finally output apoptosis and NETosis-specific tables and image stacks. The macro will require a very basic understanding of coding to possibly change certain aspects of the code to adapt the analysis to your microscope setup. We will walk you through the different aspects.
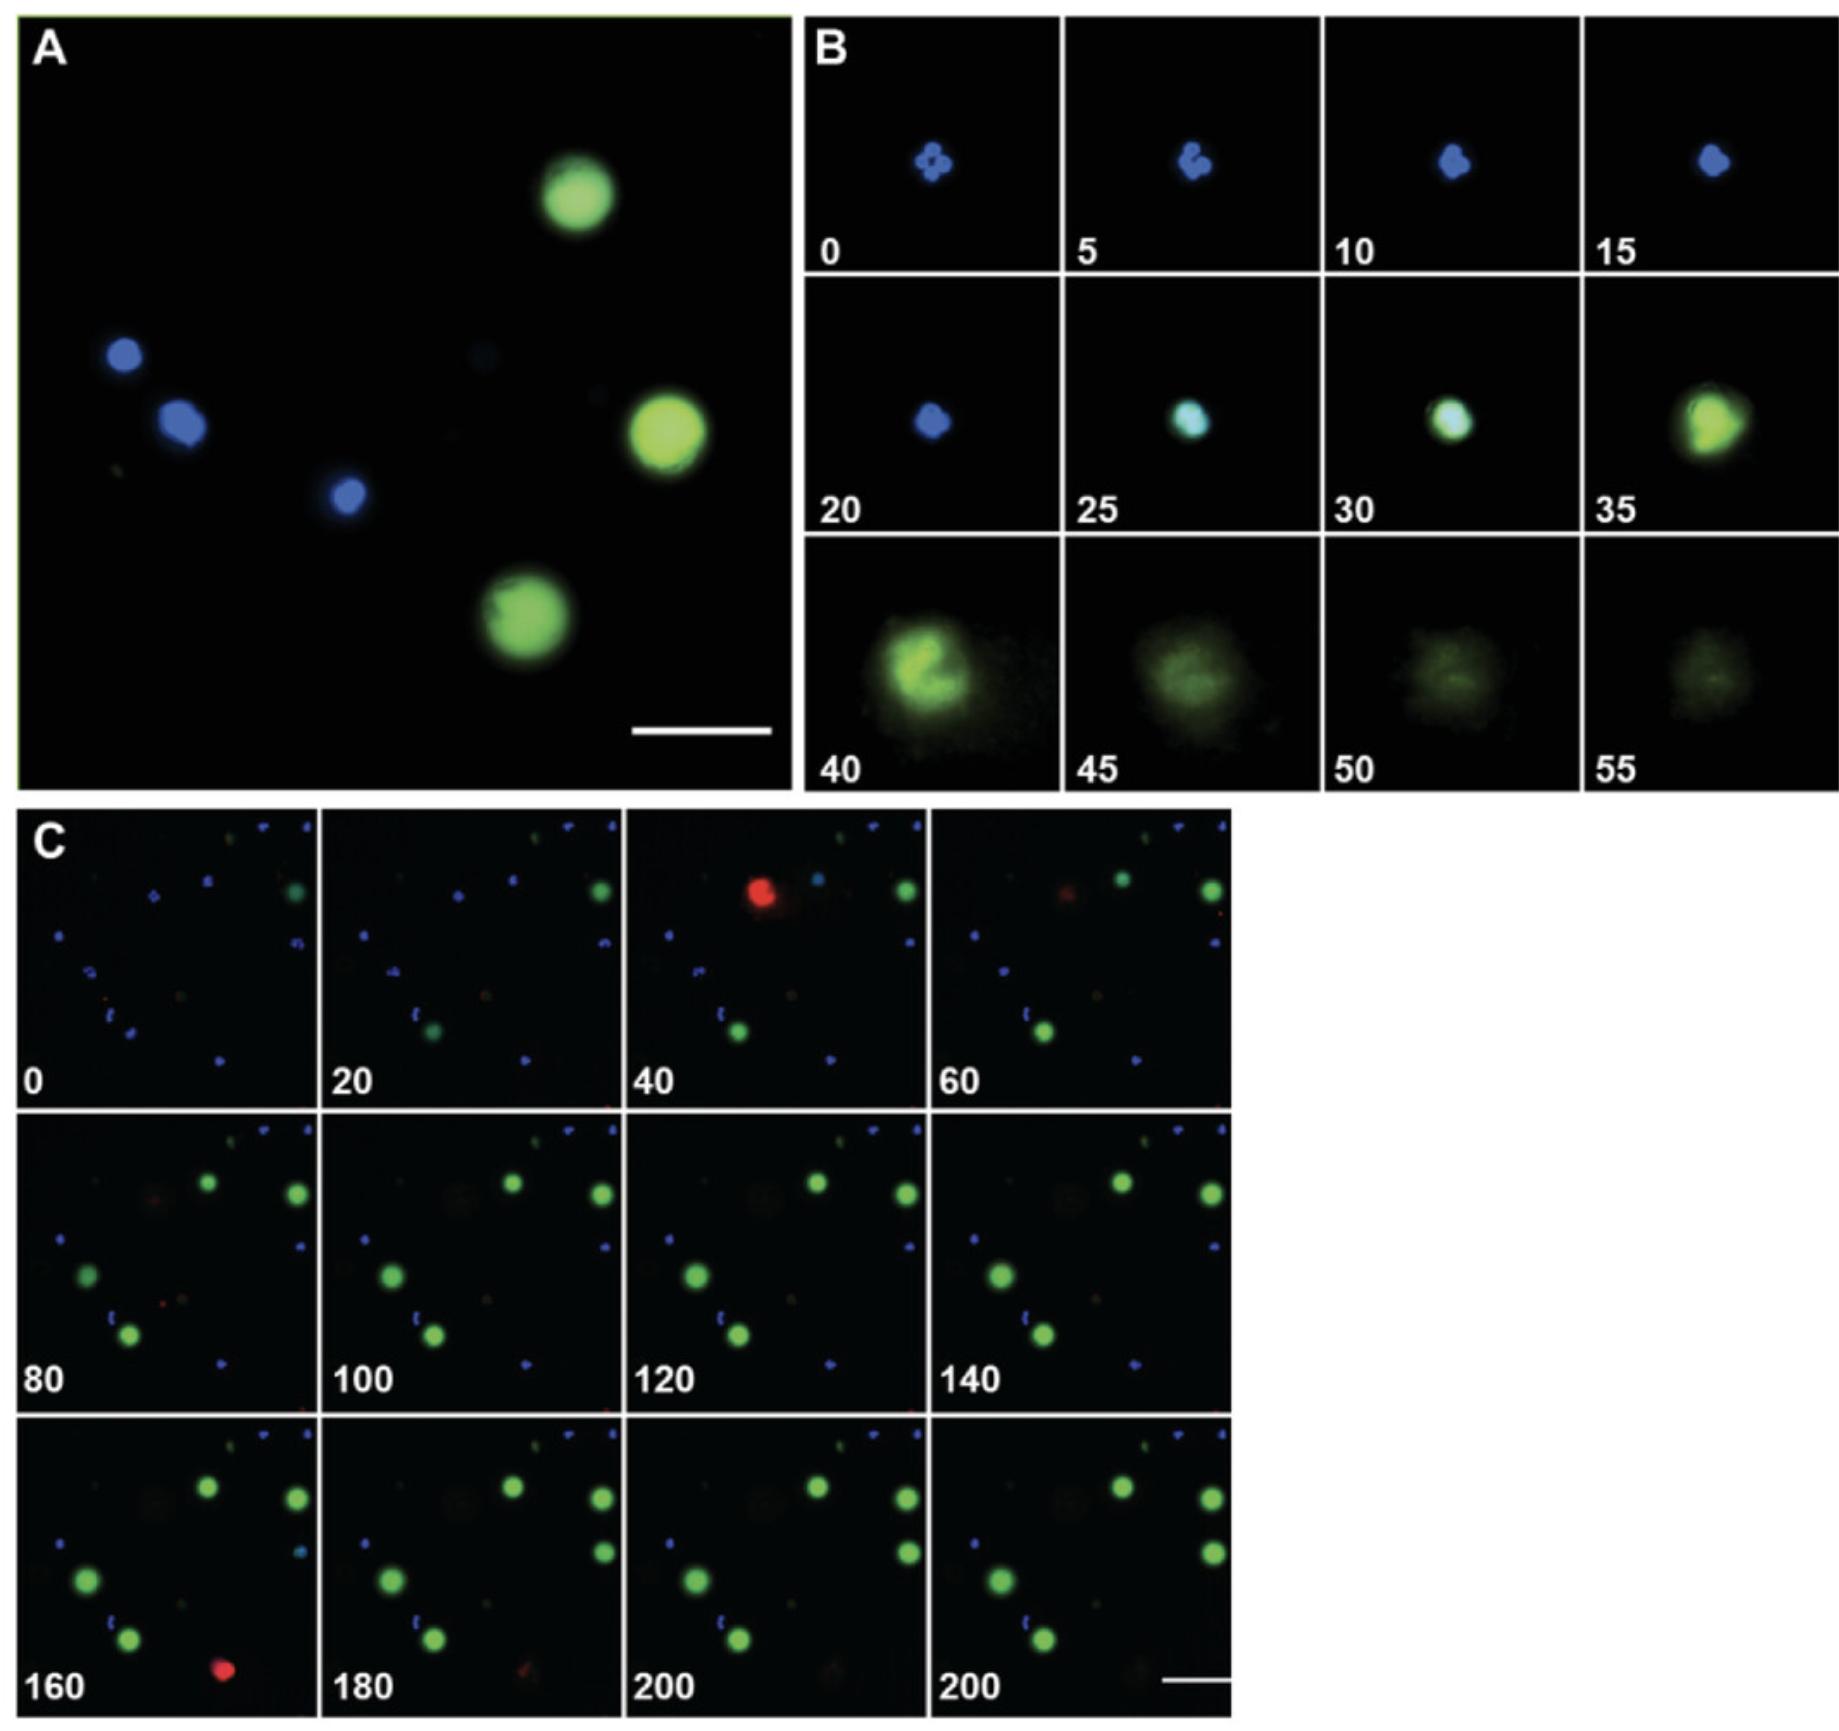
First, we will present a general explanation of our methodology for separating the data into NETosis and apoptosis data sets. The principle is based on how the SYTOX Green dye associates with neutrophils under each condition. During apoptosis, the cell membrane becomes permeable, allowing the SYTOX Green dye to enter and accumulate, leading to increased local green fluorescence that is maintained until the end of the imaging experiment. These “green spheres” are approximately three times the diameter of the nucleus or Hoechst channel, and are spherical in nature (Fig. 5A). In contrast, neutrophils that undergo NETosis initially become permeable, increasing their uptake of SYTOX Green, and fluoresce as a sphere, then “explode” into an irregular shape after which the fluorescence subsides and disappears (Fig. 5B). Owing to the fact that (1) the apoptotic cells remain fluorescent until the end of the experiment; and (2) the NETotic cells disappear, the final image in the SYTOX Green channel can act to subtract away any apoptotic neutrophils, assuming that the cells have not changed position. Furthermore, these populations of cells can be visually separated as shown in Figure 5C.
Prior to using the macros, you will have download and install Fiji and load the macro(s). Please see the Support Protocol for how to do this and set up Fiji appropriately. Several macros are given with this protocol: (1) “Multi-D-conversion ” will convert files with imbedded multiple positions into a folder; (2) “NETosis Setup” helps with determining several key parameters; (3) “NETosis-alignment” automatically converts and saves an aligned version of the collected data; and (4) “NETosis-Auto analysis” concatenates the NETosis and apoptosis data and saves the data as .csv files. It should be noted that the imaging data should be in a multi-dimensional file type, where the channel, dimensionality, and all time points are together in a single file and not a series of single tiff files. If your data is not in a multi-dimensional file type (.lif, .nd2, .tif, etc.), you should convert to a multi-dimensional tiff (.tif) using the “Multi-D-conversion ” macro. This should be performed prior to using the alignment and analysis macros. In addition, because it is unlikely that all of the parameters within both the Alignment and the Analysis macros will work the first time with your data, use the “NETosis Setup” macro to help with determining the proper settings. This macro will also help determine if a data set does not meet the standards required for analysis. All macros, a test/example dataset, and analysis spreadsheet can be found at https://github.com/addoyle1D/CPCB_NETosis.
Throughout the following protocol(s), we have color-coded the code as it is normally found in the Fiji macro window. We will highlight in bold letters any text that can be edited out or changed to help with the alignment of the image stacks or the analysis. Directions preceding any part of the code in the macro is green and preceded by // (this functions to “comment out” the following text and is not read when the macro is run).
Multi-D-conversion macro
This macro will automatically convert multiple file types into the common multi-dimensional tiff version used most frequently by Fiji. During acquisition, many company's file types (.nd2, .lif, .nd, and .czi) can have multiple positions within a single file. These need to be separated prior to alignment and analysis. This can be done individually using the Bio-Formats import function (see Support Protocol, step 4) as well. The macro does the conversion without opening the file, taking up less RAM. We suggest running this overnight or when you do not need to use Fiji, since it does not allow other Fiji processes to function.
1a. Open Fiji. In the “plugins” dropdown menu, select New >Macro. This will open the Macros editor window (Fig. 6). Select File >Open. Select the “Multi-D-conversion ” macro wherever it was saved. We recommend creating a shortcut to the folder on the desktop but saving it on your data drive.
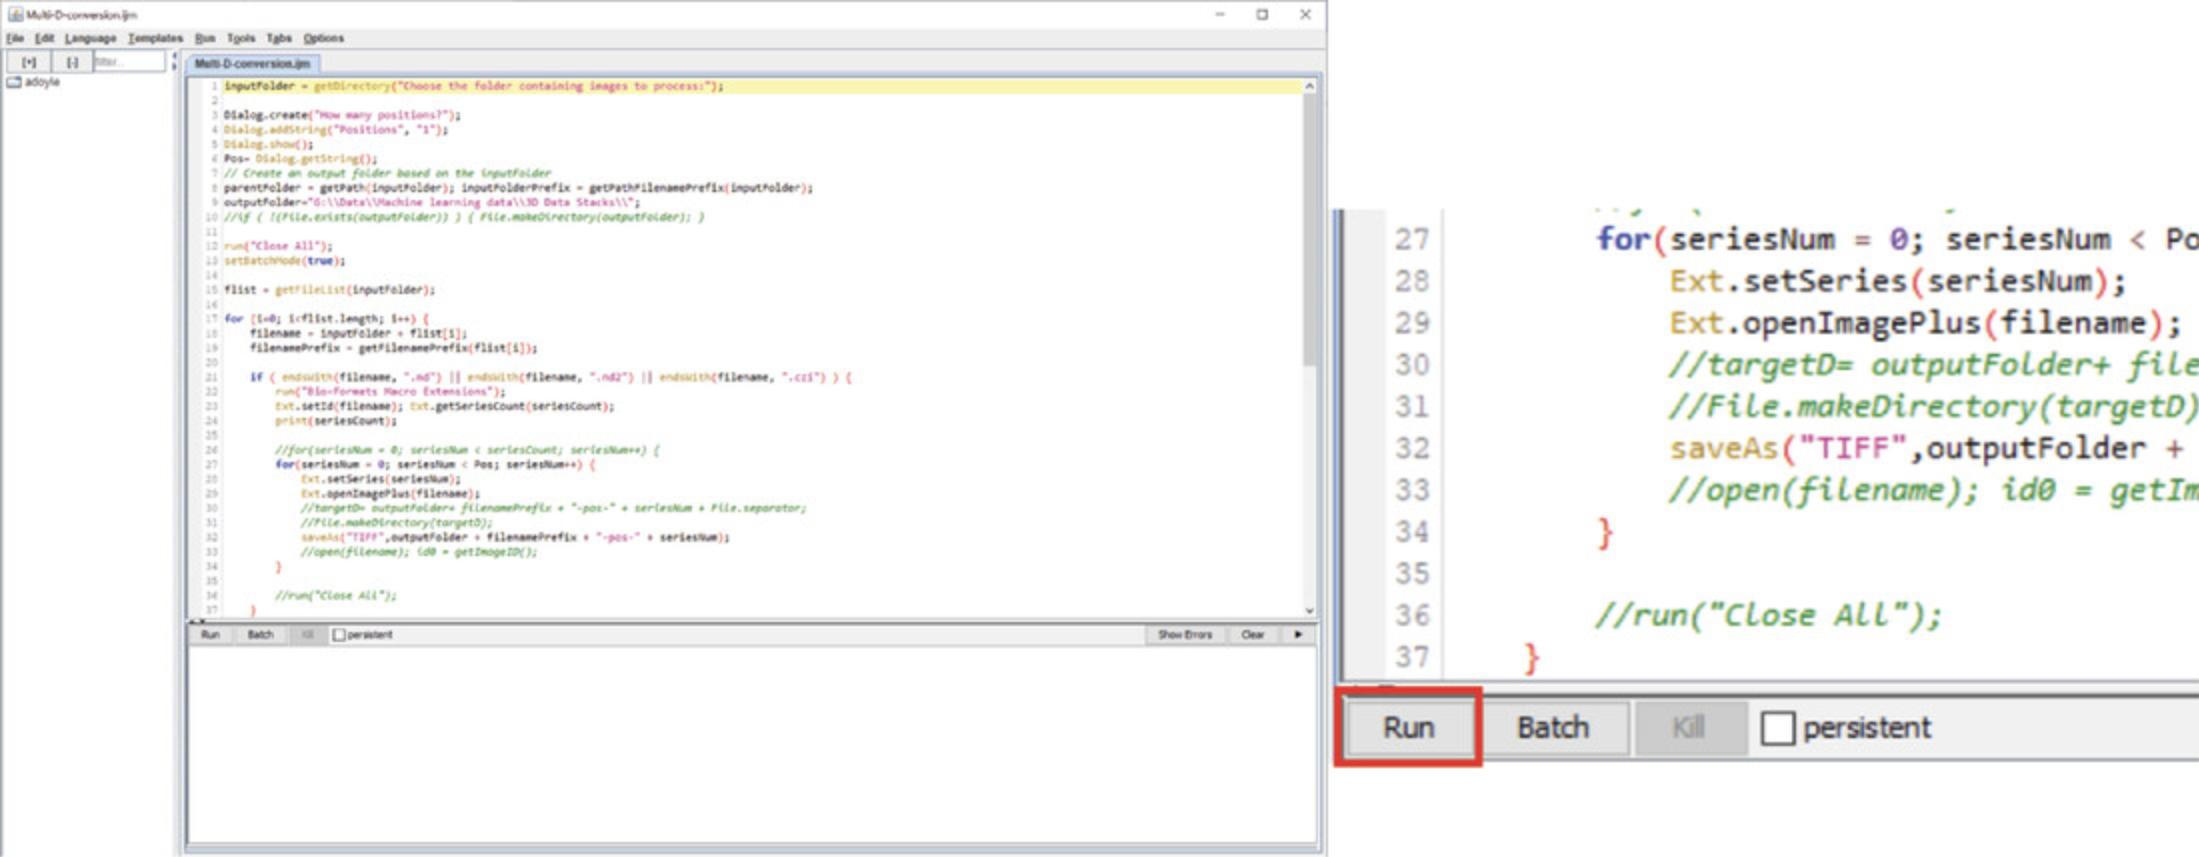
2a. Press “Run ”.
3a. A loading window will ask “Choose the folder containing images to process :”. Choose the folder containing the image data of interest.
4a. Next, a window will ask “How many positions? ”. Enter the number to indicate this. If it is not known, enter a high number (50): this tells the script how many times to run. If the numbers do not match, the script will stop when it reaches the last position.
5a. The script will now run, creating a folder based on the input folder (chosen first) plus the text “-splitPositions ”. It will be generated within the input folder.
NETosis setup macro
The setup macro was created to help first-time users figure out the (1) image scaling, then test the thresholds required to accurately calculate the size for (2) nuclei, (3) apoptotic cells, and (4) cells undergoing NETosis. The macro will ask you to pick or test different thresholds to mask the image of interest, and will save the data examples and a log file that can be reference in the future when changing the Alignment and Analysis macros.
1b. Open Fiji. In the “plugins” dropdown menu select New >Macro. This will open the Macros editor window (Fig. 6). Select File >Open. Select the “NETosis Setup ” macro.
2b. Press “Run ”. If a “Log” window is currently open please close it prior to running the macro.
3b. A loading window will ask for an Output Direction. Wherever this is chosen, a folder named Setup_Files will be created, and is the site that a log text file will be saved.
4b. When prompted, “Open the NETosis file of interest :”.
5b. Next, a window will prompt you to enter the objective magnification and the camera pixel size in microns. This will automatically calculate the proper scaling.
6b. The macro will then create “Nuclei”, “Apoptosis”, and “NETosis” images to test the threshold.
7b. When prompted in a message window, “Test which threshold works to cover the nuclei, then select OK in this window ”. The Threshold window will open (Fig. 7). In the dropdown table, you can test how different thresholds cover or mask the Nuclei image. Once you have chosen, select “OK” in the message window. The “Dark background” box should be checked. A new message window will ask you for the Thresholds name (Otsu is the default). Type the name into the window (red box in Fig. 7), then press “OK”.
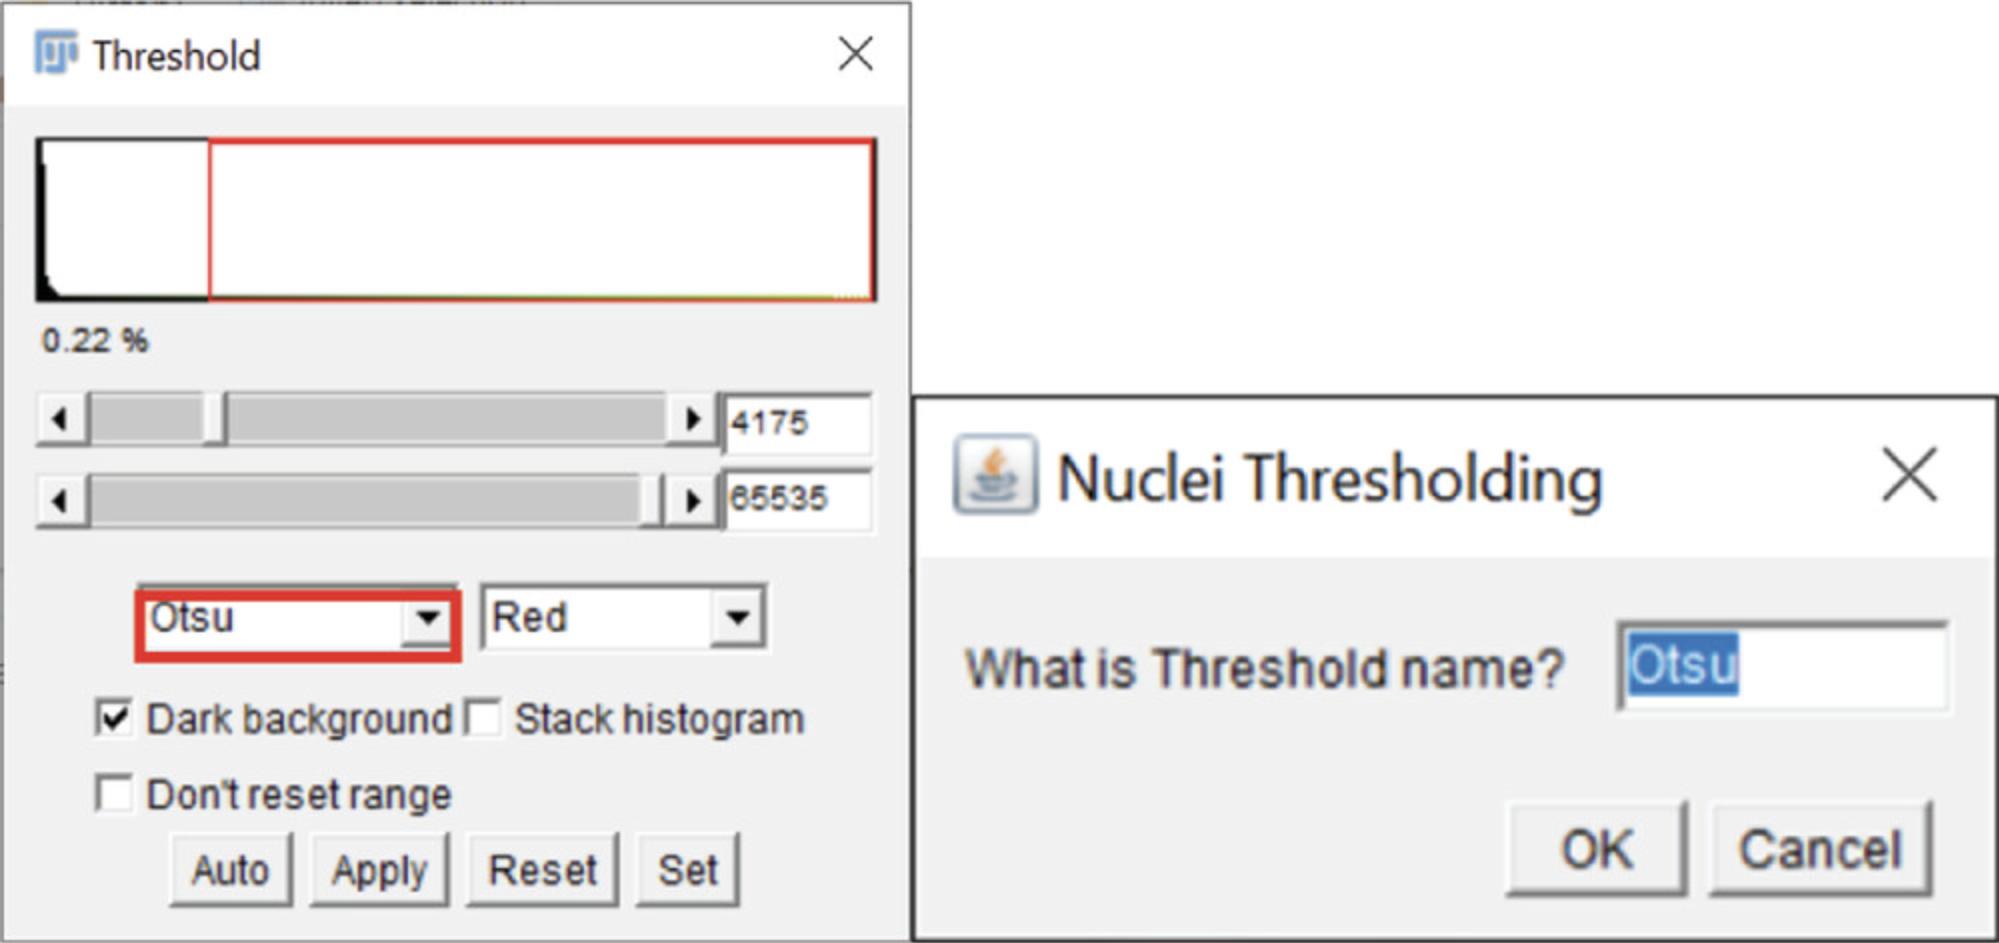
8b. This testing series will occur in a similar fashion for Apoptosis and NETosis conditions. Test and add the threshold name when prompted.
9b. At the end, all images will close automatically.
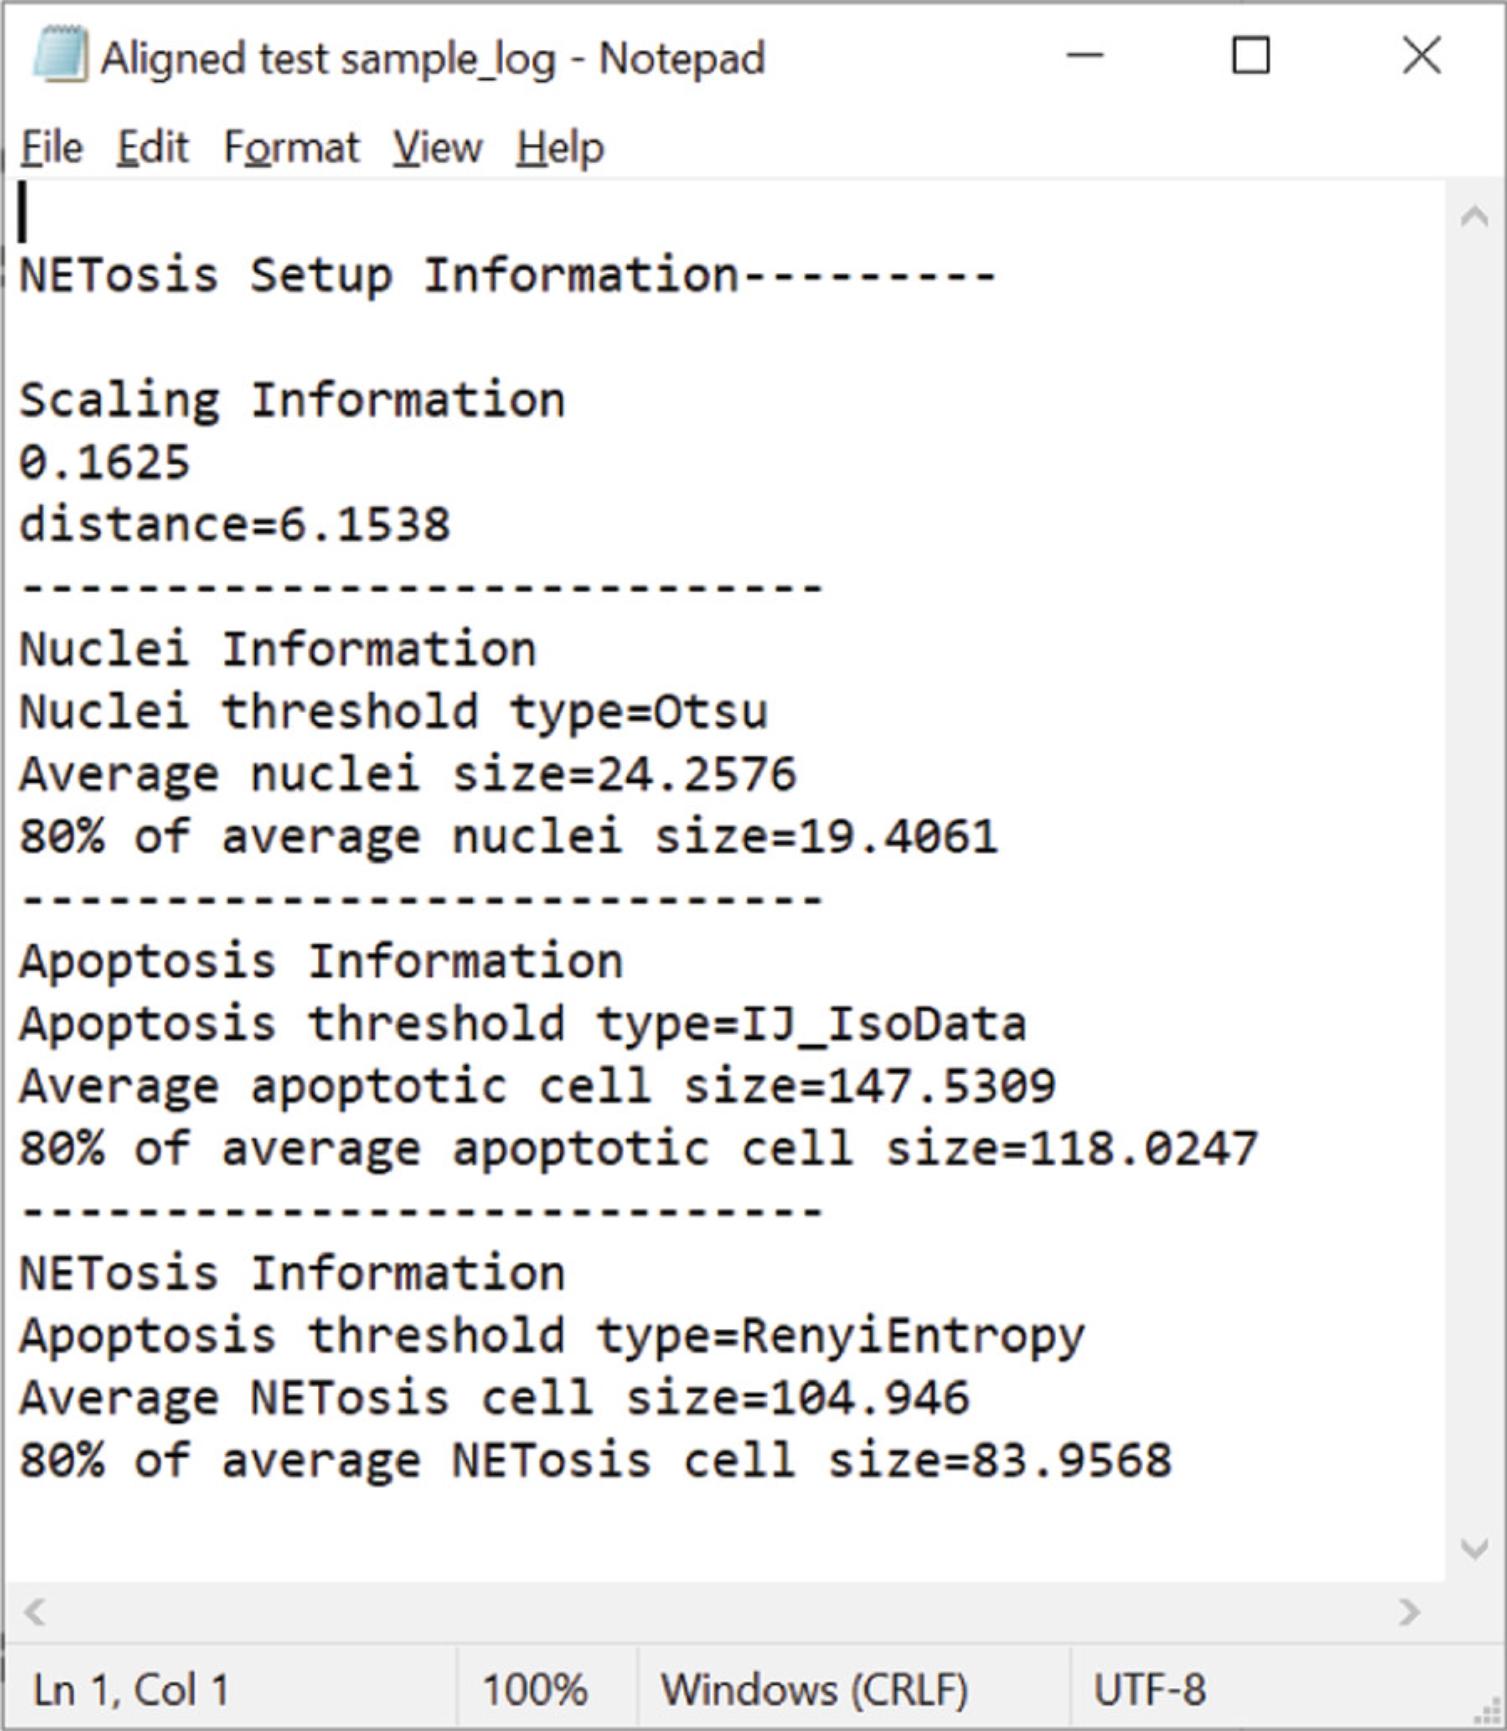
10b. Check the Setup_Files folder. Five files should be created: three masked images that represent the Nuclei, Apoptosis, and NETosis images (prefixed with Nuc_, Apop_, and NET_, respectively), a .csv file that summarizes the size and parameters analyzed for each image, and a log file (Fig. 8). The log file contains the information needed to optimize your analysis in the other macros.
Alignment macro
The alignment macro uses the “Correct 3D drift” plugin in Fiji (found under Plugins>Registration>Correct 3D drift) and applies it to each image stack found within the folder of interest. It creates a folder with the user's input and saves the file, adding a AL_ as a prefix. It is suggested that the user place a single file of interest in a folder and test the settings before performing this on a folder with 3-50 files.
1c. Open Fiji. In the “plugins” dropdown menu, select New >Macro. This will open the Macros editor window (Fig. 6). Select File>Open. Select the “** NETosis Alignment** ” macro wherever it was saved. We recommend creating a shortcut to the folder on the desktop but saving it on your data drive.
2c. Select the “Run” button (as in Fig. 6). As the macro starts, it will ask “** Please select the Input directory** ” and then “** Please select the Output directory** ”. A folder called Aligned_file will be created in the latter directory.
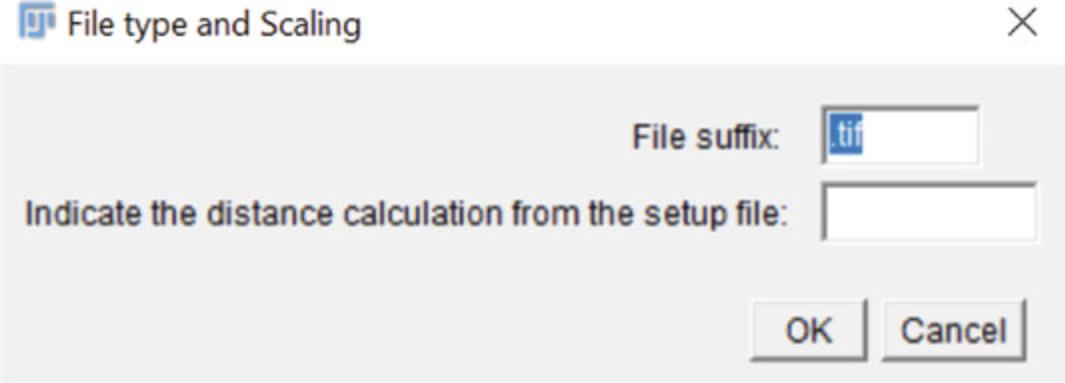
3c. The following window (Fig. 9) will open and ask for the file suffix (default is .tif) as well as the distance calculation from the setup file macro. Enter the proper information and press “OK”. The original image will open, followed by several others that are created to determine the threshold required for proper image alignment.
In the current version of the alignment code (Fig. 10A) Thr is a calculated threshold variable. To account for smaller drifts over time, multi_time_scale or sub_pixel or edge_enhance, or any combination (in this order) can be added, as demonstrated in bold letters in Figure 10B to increase accuracy if you have a slow drift; however, the processing speed is greatly reduced and this can lead to alignment errors if not needed. We recommend running the alignment without any changes initially.
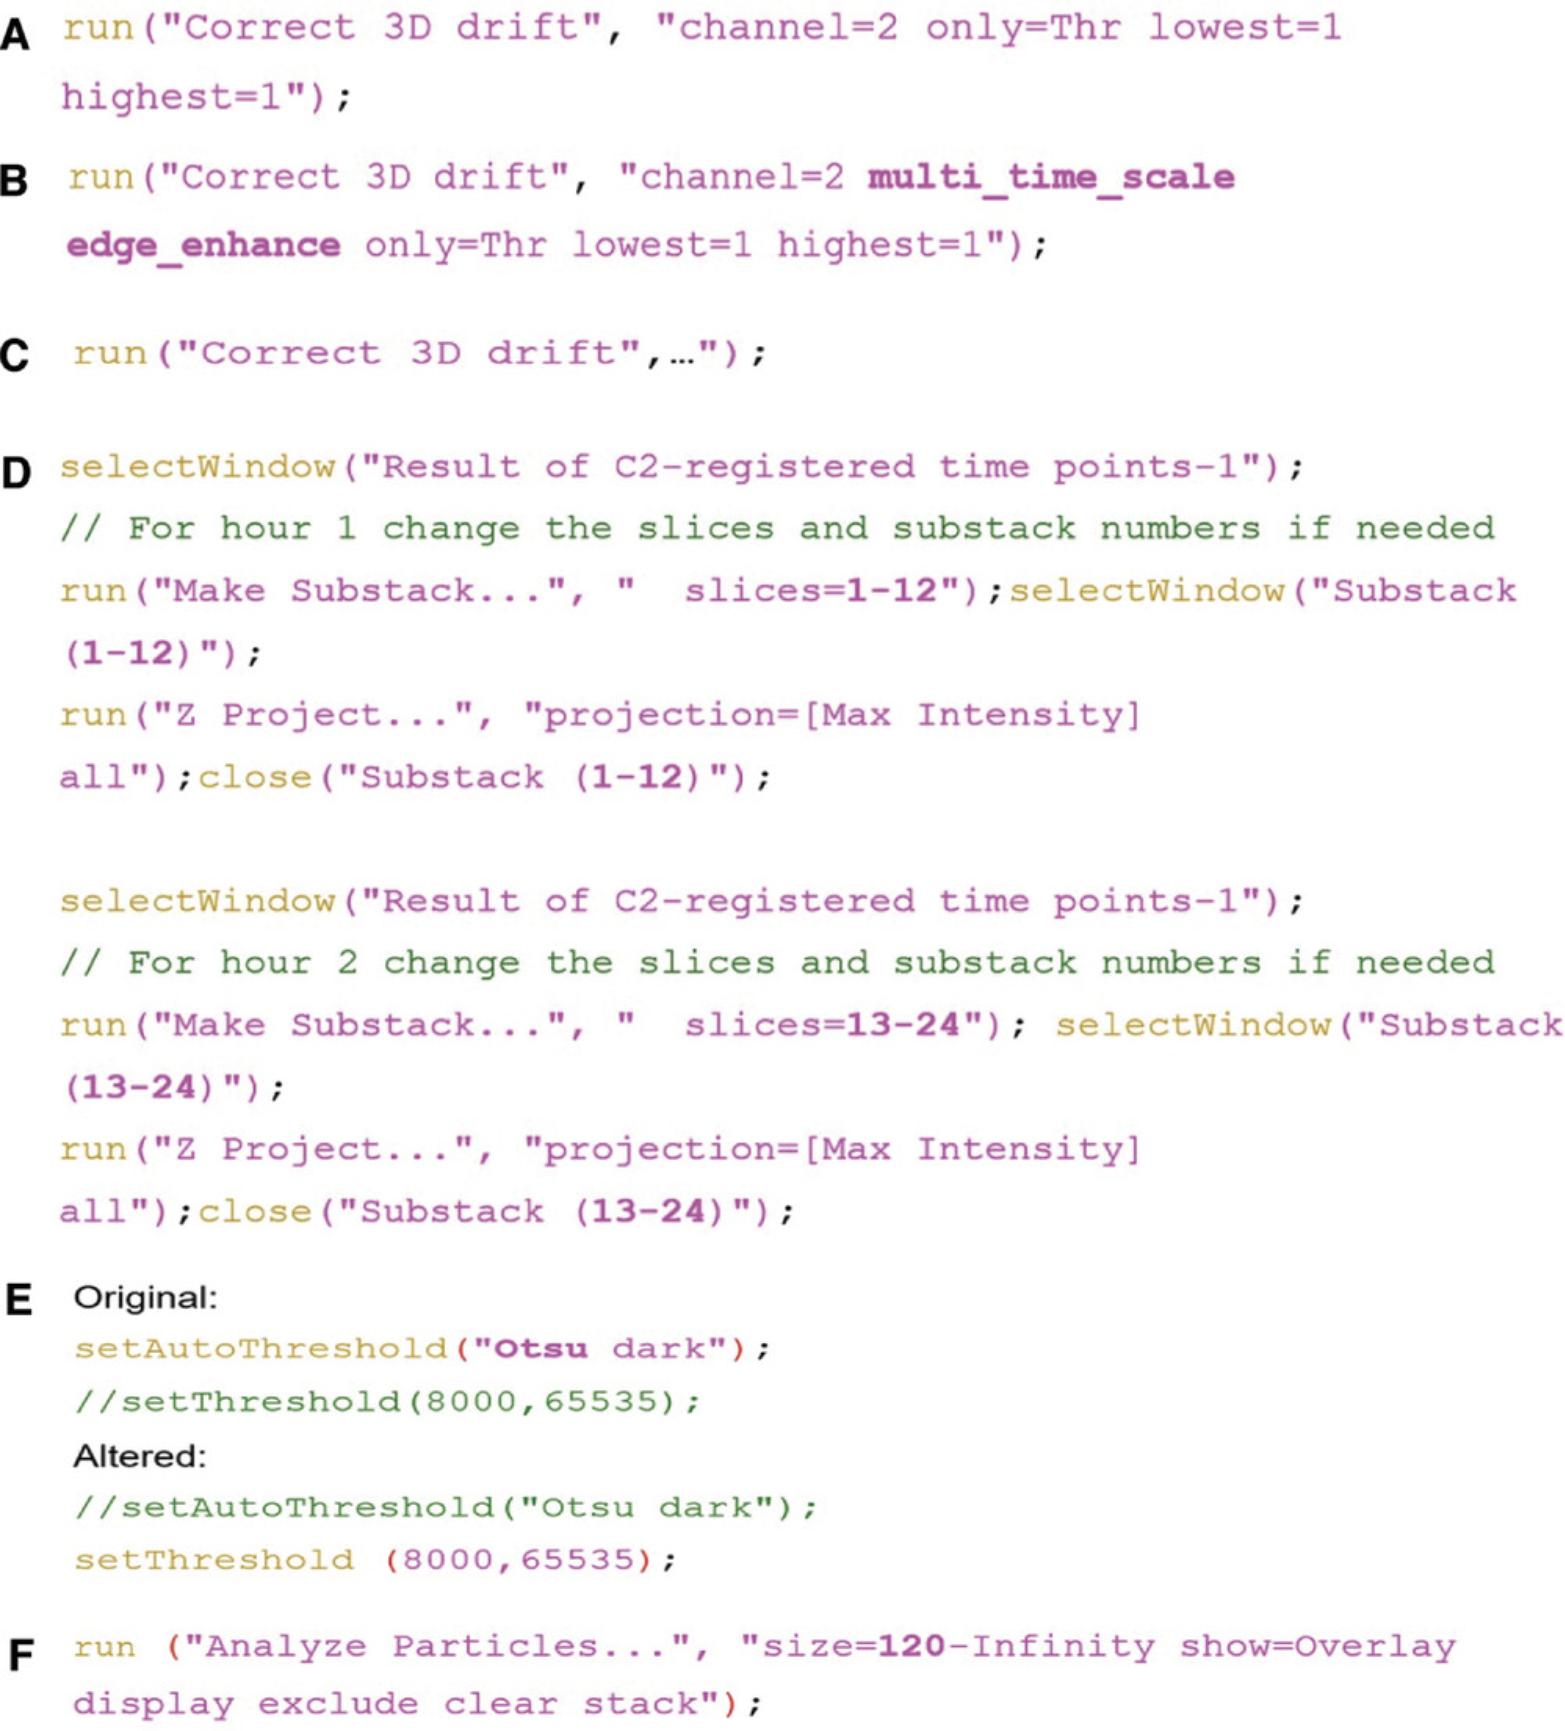
4c. Once a well aligned stack is created, save the Alignment macro (add a _V2 at the end so you do not save over the original). If you are having issues getting the correct settings, open an image stack and then select Plugins >Macros >record. This will record the settings you select in the “Correct 3D drift” Plugin (found under Plugins >Registration >Correct 3D drift). Once a correct alignment is achieved, copy the code (as in Fig. 10C) from the recorder window and paste this over the process in the macro (line 34). Remember to save the macro.
5c. Add the rest of your data to the input directory and process all of your data.
Analysis macro
This macro will run through the aligned image stacks and, as mentioned above, create “NETosis only” and “apoptosis only” imaging channels that are then concatenated into individual hour time periods. .csv files are then generated that can be used to generate graphs in R, Python, Excel, or GraphPad. This code assumes the Sytox Green channel was taken second, after the Hoechst image. If not, we recommend changing the order before this point.
1d. First, the script will tell you to open the file folder of interest and ask where you would like to store the data. A new window will open and ask for the file types to process (.tif) and for you to enter the date of the experiment. The latter will be used to create date-specific folders that will contain _Image-Files and _Data-Files. Next, the script creates a NETosis channel by splitting the channels (Hoechst and SYTOX Green: CG), selects the second channel (CG), and duplicates the final image that will subtracted to create the NETosis channel. The channels are then merged to create a 3-color (RGB) stack where the NETosis channel is red (see Fig. 5C). The merged image is then saved into the “Output Data” folder created where you told the script to store the data.
2d. The current script is set for concatenating data taken every 5 min over a 5-hr time frame, into 5 individual hours. Hence, every 12 frames are grouped together. If your data varies from this, the code will need to be changed. If, for example, you image every 15 min in the code, the frame values would change to “1-4” and “5-8” for hour 1 and 2, respectively. Each subsequent hour (3-5) would need to be changed as well. The code in Figure 10D reflects this (items highlighted in bold letters need to be changed).
3d. Next, the script will set a threshold based on an auto threshold setting. Refer to the Setup log file generated with the NETosis Setup Macro. Change the threshold type based on the indicated threshold type in the setup log file for NETosis, Apoptosis, and Nuclei. The code can be found on lines 71, 107, and 140, respectively. If this threshold does not work with your sample, comment out (using the //) in code for the setAutoThreshold function. You can then use the setThreshold function in the following line (Fig. 10E).
4d. Next, you may need to change the particle size for the macro to correctly analyze the nuclei, NETosis, and apoptosis cells. Again, refer to the Setup log file generated with the NETosis Setup Macro. Change the particle size based on the size indicated for the specific measurement in the setup log file for NETosis, Apoptosis, and Nuclei (Fig. 10F). The code can be found on lines 75, 111, and 144, respectively. We give the actual average and 80% and 50% of the average values to help you determine the correct values. We suggest a value between 80% and 50% of the calculated value.
5d. Once these changes have been made, a test run with 1-3 aligned image stacks can be performed. All Image files will be processed and placed in the _Image-Files and _Data-Files folders.
Support Protocol: INSTALLING Fiji AND SETTING UP AND USING Fiji MACROS
Fiji (ImageJ2) is a very powerful open-source software package initially created by Wayne Rasband at the National Institutes of Health. However, it is now being improved upon by hundreds of developers around the world. Below are several things that must be done for Fiji and the macros we provide to work efficiently.
1.If you do not have Fiji currently on the computer you plan on using, it can be downloaded at the following site: https://imagej.net/Fiji/Downloads. Install Fiji on your C: drive but not in the Program Files folder. This allows the updates to be added without needing administrator access each time.
2.Open Fiji by clicking on the Desktop icon. The program will ask if you would like to update the software. Select “Yes ” then “Apply ” once the updates have been compiled. Shut down and then restart Fiji for the update to be applied.
3.Changing the useable memory : Fiji has default settings for the amount of memory (RAM) and parallel threads that are used during analysis. To do this, open Fiji, then select Edit >Options >Memory & Threads. Here you can change the amount of available RAM and parallel threads. We recommend designating ∼80% of the available RAM for analysis. For parallel threads, this depends on the number of cores your computer has. Multiply the number of cores by 2, and this will give you the amount of parallel threads you have available. If you miscalculate the threads, Fiji will set them at the maximum once your restart the program. Check both the “Keep multiple undo buffers” and “Run garbage collector on status bar click”. If you have changed the amount of memory, you must restart Fiji for the effect to take hold.
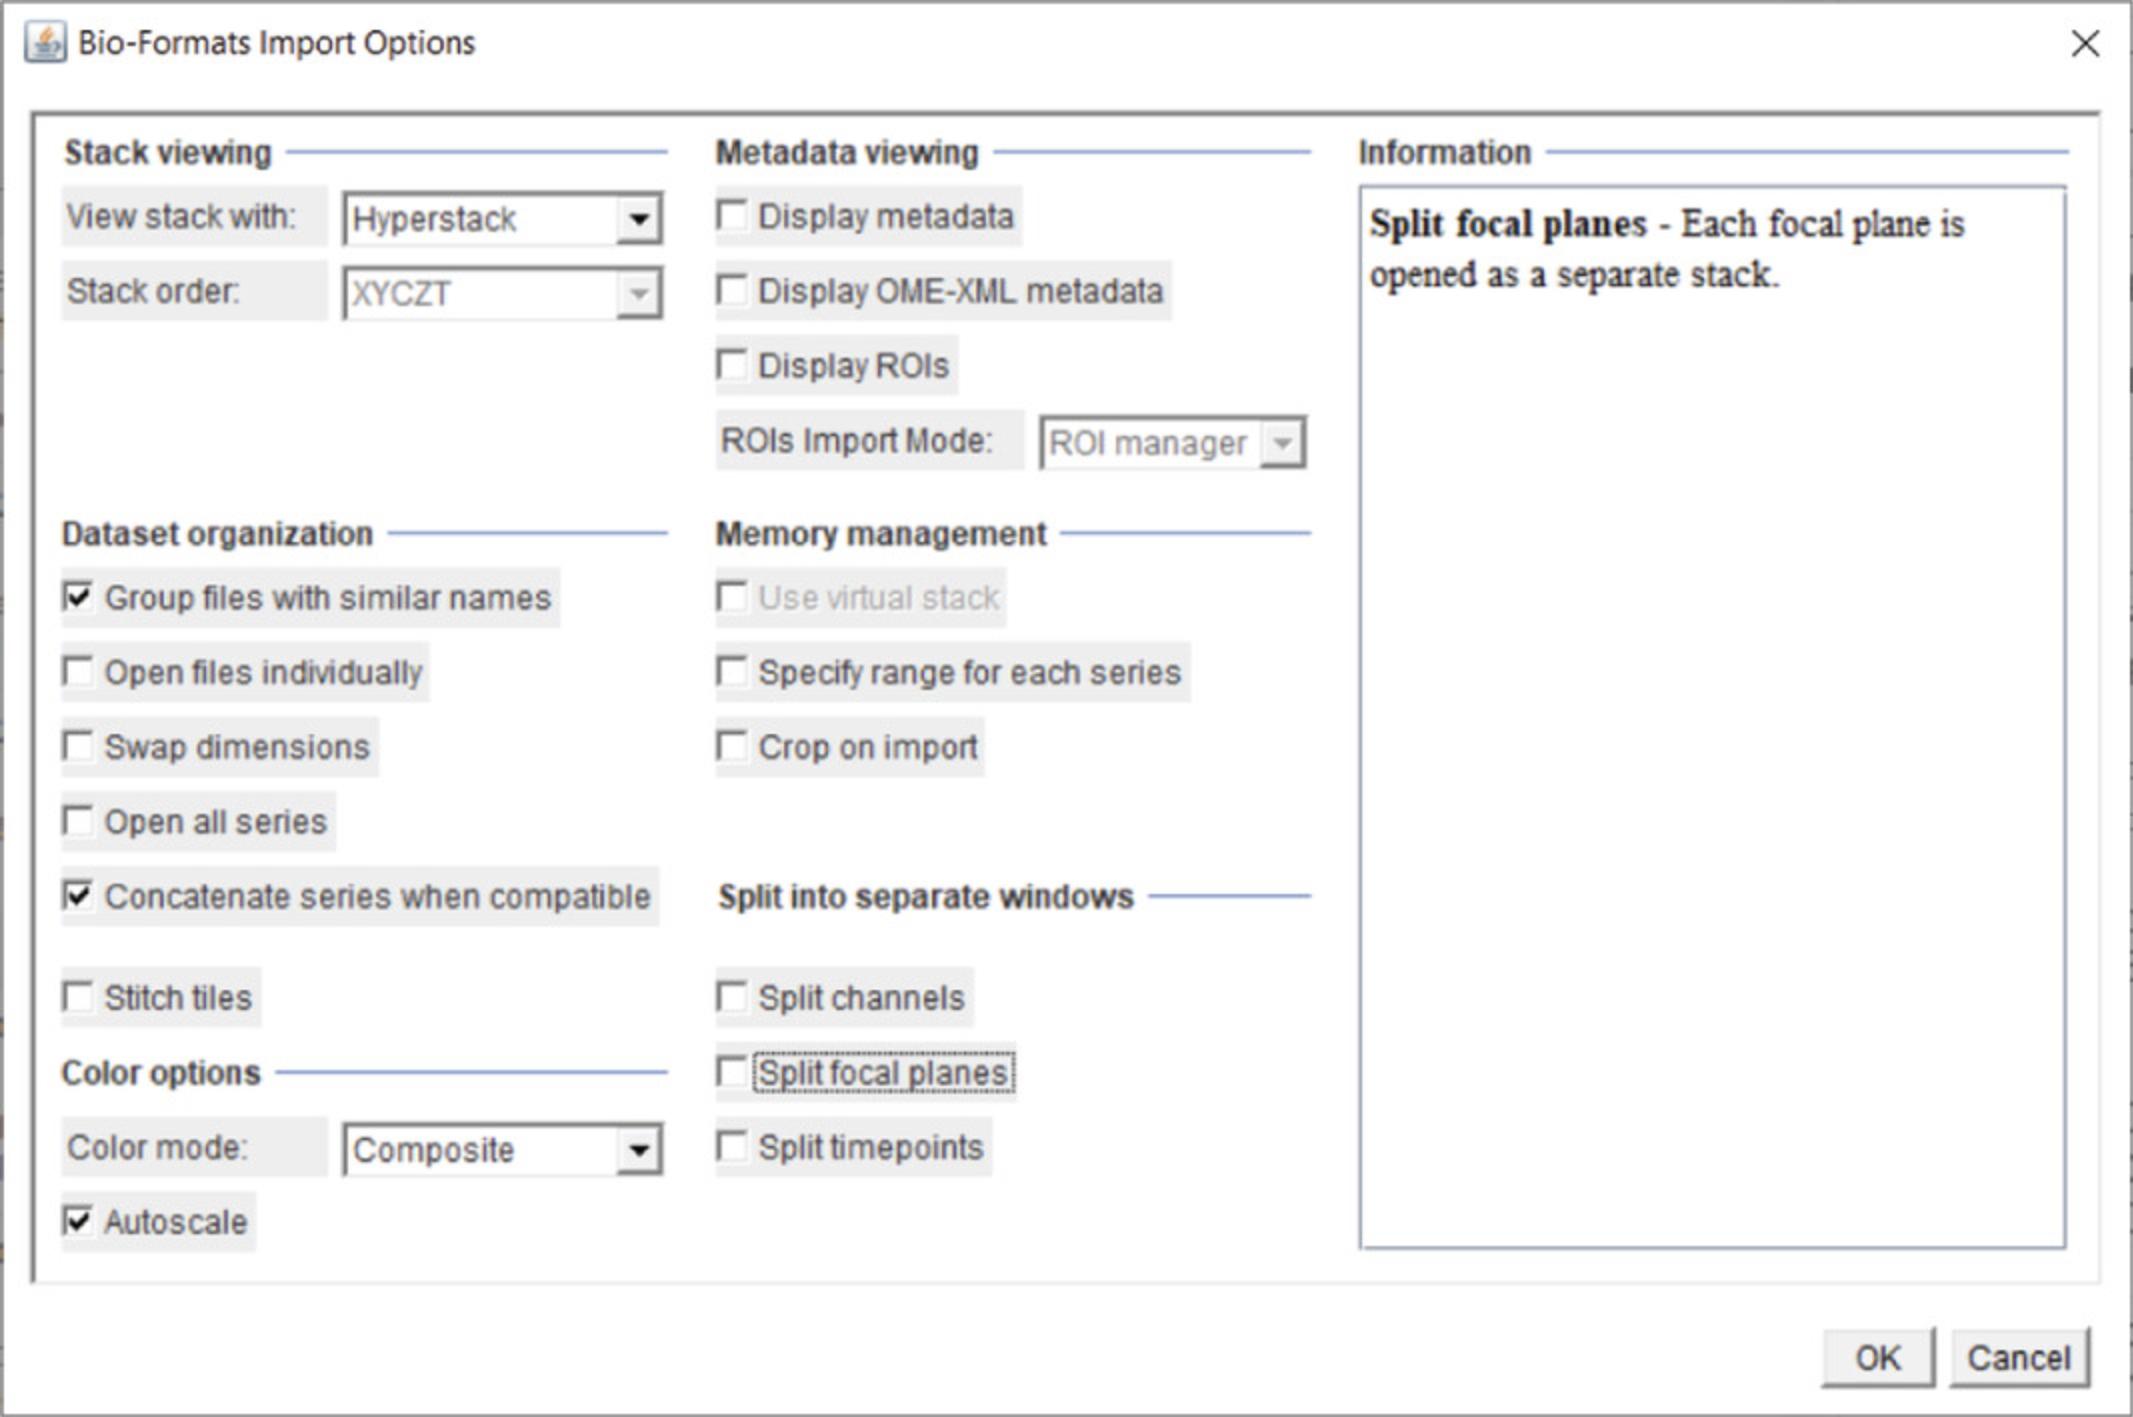
4.Bio-Formats configuration : In order to process multiple files within a single folder without interruption, the Bio-formats import function must be set up properly. First, open your multi-dimensional .tif or .nd2 file using File >Import >Bio-formats. After selecting your file, the “Bio-Formats Import Options window will appear (Fig. 11). To set up the importation properly, set the following:
-
Stack viewing is set to “Hyperstack”.
-
Dataset organization, check:“Group files with similar names”.Concatenate series when compatible
-
Color options should be set to “Composite”, and “Autoscale” should be checked.
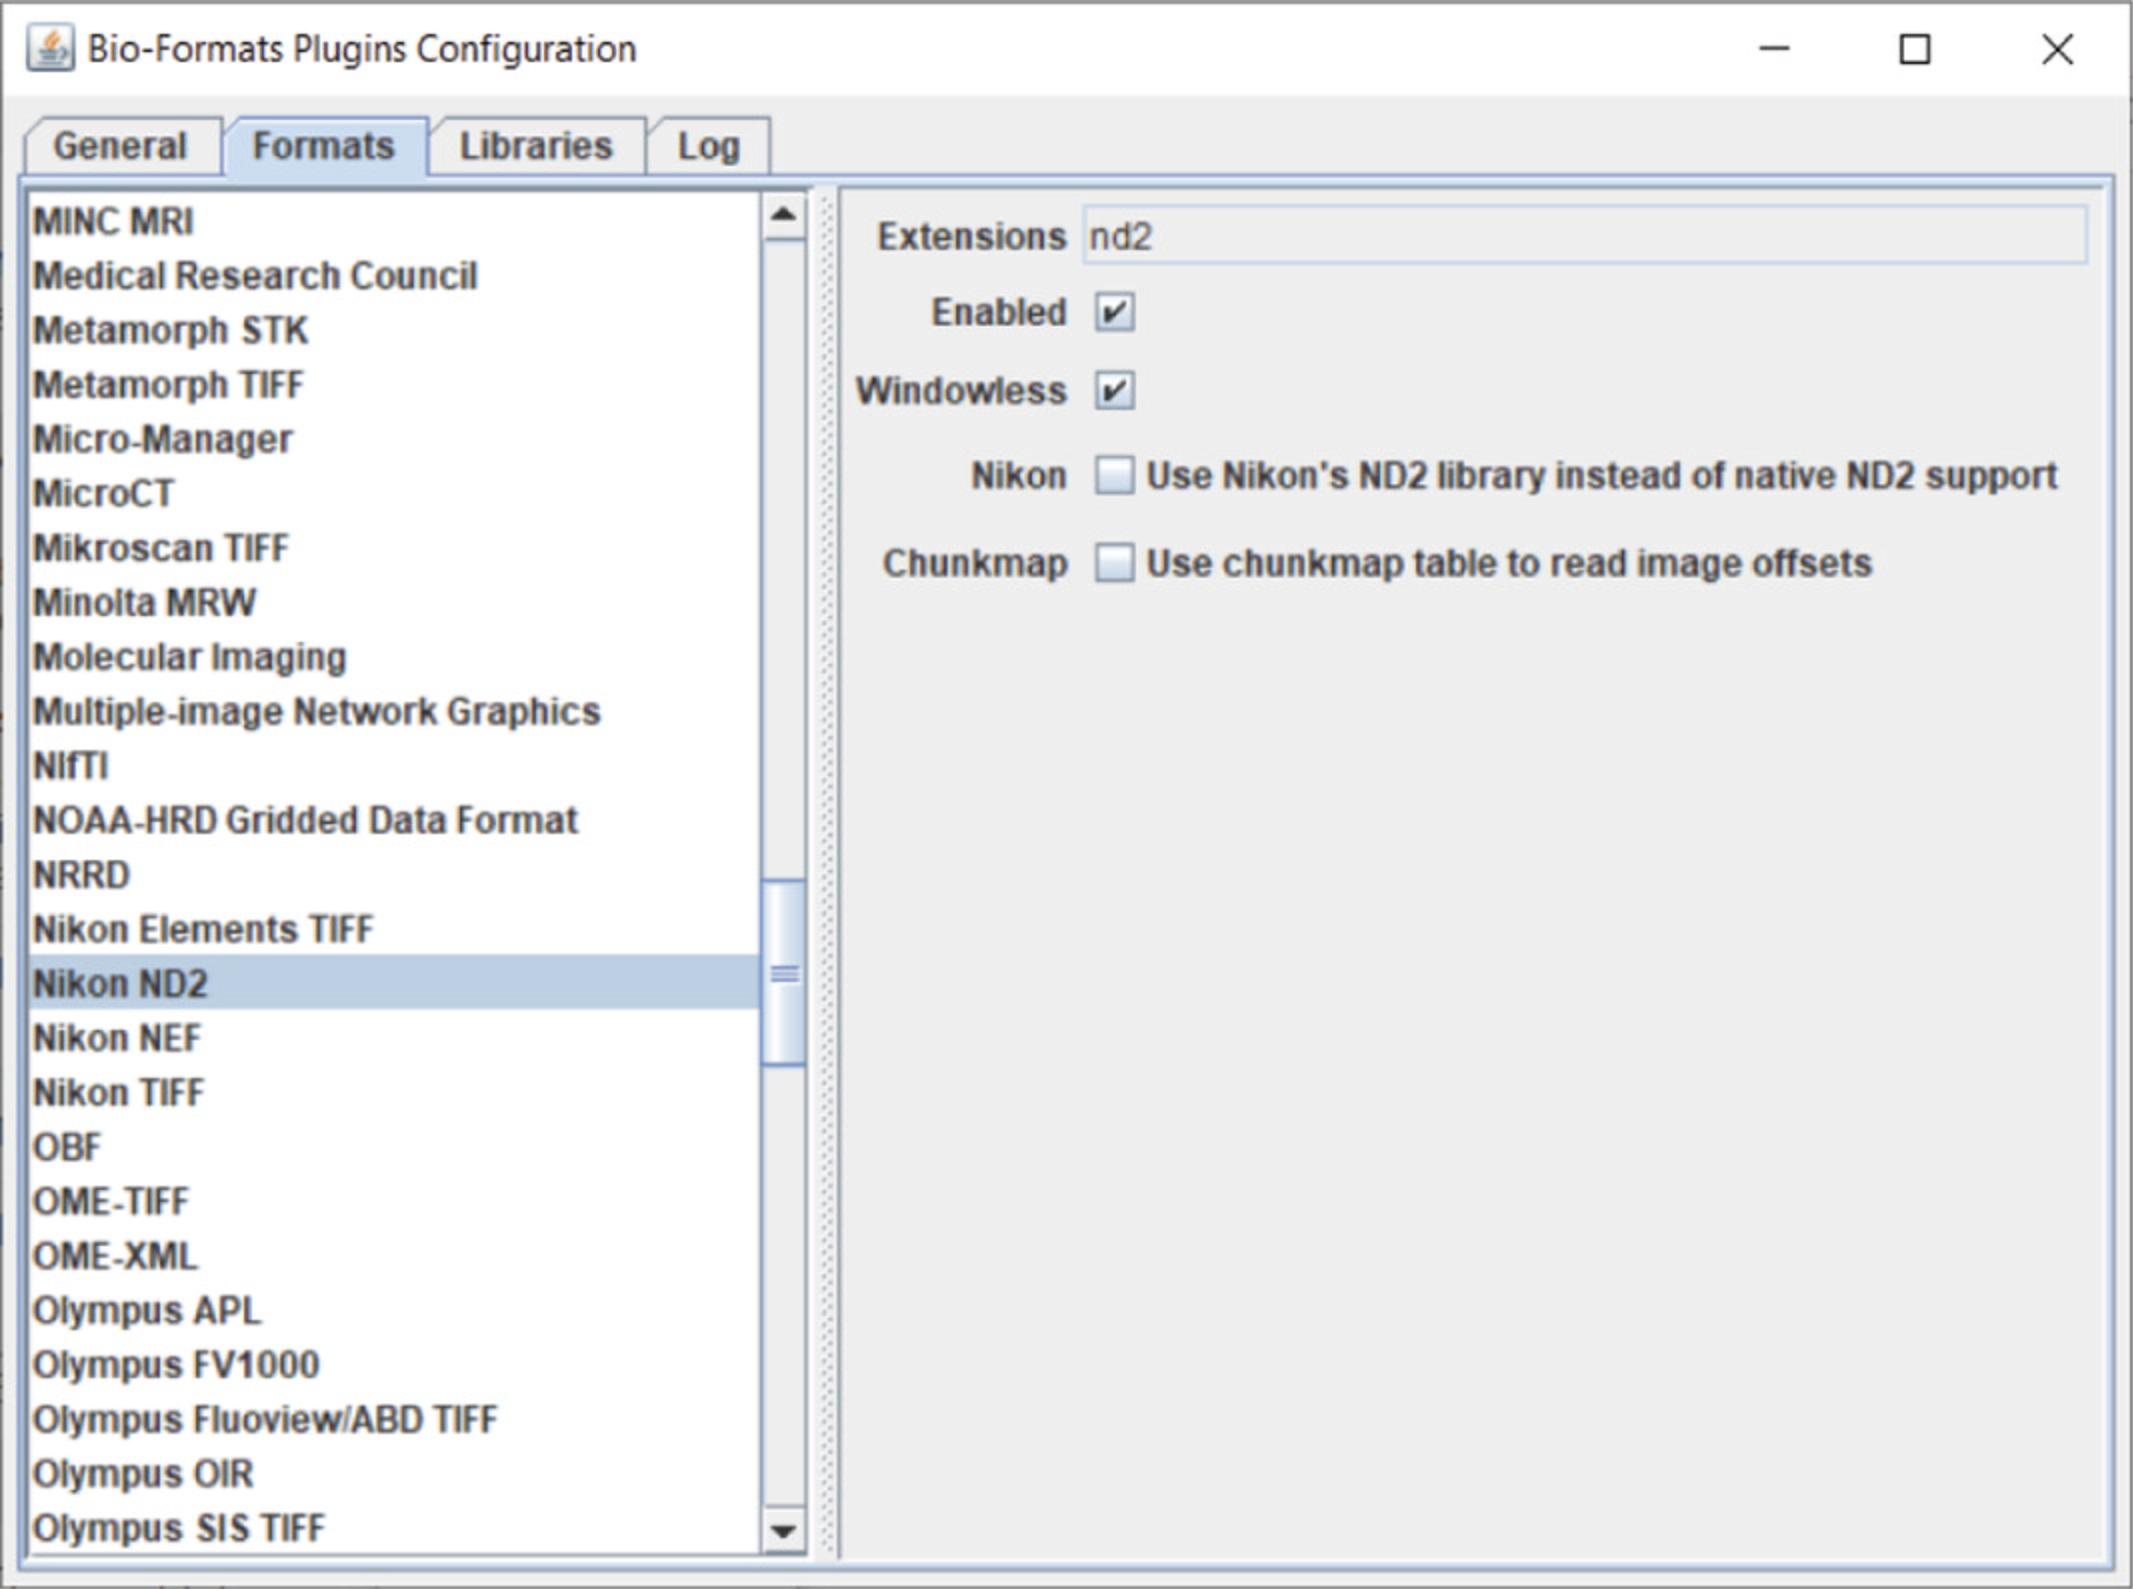
Once the image has opened, open the “Bio-Formats Plugins Configuration” window (Plugins >Bio-Formats > Bio-Formats Plugins Configuration). Select the Formats tab and find your imaging file format (.nd2 from Nikon is shown in Fig. 12) and select it. To the right, there will be several checked or unchecked boxes. Check the “Enabled” and “Windowless” boxes (Fig. 12). “Windowless” allows the imaging format with the last selected settings to be opened automatically.
COMMENTARY
Background Information
Herein, to facilitate the study of NETosis, we present a robust method that uses live-cell fluorescence staining and automatic image segmentation to determine the percentage of NET-forming neutrophils. The DNA-intercalating dye Hoechst is used to determine the number of cells per field of view. As a cell-impermeant dye, SYTOX Green enters the cell upon loss of membrane integrity and binds to DNA, where its fluorescence intensity increases >500-fold, thereby acting as a marker to differentiate dead and live cells. Loss of cell membrane integrity and extracellular DNA release is a hallmark of NETosis and allows us to detect all neutrophils that are undergoing death either by NETosis or other means. By combined analysis of the shape and size of cells stained with SYTOX Green, we have designed an automated technique to determine the percentage of NETosing cells. Unlike other techniques, this method does not require a sophisticated optical setup, and image analysis is performed with the public domain software Fiji (ImageJ2). The protocol will be useful to provide results that are adequately standardized to allow comparison of data sets that were generated in different laboratories.
Critical Parameters and Troubleshooting
For data acquisition, it is critical to have a good if not excellent signal-to-noise ratio for both Hoechst and SYTOX Green channels so the data analysis can run correctly. This does not entail using high amounts of excitation light to achieve high SNR (see “ Image acquisition: Setting your imaging parameters to achieve good signal-to-noise ratios”), since that likely would impact your apoptosis and NETosis results. In addition, establishing an appropriate threshold/mask value for data analysis is also of importance. Following analysis, we suggest looking through the generated files to determine if any doublets (two cells close together that the scripts observe as a single) are present and subtracting these from each hour's analysis. This can help provide a more accurate measurement.
Understanding Results
As previously mentioned, it will take several attempts to collect usable data. Much of this is microscope- and cell-specific—with time (2-4 trials), you will work out the “kinks” and determine the correct settings for your samples. For data analysis, we suggest making sure that the scripts work on your system. Once appropriate data has been collected, it should be possible to place the analysis into a workflow and complete it within a day of acquisition. Output Excel files can be analyzed using Excel functions, and percentages of NETosing cells over time can be presented as line graphs (see example output file in https://github.com/addoyle1D/CPCB_NETosis).
Time Considerations
Plate setup
Plate setup time may vary depending on the coating material. Fibrin plating take 15 min for an 8-well Ibidi chamber followed by overnight incubation. Neutrophil isolation takes about 2 hr and 15 min, and during neutrophil isolation the coated plate can be washed, blocked and dried (a total of 1 hr 40 min). NET set up will take about an hour. Plate will be ready for imaging after a total of 3 hr 15 min
Microscope setup and acquisition for time-lapse microscopy
It is anticipated that the setup time will vary greatly depending on the expertise of the user. However, it is expected that it should only take 30-60 min to set up multiple positions for an 8-well Ibidi chamber. This of course will take longer if using a 12-well, or larger, plate. We encourage newer microscope users to familiarize themselves with the software prior to starting a time-dependent experiment.
Post-acquisition setup and code modifications
We suggest first testing our code on the supplied example dataset to make sure the code is functioning on your device. It is expected that some of the code will need to be changed based on your images/imaging system. We expect that changing the code will take at most 20 min for an experienced Fiji user and 1-1.5 hr for a novice.
Post-acquisition alignment and analysis
It obvious that there will be a large variability based on the number of positions/files being aligned and processed, not to mention the speed of the computer being used. Due to these issues, we will give time considerations based on a “high-end” and “mid-range” computer using our example dataset. From this, you can extrapolate how long your datasets may take. We tested a low-end system (Core i5 processor with 8 GB RAM), and we do not recommend this. A minimum of 32 GB of RAM is recommended.
High-end system (dual Xeon processors, 128 GB RAM):
Setup files: 16 s to 2 min Alignment: 1:30-12:00 min per position (easy vs. slow drift alignment) Analysis: ∼30 s Mid-range system (single intel processor, 64 GB RAM): Setup files: 1-4 min Alignment: 3-30:00 min per position (easy vs. slow drift alignment) Analysis: 1+ minutes
Acknowledgment
This study was funded by the intramural program of NIDCR, NIH.
Author Contributions
Lakmali Munasinghage Silva : conceptualization, formal analysis, investigation, methodology, validation, visualization, writing original draft, writing review and editing; Niki Moutsopoulos : funding acquisition, resources, supervision, writing review and editing; Thomas Bugge : funding acquisition, resources, supervision, writing review and editing; Andrew Doyle : conceptualization, data curation, formal analysis, investigation, resources, software, validation, visualization, writing original draft, writing review and editing.
Conflict of Interest
The authors declare no conflict of interest.
Open Research
Data Availability Statement
Data sharing not applicable—no new data generated.
Literature Cited
- Brinkmann, V., Reichard, U., Goosmann, C., Fauler, B., Uhlemann, Y., Weiss, D. S., … Zychlinsky, A. (2004). Neutrophil extracellular traps kill bacteria. Science , 303(5663), 1532–1535. doi: 10.1126/science.1092385.
- Brinkmann, V., & Zychlinsky, A. (2012). Neutrophil extracellular traps: Is immunity the second function of chromatin? Journal of Cell Biology , 198(5), 773–783. doi: 10.1083/jcb.201203170.
- Buchanan, J. T., Simpson, A. J., Aziz, R. K., Liu, G. Y., Kristian, S. A., Kotb, M., … Nizet, V. (2006). DNase expression allows the pathogen group A Streptococcus to escape killing in neutrophil extracellular traps. Current Biology , 16(4), 396–400. doi: 10.1016/j.cub.2005.12.039.
- Casutt-Meyer, S., Renzi, F., Schmaler, M., Jann, N. J., Amstutz, M., & Cornelis, G. R. (2010). Oligomeric coiled-coil adhesin YadA is a double-edged sword. PLoS One , 5(12), e15159. doi: 10.1371/journal.pone.0015159.
- Fuchs, T. A., Abed, U., Goosmann, C., Hurwitz, R., Schulze, I., Wahn, V., … Zychlinsky, A. (2007). Novel cell death program leads to neutrophil extracellular traps. Journal of Cell Biology , 176(2), 231–241. doi: 10.1083/jcb.200606027.
- Grinberg, N., Elazar, S., Rosenshine, I., & Shpigel, N. Y. (2008). Beta-hydroxybutyrate abrogates formation of bovine neutrophil extracellular traps and bactericidal activity against mammary pathogenic Escherichia coli. Infection and Immunity , 76(6), 2802–2807. doi: 10.1128/IAI.00051-08.
- Kaplan, M. J., & Radic, M. (2012). Neutrophil extracellular traps: Double-edged swords of innate immunity. Journal of Immunology , 189(6), 2689–2695. doi: 10.4049/jimmunol.1201719.
- Saitoh, T., Komano, J., Saitoh, Y., Misawa, T., Takahama, M., Kozaki, T., … Akira, S. (2012). Neutrophil extracellular traps mediate a host defense response to human immunodeficiency virus-1. Cell Host Microbe , 12(1), 109–116. doi: 10.1016/j.chom.2012.05.015.
Citing Literature
Number of times cited according to CrossRef: 1
- Lakmali M. Silva, Andrew D. Doyle, Teresa Greenwell-Wild, Nicolas Dutzan, Collin L. Tran, Loreto Abusleme, Lih Jiin Juang, Jerry Leung, Elizabeth M. Chun, Andrew G. Lum, Cary S. Agler, Carlos E. Zuazo, Megan Sibree, Priyam Jani, Vardit Kram, Daniel Martin, Kevin Moss, Michail S. Lionakis, Francis J. Castellino, Christian J. Kastrup, Matthew J. Flick, Kimon Divaris, Thomas H. Bugge, Niki M. Moutsopoulos, Fibrin is a critical regulator of neutrophil effector function at the oral mucosal barrier, Science, 10.1126/science.abl5450, 374 , 6575, (2021).

