Identifying high-confidence capture Hi-C interactions using CHiCANE
Erle M. Holgersen, Andrea Gillespie, Olivia C. Leavy, Joseph S. Baxter, Alisa Zvereva, Gareth Muirhead, Nichola Johnson, Orsolya Sipos, Nicola H. Dryden, Laura R. Broome, Yi Chen, Igor Kozin, Frank Dudbridge, Olivia Fletcher, Syed Haider


Extended
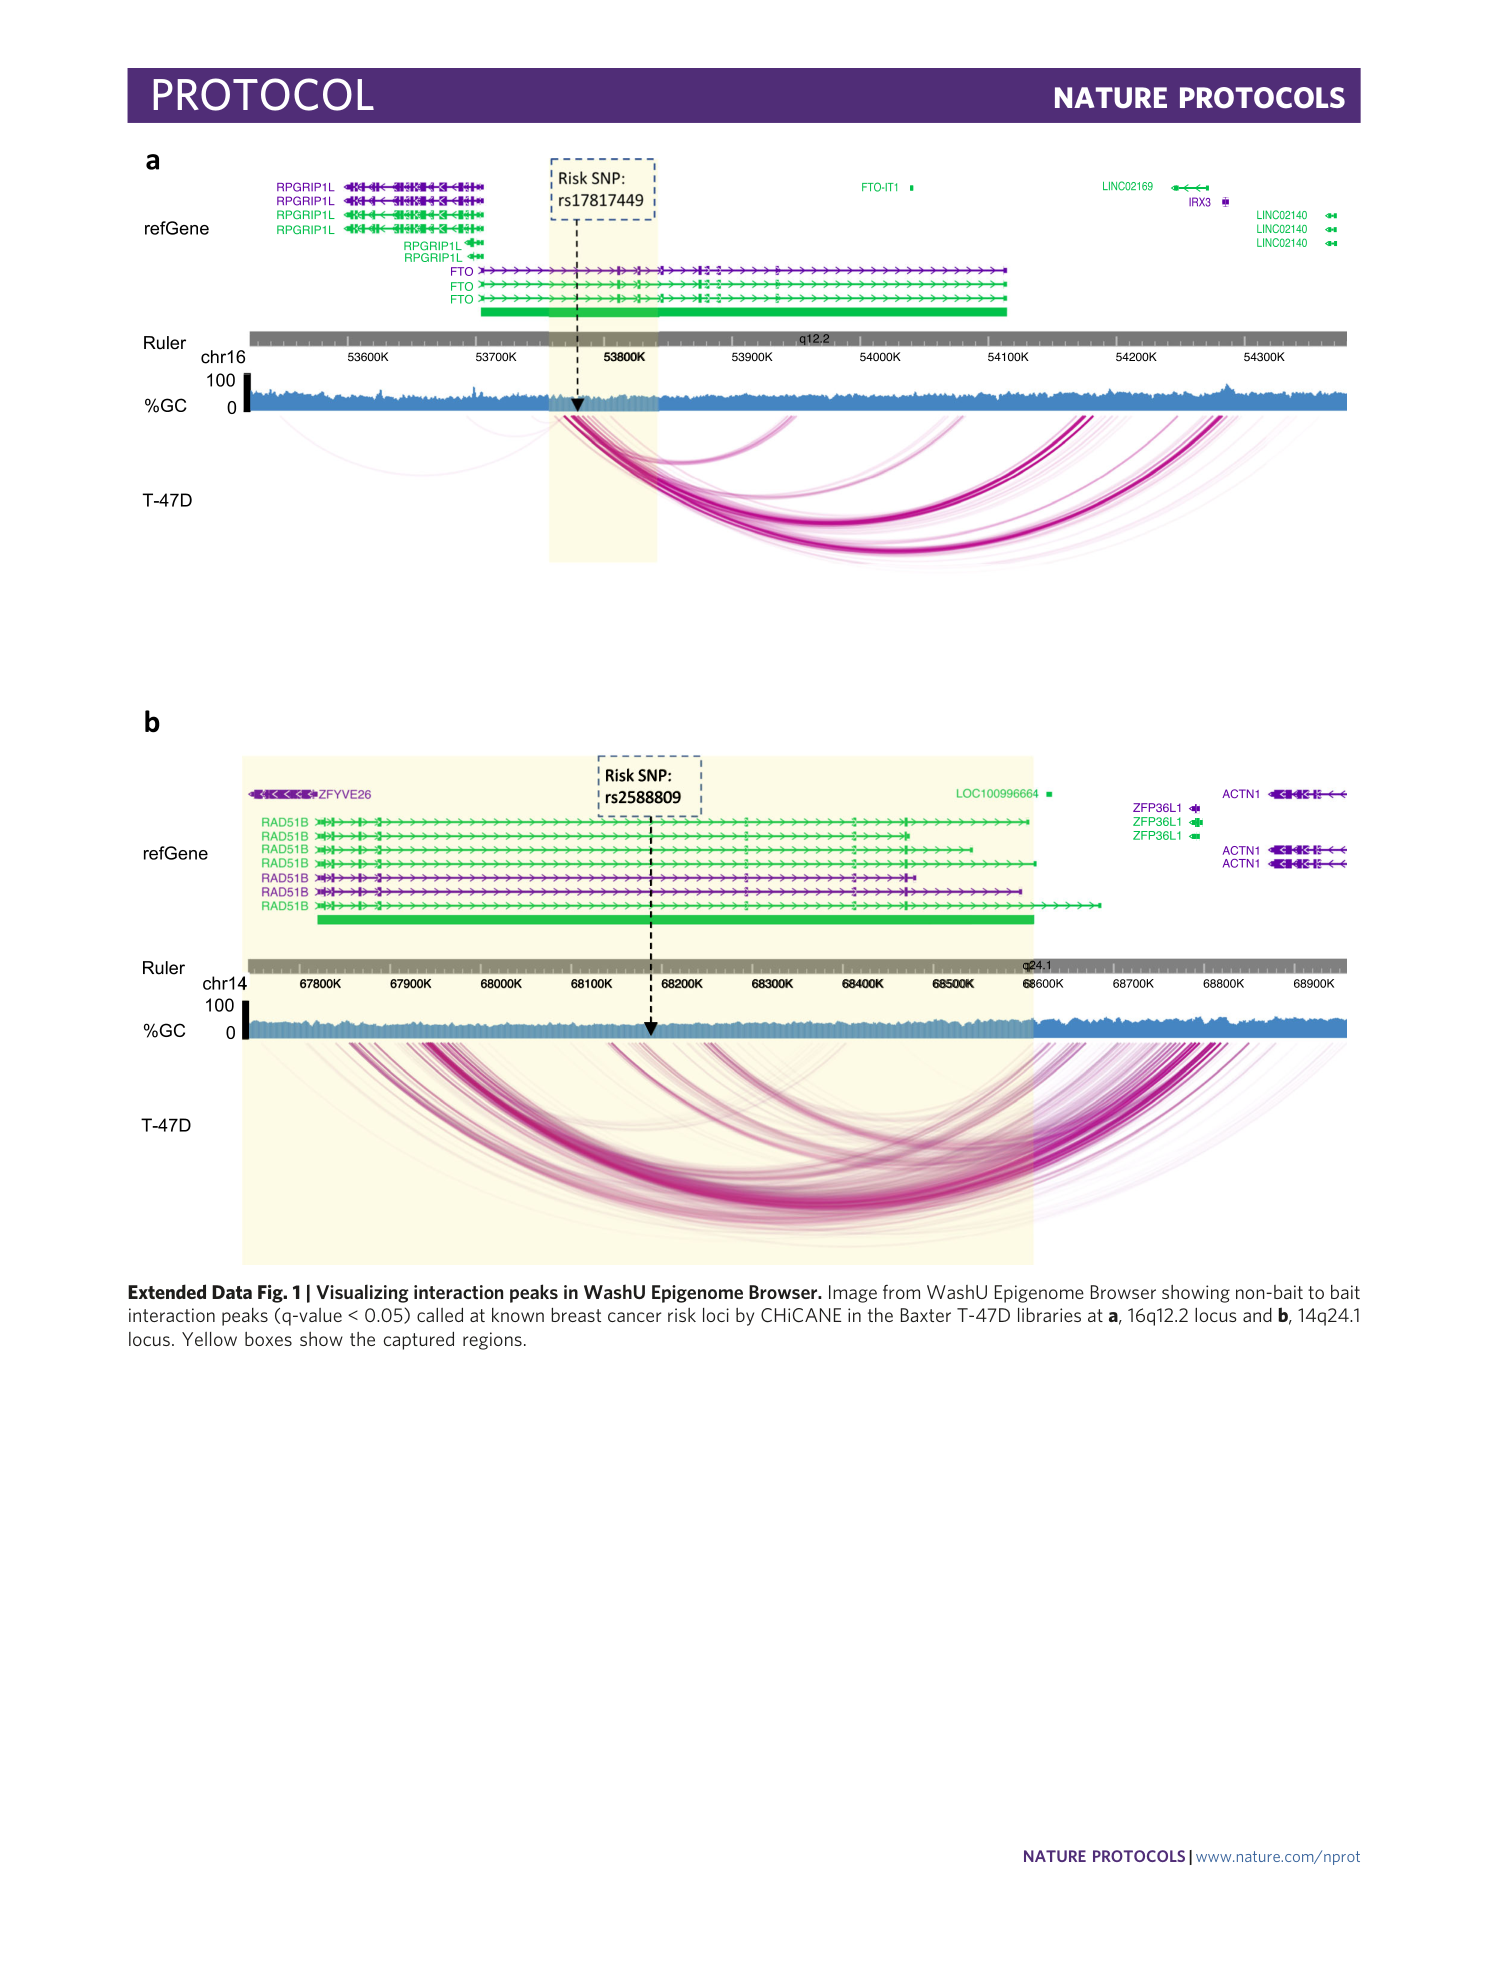
Extended Data Fig. 1 Visualizing interaction peaks in WashU Epigenome Browser.
Image from WashU Epigenome Browser showing non-bait to bait interaction peaks (q-value < 0.05) called at known breast cancer risk loci by CHiCANE in the Baxter T-47D libraries at a , 16q12.2 locus and b , 14q24.1 locus. Yellow boxes show the captured regions.
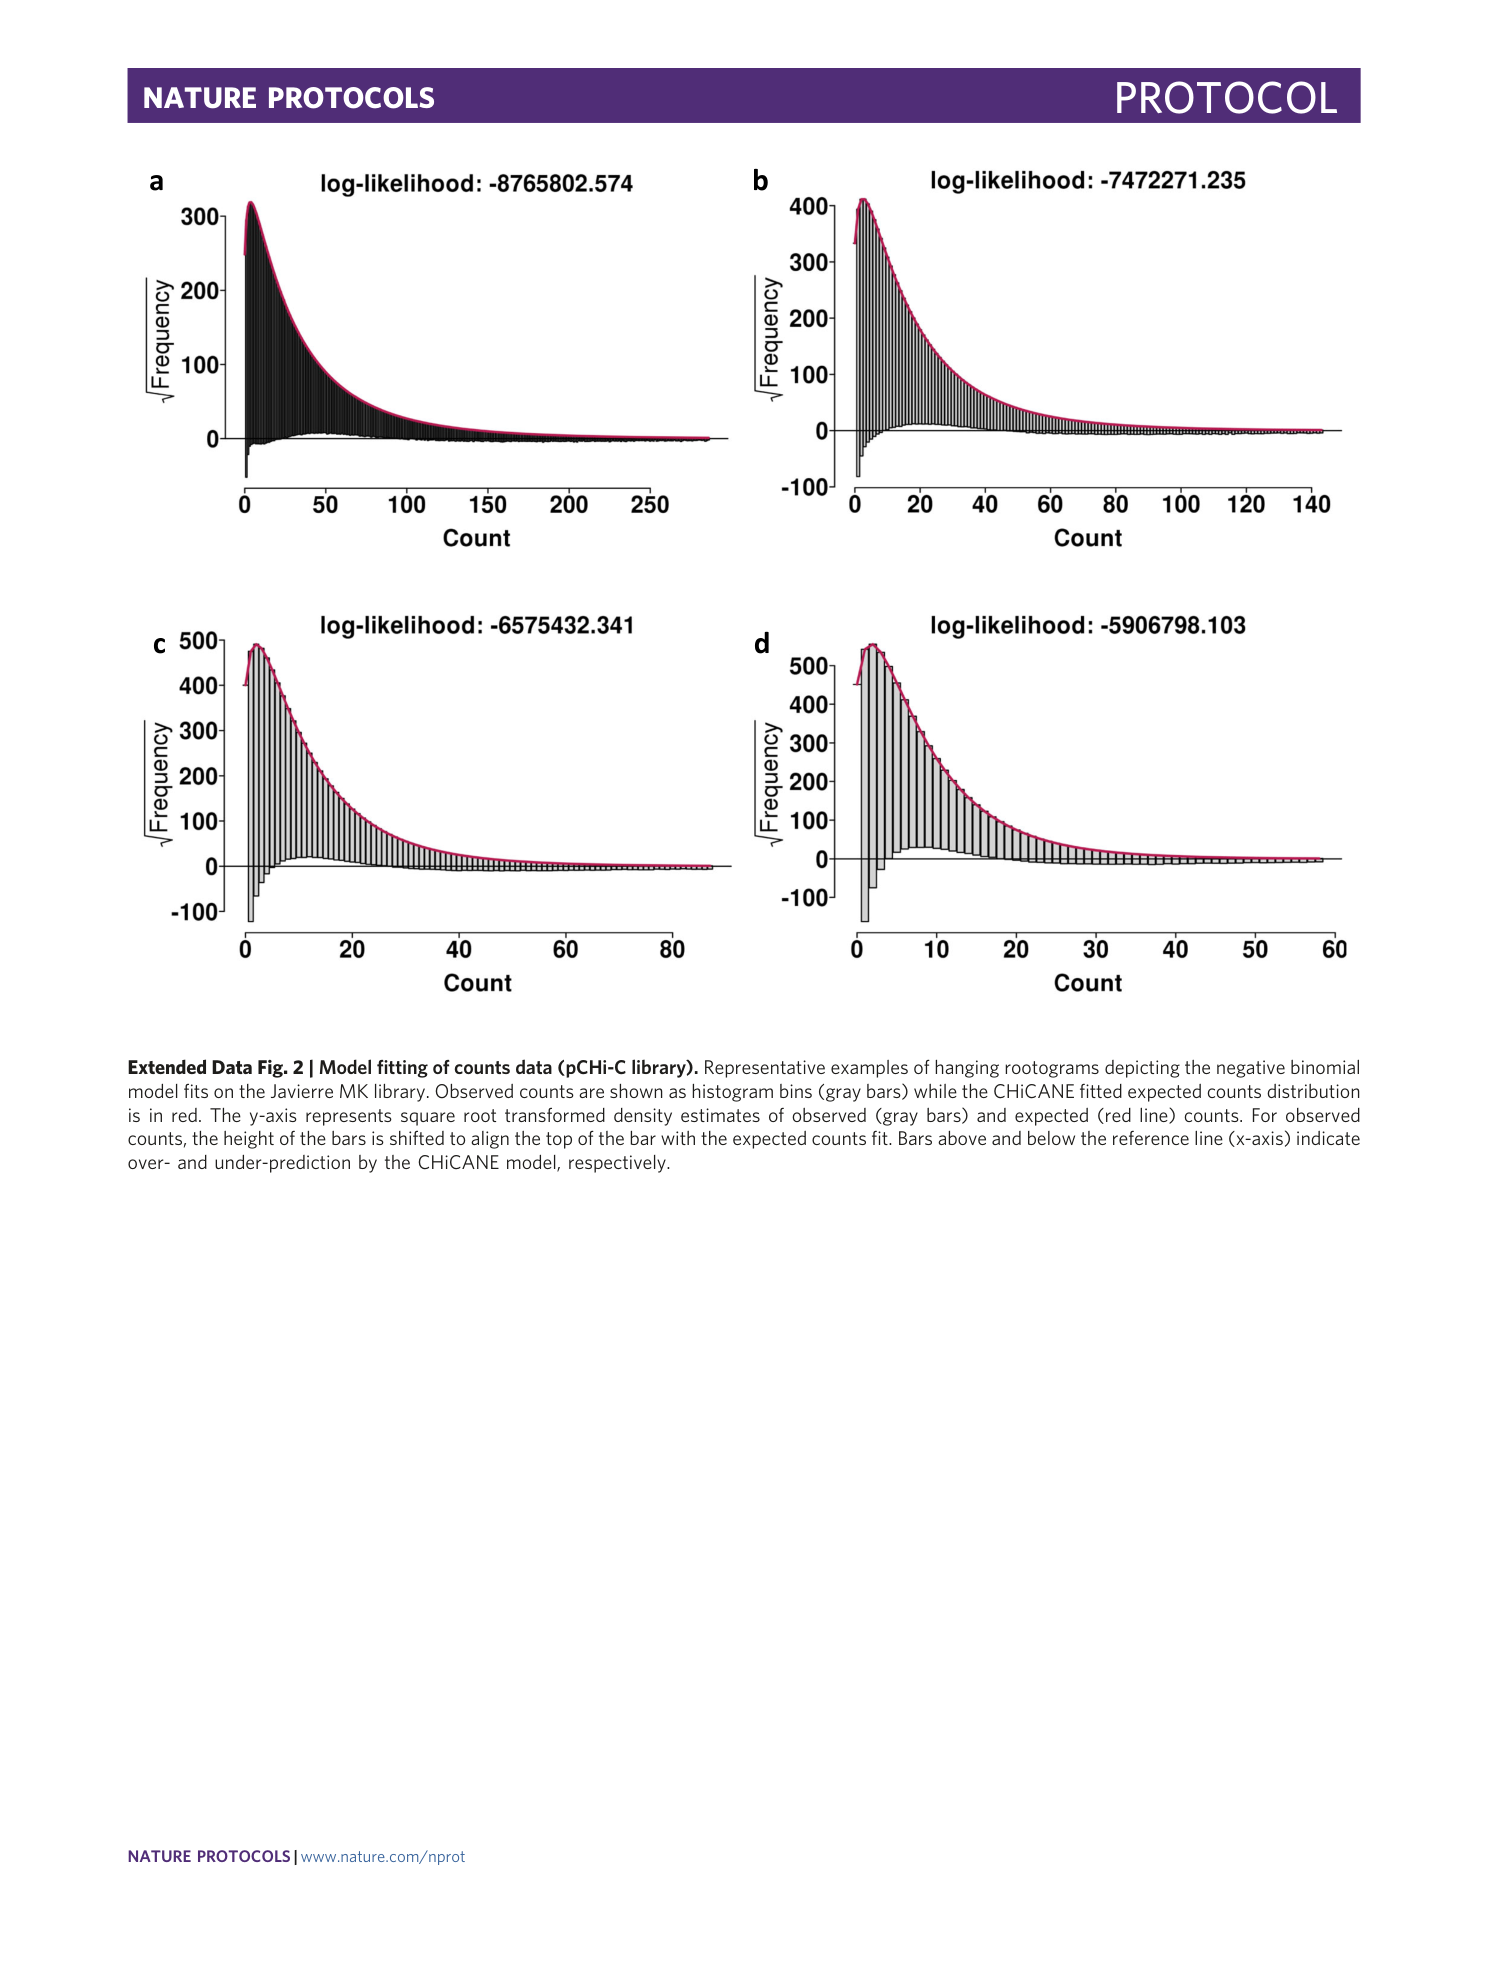
Extended Data Fig. 2 Model fitting of counts data (pCHi-C library).
Representative examples of hanging rootograms depicting the negative binomial model fits on the Javierre MK library. Observed counts are shown as histogram bins (gray bars) while the CHiCANE fitted expected counts distribution is in red. The y-axis represents square root transformed density estimates of observed (gray bars) and expected (red line) counts. For observed counts, the height of the bars is shifted to align the top of the bar with the expected counts fit. Bars above and below the reference line (x-axis) indicate over- and under-prediction by the CHiCANE model, respectively.
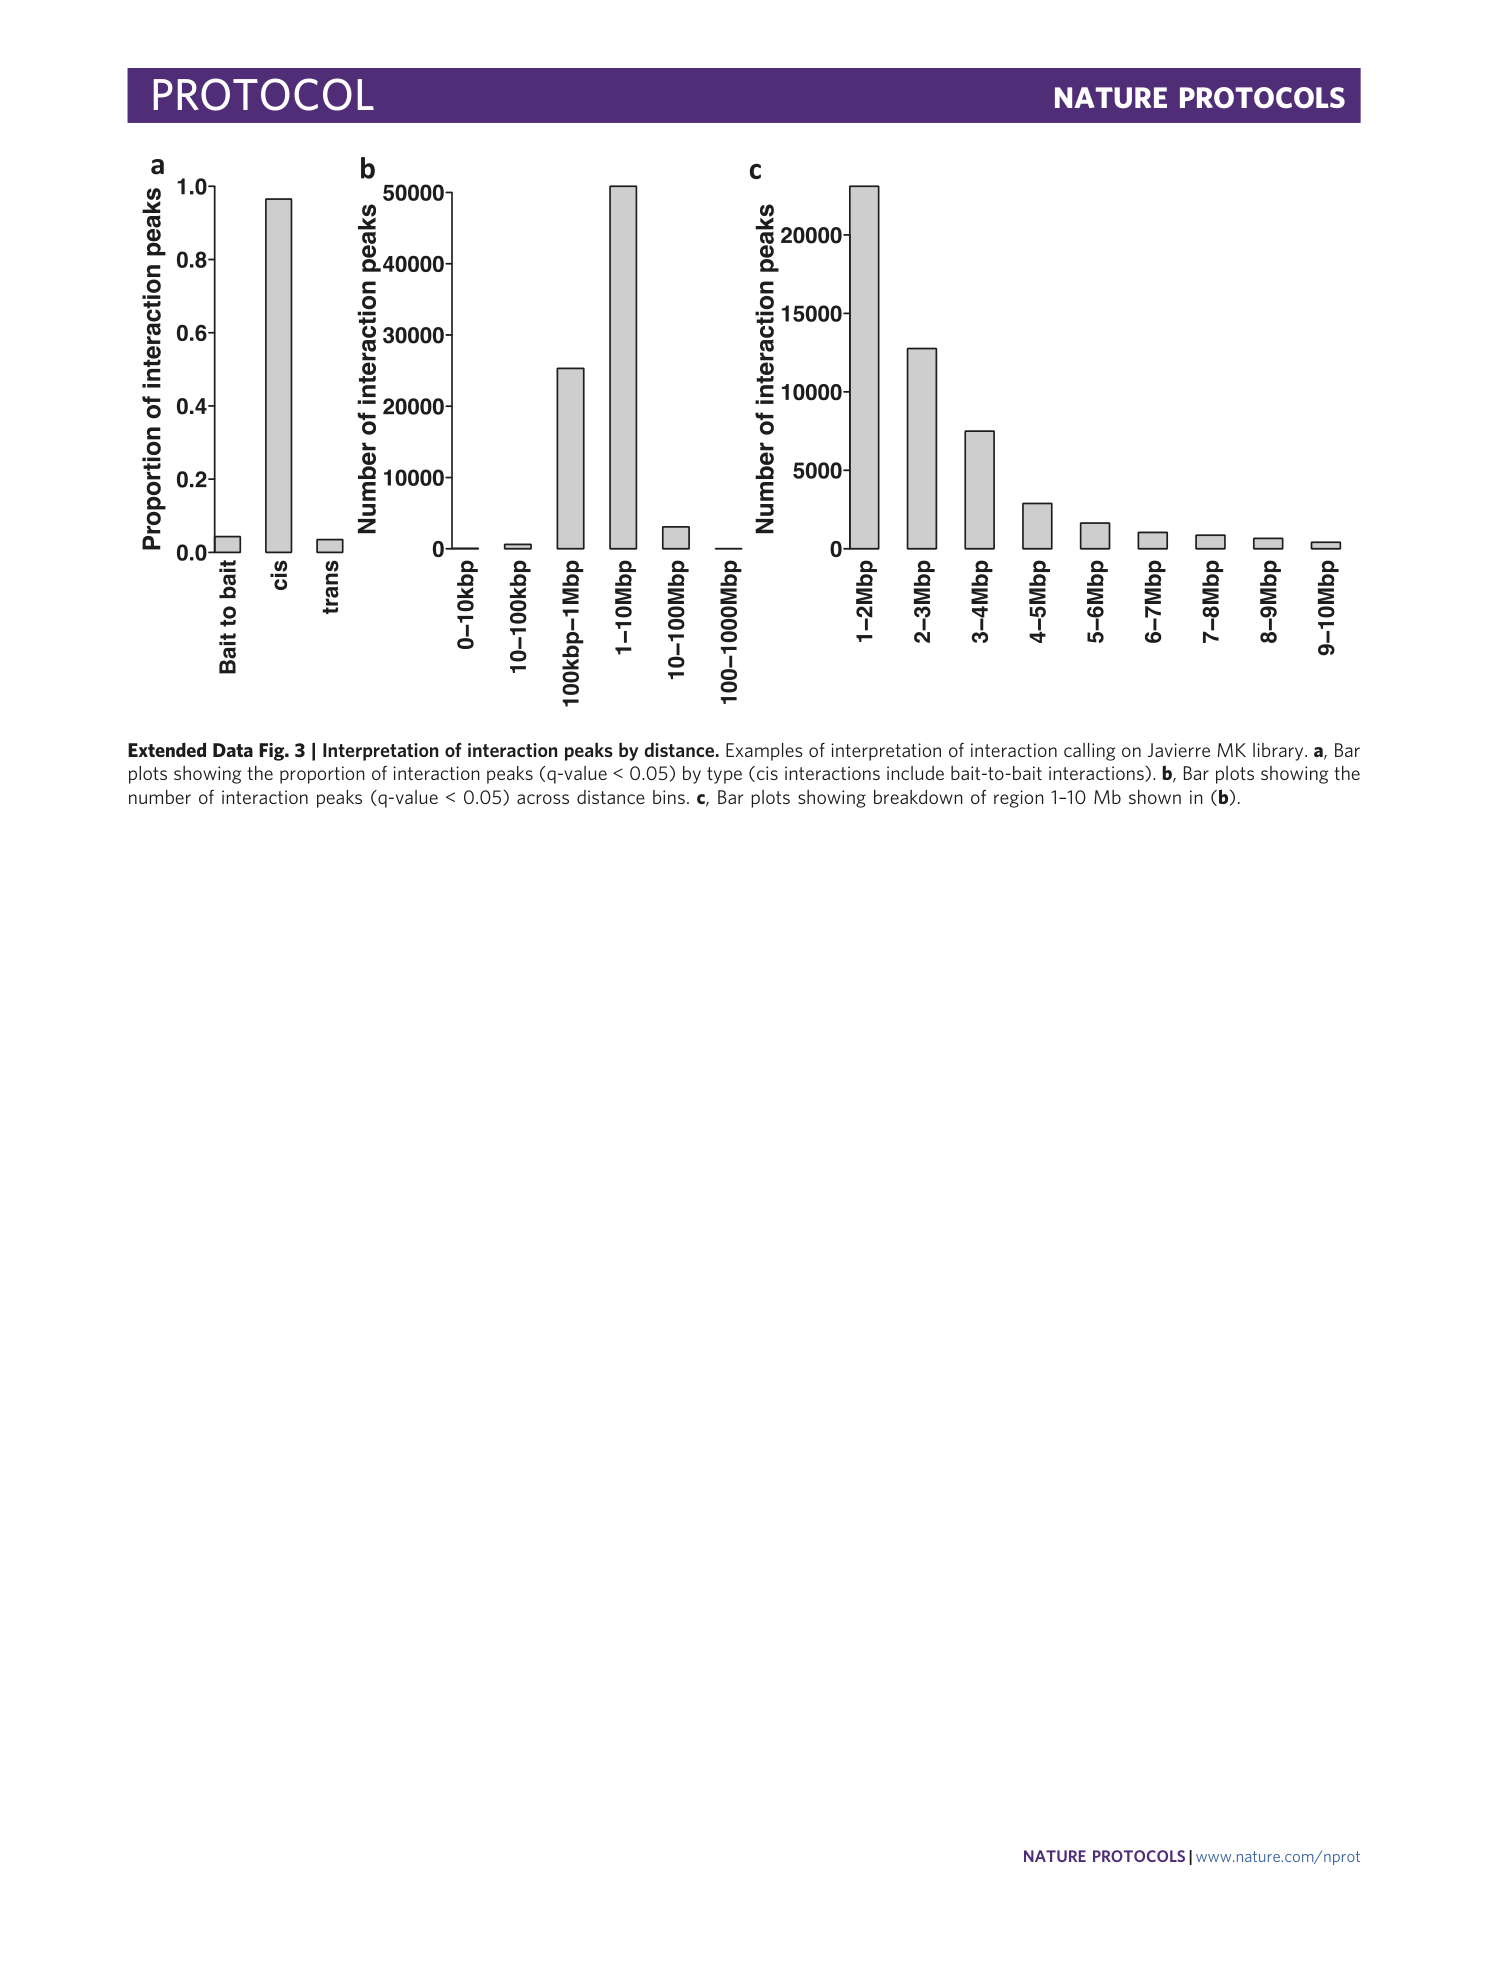
Extended Data Fig. 3 Interpretation of interaction peaks by distance.
Examples of interpretation of interaction calling on Javierre MK library. a , Bar plots showing the proportion of interaction peaks (q-value < 0.05) by type (cis interactions include bait-to-bait interactions). b , Bar plots showing the number of interaction peaks (q-value < 0.05) across distance bins. c , Bar plots showing breakdown of region 1–10 Mb shown in ( b ).
Supplementary information
Supplementary Table 1
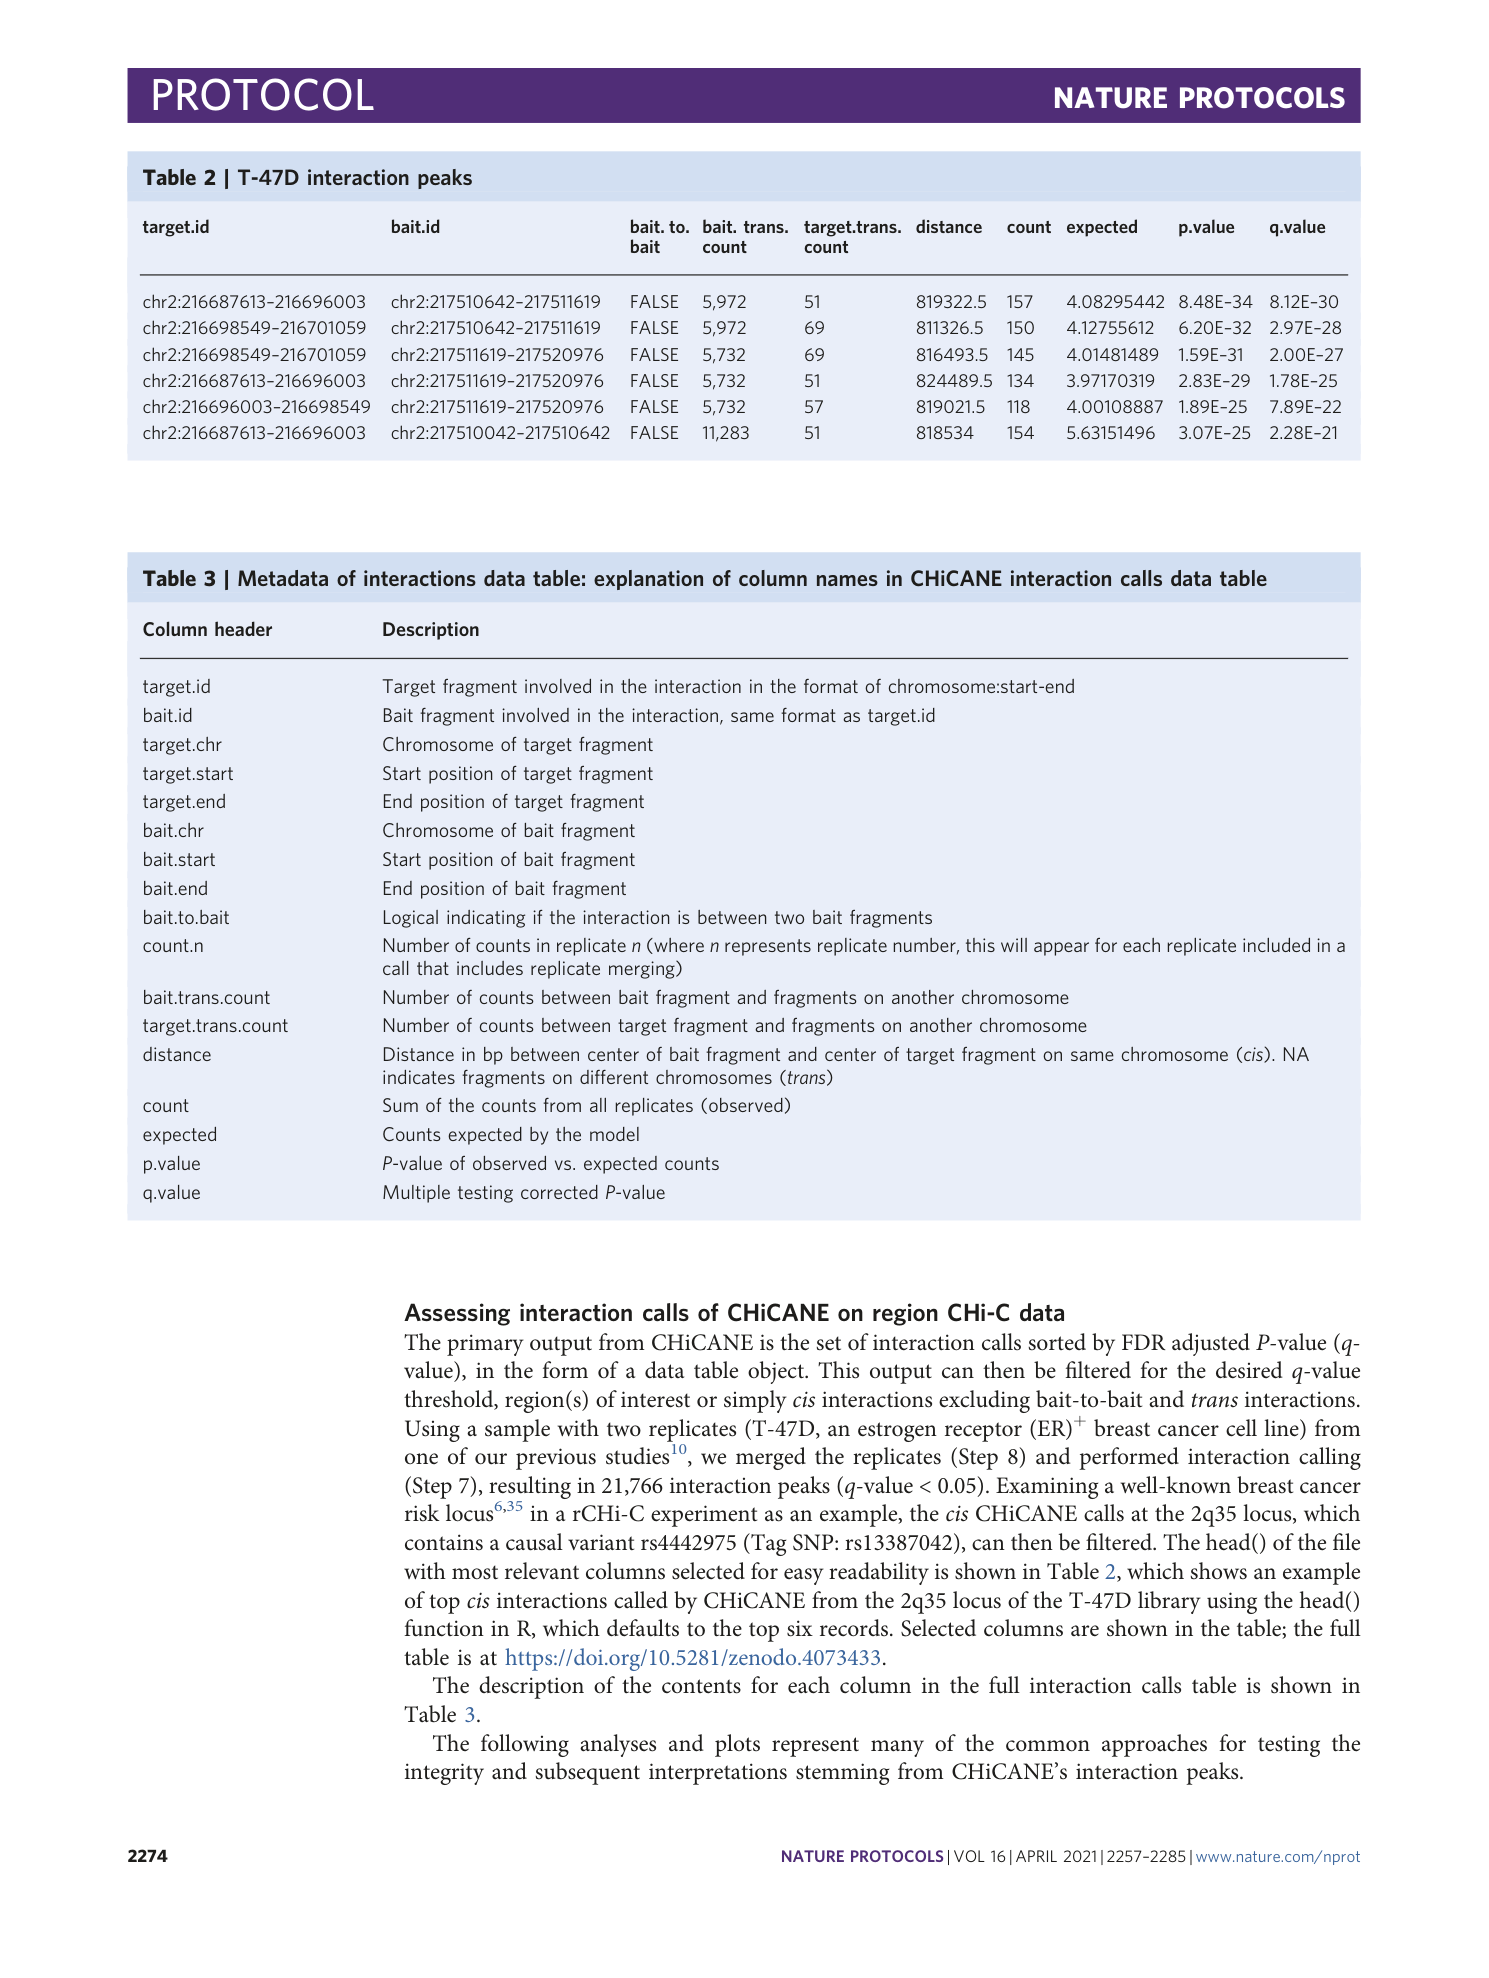
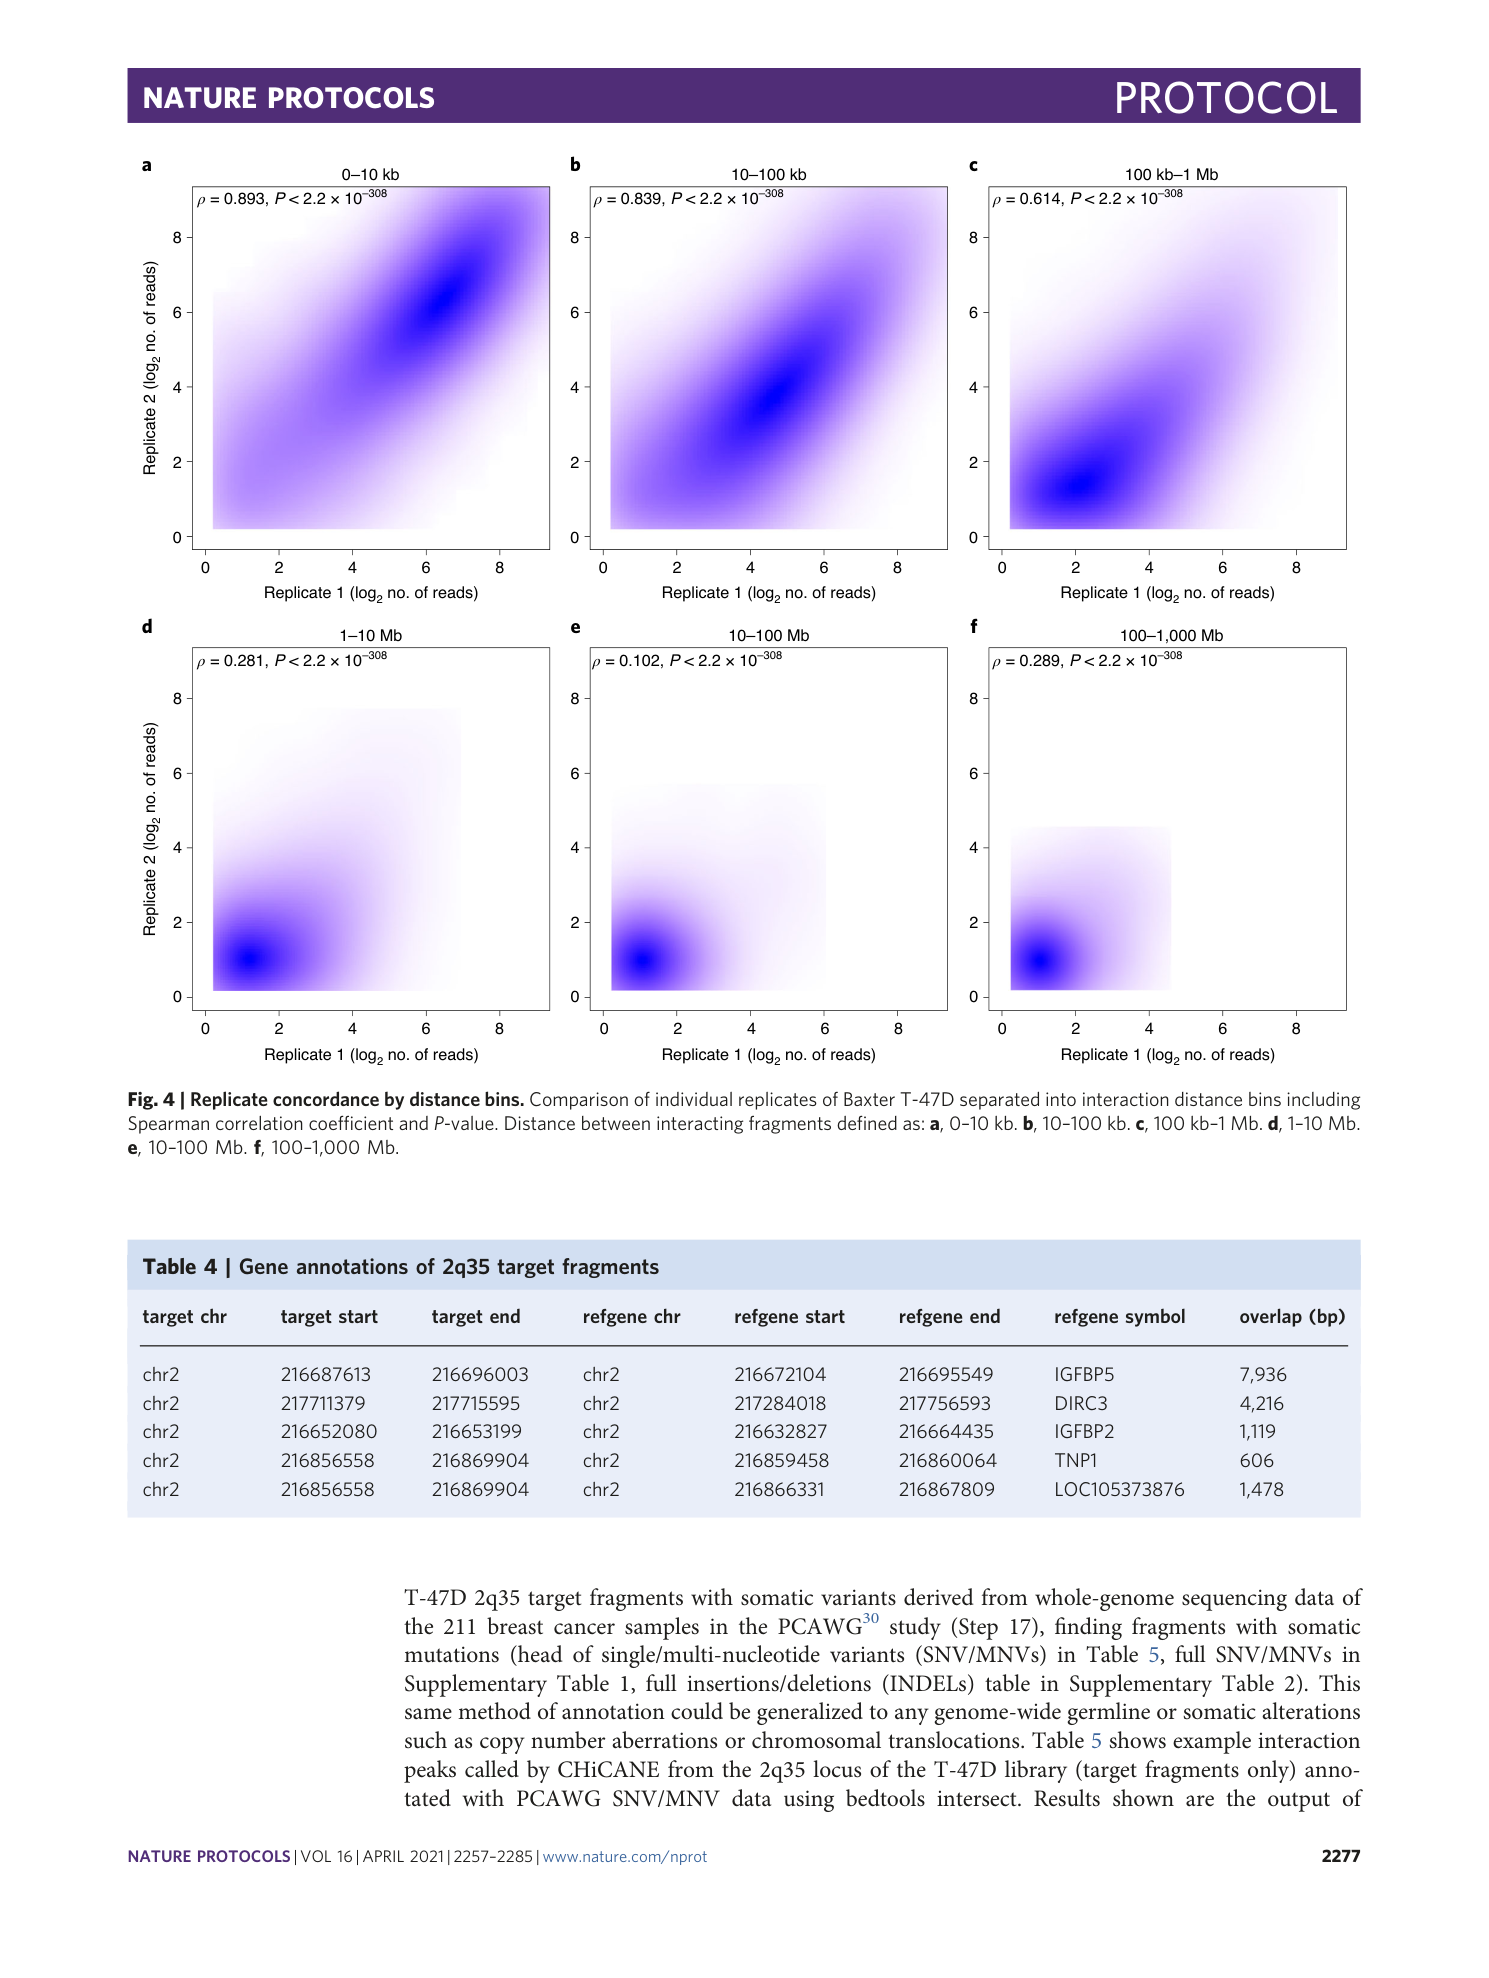
Somatic mutations overlapping with 2q35 target fragments. Example of interaction peaks called by CHiCANE from 2q35 locus of T-47D library annotated (target fragments only) with PCAWG SNV/MNV data using bedtools intersect. Column vcf_info contains information about the variant including allelic fraction, number of reads supporting variant and reference alleles (in tumor sample) and variant’s classification. The column ‘vcf_file’ contains the name of the vcf file i.e a unique patient id recorded in the PCAWG study.
Supplementary Table 2
INDELs overlapping with 2q35 target fragments. Example of interaction peaks called by CHiCANE from the 2q35 locus of the T-47D library annotated (target fragments only) with PCAWG INDELs data using bedtools intersect. The column ‘vcf_info’ contains information about the variant including allelic fraction, number of reads supporting variant and reference alleles (in tumor sample) and variant’s classification. The column ‘vcf_file’ contains the name of the vcf file i.e a unique patient id recorded in the PCAWG study.
