Visualizing G Protein-Coupled Receptor-Receptor Interactions in Brain Using Proximity Ligation In Situ Assay
Jaume Taura, Jaume Taura, Marc López-Cano, Marc López-Cano, Víctor Fernández-Dueñas, Víctor Fernández-Dueñas, Francisco Ciruela, Francisco Ciruela
Abstract
G protein-coupled receptors (GPCRs) constitute the largest family of plasma membrane receptors and the main drug targets in therapeutics. GPCRs can establish direct receptor-receptor interactions (oligomerization), which can also be considered as targets for drug development (GPCR oligomer-based drugs). However, prior to designing any novel GPCR oligomer-based drug development program, demonstrating the existence of a named GPCR oligomer in native tissues is needed as part of its target engagement definition. Here, we discuss the proximity ligation in situ assay (P-LISA), an experimental approach that reveals GPCR oligomerization in native tissues. We provide a detailed step-by-step protocol to perform P-LISA experiments and visualize GPCR oligomers in brain slices. We also provide instructions for slide observation, data acquisition, and quantification. Finally, we discuss the critical aspects determining the success of the technique, namely the fixation process and the validation of the primary antibodies used. Overall, this protocol may be used to straightforwardly visualize GPCR oligomers in the brain. © 2023 The Authors. Current Protocols published by Wiley Periodicals LLC.
Basic Protocol : Visualization of GPCR oligomers by proximity ligation in situ assay (P-LISA)
Support Protocol : Slide observation, image acquisition, and quantification
INTRODUCTION
G protein-coupled receptors (GPCRs) constitute the largest family of plasma membrane receptors in eukaryotes (∼800 GPCRs in humans). GPCRs are grouped into six different classes, from which only class A, B, C, and F are found in humans. The expression pattern of each class of GPCRs can vary widely across different tissues, depending on their specific physiological functions. Generally, class A, the most abundant with 719 members (Congreve et al., 2020), is the most widely expressed of the four classes, while class B and C GPCRs tend to be more tissue specific. GPCRs have a distinctive structure composed of 7 transmembrane helices joined by three intracellular and three extracellular loops, plus an intracellular C-terminus and an extracellular N-terminus. GPCRs bind to extracellular ligands (e.g., neurotransmitters, hormones) and transduce the signal into the cell. The nature of GPCR transduction depends on the specific effector protein that the receptor couples with (e.g., protein G, β-arrestin) (Hilger et al., 2018), thus presenting an extensive variety of signaling processes. The diverse signaling pathways activated by GPCRs allow them to regulate a wide range of cellular functions, including sensory perception, hormone secretion, neurotransmitter release, and immune response. Dysregulation of GPCR signaling has been associated with many diseases, including cancer, cardiovascular disease, metabolic disorders, and neurological disorders. Therefore, GPCRs are important drug targets in pharmacotherapy; more than a third of FDA-approved drugs act on GPCR (Hauser et al., 2017).
GPCRs can establish direct protein-protein interactions, not only with their effector proteins but also with other GPCRs, allowing fine-tuning of GPCR functioning (Ciruela et al., 2010; Møller et al., 2018; Rukavina Mikusic et al., 2020). Upon GPCR oligomerization, ligand-receptor interactions can be altered, resulting in novel pharmacological properties (Ferré et al., 2022). In fact, changes in ligand binding (i.e., orthosteric and allosteric properties) and/or efficacy (i.e., intrinsic activity diversity) have been associated with GPCR oligomerization (Fernández-Dueñas et al., 2012; Ferré et al., 2022; Sarasola et al., 2022). Consequently, the study of GPCR oligomerization may offer new opportunities toward the discovery of new pharmacological tools.
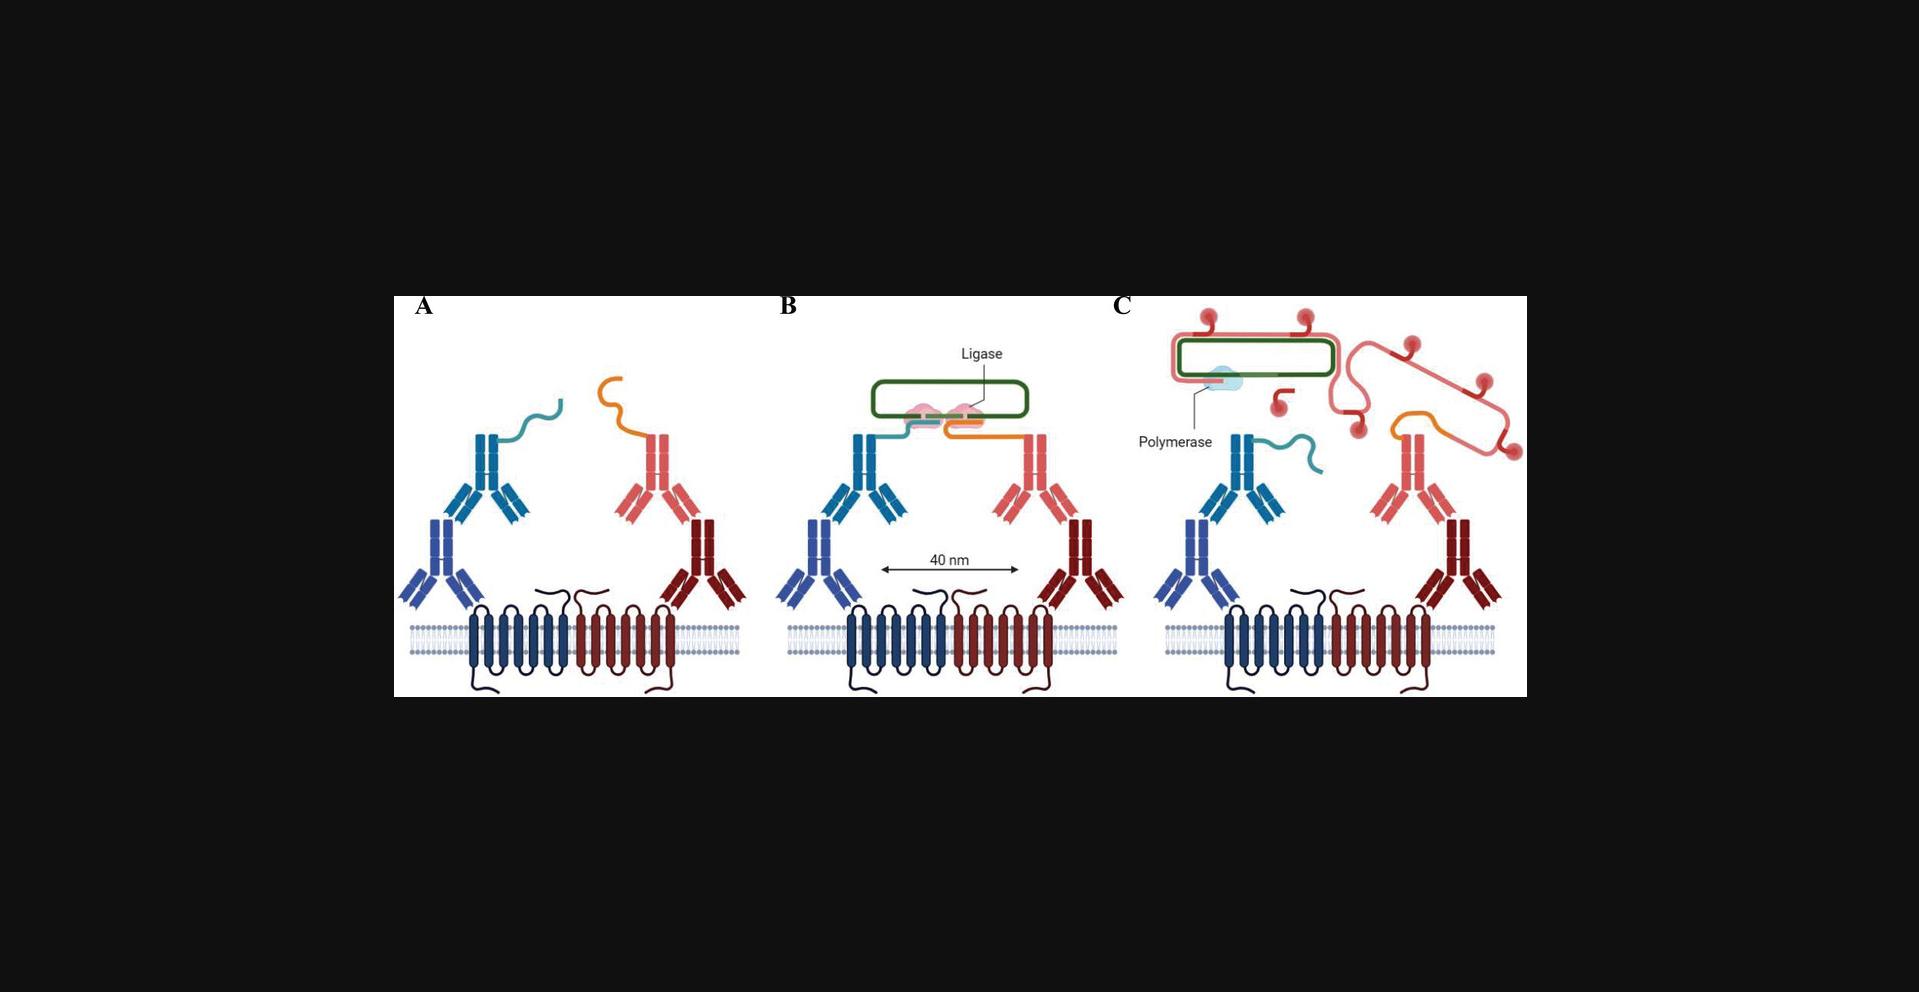
The existence of protein-protein interactions (PPIs) can be assessed by several methodologies. Some are based on a protein complementation assay (PCA) that relies on the reconstitution of a functional protein (e.g., YFP, R Luc, transcription factor) from two physically separated inactive halves fused to each partner protein (Gandía et al., 2008). Partner oligomerization enables reporter protein complementation. A good example is the yeast two hybrid system (Y2H), where the PPI drives the reconstitution of a functional transcription factor, thus promoting the expression of a reporter gene. Other PCAs rely on the complementation of fluorescent (Bimolecular Fluorescence Complementation, BiFC) or bioluminescence (Bimolecular Luminescence Complementation, BiLC) (Ciruela et al., 2010). Alternatively, fluorescent resonance energy transfer (FRET) approaches have been commonly used to assess PPIs. These approaches also use genetically modified GPCRs (i.e., tagged with fluorescent proteins) overexpressed in heterologous expressing systems. In general, these technologies do not definitely prove the existence of direct PPIs under native conditions; therefore, several techniques based on antibody-based fluorescent probes have emerged to overcome this limitation. The proximity ligation in situ assay (P-LISA) uses primary antibodies to detect receptors, which are then recognized by secondary antibodies conjugated to a single-stranded oligonucleotide (referred to as the PLA probe). Then, if the two receptors are in close proximity (closer than 40 nm), the PLA probes will hybridize with two connector oligonucleotides and a ligase will generate a closed-circle DNA template that can be amplified through a rolling-circle amplification step. Finally, by using complementary fluorescent-labeled oligonucleotides, it is possible to detect the receptor-receptor interaction (Söderberg et al., 2006). Interestingly, P-LISA has been successfully used to demonstrate the existence of several GPCR oligomers in native tissue (Fernández-Dueñas et al., 2015; López-Cano et al., 2019; Romero-Fernandez et al., 2022; Taura et al., 2015; Trifilieff et al., 2011).
Below, we describe in detail the whole process of performing P-LISA in the brain, a tissue that expresses many GPCRs that regulate important aspects of brain function (Huang et al., 2017). Therefore, a step-by-step protocol is provided to perform P-LISA in brain slices (Basic Protocol). Additionally, a support protocol will guide the reader through slide observation, image acquisition, and quantification (Support Protocol).
NOTE : All protocols using live animals must first be reviewed and approved by an Institutional Animal Care and Use Committee (IACUC) and must follow officially approved procedures for the care and use of laboratory animals.
Basic Protocol: VISUALIZATION OF GPCR OLIGOMERS BY PROXIMITY LIGATION IN SITU ASSAY (P-LISA)
P-LISA is a technology that overcomes the capacity of classical immunohistochemical assays to allow the direct visualization of endogenous PPIs in situ (Söderberg et al., 2006). The P-LISA, as a proximity ligation assay approach (Fredriksson et al., 2002), depends on dual proximal binding by pairs of detection reagents, for example, two primary antibodies that recognize target antigens (e.g., GPCR) under study (Fig. 1A). Primary antibodies, which are raised in different species, are readily detected by specific secondary antibodies containing a single complementary short DNA strand, also called a PLA probe (Fig. 1B). When PLA probes from two secondary antibodies are close to each other (≤40 nm), they can interact, and aided by two subsequently added linear connector oligonucleotides, they generate an amplifiable circular DNA strand (Fig. 1C) that serves as template for a local rolling-circle amplification (RCA) reaction (Fig. 1C). The RCA reaction generates a single-stranded product covalently linked to the antibody-antigen complex, which can be easily detected by complementary hybridization of fluorescent-labeled oligonucleotides (Fig. 1C). Overall, protein targets can be readily detected and localized with single-molecule resolution by means of fluorescence microscopy, thus allowing unbiased quantification of PPIs in unmodified cells and tissues. Hence, although other technologies can be implemented to unequivocally demonstrate the occurrence of GPCR oligomerization in native tissue (i.e., TR-FRET using fluorescent ligands), the P-LISA assay is a powerful and straightforward technology to uncover these types of subcellular events, either transient or weak interactions, within specific subpopulations of cells in situ.
Materials
-
CD1 mouse (in-house colony)
-
Ketamine (50 mg/ml; Ketalar, Panpharma)
-
Xylazine (20 mg/ml; Rompun, Bayer)
-
70% ethanol
-
4% formaldehyde solution (Sigma-Aldrich, cat. no. 1040021000)
-
1× PBS (see recipe)
-
Sodium azide (Sigma-Aldrich, cat. no. 769320-100G)
-
Walter's antifreezing solution (see recipe)
-
Triton X-100 (Sigma-Aldrich, cat. no. X100-1 L)
-
Blocking solution (see recipe)
-
Normal donkey serum (NDS; Jackson ImmunoResearch Laboratories, cat. no. 017-000-121)
-
Duolink In Situ PLA Probe Anti-Goat PLUS (Sigma-Aldrich, cat. no. DUO92003-30RXN)
-
Duolink In Situ PLA Probe Anti-Rabbit MINUS (Sigma-Aldrich, cat. no. DUO92005-30RXN)
-
P-LISA wash buffer A (see recipe)
-
5× ligation solution (see recipe)
-
T4 DNA ligase (1 U/μl; Promega, cat. no. M1801)
-
5× rolling-circle amplification (RCA) solution (see recipe)
-
phi29 DNA polymerase (Life Technologies, cat. no. EP0091)
-
P-LISA wash buffer B (see recipe)
-
Duolink in situ mounting medium containing 4’,6-diamidino-2-phenylindole (DAPI; Sigma-Aldrich, cat. no. DUO82040-5ML)
-
Transparent nail polish
-
27-gauge needle
-
1-cc syringe
-
Rack (for dissection)
-
Tape or pins
-
Surgical scissors
-
Forceps
-
Perfusion valve
-
25-gauge, 25-mm perfusion needle
-
50-ml syringe reservoir
-
Vibratome (VT1200, Leica Lasertechnik GmbH)
-
Round brush, sizes 10/0 to 2/10
-
Incubator, 37°C
-
Opaque Eppendorf tubes or foil-covered tubes
-
Microscope slides and coverslips
Fixed tissue preparation
The recommended dose for anesthetizing the animal (i.e., mouse) with the combination of ketamine and xylazine is: 100 mg/kg body weight for ketamine and 10 mg/kg body weight for xylazine (Flecknell, 1993). This guideline provides an onset of 3-5 min with 30-40 min of anesthesia duration for surgical purposes.
Of note, in our protocol, animals are housed and tested in compliance with the guidelines described in the Guide for the Care and Use of Laboratory Animals (Clark et al., 1997) and following the European Community, law 86/609/CCE, FELASA and ARRIVE guidelines. The protocol is approved by our Committee on Animal Use and Care. Thus, the animals are housed in standard cages with ad libitum access to food and water and maintained under controlled standard conditions (12 hr dark/light cycle starting at 7:30 a.m., 22°C temperature and 66% humidity). Regarding anesthesia, we recommend a barbiturate type (i.e., ketamine/xylazine combination), since gaseous types (i.e., fluothane) tend to constrict vessels, resulting in poor fixative perfusion.
1.Add 2 ml 50 mg/ml ketamine (100 mg) and 0.5 ml 20 mg/ml xylazine (10 mg) to 7.5 ml sterile water to generate 10 ml ketamine/xylazine anesthetic solution. Mix very well by gentle inversion.
2.Weigh the animal and inject intraperitoneally 0.1 ml of the ketamine/xylazine anesthetic solution per 10 g body weight (100 mg/kg ketamine, 10 mg/kg xylazine) using a 27-gauge needle and 1-cc syringe (Fig. 2). Wait 3-5 min until the animal is deeply anesthetized.
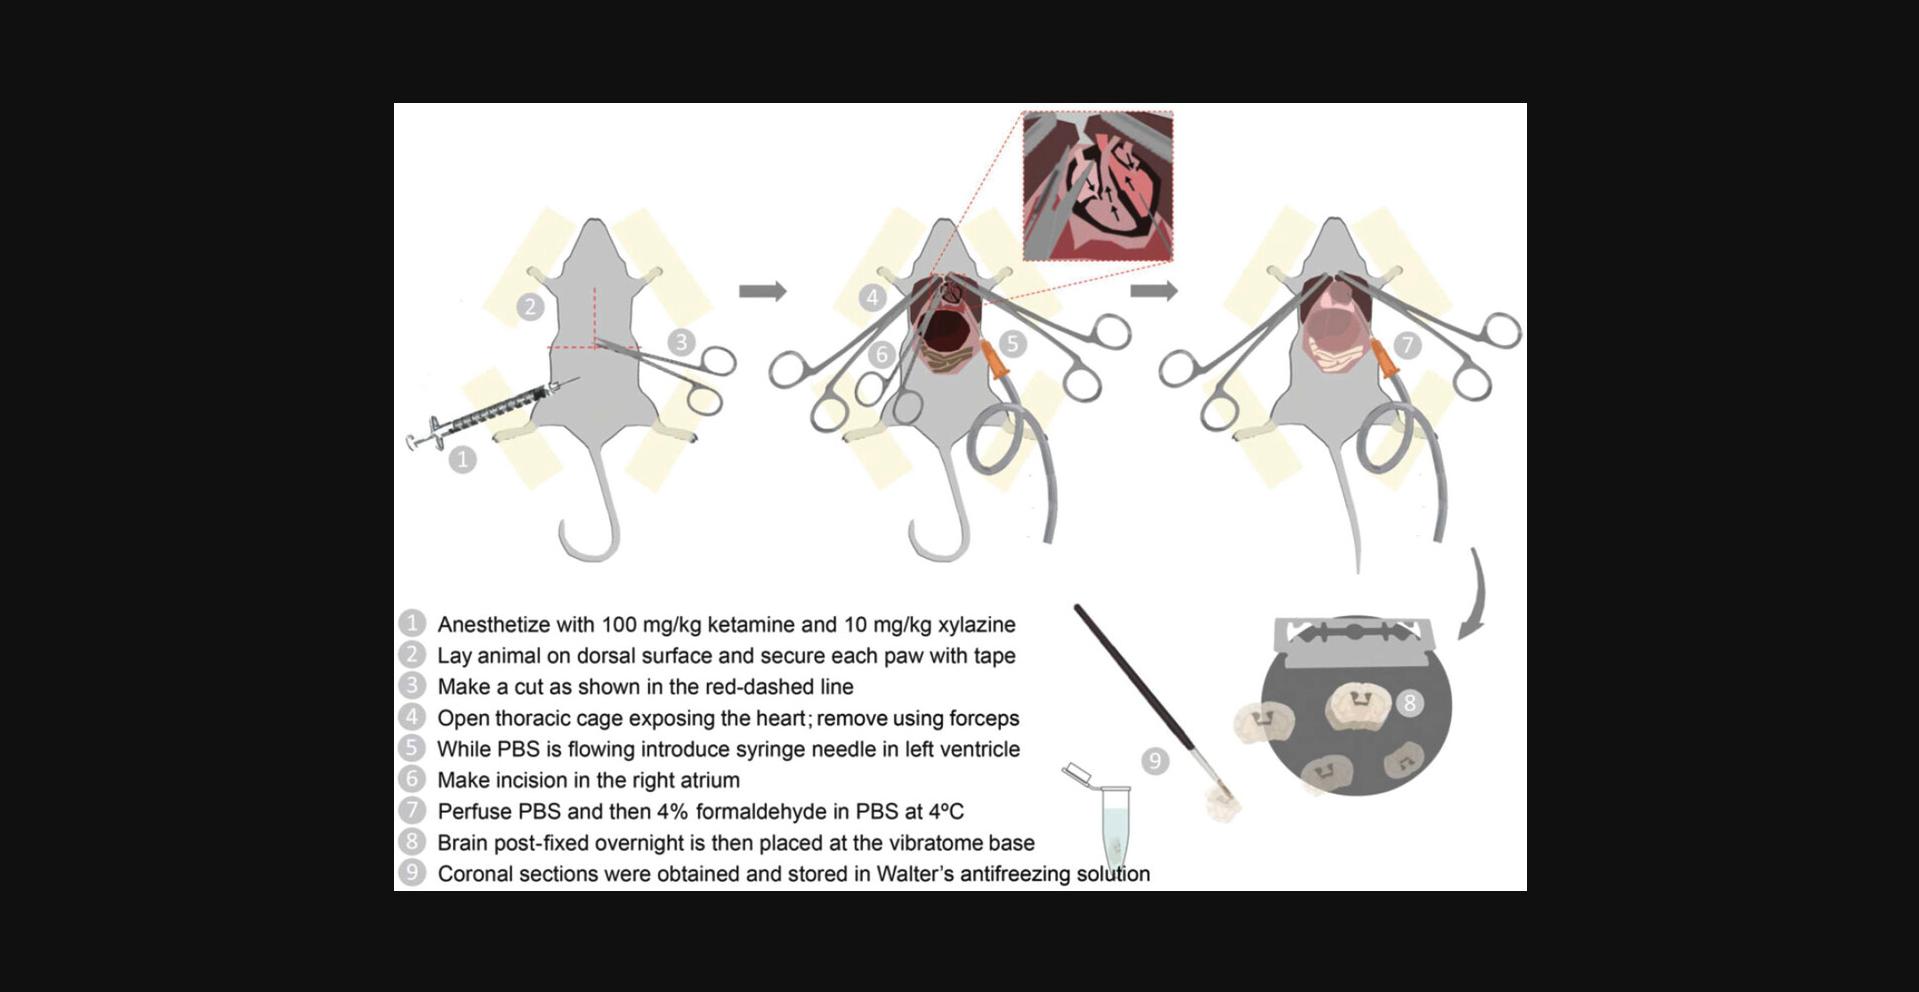
3.Once the animal is unconscious, check that the withdrawal reflexes (toe pinch) are absent. Lay the animal dorsally on a rack above a container and secure each paw to the rack with tape or a pin (Fig. 2).
4.Clean the ventral chest area with 70% ethanol and make an inverted T-cut through the skin and the abdominal wall caudal to the last rib. Open the thoracic cavity by cutting with scissors through the base of the sternum, perpendicular to the first cut.
5.Expose the heart by holding the rips out using forceps. Tear the pericardium with the help of blunt forceps (Fig. 2).
6.Switch on the perfusion valve to start the flow. Insert the perfusion needle (25-gauge, 25-mm or wider if the flow rate is not fast enough) into the left ventricle and make an incision in the right atrium to quickly drain fluids (a great deal of blood will be released; Fig. 2).
7.Perfuse with 100 ml cold 1× PBS.
8.Perfuse with ∼100 ml of ice-cold 4% formaldehyde in 1× PBS.
9.Dissect and post-fix the brain by incubation (24 hr) in the same fixative solution (4% formaldehyde) at 4°C. Swirl occasionally. Wash the brain with 1× PBS by exchanging the medium three times, swirling each time.
10.Obtain brain coronal sections (50-70 μm) using a vibratome (Fig. 2).
11.Keep the slices in Walter's antifreezing solution at −20°C until use.
Free-floating P-LISA protocol
12.Rinse the slices three times for 10 minutes each with 1 ml 1× PBS to remove Walter's antifreezing solution (Fig. 3, step 1).
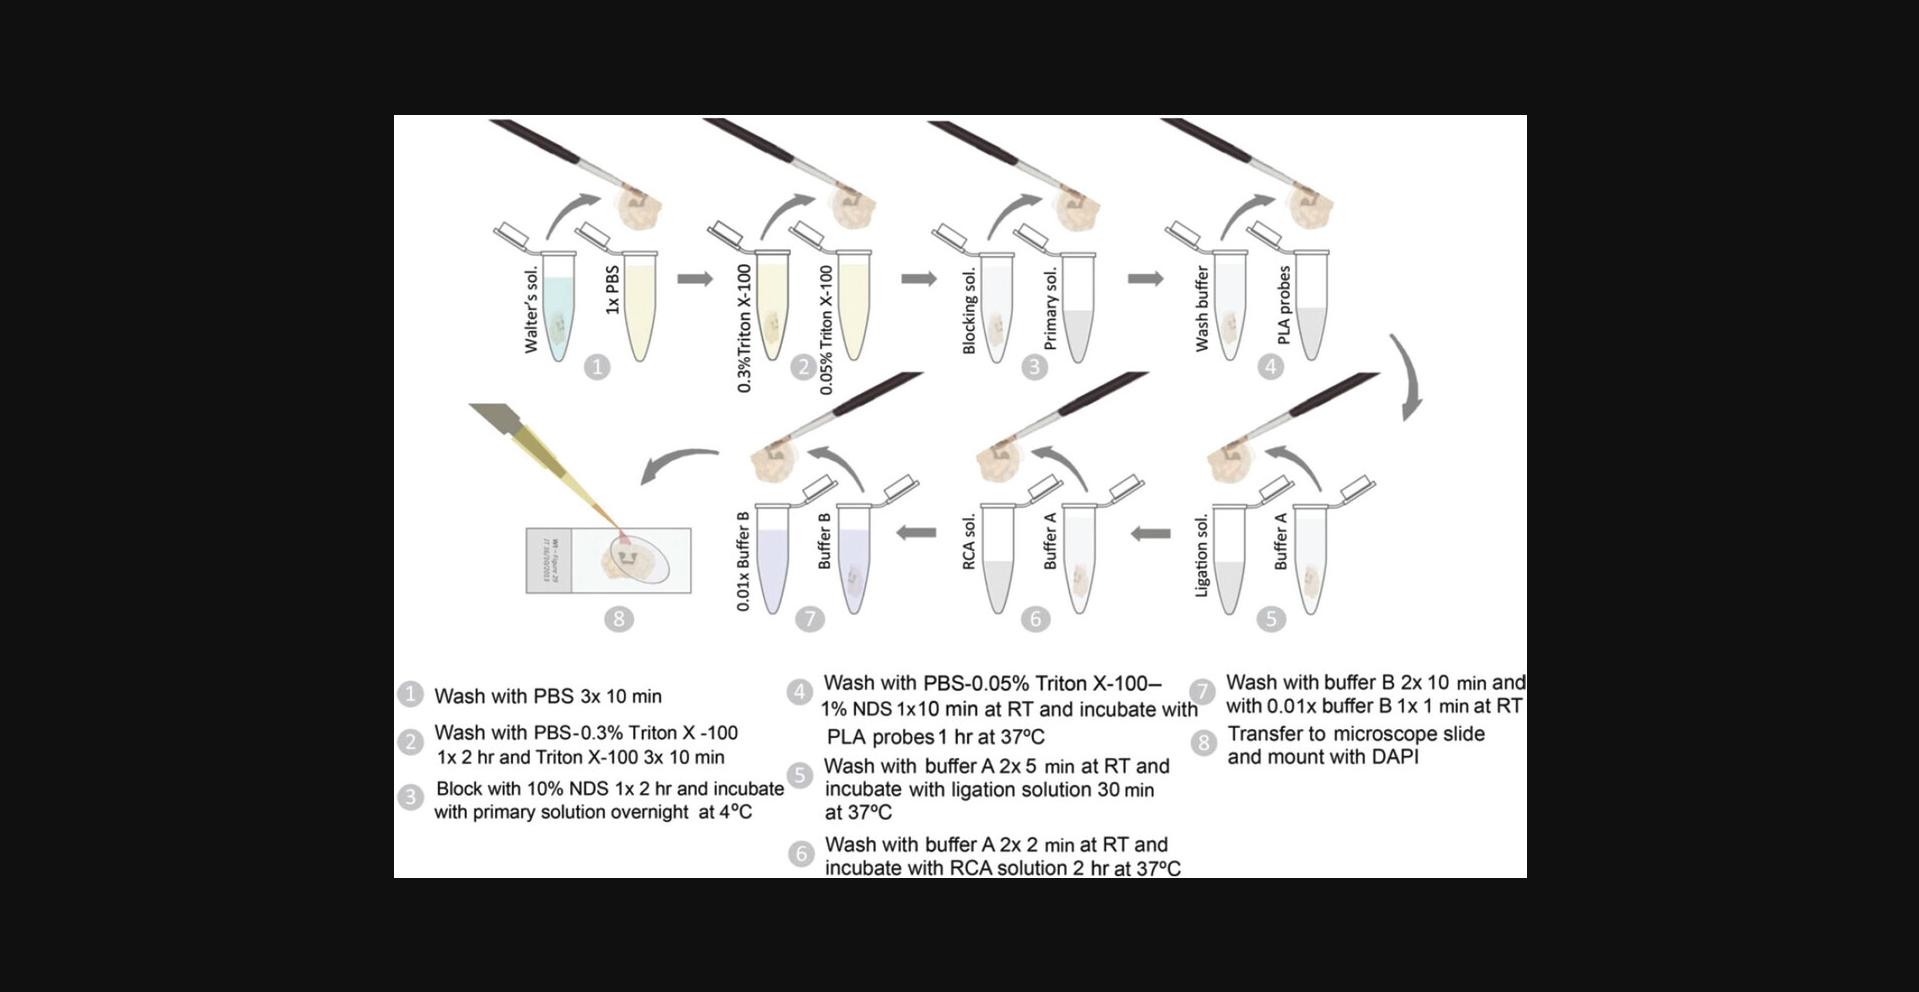
13.Wash slices with 1 ml 1× PBS containing 0.3% Triton X-100 for 2 hr at room temperature (Fig. 3, step 2).
14.Wash the slices three times for 10 min each with 1 ml of 1× PBS containing 0.05% Triton X-100 (Fig. 3, step 2).
15.Incubate slices with 250 μl blocking solution for 2 hr at room temperature (Fig. 3, step 3).
16.Incubate the slices with 100 μl blocking solution containing the primary antibodies overnight at 4°C (Fig. 3, step 3).
17.Dilute 1:5 the two PLA probes provided by the manufacturer in a blocking solution and allow the mixture to stabilize for 20 min at room temperature.
18.Wash slices for 10 min with 1 ml of 1× PBS containing 0.05% Triton X-100 and 1% NDS at room temperature (Fig. 3, step 4).
19.Incubate slices with 100 μl blocking solution containing the PLA probes for 1 hr at 37°C (Fig. 3, step 4).
20.Wash slices twice for 5 min each with 1 ml P-LISA wash buffer A at room temperature (Fig. 3, step 5).
21.Prepare 1× ligation solution by diluting 1:5 the 5× ligation stock solution (see recipe) with high grade pure water.
22.Incubate slices with 100 μl of 1× ligation solution containing 0.025 U/μl of T4 DNA ligase (prepared by diluting 1:40 the 1 U/μl T4 DNA ligase into the 1× ligation solution) for 30 min at 37°C (Fig. 3, step 5).
23.Wash slices twice for 2 min each with 1 ml P-LISA wash buffer A at room temperature (Fig. 3, step 6).
24.Prepare the RCA solution (1×) by diluting 1:5 the 5× RCA solution (see recipe) with high grade pure water.
25.Dilute 1:40 phi29 DNA polymerase (10 U/μl) into the RCA solution (1×). Incubate slices with 100 μl RCA solution containing 0.25 U/μl of phi29 DNA polymerase for 2 hr at 37 ° C (Fig. 3, step 6).
26.Wash slices twice for 10 min each with 1 ml P-LISA wash buffer B at room temperature (Fig. 3, Step 7).
27.Wash slices for 1 min with 1 ml of 0.01× P-LISA wash buffer B at room temperature (Fig. 3, Step 7).
28.Place and extend the slices on a microscope slide containing a drop of 0.01× P-LISA wash buffer B (Fig. 3, step 8).
29.Add 10 μl of Duolink in situ mounting medium (or an equivalent) containing DAPI to each slice. Place a coverslip on top of the slice and avoid the formation of air bubbles. Seal the cover slip with transparent nail polish (Fig. 3, step 8).
Support Protocol: SLIDE OBSERVATION, IMAGE ACQUISITION, AND QUANTIFICATION
Slide observation, image acquisition, and quantification constitute a key step for the interpretation of the P-LISA results. Indeed, obtaining good P-LISA images depends on various optical factors that are far beyond the scope of the present protocol and have been discussed elsewhere (Smith, 2011). Consequently, the use of a laser scanning confocal microscope (LSCM) system allowing a specimen's depth discrimination and contrast is highly recommended. Therefore, the P-LISA-stained brain slice mounted on a confocal fluorescence microscope slide is observed as a static image in the LSCM using the appropriate excitation/emission wavelengths. Once the whole brain slice is observed, a region of interest (ROI) is selected and the thickness within the z-plane is determined. Next, serial optical thin sections are collected through the fluorescent ROI in steps of 0.2-0.5 μm perpendicular to the z-axis (microscope optical axis) using proper illumination of the laser system. The image series are collected by coordinating incremental changes in the microscope fine focus mechanism—by using a stepper motor—with sequential image acquisition at each step. Therefore, the information from each collected image is limited to a definite specimen plane. Since confocal microscopy allows for a reduction in background fluorescence and improves the signal-to-noise ratio, the contrast and definition of the collected images are dramatically improved over wide-field microscopy (Smith, 2011). On the other hand, confocal optical sectioning eliminates artifacts that occur during physical manipulation (i.e., sectioning and P-LISA) of tissue specimens. Finally, the confocal optical sections in the x-y plane and collected on the z-axis are combined along the z-axis with the confocal microscopy software package, projecting a view of fluorescence intensity. Alternatively, image stacks can be composed and analyzed using an open-source Java-based image processing program allowing Java plugins and recordable macros (i.e., ImageJ or Fiji; Schneider et al., 2012).
Materials
- Laser scanning confocal microscope (LSCM; TCS 4D, Leica, or equivalent)
- ImageJ (see Internet Resources)
- Example of DAPI-stained nuclei and PLA probe stacks of images
- Program that automates a series of ImageJ commands (recorded macro)
Slide observation
1.Visualize the region of interest (ROI) of each slice (i.e., striatum) using LSCM (i.e., Leica TCS 4D) with the aid of a 60× N.A. = 1.42 oil objective.
Image acquisition
2.Acquire independently the DAPI and PLA probe high-resolution images from a 5-μm thick optical section of each ROI. Establish a z-interval of 0.2 μm, to obtain a z-stack of 25 sections.
Quantification
Image processing
3.Open ImageJ and load the stacks "DAPI.tif" and "PLA.tif."
4.Create a maximum intensity projection image for both stacks by selecting [Image > Stack > Z project… > Max intensity].
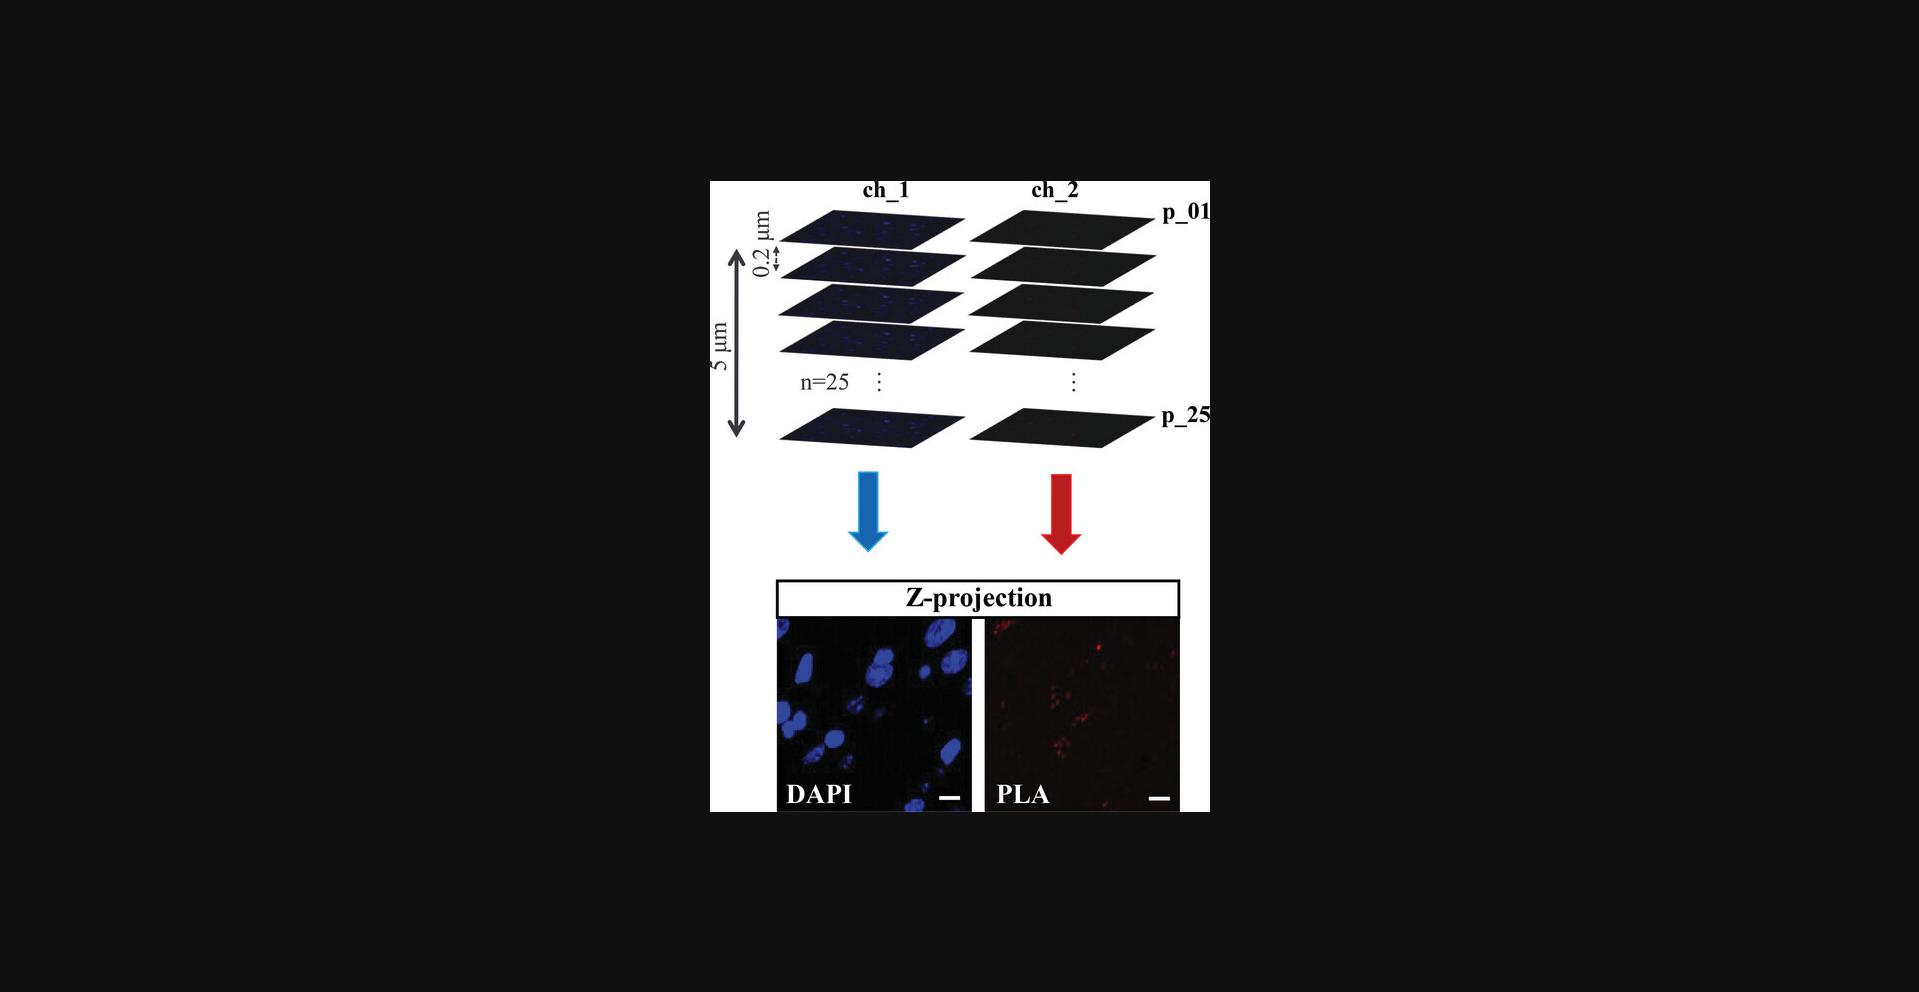
5.Perform a background subtraction on both z-projection images using the built-in function in ImageJ by selecting [Process > Subtract background…].
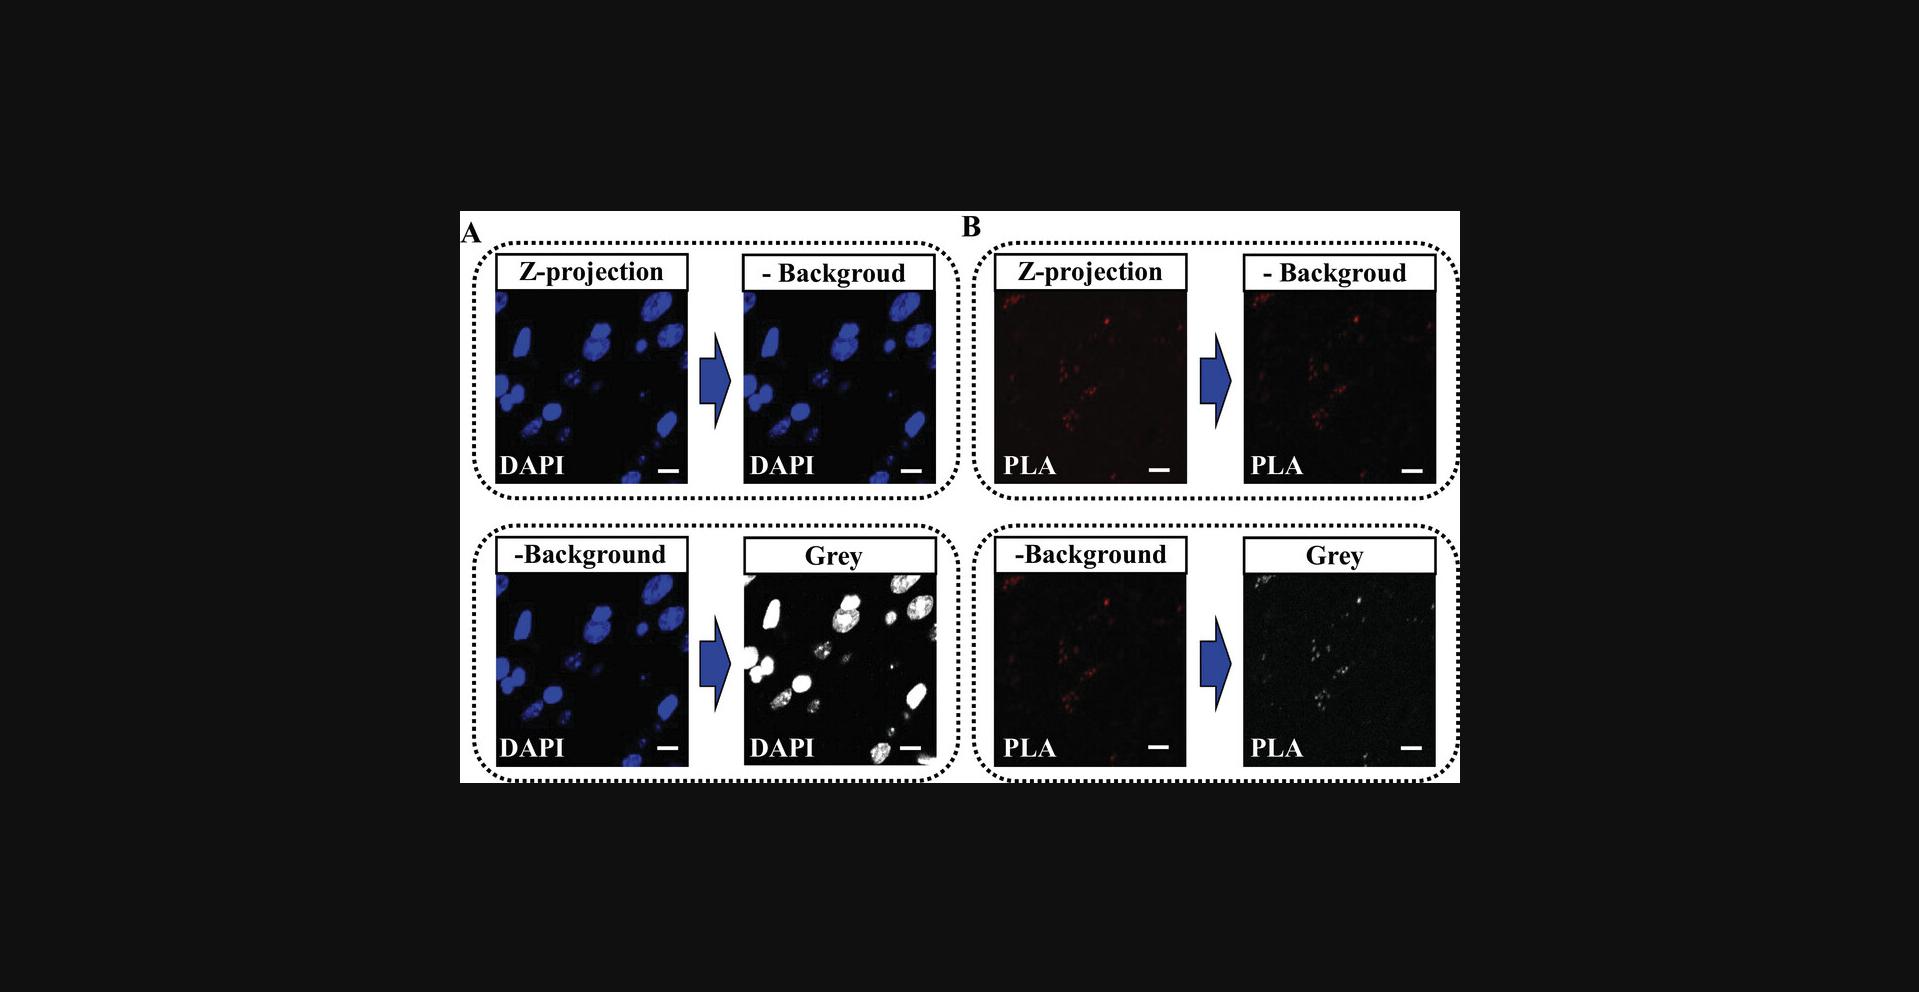
6.Enhance the visual contrast of the images by displaying both z-projections in grayscale (as shown in Fig. 5), by selecting [Image > Lookup Tables > Grays] and selecting the grayscale option.
7.Adjust the brightness and contrast by selecting [Image > Adjust > Brightness/Contrast…] and adjust the settings until you reach the desired level of contrast.
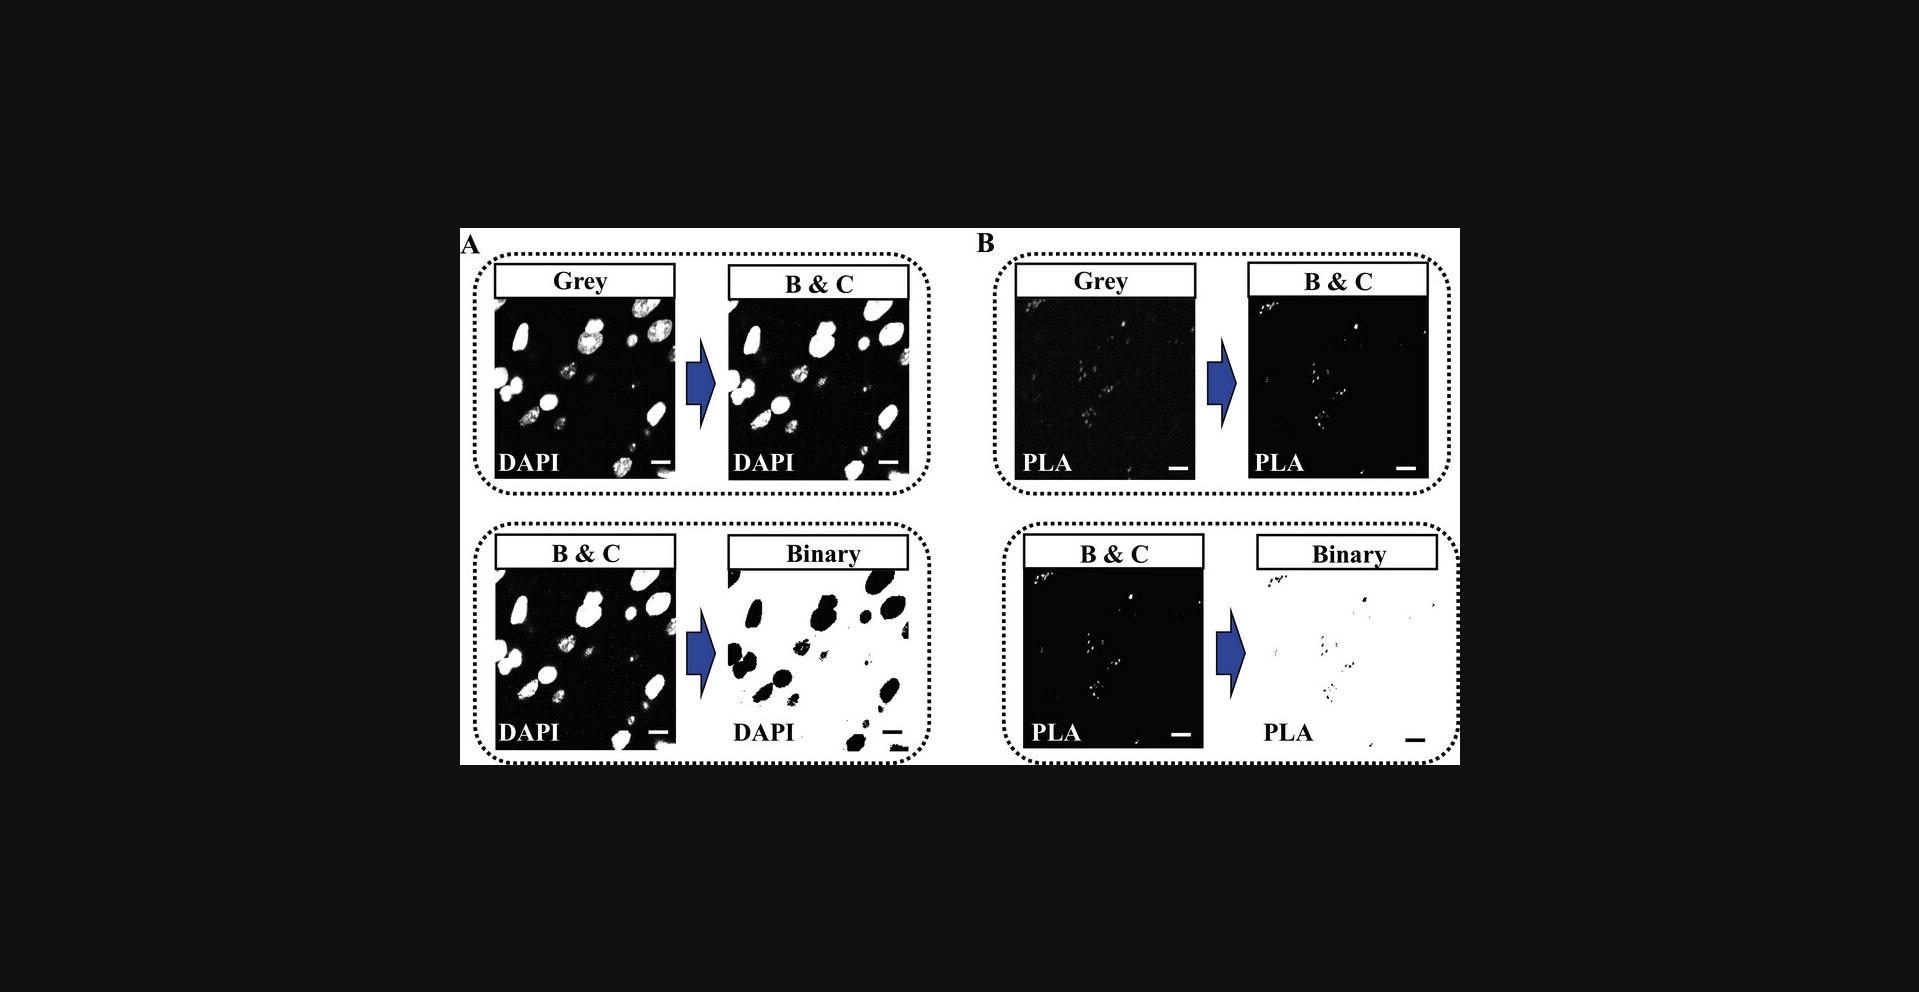
8.Apply a smoothing filter to improve the image quality by selecting [Process > Smooth] and select the desired smoothing filter.
9.Segment z-projections and convert them into binary images (black-and-white representations of the original image; as shown in Fig. 6) by selecting [Process > Binary > Make Binary] and select the desired thresholding method.
Nuclei analysis
In this section, the cells of interest are counted using the binary mask that results from nuclei segmentation.
10.Perform a watershed transformation (Fig. 7A) to separate objects that appear contiguous in the binary mask by selecting [Process > Binary > Watershed].
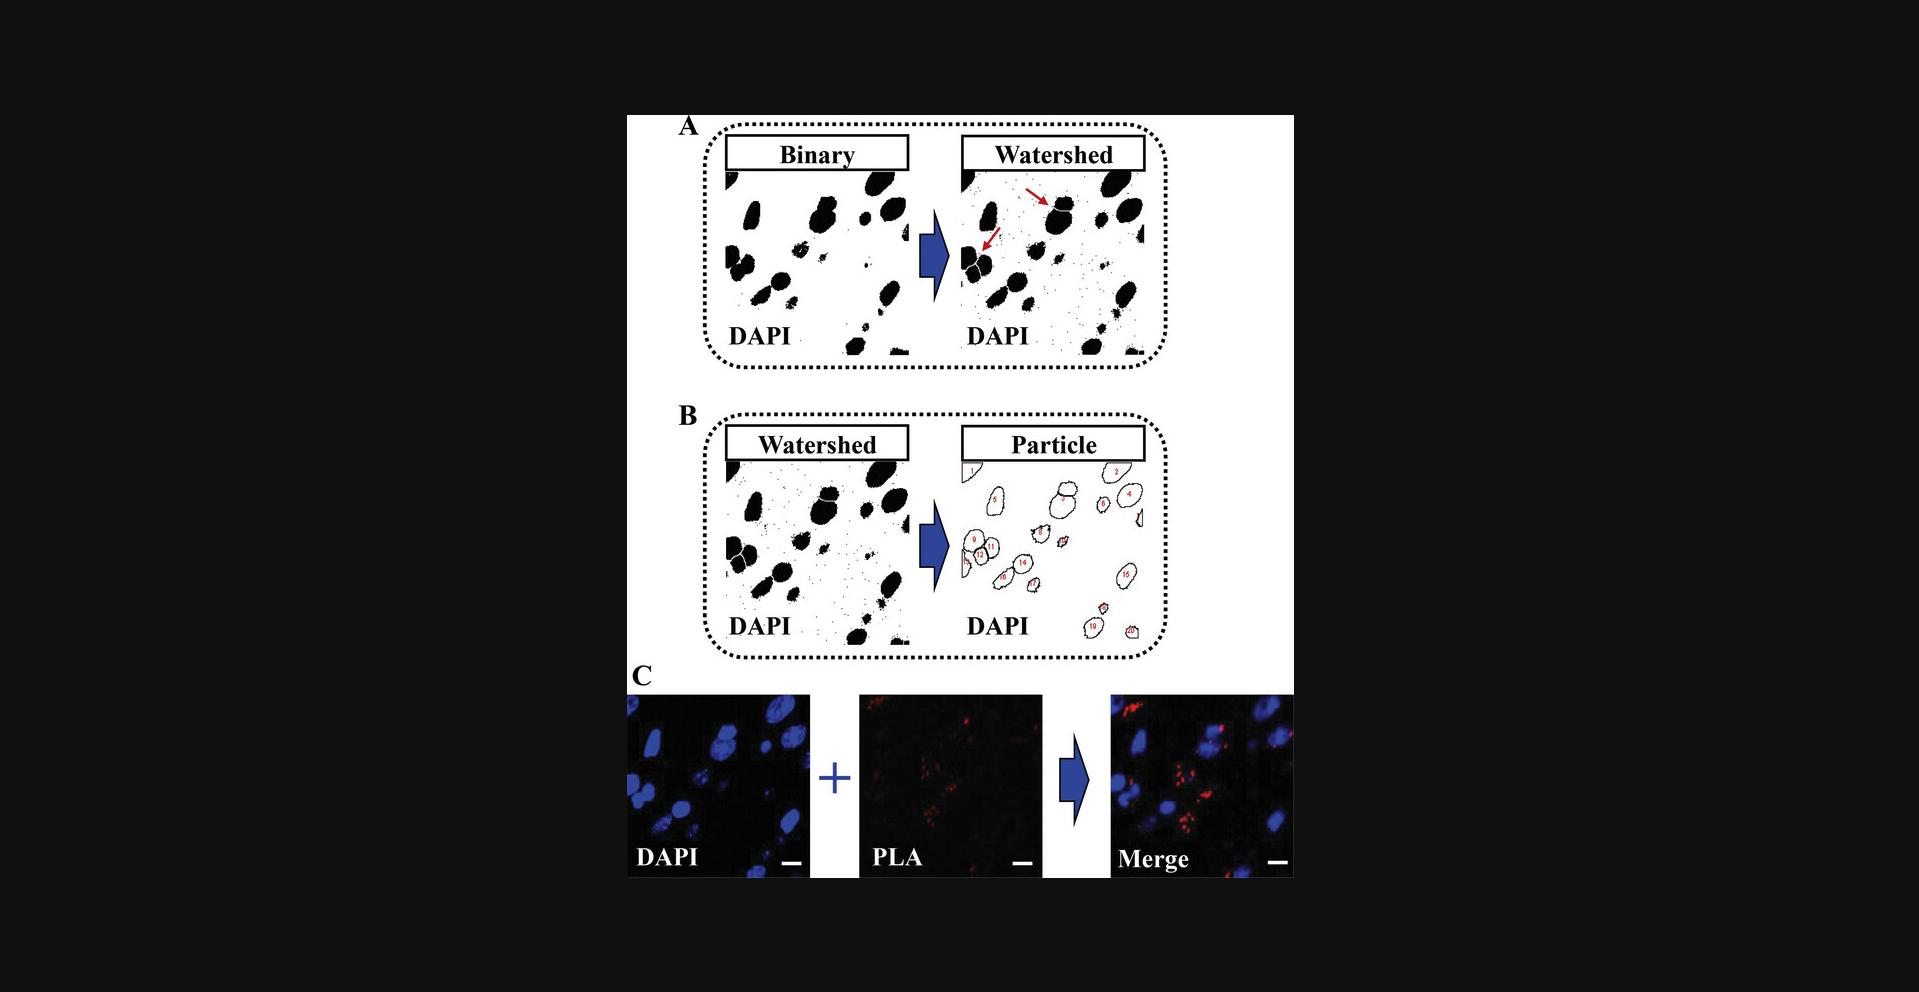
11.Count nuclei >30 μm2 in the resulting binary image by selecting [Analyze > Analyze particles …] (Fig. 7B) and setting the following parameters: Size (μm2), 30-Infinity; Show, Outlines; and Display results.
PLA signal analysis
In this section, the number of PLA probe particles is counted on its corresponding binary mask. Then, a composite image containing both nuclei PLA spots is created, and the ratio between the PLA probe particles and the number of nuclei calculated.
12.Apply a watershed transformation by selecting [Process > Binary > Watershed].
13.Count PLA probe particles >0.3 μm2 in the resulting PLA watershed image by selecting [Analyze > Analyze particles..] and setting the following parameters: Size (μm2), 0.3–10; Show, Outlines; and Display results.
14.For visualization purposes, create a composite image that combines the projected DAPI and PLA channels by selecting [Image > Color > Merge channels…] and follow these steps:
-
Select the MAX_PLA image as C1 (red)
-
Select the MAX_DAPI image as C3 (blue).
-
Select the Create composite option to generate the merged image (Fig.7C).
15.Obtain a quantitative measure of the PLA signal by calculating the ratio between the number of PLA probe particles and the number of nuclei present in the sample.
16.Graph data that contain appropriate negative controls (Fig. 8).
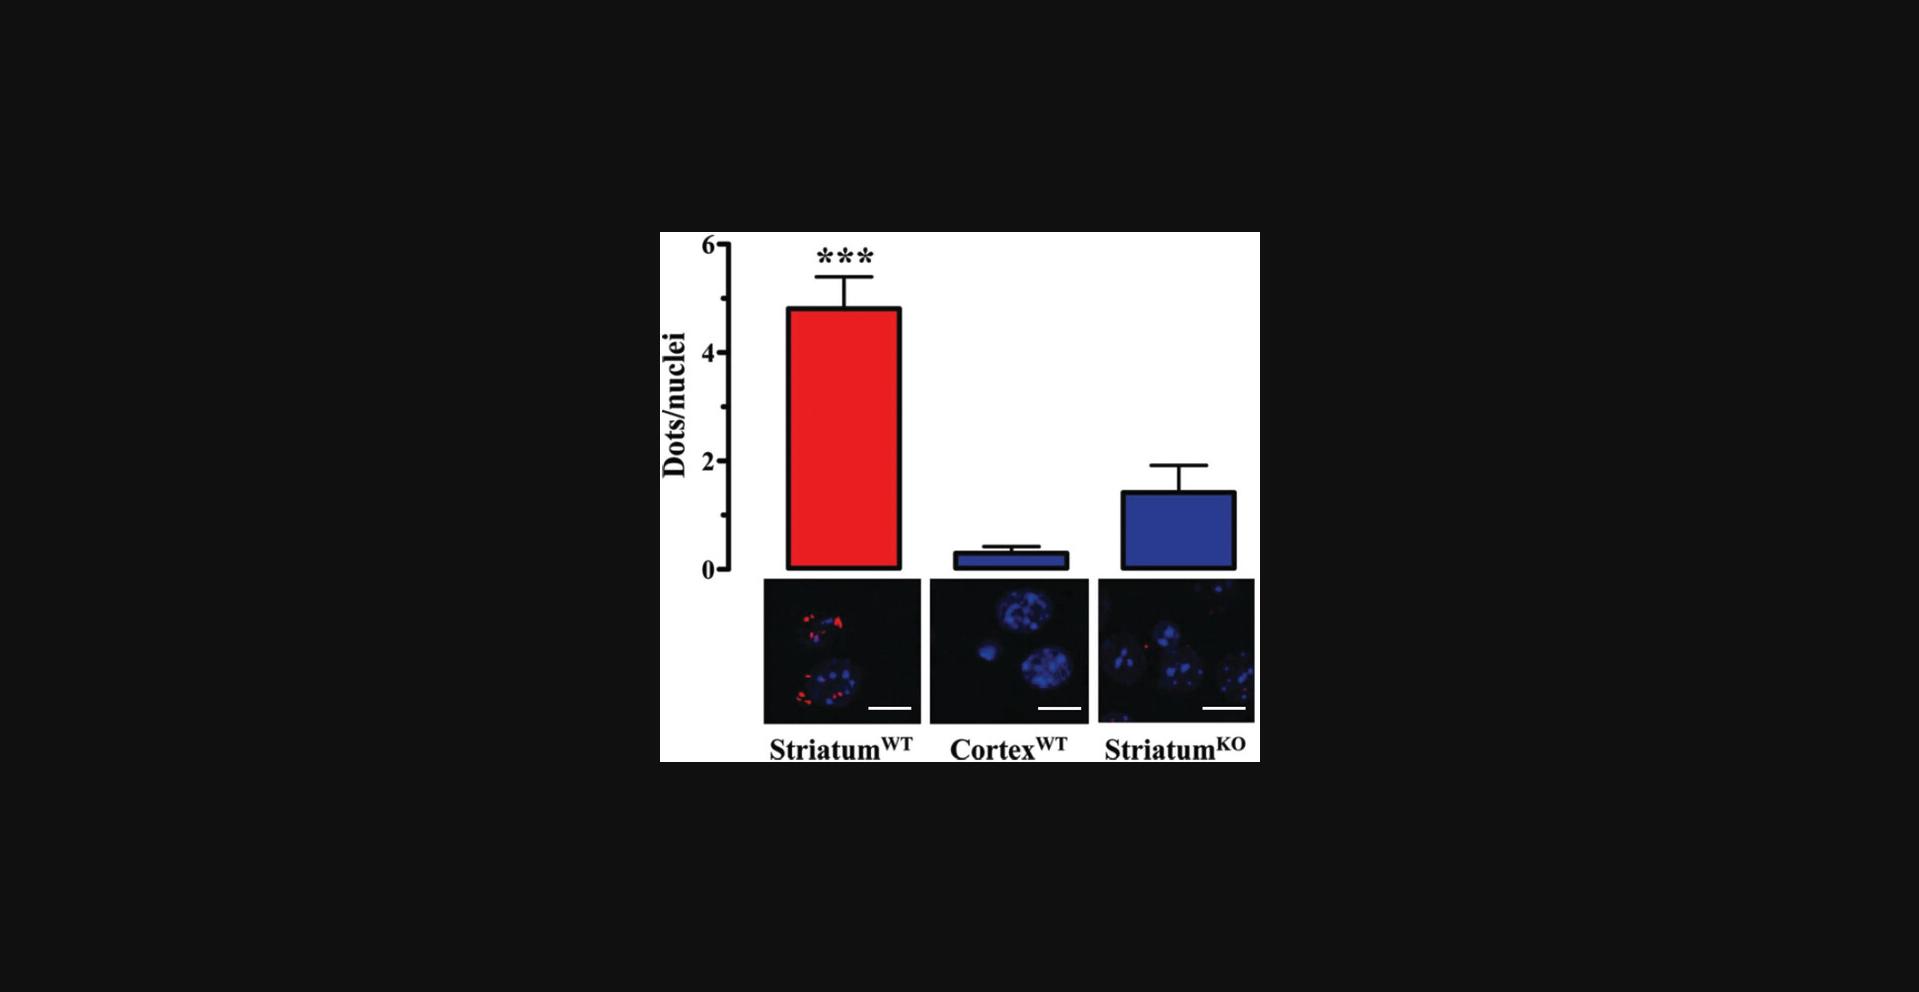
17.Perform a suitable statistical analysis of the results (Fig. 8).
REAGENTS AND SOLUTIONS
Use distilled deionized water in all recipes and protocol steps.
Blocking solution
Mix 10% normal donkey serum (NDS; Jackson ImmunoResearch Laboratories, cat. no. 017-000-121) and 0.05% Triton X-100 (Sigma-Aldrich) in 1× PBS (see recipe)
Formaldehyde solution, 4% in 1× PBS
- Mix 107.4 ml of 36.5%-38% formaldehyde solution (Sigma-Aldrich) with 100 ml 10× PBS (see recipe) and bring up to 1 L with H2O
- Prepare fresh
Ligation solution, 5×
- 1.25 M NaCl (73.05 mg/ml)
- 5 mM ATP (2.75 mg/ml)
- 0.125% BSA (1.25 mg/ml; Sigma-Aldrich)
- 0.25% Tween-20
- Store at −20°C up to 1 year
Phosphate buffered saline (PBS), 10×
- 80.7 mM Na2HPO4 (28.9 g/L)
- 14.7 mM KH2PO4 (2 g/L)
- 1.4 mM NaCl (80 g/L)
- 27 mM KCl (2 g/L)
- Adjust pH to 7.2 using HCl or NaOH
- Store at room temperature up to 6 months
Phosphate buffered saline (PBS), 1×
- Dilute 1:10 the 10× PBS (see recipe) in H2O
- Store at 4°C up to 1 month
P-LISA wash buffer A
- 150 mM NaCl (8.8 g/L)
- 10 mM Tris base (1.2 g/L)
- 0.05% Tween-20 (0.5 ml/L)
- Adjust pH to 7.4 using HCl
- Filter solution through a 0.22-μm filter
- Store at 4°C up to 1 month
P-LISA wash buffer B
- 100 mM NaCl (5.84 g/L)
- 200 mM Tris (4.24 g/L Tris base and 26 g/L Tris·HCl)
- 0.05% Tween-20 (0.5 ml/L)
- Adjust pH to 7.5 using either HCl or NaOH
- Filter solution through a 0.22-μm filter
- Store at 4°C up to 1 month
Rolling-circle amplification (RCA) solution, 5×
- 250 mM Tris·HCl (39.4 g/L)
- 50 mM MgCl2 (4.76 g/L)
- 50 mM (NH4)2SO4 (6.6 g/L)
- Adjust pH to 7.5 using NaOH
- 5 mM dNTPs (1 mM of each)
- 25% glycerol
- 0.125% BSA (1.25 mg/ml; Sigma-Aldrich)
- 0.25% Tween-20
- Store at −20°C up to 1 year
Walter's antifreezing solution
- 30% glycerol
- 30% ethylene glycol (Sigma-Aldrich)
- in 1× PBS (see recipe), pH 7.2
- Store at −20°C up to 1 year
COMMENTARY
Background Information
Detection of low-abundance and/or transient receptor-receptor interactions requires both high selectivity and sensitivity. The former may be achieved by using antibodies and the latter by means of enzymatic activities. Hence, the use of antibodies is a suitable and resourceful approach for the detection of endogenously expressed receptors and their interactions. On the other hand, the sensitivity may be boosted by enzyme-coupled activity, prompting potent signal amplification. Accordingly, the PLA combines the dual recognition of an antibody-targeted assay with a split-reporter enzymatic approach, thus generating a selective and sensitive method for the specific detection of receptor-receptor interactions (Fernández-Dueñas et al., 2021).
The notion of using DNA ligation for analytical purposes was initially proposed in the early 1970's after the discovery of ligases (Besmer et al., 1972). Subsequently, the use of this concept ended with the description of proximity-dependent DNA ligation assays, or simply PLA, allowing the detection of zeptomole (40 × 10–21 mol) amounts of the cytokine platelet-derived growth factor (PDGF) without washes or separations (Fredriksson et al., 2002). More recently, PLA or P-LISA was developed to enable the detection of individual proteins and protein-protein interactions in cultured cells and in native tissue (Söderberg et al., 2006, 2008). Interestingly, the P-LISA has both single-molecule resolution and superior dynamic range compared to those of other current antibody-based protocols, thus allowing relative signal quantification and localization.
Critical Parameters
Tissue fixation
Tissue fixation is one of the most critical steps for the success of P-LISA. Indeed, since P-LISA depends on specific epitope-antibody interactions, the preservation of tissue morphology and antigenicity of target molecules (i.e., GPCR) is extremely important, as happens for all immunohistochemical procedures (Ramos-Vara & Miller, 2014). Accordingly, incomplete fixation (underfixation) of tissue (e.g., brain) may lead to rapid proteolytic degradation of target proteins (i.e., GPCRs), thus reducing specific immunoreactivity. Importantly, within the brain there are areas that easily fix (e.g., cortex) while others (e.g., striatum) are more resilient to perfuse with the fixative solution and thus are prone to get underfixed. An underfixed tissue (i.e., with pink-colored appearance) will render a low number of P-LISA puncta, thus underestimating the amount of P-LISA signal (i.e., GPCR interaction) and minimally reducing the differences from the background. Hence, a poor fixation cannot be corrected at a later stage and is a common source of problems for the detection of P-LISA. On the other hand, an excess of fixation (overfixation) may end with epitope masking or with an intense nonspecific P-LISA background, which may blur specific labeling. Generally speaking, underfixation is a much greater problem than overfixation and consequently, special attention should be paid to all key steps within the tissue fixation process (i.e., fixative, duration, temperature, and pH; Fig. 2), which will in fact affect the degree of tissue fixation and thus the P-LISA detection.
Whole animal perfusion fixation, as presented here, may not be sufficient to fix the tissues of interest. In such cases, dissected tissue (e.g., brain) can be immersed in fixative solution overnight (i.e., post-fixation). To enhance the penetration of the fixative during post-fixation, it is recommended that tissues be no thicker than 10 mm. On the other hand, the volume of the fixative should be 50-100 times larger than the volume of the tissue. If the tissue floats, it should be submerged. Again, it is important to optimize both fixation and post-fixation conditions, since underfixation or overfixation may reduce or preclude the P-LISA signal.
Finally, it is important to mention here that while sample preparation in fixed tissue-based PLA methods (i.e., P-LISA) is very laborious and therefore time-consuming, the implementation of PLA techniques in isolated cultured cells could be a suitable and easy alternative to visualize GPCR interactions. Indeed, since the fixation procedure for cultured cells is quite straightforward, most users will not have difficulty obtaining appropriate results in adherent or suspended cell lines (Leuchowius et al., 2011).
Antibodies
The most important aspect when designing a P-LISA experiment is primary antibody pair selection. Indeed, the critical feature of any primary antibody is specificity for the epitope (i.e., GPCR), therefore all primary antibodies used in P-LISA should be first tested for specificity in immunohistochemistry experiments using proper controls (see below). Subsequently, all P-LISA steps must be optimized to visualize specific staining and minimize nonspecific background signals. This initial antibody characterization of the incubation conditions includes: (i) working dilution (i.e., primary antibody concentration), (ii) temperature, (iii) diluent solution, and (iv) incubation time. All these conditions should be empirically optimized by means of immunohistochemistry experiments for each primary antibody, either monoclonal or polyclonal, and also for the specimen used.
The binding of the antibody to its recognizing protein depends on the preservation of the native conformational state of the target protein. Importantly, access of the antibody to its epitope could be conditioned by post-translational modifications, protein-protein interactions, diluent salt concentration, temperature, pH, and fixation (see above). Since polyclonal antibodies can recognize multiple epitopes within the target protein, they are less prone to being influenced by conformational changes. On the contrary, because monoclonal antibodies bind with high affinity and specificity to a single epitope, disruption of the target protein conformation may preclude recognition and thus antigen detection. Additionally, polyclonal antibodies are more stable over a range of pH and salt concentrations when compared to monoclonal antibodies. Overall, polyclonal antibodies are used more frequently in P-LISA experiments, but when the detection of close related proteins (i.e., homologous receptors) is compromised then the use of monoclonal antibodies is recommended.
Optimization of P-LISA detection is initially assessed by maintaining the temperature and incubation time constant, while varying the concentration of the primary antibody to determine the optimal P-LISA signal. Therefore, a high affinity primary antibody may be used at high concentrations for shorter incubation times or at lower concentrations but with a longer time. However, longer incubation periods (i.e., overnight) at lower temperatures (i.e., 4°C) are often preferred to promote specific staining and guarantee antibody penetration throughout the tissue section. To increase antibody penetration, incubations could be performed with free floating tissue sections.
Controls
As a general rule in research—and P-LISA is not an exception—proper controls are key elements to consider any experimental approach as a trustworthy technique. Accordingly, in addition to the above-mentioned considerations, some key controls should be considered when P-LISA experiments are performed. First, the nonspecific binding of PLA probes to the sample tissue should be checked. Hence, the whole protocol should be performed in the absence of the primary antibodies. Because PLA probes are not expected to recognize any sample epitope apart from the primary antibodies used in the P-LISA experiment, the resulting stain should be low. Second, to confirm the specificity of the primary antibodies in a P-LISA experiment, tissue samples where either one or both receptors are not expressed are required. Therefore, tissues obtained from knockout animals should be used in the detection of P-LISA. Finally, another interesting control may consist of performing the P-LISA detection in a tissue or a region of the tissue where the interaction is expected not to occur. Overall, three types of controls are recommended in P-LISA experiments: (i) PLA probe specificity, (ii) primary antibody specificity, and (iii) sample/tissue selectivity.
Even though the output of the P-LISA technique is an image, proper computational processing allows us to quantify data. This can be achieved by using the ImageJ program “Analyze particle” function located in the Analyze menu toolbar. To be able to have reliable values of the PLA probes dots, it is important to process all images using the same settings for background subtraction and contrast enhancements. It is also crucial to determine which size dots can be considered as background, since the function will only count particles that fit in a given size range.
Troubleshooting
The success of the P-LISA method depends primarily on the quality of the antibodies used and the sample preparation mode. The main problem often found when using antibodies is the lack of antigen recognition, cross-reactivity (i.e., the antibody binds to other proteins), and nonspecific absorption (i.e., the antibody is trapped within the sample in an unspecific manner). These facts might limit the specificity of the P-LISA method. On the other hand, the use of an enzymatic activity for signal amplification might also prompt false P-LISA detection. In general, the difficulties often found to cause a lack of detection, nonspecific staining, or a high background are shown in Table 1.
| Problem | Causes | Solutions |
|---|---|---|
| Low Signal | Underfixation | Revise concentration, temperature, and pH of the fixative solution; increase duration of the fixation process |
| Inappropriate primary antibody | Select an antigen-specific antibody and validate its antigen detection properties by alternative methods (e.g., Immunoblot, etc.) |
|
| Wrong concentration (i.e., too low) of the primary or PLA probes | Optimize the concentration |
|
| The activity of primary antibody or PLA probes is lost | Check the antibody storage condition and perform an experiment using a positive control |
|
| Wrong pH of the primary antibody solution | Ensure that the primary antibody works properly | |
| Deficient permeabilization | Increase the concentration of the permeabilizing agent (i.e., Triton X-100) | |
Low or no fluorescence signal |
The fluorescently-labeled probe should be stored in the dark | |
| High background signal | The concentration of the primary antibody was too high | Dilute the primary antibody |
| The incubation time of the primary antibody was too long | Reduce the incubation time of primary antibodies | |
| The temperature of primary antibody incubation was high | Perform the primary antibody incubation at 4°C to allow an increased incubation time and thus antibody penetration | |
| Serum was absent or insufficient in the blocking solution | Revision of serum concentration and/or increase in blocking time | |
| Inadequate buffer A/B washing | Wash with buffer A/B for an adequate amount of time and several times to eliminate fixatives | |
| Polyclonal primary antibody | Try a monoclonal primary antibody | |
| Nonspecific staining | Overfixation | Reduce the duration of the fixation process; revise concentration, temperature, and pH of the fixative solution |
| Deficient washing after incubation with primary antibodies and PLA probe | Wash with buffer A/B appropriately | |
| The concentration of the primary antibody or PLA probe was too high | Decrease the concentration of primary antibody or PLA probe | |
| The PLA probe is the same species as the sample origin | Change the PLA probe |
Understanding Results
We took advantage of P-LISA to detect D2R-A2AR oligomers in the striatum of control and parkinsonian rats (Fernández-Dueñas et al., 2015). In our hands, the P-LISA signal observed for this GPCR oligomer in the rat or mouse striatum was consistent and within the same range (5-6 dots/nuclei) to that described previously (Trifilieff et al., 2011). Interestingly, our negative controls (i.e., A2AR-KO and brain cortex) provided 0.5-1.5 dots/nuclei. Therefore, the specific P-LISA signal for D2R-A2AR complexes in the rat/mouse striatum is typically about 3-10 times higher than the background signal. In fact, the obtained P-LISA results were validated using two alternative techniques (i.e., immunogold staining and electron microscopy detection, and RET experiments using fluorescent ligands; Fernández-Dueñas et al., 2015). In general, P-LISA is a powerful and straightforward technique for visualizing receptor-receptor interactions in native tissue provided it is performed under optimal conditions and also includes proper appropriate controls.
Time Considerations
Typically, the entire protocol can be performed in o1 week. On the first day, the animal is anesthetized and fixed, and the brain is post-fixed overnight. The second day, the brain is sliced and stored at −20°C in Walter's antifreezing solution. The third day, the slices are washed, blocked and incubated overnight with primary antibody solution. On the fourth day, the slices are incubated with the PLA probes, then the ligation and the RCA is performed; finally the slices are mounted on a slide and left overnight to make sure the samples are ready. Finally, the last day, the acquisition and the image processing can be performed.
Acknowledgments
We thank Manel Bosch and Benjamín Torrejón from Centers Científics i Tecnològics (CCiTUB) of the University of Barcelona for the technical assistance and microscopy expertise. We thank Centers de Recerca de Catalunya (CERCA) Programme/Generalitat de Catalunya for IDIBELL institutional support and Maria de Maeztu MDM-2017-0729 to Institut de Neurociencies, University of Barcelona. Supported by project PID2020-118511RB-I00 founded by MCIN/AEI/ 10.13039/501100011033, “ERDF A way of making Europe”, The Michael J. Fox Foundation (MJFF-001051) and Generalitat de Catalunya (2017SGR1604).
Author Contributions
Jaume Taura : Conceptualization, data curation, investigation, methodology, writing - original draft, writing - review and editing; Marc López-Cano : Conceptualization, data curation, investigation, methodology, writing - original draft, writing - review and editing; Víctor Fernández-Dueñas : Formal analysis, supervision, writing - original draft, writing - review and editing; Francisco Ciruela : Conceptualization, data curation, funding acquisition, methodology, project administration, resources, supervision, writing - original draft, writing - review and editing.
Conflict of Interest
The authors declare no conflict of interest.
Open Research
Data Availability Statement
Data sharing is not applicable to this article as no new data were created or analyzed in this study.
Literature Cited
- Besmer, P., Miller, R. C., Caruthers, M. H., Kumar, A., Minamoto, K., van de Sande, J. H., Sidarova, N., & Khorana, H. G. (1972). Studies on polynucleotides. CXVII. Hybridization of polydeoxynucleotides with tyrosine transfer RNA sequences to the r-strand of phi80psu + 3 DNA. Journal of Molecular Biology , 72(3), 503–522. https://doi.org/10.1016/0022-2836(72)90171-4
- Ciruela, F., Vallano, A., Arnau, J. M., Snchez, S., Borroto-Escuela, D. O., Agnati, L. F., Fuxe, K., & Fernndez-Dueas, V. (2010). G protein-coupled receptor oligomerization for what? Journal of Receptor and Signal Transduction Research , 30(5), 322–330. https://doi.org/10.3109/10799893.2010.508166
- Ciruela, F., Vilardaga, J.-P., & Fernández-Dueñas, V. (2010). Lighting up multiprotein complexes: Lessons from GPCR oligomerization. Trends in Biotechnology , 28(8), 407–415.
- Clark, J. D., Gebhart, G. F., Gonder, J. C., Keeling, M. E., & Kohn, D. F. (1997). Special report: The 1996 guide for the care and use of laboratory animals. ILAR Journal /National Research Council, Institute of Laboratory Animal Resources , 38(1), 41–48. http://www.ncbi.nlm.nih.gov/pubmed/11528046
- Congreve, M., de Graaf, C., Swain, N. A., & Tate, C. G. (2020). Impact of GPCR structures on drug discovery. Cell , 181(1), 81–91. https://doi.org/10.1016/J.CELL.2020.03.003
- Fernández-Dueñas, V., Bonaventura, J., Aso, E., Luján, R., Ferré, S., & Ciruela, F. (2022). Overcoming the Challenges of Detecting GPCR Oligomerization in the Brain. Current neuropharmacology , 20(6), 1035–1045. https://doi.org/10.2174/1570159X19666211104145727
- Fernández-Dueñas, V., Gómez-Soler, M., Jacobson, K. A., Kumar, S. T., Fuxe, K., Borroto-Escuela, D. O., & Ciruela, F. (2012). Molecular determinants of A(2A)R-D(2)R allosterism: Role of the intracellular loop 3 of the D(2)R. Journal of Neurochemistry , 123(3), 373–384. https://doi.org/10.1111/j.1471-4159.2012.07956.x
- Fernández-Dueñas, V., Taura, J. J., Cottet, M., Gómez-Soler, M., López-Cano, M., Ledent, C., Watanabe, M., Trinquet, E., Pin, J.-P., Luján, R., Durroux, T., & Ciruela, F. (2015). Untangling dopamine-adenosine receptor-receptor assembly in experimental parkinsonism in rats. Disease Models & Mechanisms, 8(1), 57–63. https://doi.org/10.1242/dmm.018143
- Ferré, S., Ciruela, F., Dessauer, C. W., González-Maeso, J., Hébert, T. E., Jockers, R., Logothetis, D. E., & Pardo, L. (2022). G protein-coupled receptor-effector macromolecular membrane assemblies (GEMMAs). Pharmacology & Therapeutics, 231, 107977. https://doi.org/10.1016/J.PHARMTHERA.2021.107977
- Ferré, S., Sarasola, L. I., Quiroz, C., & Ciruela, F. (2022). Presynaptic adenosine receptor heteromers as key modulators of glutamatergic and dopaminergic neurotransmission in the striatum. Neuropharmacology , 223, 109329. https://doi.org/10.1016/J.NEUROPHARM.2022.109329
- Flecknell, P. A. (1993). Anaesthesia of animals for biomedical research. British Journal of Anaesthesia , 71(6), 885–894. http://www.ncbi.nlm.nih.gov/pubmed/8280560
- Fredriksson, S., Gullberg, M., Jarvius, J., Olsson, C., Pietras, K., Gústafsdóttir, S. M., Östman, A., & Landegren, U. (2002). Protein detection using proximity-dependent DNA ligation assays. Nature Biotechnology , 20(5), 473–477. https://doi.org/10.1038/NBT0502-473
- Gandía, J., Lluís, C., Ferré, S., Franco, R., Ciruela, F., Gandia, J., Lluis, C., Ferre, S., Franco, R., & Ciruela, F. (2008). Light resonance energy transfer-based methods in the study of G protein-coupled receptor oligomerization. BioEssays : News and Reviews in Molecular, Cellular and Developmental Biology , 30(1), 82–89. https://doi.org/10.1002/bies.20682
- Hauser, A. S., Attwood, M. M., Rask-Andersen, M., Schiöth, H. B., & Gloriam, D. E. (2017). Trends in GPCR drug discovery: New agents, targets and indications. Nature Reviews. Drug Discovery , 16(12), 829–842. https://doi.org/10.1038/NRD.2017.178
- Hilger, D., Masureel, M., & Kobilka, B. K. (2018). Structure and dynamics of GPCR signaling complexes. Nature Structural & Molecular Biology, 25(1), 4–12. https://doi.org/10.1038/S41594-017-0011-7
- Huang, Y., Todd, N., & Thathiah, A. (2017). The role of GPCRs in neurodegenerative diseases: avenues for therapeutic intervention. Current opinion in pharmacology , 32, 96–110. https://doi.org/10.1016/j.coph.2017.02.001
- Jarvius, M., Paulsson, J., Weibrecht, I., Leuchowius, K.-J., Andersson, A.-C., Wählby, C., Gullberg, M., Botling, J., Sjöblom, T., Markova, B., Ostman, A., Landegren, U., & Söderberg, O. (2007). In situ detection of phosphorylated platelet-derived growth factor receptor beta using a generalized proximity ligation method. Molecular & Cellular Proteomics : MCP, 6(9), 1500–1509. https://doi.org/10.1074/mcp.M700166-MCP200
- Leuchowius, K. J., Weibrecht, I., & Söderberg, O. (2011). In situ proximity ligation assay for microscopy and flow cytometry. Current Protocols in Cytometry , 56, 9.36.1–9.36.15. https://doi.org/10.1002/0471142956.CY0936S56
- López-Cano, M., Fernández-Dueñas, V., & Ciruela, F. (2019). Proximity ligation assay image analysis protocol: Addressing receptor-receptor interactions. Methods in Molecular Biology (Clifton, N.J.) , 2040, 41–50. https://doi.org/10.1007/978-1-4939-9686-5_3
- Matamales, M., Bertran-Gonzalez, J., Salomon, L., Degos, B., Deniau, J. M., Valjent, E., Hervé, D., & Girault, J. A. (2009). Striatal medium-sized spiny neurons: Identification by nuclear staining and study of neuronal subpopulations in BAC transgenic mice. PloS One , 4(3), e4770. https://doi.org/10.1371/JOURNAL.PONE.0004770
- Møller, T. C., Hottin, J., Clerté, C., Zwier, J. M., Durroux, T., Rondard, P., Prézeau, L., Royer, C. A., Pin, J. P., Margeat, E., & Kniazeff, J. (2018). Oligomerization of a G protein-coupled receptor in neurons controlled by its structural dynamics. Scientific Reports , 8(1), 10414. https://doi.org/10.1038/S41598-018-28682-6
- Ramos-Vara, J. A., & Miller, M. A. (2014). When tissue antigens and antibodies get along: Revisiting the technical aspects of immunohistochemistry–the red, brown, and blue technique. Veterinary Pathology , 51(1), 42–87. https://doi.org/10.1177/0300985813505879
- Romero-Fernandez, W., Taura, J. J., Crans, R. A. J., Lopez-Cano, M., Fores-Pons, R., Narváez, M., Carlsson, J., Ciruela, F., Fuxe, K., & Borroto-Escuela, D. O. (2022). The mGlu5 receptor protomer-mediated dopamine D2 receptor trans-inhibition is dependent on the adenosine A2A receptor protomer: Implications for Parkinson's Disease. Molecular Neurobiology , 59(10), 5955–5969. https://doi.org/10.1007/S12035-022-02946-9/FIGURES/6
- Rukavina Mikusic, N. L., Silva, M. G., Pineda, A. M., & Gironacci, M. M. (2020). Angiotensin receptors heterodimerization and trafficking: How much do they influence their biological function? Frontiers in Pharmacology , 11, 1179. https://doi.org/10.3389/FPHAR.2020.01179/BIBTEX
- Sarasola, L. I., del Torrent, C. L., Pérez-Arévalo, A., Argerich, J., Casajuana-Martín, N., Chevigné, A., Fernández-Dueñas, V., Ferré, S., Pardo, L., & Ciruela, F. (2022). The ADORA1 mutation linked to early-onset Parkinson's disease alters adenosine A1-A2A receptor heteromer formation and function. Biomedicine & Pharmacotherapy = Biomedecine & Pharmacotherapie, 156, 113896. https://doi.org/10.1016/J.BIOPHA.2022.113896
- Schneider, C. A., Rasband, W. S., & Eliceiri, K. W. (2012). NIH Image to ImageJ: 25 years of image analysis. Nature Methods , 9(7), 671. https://doi.org/10.1038/NMETH.2089
- Smith, C. L. (2011). Basic confocal microscopy. Current Protocols in Neuroscience , 56(1), 2.2.1–2.2.18. https://doi.org/10.1002/0471142301.NS0202S56
- Söderberg, O., Gullberg, M., Jarvius, M., Ridderstråle, K., Leuchowius, K. J., Jarvius, J., Wester, K., Hydbring, P., Bahram, F., Larsson, L. G., & Landegren, U. (2006). Direct observation of individual endogenous protein complexes in situ by proximity ligation. Nature Methods , 3(12), 995–1000. https://doi.org/10.1038/NMETH947
- Söderberg, O., Leuchowius, K. J., Gullberg, M., Jarvius, M., Weibrecht, I., Larsson, L. G., & Landegren, U. (2008). Characterizing proteins and their interactions in cells and tissues using the in situ proximity ligation assay. Methods (San Diego, Calif.) , 45(3), 227–232. https://doi.org/10.1016/J.YMETH.2008.06.014
- Taura, J., Fernández-Dueñas, V., & Ciruela, F. (2015). Visualizing G protein-coupled receptor-receptor interactions in brain using proximity ligation in situ assay. Current Protocols in Cell Biology , 67, 17.17.1–17.17.16. https://doi.org/10.1002/0471143030.CB1717S67
- Trifilieff, P., Rives, M.-L., Urizar, E., Piskorowski, R. A., Vishwasrao, H. D., Castrillon, J., Schmauss, C., Slättman, M., Gullberg, M., & Javitch, J. A. (2011). Detection of antigen interactions ex vivo by proximity ligation assay: Endogenous dopamine D2-adenosine A2A receptor complexes in the striatum. BioTechniques , 51(2), 111–118. https://doi.org/10.2144/000113719
Internet Resources
Image J program version 1.53u and installation instructions. To ensure accurate quantification, we recommend using BMP, TIFF, PNG, or GIF formats as they preserve all the information in the image.

