Using polyan: a Python package for modelling polysome profiles from ribosome density data
Tobias von der Haar
Disclaimer
DISCLAIMER – FOR INFORMATIONAL PURPOSES ONLY; USE AT YOUR OWN RISK
The protocol content here is for informational purposes only and does not constitute legal, medical, clinical, or safety advice, or otherwise; content added to protocols.io is not peer reviewed and may not have undergone a formal approval of any kind. Information presented in this protocol should not substitute for independent professional judgment, advice, diagnosis, or treatment. Any action you take or refrain from taking using or relying upon the information presented here is strictly at your own risk. You agree that neither the Company nor any of the authors, contributors, administrators, or anyone else associated with protocols.io, can be held responsible for your use of the information contained in or linked to this protocol or any of our Sites/Apps and Services.
Abstract
The assessment of transcriptome-wide ribosome binding to mRNAs is useful for studying the dynamic regulation of protein synthesis in living cells. Two methods frequently applied in eukaryotic cells that operate at different levels of resolution are polysome profiling, which reveals the distribution of ribosome loads across the transcriptome, and ribosome footprinting (also termed ribosome profiling or Ribo-Seq), which when combined with appropriate data on mRNA expression levels can reveal ribosome densities on individual transcripts. we have provided Python functions for relating the information content of these two methods to one another, by reconstructing theoretical polysome profiles from ribosome footprinting data. Modelled polysomes are useful for assessing dataset quality in a simple, visual approach that is useful for validating and analysing ribosome footprinting datasets .
Steps
General Functionality
polyan accompanies a publication by Hedayioglu et al. (2022), Evaluating data integrity in ribosome footprinting datasets through modelled polysome profiles .
polyan provides Python functions for modelling polysome profiles from input data on transcript abundance and ribosome occupancy of transcripts. Typically, such data are intended to be the result of ribosome footprinting experiments, but in principle any experimental or computational technique that yields information on how many ribosomes are bound to individual transcripts can be used as input.
polyan currently provides three main functions: fp2poly() calculates peak volume information for a modelled polysome profile, based on a single input dataset. plot_poly() generates plotting coordinates for the modelled profile, which can then be plotted using standard Python plotting functions. prmsd_profile() calculates the probability that the differences between two profiles are greater than expected by chance.
A fourth function, compare_profiles(), reads in ribosome density data for two conditions and maps the principal shifts between modelled polysome peaks between these two conditions, thereby providing a coarse road map of translational control under these conditions.
Prerequisites
polyan has been tested on Windows and Linux systems running Python 3.7 and higher, which was installed as part of the Anaconda package. However, polyan should run in all Python 3-based environments.
polyan has a number of dependencies on other packages, all of which should be available as part of any standard python installation, including pandas, numpy, pyplot, scipy and json.
Installation
The polyan package is available from PyPI using the pip installer, which is included with most Python distributions. For installation , execute
pip install polyan
```Where Python was installed as part of Anaconda in windows, this command may need to be executed in an Anaconda prompt window rather than a general command prompt window.
Import polyan into your Python environment by executing
import polyan
Data preparation
polyan requires the source data to be formatted as a Pandas dataframe, which needs to contain at least two columns for gene names and Ribo-Seq data, and may contain a third column for RNA-Seq data. Where no RNA-Seq data are specified, a reference dataset is used for RNA abundances. The dataframe can contain additional columns but this will result in a warning of columns not being used for calculations.
Dataset columns must be in the order gene names, Ribo-Seq counts, RNA-Seq counts. The Seq data must be provided as counts per gene (ie not as RPK or RPKM values which are normalised to gene length). Recommended gene names are systematic gene names for yeast (eg YAL005C), and ENSEMBL gene names for human genes (eg ENSG00000210100). Conventional gene names or systematic transcript names may work as well.
An example yeast dataset is attached ( GSE87614.csv ), which if present in the working directory can be loaded into a dataframe by executing
import pandas as pd
df = pd.read_csv('GSE87614.csv')
At the time of publication, polyan provides support datasets for Saccharomyces cerevisiae and for human HEK293 cells. It is possible to use polyan with any other organism, but then support datasets need to be provided by the user including a reference list of gene names with corresponding transcript lengths.
Modelling polysome profiles
Polysome profiles can be modelled by consecutive execution of the fp2poly() and plot_poly() functions, followed by plotting of the x and y coordinates returned by plot_poly() using general plotting packages such as pyplot. The default settings of fp2poly() work on yeast data including RNA-Seq data as part of the dataset and conforming to the requirements explained in steps 6-7, as is the case for the dataset loaded in step 6. Provided that polyan has been installed and imported correctly, peak volumes for this dataset can be generated by executing
peak_vols = polyan.fp2poly(df)
```and coordinates for the polysome trace can be calculated from peak_vols by executing
trace = polyan.plot_poly(peak_vols)
These coordinates can then be plotted via any suitable plotting package. The example output shown in step 2 can be reproduced using pyplot by executing
import matplotlib.pyplot as plt fig,ax = plt.subplots() ax.scatter(trace[0],trace[1],s=2,c='black') plt.show()
Changing parameters for fp2poly()
fp2_poly currently provides context data (gene lengths and generic RNA abundance data) for S.cerevisiae and for HEK293 cells (the HEK293 parameters will likely work for many cultured human cell types if RNA-Seq data are provided as part of the dataset).
Which parameter set to use is specified by the parset parameter, which can either be 'Scer' (default) or 'HEK'. To calculate peak volumes for a HEK293 dataset containing RNA-Seq data, the command is
peak_vols = polyan.fp2poly(df,parset='HEK')
```The order of the column names must always be Gene names, then Ribosome density data, then RNA abundance data (if used).
Where datasets only contain gene names and Ribo_seq data, the inbuilt reference RNA dataset can be used by setting has_RNA to False.
polyan.fp2poly(df, has_RNA=False)
```Where multiple datasets are being processed, some of which contain RNA data and some of which don't, these can be processed using Python try and except.
try: polyan.fp2poly(df) except: polyan.fp2poly(df, has_RNA=False)
Calculating p-values for dataset similarity
To assess the similarity between two datasets, polyan.prmsd_profile() can be used on two peak volume arrays calculated with fp2poly.
pv1 = polyan.fp2poly(df1)
pv2 = polyan.fp2poly(df2)
polyan.prmsd_profile(pv1,pv2)
It is also possible to use prmsd_profile for comparing a modelled dataset to a stored experimental reference profile, but then the organism must be specified by setting the parset parameter (currently 'Scer' or 'HEK', 'Scer' being default). The reference profile was generated with wild-type cells growing exponentially in rich media.
pv1 = polyan.fp2poly(df1)
polyan.prmsd_profile(pv1,'ref', parset='Scer')
The output of 'prmsd_profile' is a p-value for the probability of observing the root mean square deviation between two profiles when comparing any two "known good" datasets from a set of reference datasets. A typical use of this would be to compare an unknown dataset to a "known good" or experimentally generated dataset. If low p-values are returned, the unknown dataset differs in way that would be unlikely to be observed if two "known good" datasets are compared.
This assessment should be accompanied by a visual inspection of the modelled profiles using polyan.plot_poly() as shown above.
Mapping movement between polysome peaks
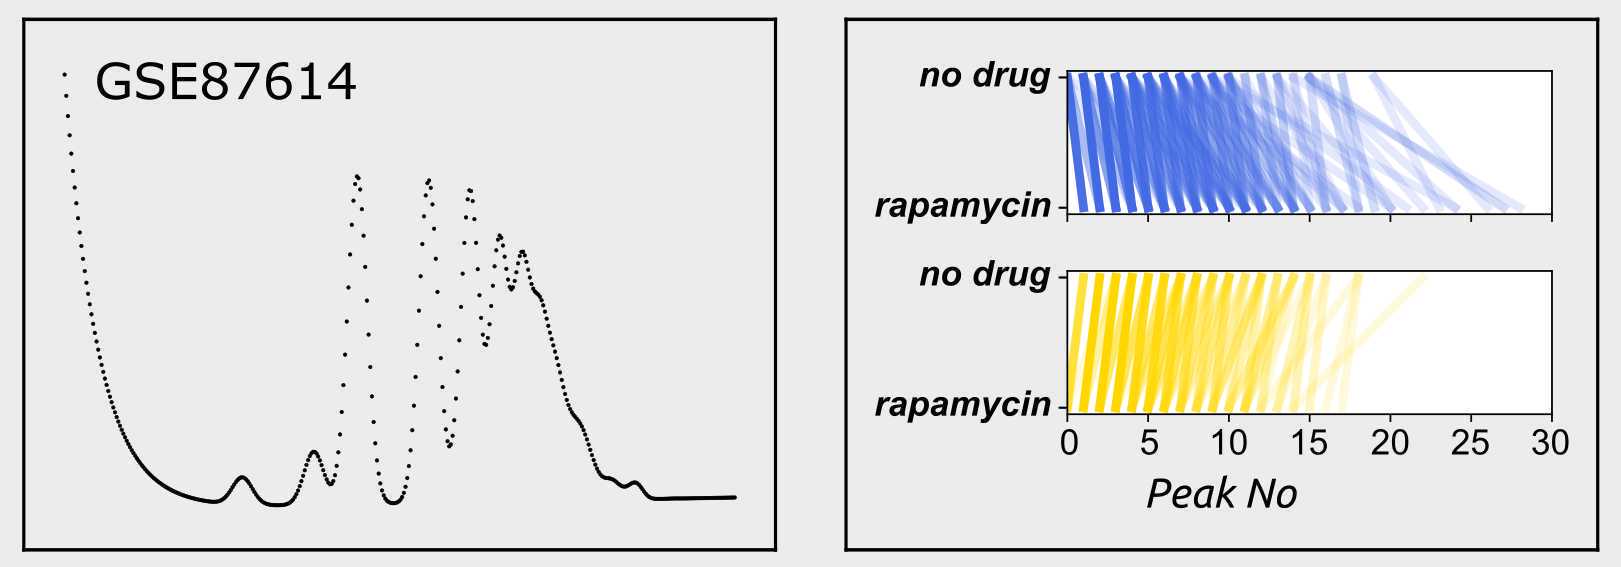
Changes in ribosome density between two conditions can be mapped using the compare_profiles() function of polyan. the results are trturned as pyplot fig and ax objects, which can be visualised using the plt.show() function of pyplot. To compare how transcripts shift between modelled polysome peaks eg when comparing two datasets stored in two dataframes df1 and df2, execute
polyan.compare_profiles(df1,df2)
```The example output shown in step 2 was generated by comparing datasets [GSE67387_WT.csv](https://static.yanyin.tech/literature_test/protocol_io_true/protocols.io.5jyl8mz28g2w/cdppfnq62.csv) and [GSE67387_rapamycin.csv](https://static.yanyin.tech/literature_test/protocol_io_true/protocols.io.5jyl8mz28g2w/cdpqfnq64.csv) , from the data by [Nedialkova and Leidel (2015)](https://pubmed.ncbi.nlm.nih.gov/26052047/).
