Proteoform Identification and Quantitation with TopPIC and TDPortal for Human Tissues
Mowei Zhou, Ljiljana.PasaTolic, James M Fulcher, Yen-Chen Liao
Abstract
This protocol describe a workflow for top-down proteomics analysis. Top-down proteomics data are processed with two separate software packages TopPIC and TDPortal. Proteoform identifications were merged from the two software with unified FDR to increase coverage. TopPICR was separately used to cluster TopPIC proteoform to extract abundances for label-free quantitation.
Steps
TopPIC Processing
Convert Instrument raw data to mzML using MSConvert
Software
| Value | Label |
|---|---|
| MSConvert | NAME |
| https://proteowizard.sourceforge.io/download.html | LINK |
Analyze mzML files using the TopPIC Suite (version 1.4.13.1) .
Software
| Value | Label |
|---|---|
| TopPIC Suite | NAME |
| https://github.com/toppic-suite/toppic-suite | REPOSITORY |
| Xiaowen Liu | DEVELOPER |
| https://www.toppic.org/software/toppic/index.html | LINK |
| 1.4.13.1 | VERSION |
TopFD Parameters---------------------------------
Spectral data type: Centroid
Maximum charge: 30
Maximum monoisotopic mass: 50000 Dalton
Peak error tolerance: 0.02 m/z
MS1 signal/noise ratio: 3
MS/MS signal/noise ratio: 1
Thread number: 10
Precursor window size: 2 m/z
Use Env CNN model: No
Miss MS1 spectra: No
Generate Html files: Yes
Do final filtering: Yes
TopPIC 1.4.13 Parameters----------------------------------
********************** Parameters **********************
Protein database file: ID_008032_8627C6BD.fasta.zip
Spectrum file: xxxxxxxxxxxxxxxxx_ms2.msalign
Number of combined spectra: 1
Fragmentation method: FILE
Search type: TARGET
Fixed modifications: None
Use TopFD feature file: True
Maximum number of unexpected modifications: 1
Error tolerance for matching masses: 15 ppm
Error tolerance for identifying PrSM clusters: 0.8 Da
Spectrum-level cutoff type: EVALUE
Spectrum-level cutoff value: 0.05
Proteoform-level cutoff type: EVALUE
Proteoform-level cutoff value: 0.05
Allowed N-terminal forms: NONE,NME,NME_ACETYLATION,M_ACETYLATION
Maximum mass shift of modifications: 275 Da
Minimum mass shift of modifications: -150 Da
Thread number: 14
E-value computation: Generating function
Common modification file name: Dynamic_mods.txt
MIScore threshold: 0.15
Executable file directory:
Version: 1.4.13
TopPIC outputs proteoform spectrum matches (PrSMs) as tab-separated files (...toppic_prsm.tsv) and quantification data within MS1 feature files (..._ms1.feature). These are both imported into the R environment for post-processing with TopPICR.
TopPICR is used for post-processing to improve proteoform identification and quantification. All functions are documented within the TopPICR R package.
Software
| Value | Label |
|---|---|
| TopPICR | NAME |
| https://github.com/evanamartin/TopPICR | REPOSITORY |
| Evan Martin | DEVELOPER |
First, result files are read into R using the read_toppic(file_path = path, file_name = names) function in TopPICR, where the "path" is the path to the directory containing the TopPIC PrSM files and "names" is a character vector specifying the PrSM files to import. This function can also be utililzed to import the MS1 feature files into a separate object.
Next, the data is further processed with the augment_annotation() and rm_false_gene() functions to account for ambiguity in proteoform identifications
False discovery rate (FDR) filtering is accomplished by finding the appropriate E-value cutoff to filter the results to 1% FDR at the isoform and protein level. This is provided by the find_evalue_cutoff() and apply_evalue_cutoff() functions.
Proteoform inference is performed with infer_pf() function and the proteoform level is determined with set_pf_level() function .
Retention time alignment is processed with the form_model() and align_rt() functions.
Mass calibration is accomplished with the calc_error() and recalibrate_mass() functions
Clustering and deisotoping error correction is performed with the cluster() and create_pcg() functions.
Metadata for each proteoform cluster is generated with the create_mdata() function.
Steps 4.5 and 4.6 are applied to the MS1 feature files as well before features are matched and combined (for MBR) with the match_features() and combine_features() functions.
The final table of proteoform identification and quantitation results from TopPIC Suite and TopPICR are exported as comma-separated value (.csv) files.
TDPortal Processing
Request TDPortal access and follow their instructions to set up an account.
Software
| Value | Label |
|---|---|
| TDPortal | NAME |
| Northwestern University | DEVELOPER |
| http://nrtdp.northwestern.edu/tdportal-request/ | LINK |
TDPortal search process
6.1 Upload data
6.2 Search on TDPortal
Upload data
- Connect to Northwestern through VPN. (https://kb.northwestern.edu/page.php?id=94726)
- Copy the files to your user folder. (Eg. \resfiles.northwestern.edu\NU-PCEDATA\external_users\XXXXX)
- The system will ask you to log in. Please use "ads\your id" with your password to log into your folder.
- Create a sub-folder under your user folder with each search.
- Put raw files to the sub-folder accordingly and do not have more folders under the sub-folder. (https://kb.northwestern.edu/page.php?id=70525).
Search on TDPortal (https://portal.nrtdp.northwestern.edu/static/TDPortalSOP_043_20180301.pdf)
- Connect website(https://portal.nrtdp.northwestern.edu/)
- Log in TDPortal with “your email address” and “your password”
- Your subfolder's name will show as each dataset.
- Select files into the “Input files” under the selected dataset.
- Select organism "human".
- Set parameters as follow: User empirical P-score: False
Filter by FDR: True
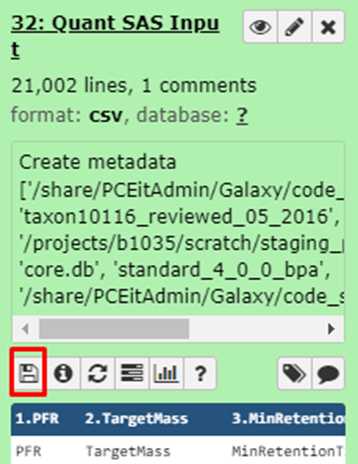
Create SAS input sheet for quant: Select True when we need to.
Precursor resolution: High resolution
Fragmentation Type: Auto (or the type we used on MS).
Code set: Standard 4.0.0
Include ProSight Error Tolerance Search: False (select “true” when we want to allow one unknown mass shift in the proteoform).
Exporting TDPortal results
Software
| Value | Label |
|---|---|
| TDViewer | NAME |
| Northwestern University | DEVELOPER |
| http://topdownviewer.northwestern.edu/ | LINK |
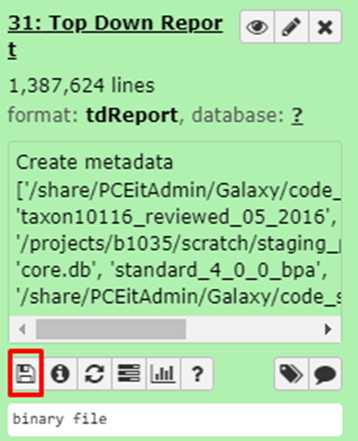
- Download *.tdReports file. Note: There can be two separate processes created in the queue. One for ID results in the TDReport. Another is the CSV file for quantitation (if enabled).
- Click the download icon to download these files.
-
Open TDReport by TDViewer 2.0(http://tdviewer2.northwestern.edu/)
-
Read and export proteoform ID results from TDViewer with 1% FDR cutoff.
Combining Results
Results (proteoform spectral matches) from TopPIC and TDPortal are then merged using a function written in R that is openly available on GitHub. The input proteoform tables from each software was pre-filtered with FDR cutoff of 1% (adjusted FDR in TopPICR for TopPIC, and the default FDR in TDPortal).
Software
| Value | Label |
|---|---|
| TDPortal_TopPIC_Join | NAME |
| https://github.com/Cajun-data/TDPortal_TopPIC_Join_Function | REPOSITORY |
| James M Fulcher | DEVELOPER |
| https://github.com/Cajun-data/TDPortal_TopPIC_Join_Function | LINK |
Final output
Results for proteoform spectral matches (merged from TopPIC and TDPortal) and proteoform quantitation (TopPICR) are uploaded to HIVE.
