Network Building with the Cytoscape BioGateway App Explained in Five Use Cases
Rafael Riudavets Puig, Rafael Riudavets Puig, Stian Holmås, Stian Holmås, Vladimir Mironov, Vladimir Mironov, Martin Kuiper, Martin Kuiper
Cytoscape App
exploratory network building
RDF triple store
SPARQL queries
transcription factor regulation resource
Abstract
The BioGateway App is a plugin for the Cytoscape network editor, allowing users to interactively build biological networks by querying the Biogateway Resource Description Framework (RDF) triple store. BioGateway contains information from several curated resources including UniProtKB, IntAct, Gene Ontology Annotations, various datasets containing transcription-factor regulatory relations to specific target genes, and more. The BioGateway App facilitates the step-by-step creation of complex SPARQL queries through an intuitive Graphical User Interface, allowing users to build and explore biological interaction networks to assess, among other things, gene regulatory relationships, gene ontology annotations, and protein-protein interactions. As the BioGateway information content is most abundant for human proteins and genes, this article describes the utility of the tool through a series of use cases on these human data, starting from the most basic levels and then detailing applications that address some of the rich complexity of the integrated data. Network refinement and display can be further optimized via the selection and filtering possibilities that the Cytoscape framework provides. The use cases also provide examples to explore network information in other species, as they become supported by BioGateway. © 2020 The Authors.
Basic Protocol 1 : Introducing a node from the canvas
Basic Protocol 2 : Introducing a node from the query builder
Basic Protocol 3 : Exploring molecular relationships between diseases
Basic Protocol 4 : Find proteins with protein kinase activity involved in a disease and explore the context around them
Basic Protocol 5 : Exploring the potential downstream effects after targeted inhibition of proteins
Support Protocol : Installation of the BioGateway plugin through the Cytoscape App Manager and from source
INTRODUCTION
The BioGateway Cytoscape app (Holmås, Puig, Acencio, Mironov, & Kuiper, 2019) is a plugin for the Cytoscape platform (Shannon et al., 2003) and can be used for exploratory network building from both curated and text-mined information. This information is stored in the BioGateway knowledge base, an RDF triple store that contains the curated information from several ELIXIR Core resources and other key biological information databases [IntAct (Orchard et al., 2014), UniProtKB (UniProt Consortium, 2019), OMIM (Hamosh, Scott, Amberger, Bocchini, & McKusick, 2005), GO (Ashburner et al., 2000; The Gene Ontology Consortium, 2019), and NCBI Taxonomy (Federhen, 2012)], which allows the construction of interaction networks for specific species involving genes, proteins, biological processes, molecular functions, cellular components, and diseases. In addition, to enhance the ability to also include gene regulatory information (for now: only Human data) in these networks, an RDF graph covering the most prominent resources for transcription factor−target gene interactions (TF-TG) has been added [TFactS (Essaghir et al., 2010), TRRUST (Han et al., 2018), SIGNOR (Licata et al., 2020), CytReg (Carrasco Pro et al., 2018), GEREDB (Huang, Huang, Shi, & Yao, 2019), and HTRIdb (Bovolenta, Acencio, & Lemke, 2012)]. In addition to these curated resources, we have added a vast resource of potential TF-TGs from text mining (manuscript in preparation, http://www.extri.org). By providing full provenance for all the relationship data, all suggested network links can be checked either at the curated source, or in the abstract, when text mining has detected a putative TF-TG interaction. Finally, a user can also incorporate metadata [for instance the confidence measure PSISCORE (Aranda et al., 2011) associated with a protein interaction originating from the IntAct resource] in a graph, which allows for dedicated selection and filtering of network elements that meet desired criteria.
The Graphical User Interface of the BioGateway Cytoscape app allows users to interact with our RDF triple store without the need to learn SPARQL (Prud'hommeaux & Seaborne, 2008), thereby removing a very significant hurdle in the use of semantic knowledge bases. Furthermore, it allows the representation of the results not in the form of a table (as normally generated through a SPARQL query), but as an editable network through the Cytoscape software, which has been developed for building and analyzing biological networks.
The BioGateway Cytoscape App offers two main ways of interacting with our RDF triple store. These are: (1) point-and-click interactions from the Cytoscape canvas, either starting from an empty network or from nodes and edges in a Cytoscape graph; and (2) query design through the Query Builder. It is important to note that when using names instead of UniprotKB accession numbers, these names should be defined in a “gene centric” manner, meaning that searches for entities need to be specified using ONLY the gene symbol.
STRATEGIC PLANNING
For proper execution of the use cases presented here, it is assumed that the reader is familiar with basic analysis workflows for Cytoscape. The following Cytoscape tutorials shown on the Cytoscape tutorials web pages (https://github.com/cytoscape/cytoscape-tutorials/wiki#introduction) are recommended:
- Introduction to Cytoscape
- Network Visualization
- Advanced Visualization
NOTE : The basic protocols below assume that users have installed the necessary software by following one of the two alternatives in the Support Protocol, that they are familiar with the basic use of Cytoscape for network building and network visualization, and that they are aware of Cytoscape's core network filtering options. Furthermore, all the protocols below assume that the user starts from an empty network.
Basic Protocol 1: INTRODUCING A NODE FROM THE CANVAS
This Basic Protocol 1 is intended as a first contact with the BioGateway Cytoscape app, focusing on the use of the Human data. As data for several additional species is now being added to the BioGateway triple store, the protocols also can be used for other taxa, with the exception of steps that involve relationships of transcription factors and their target genes. Basic Protocol 1 explains how to import one node into an empty Cytoscape canvas, explore the available information for that node, and use it to create a small protein-protein interaction network together with Gene Ontology annotations. The protocol illustrates the exploration of RASK (UNIPROT ID: P01116), a protein with an important role in regulation of cell proliferation. The protocol will start by importing a node representing the protein RASK and the gene coding for it, followed by the identification of all proteins interacting with RASK and the GO Biological Processes that RASK is involved in.
Before starting, it is important to note that (1) BioGateway does differentiate between proteins and genes, and treats them as separate entities that require specific queries; and, (2) for reasons of accuracy, the naming of nodes representing proteins (boxes) and genes (ovals) always uses the GENE name. Because every gene encodes many different protein isoforms, we have chosen to treat the main entity protein as a “bag” representing all isoforms that may exist for that protein, and name that “bag” with the name of its gene.
Thus, the aim of this protocol is to show users how to import nodes of interest (protein, gene, Gene Ontology term, etc.) into the Cytoscape canvas and find the relations going to/from that node and its neighbors.
Necessary Resources
Hardware
- This protocol requires users to have an up-to-date Macintosh, Unix/Linux, or Windows computer capable of running Cytoscape version 3.0 or later (https://cytoscape.org/manual/Cytoscape2_8Manual.html#System%20requirements). Finally, it is necessary to have a stable broadband connection to the Internet in order to smoothly execute the protocols.
Software
- Cytoscape and the BioGateway Cytoscape plugin are required to follow this protocol. The Support Protocol describes how to download and install the required software. During the writing of this protocol, version 3.8.0 of Cytoscape and version 3.2.2 of the BioGateway plugin were used. However, the users can follow this protocol by installing the latest versions of both Cytoscape and the BioGateway plugin.
1.Launch Cytoscape, and create an empty network (File > New Network > Empty). Name your network “Network 1.”
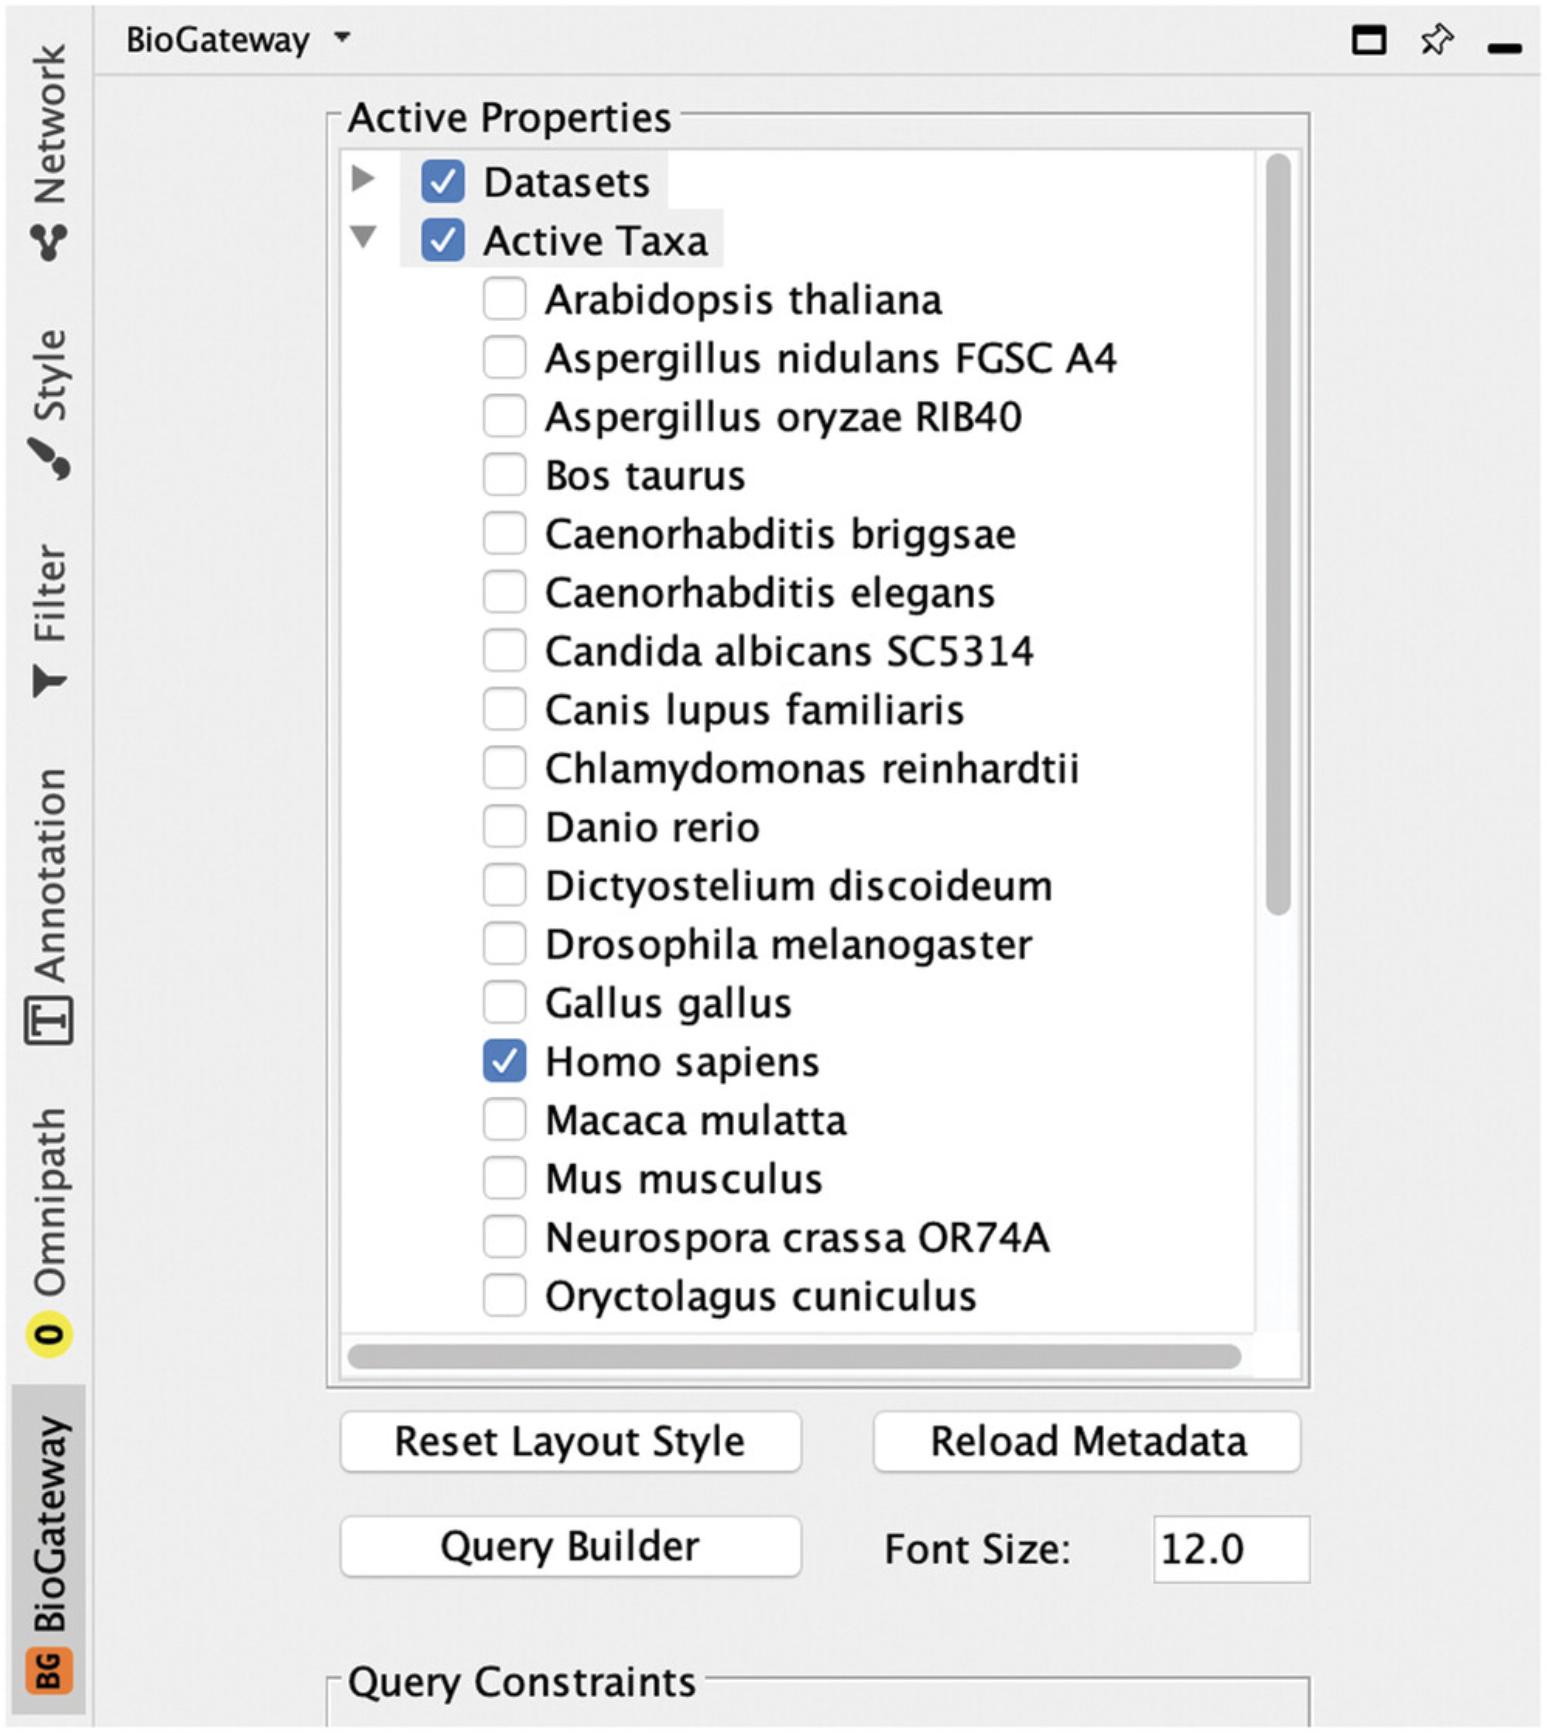
2.Open the BioGateway configuration panel by clicking on the BioGateway tab in the Cytoscape control panel, expand the Active Taxa selection, and make sure that only the taxon Homo sapiens is activated (Fig. 1).
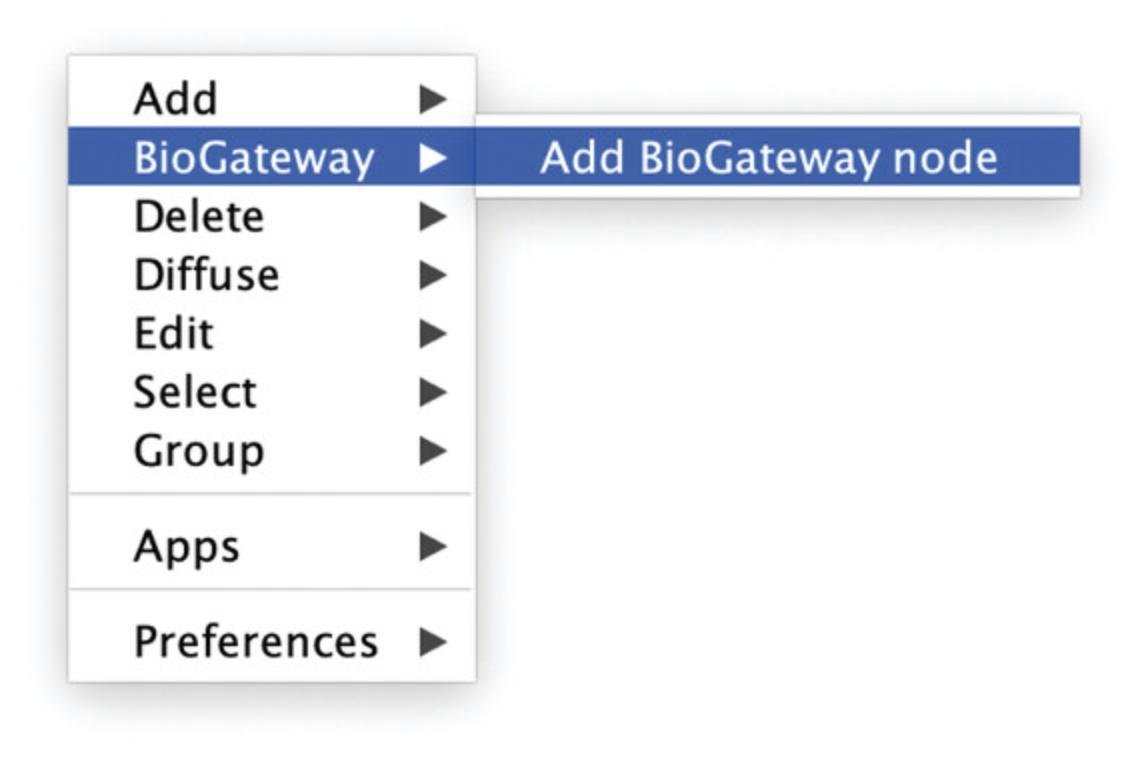
3.Right click anywhere in the empty Cytoscape canvas and select in the pop-up window the option BioGateway. Next, click Add BioGateway node (Fig. 2).
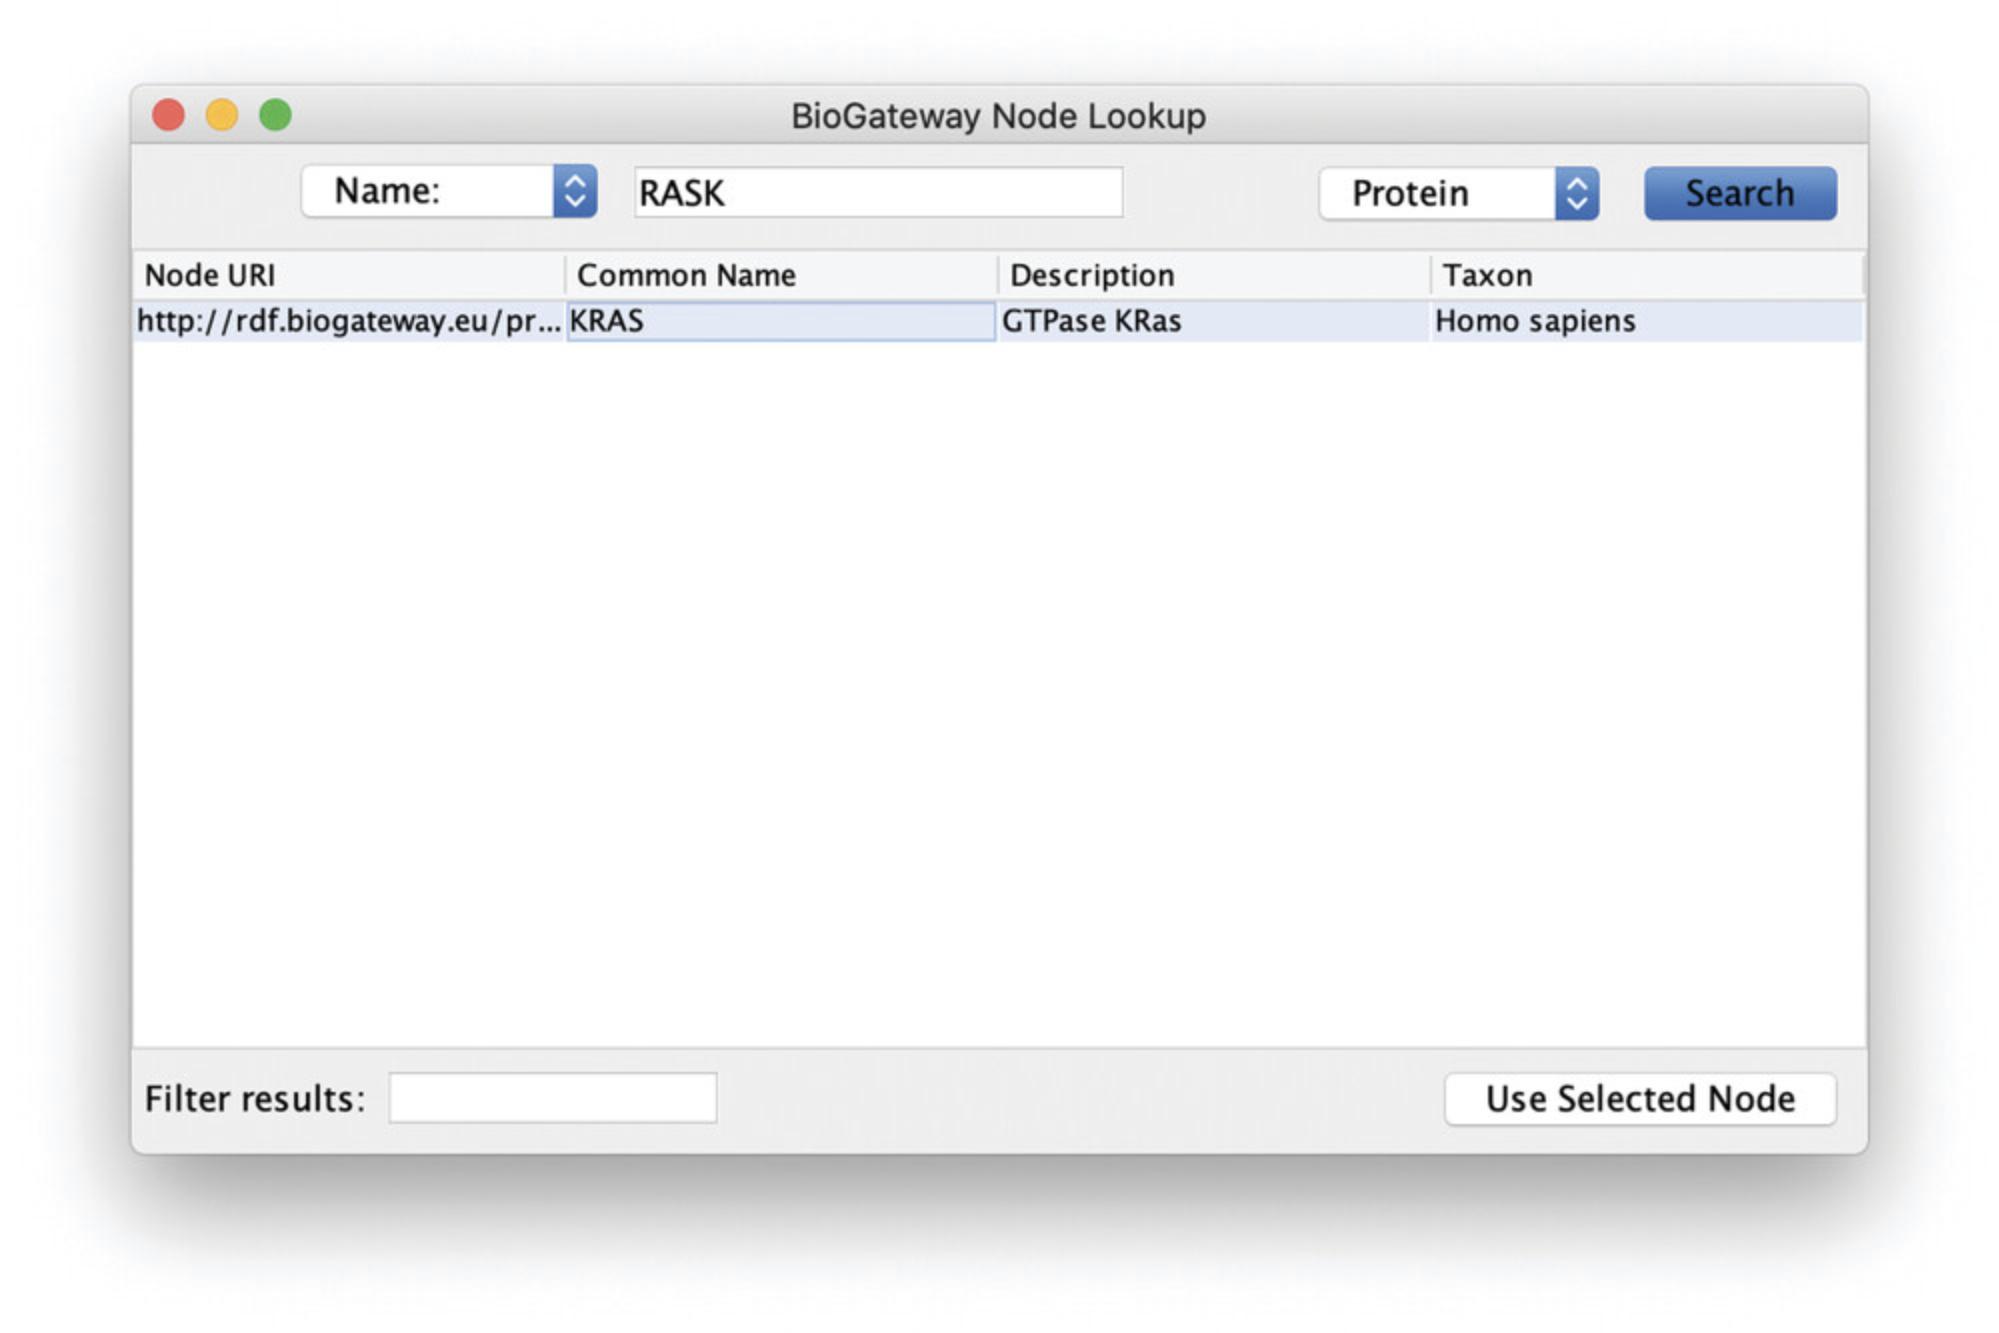
4.This will open the BioGateway Node Lookup dialog box, where the user can search for the name of a protein, gene, GO term, taxon, or disease of interest. The default name to search for is set to “Protein.” Enter “RASK” in the query box and click the Search button.
5.The result will be shown in the Results Panel of the dialog. Select the protein of interest and import by clicking the Use Selected Node button (Fig. 3).
6.The Cytoscape canvas will now contain a square-shaped node representing the RASK protein. As noted above, it is important to remember that BioGateway treats genes and proteins as different entities. To illustrate the information that BioGateway has about this node, right click on the KRAS node, select BioGateway Fetch relations TO node, and observe several options: Search for all relation types, molecularly interacts with, and encodes. For each, the origin of the relationship is indicated. Select the option Search for all relation types (Fig. 4). This will query the BioGateway server for all relationships that include the protein RASK as target node.

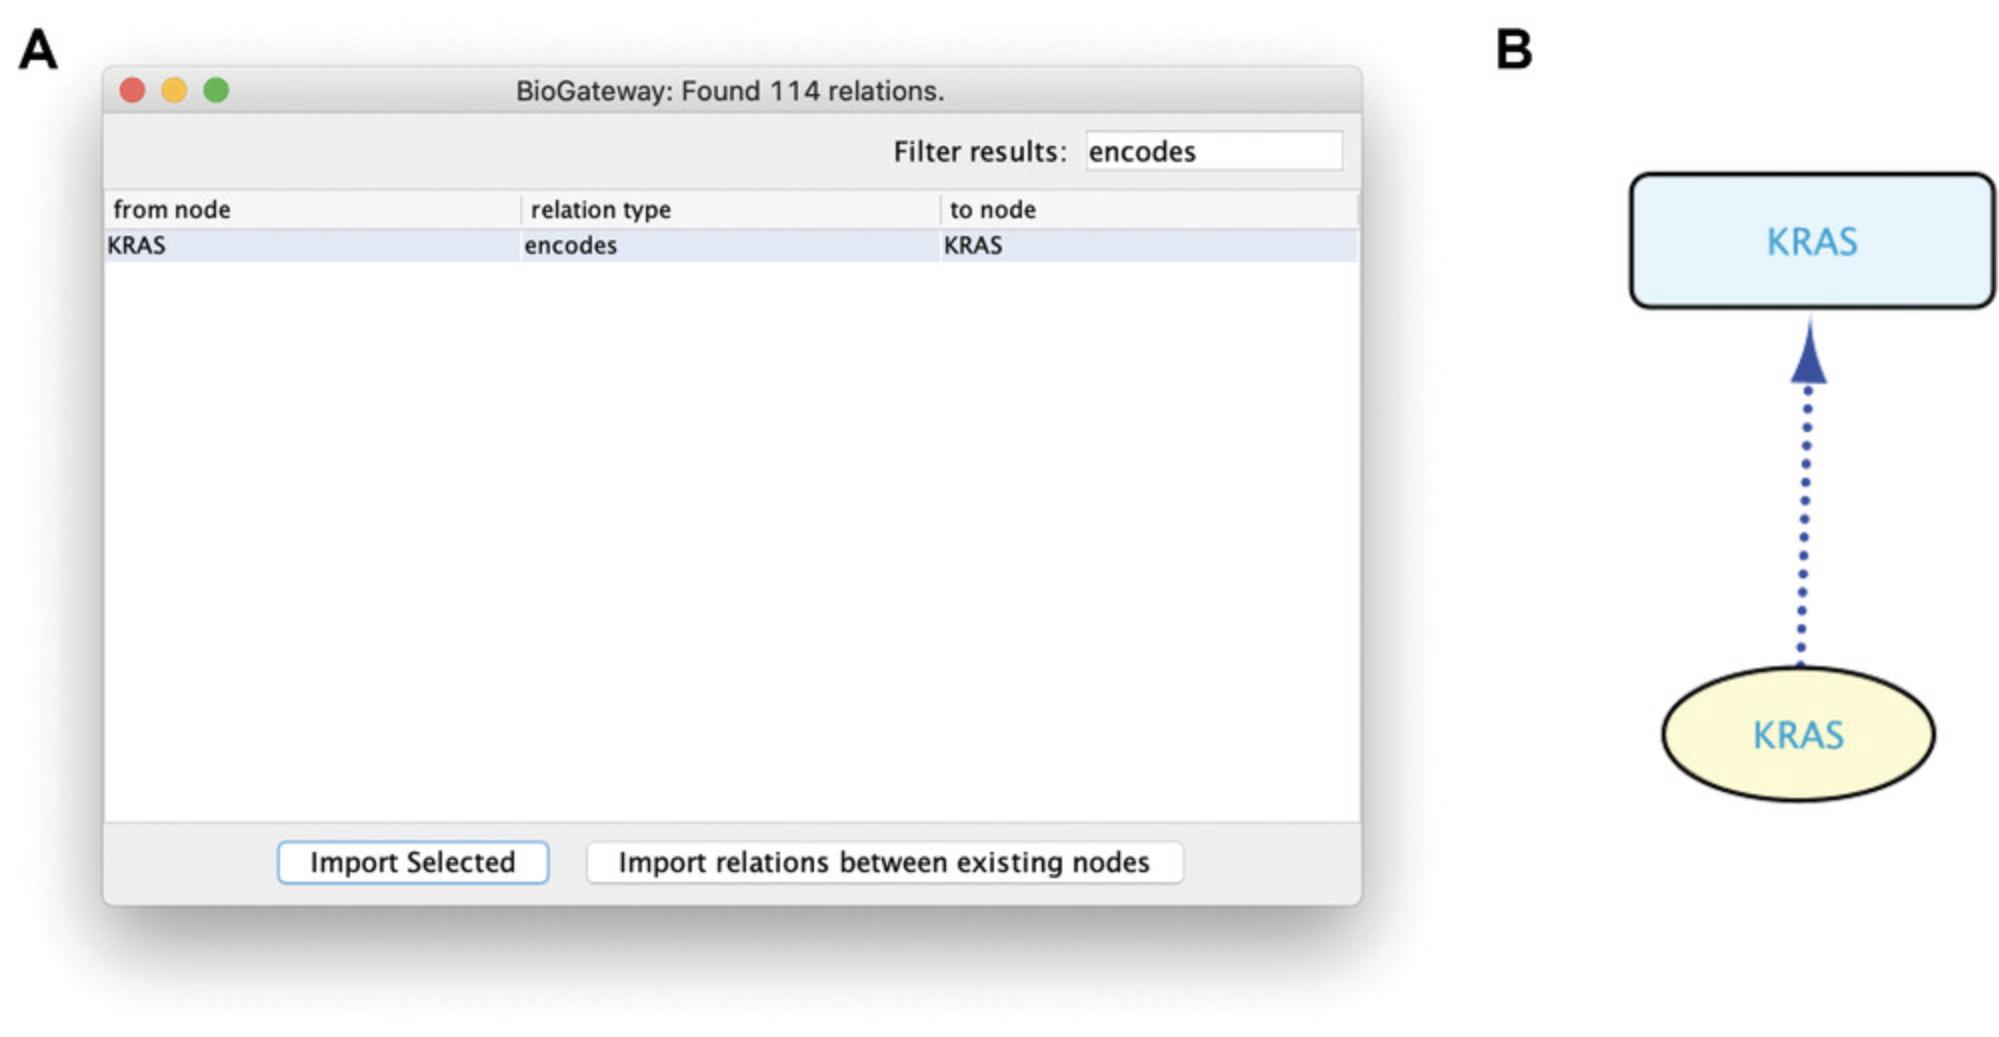
7.A dialog will open showing the results of the query launched in step 6.There are many different relation types returned, and they can be sorted by clicking on the column header relation type. Alternatively, by typing a search string in the Filter results box, the results will be limited to those matching the typed characters. By highlighting one or more types of relationships (in one or more steps), the desired relationships can be imported to a network by clicking the Import Selected button. First select first all relationships of the type “encodes,” and import to the canvas by clicking Import Selected (Fig. 5A). Next, select all relationships of the type “molecularly interacts with” and “involved in,” and import. Notice that all new nodes are superimposed in the canvas (because of a Cytoscape “feature”), and press F5 to prompt Cytoscape to render a deconvoluted network (Fig. 5B).
8.Note that alternatively you can select the “molecularly interacts with” relationships for RASK, involving Protein− Interactions (PPIs) that RASK is involved in, by right clicking on the KRAS protein node and selecting the option BioGateway > Fetch relations FROM node > IntAct: molecularly interacts with. This will query the BioGateway server for all PPIs that include RASK (note that the same results will be obtained when clicking Fetch relations TO node, as PPIs do not have a direction). Likewise, the “involved in” relationships can be found by BioGateway > Fetch relations FROM node > GOA: involved in, which fetches all GOA annotations with biological process terms, for RASK. For these two separate queries, a dialog will open; select all relations and import them by clicking the Import Selected button.
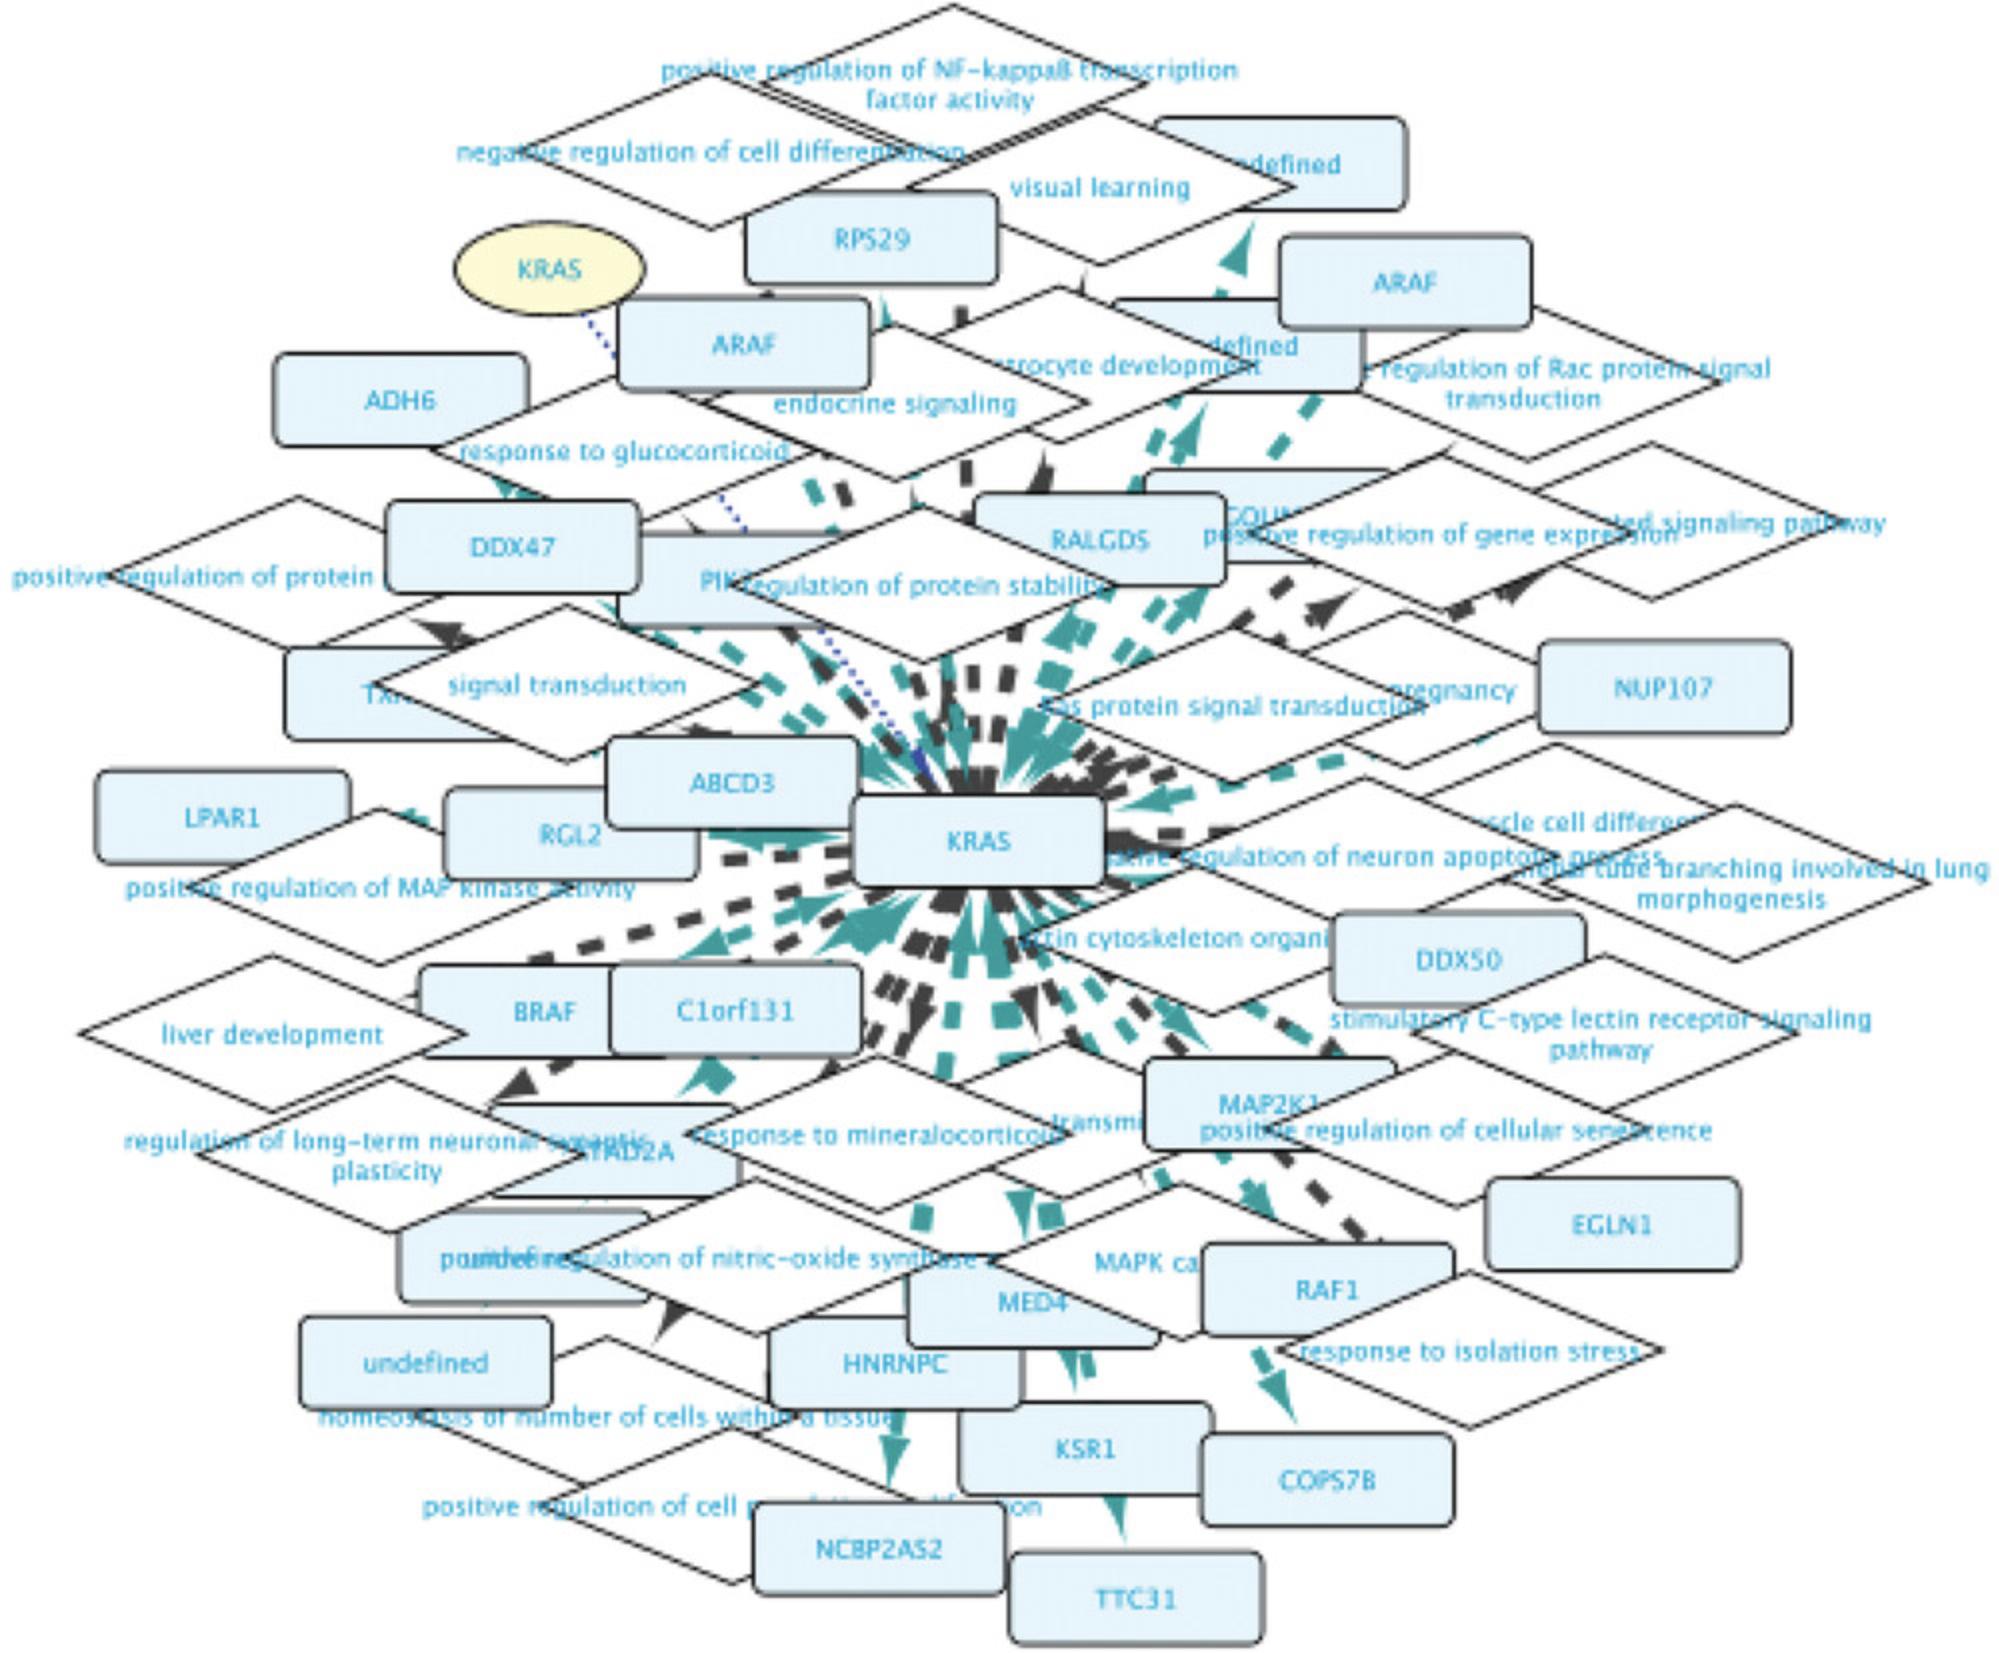
9.Observe that the network around the RASK protein now has diamond-shaped nodes with GO term names for biological process terms and box-shaped nodes representing proteins that the RASK protein is connected to (Fig. 6). The information about these nodes is shown in the Cytoscape node table; the information about the relationships can be seen in the edge table. This network can now be further extended either by right-clicking any of the nodes in this network and launching new searches as above, or by using the query builder (see below).
Basic Protocol 2: INTRODUCING A NODE FROM THE QUERY BUILDER
This protocol builds on Basic Protocol 1 and shows users how to produce the same network as above by using the Query Builder. After replicating these results some additional information will be added to the network, introducing the user to the building of queries that can be specified further in a step-by-step mode using multiple query lines. This approach allows a user either to broaden a network or to further select the network results by specifying additional criteria that the results should comply with. The protocol also shows the power of using identifiable wildcards to find the intersection between several query results.
The Query Builder is one of the most important ways of interacting with the BioGateway repository. It allows the creation of complex queries in an intuitive manner by “stacking” desired criteria. Every single criterion is represented as a line in the Query Builder, where each line is a statement that constitutes a Subject-Relationship-Object structure (similar to RDF). Figure 7A shows the Query Builder, where the three top fields marked in red represent the Subject, the Relationship, and the Object. Both the Subject and the Object box have the same setting options (Fig. 7B). From left to right, these are:
- 1.Entity or Set : To specify if the node to use as Subject/Object will be a specific named entity (e.g., Protein, Gene, Gene Ontology term, etc.,) or a set (wildcard).
- 2.Entity type : To define if the Subject/Object is a protein, gene, GO term, or Disease. The remaining terms will not be used in the use cases covered in this protocol.
- 3.Entity name : To insert the desired protein, gene, etc. As shown in Figure 7B, an autocomplete function is started when the user starts typing in the text of interest.
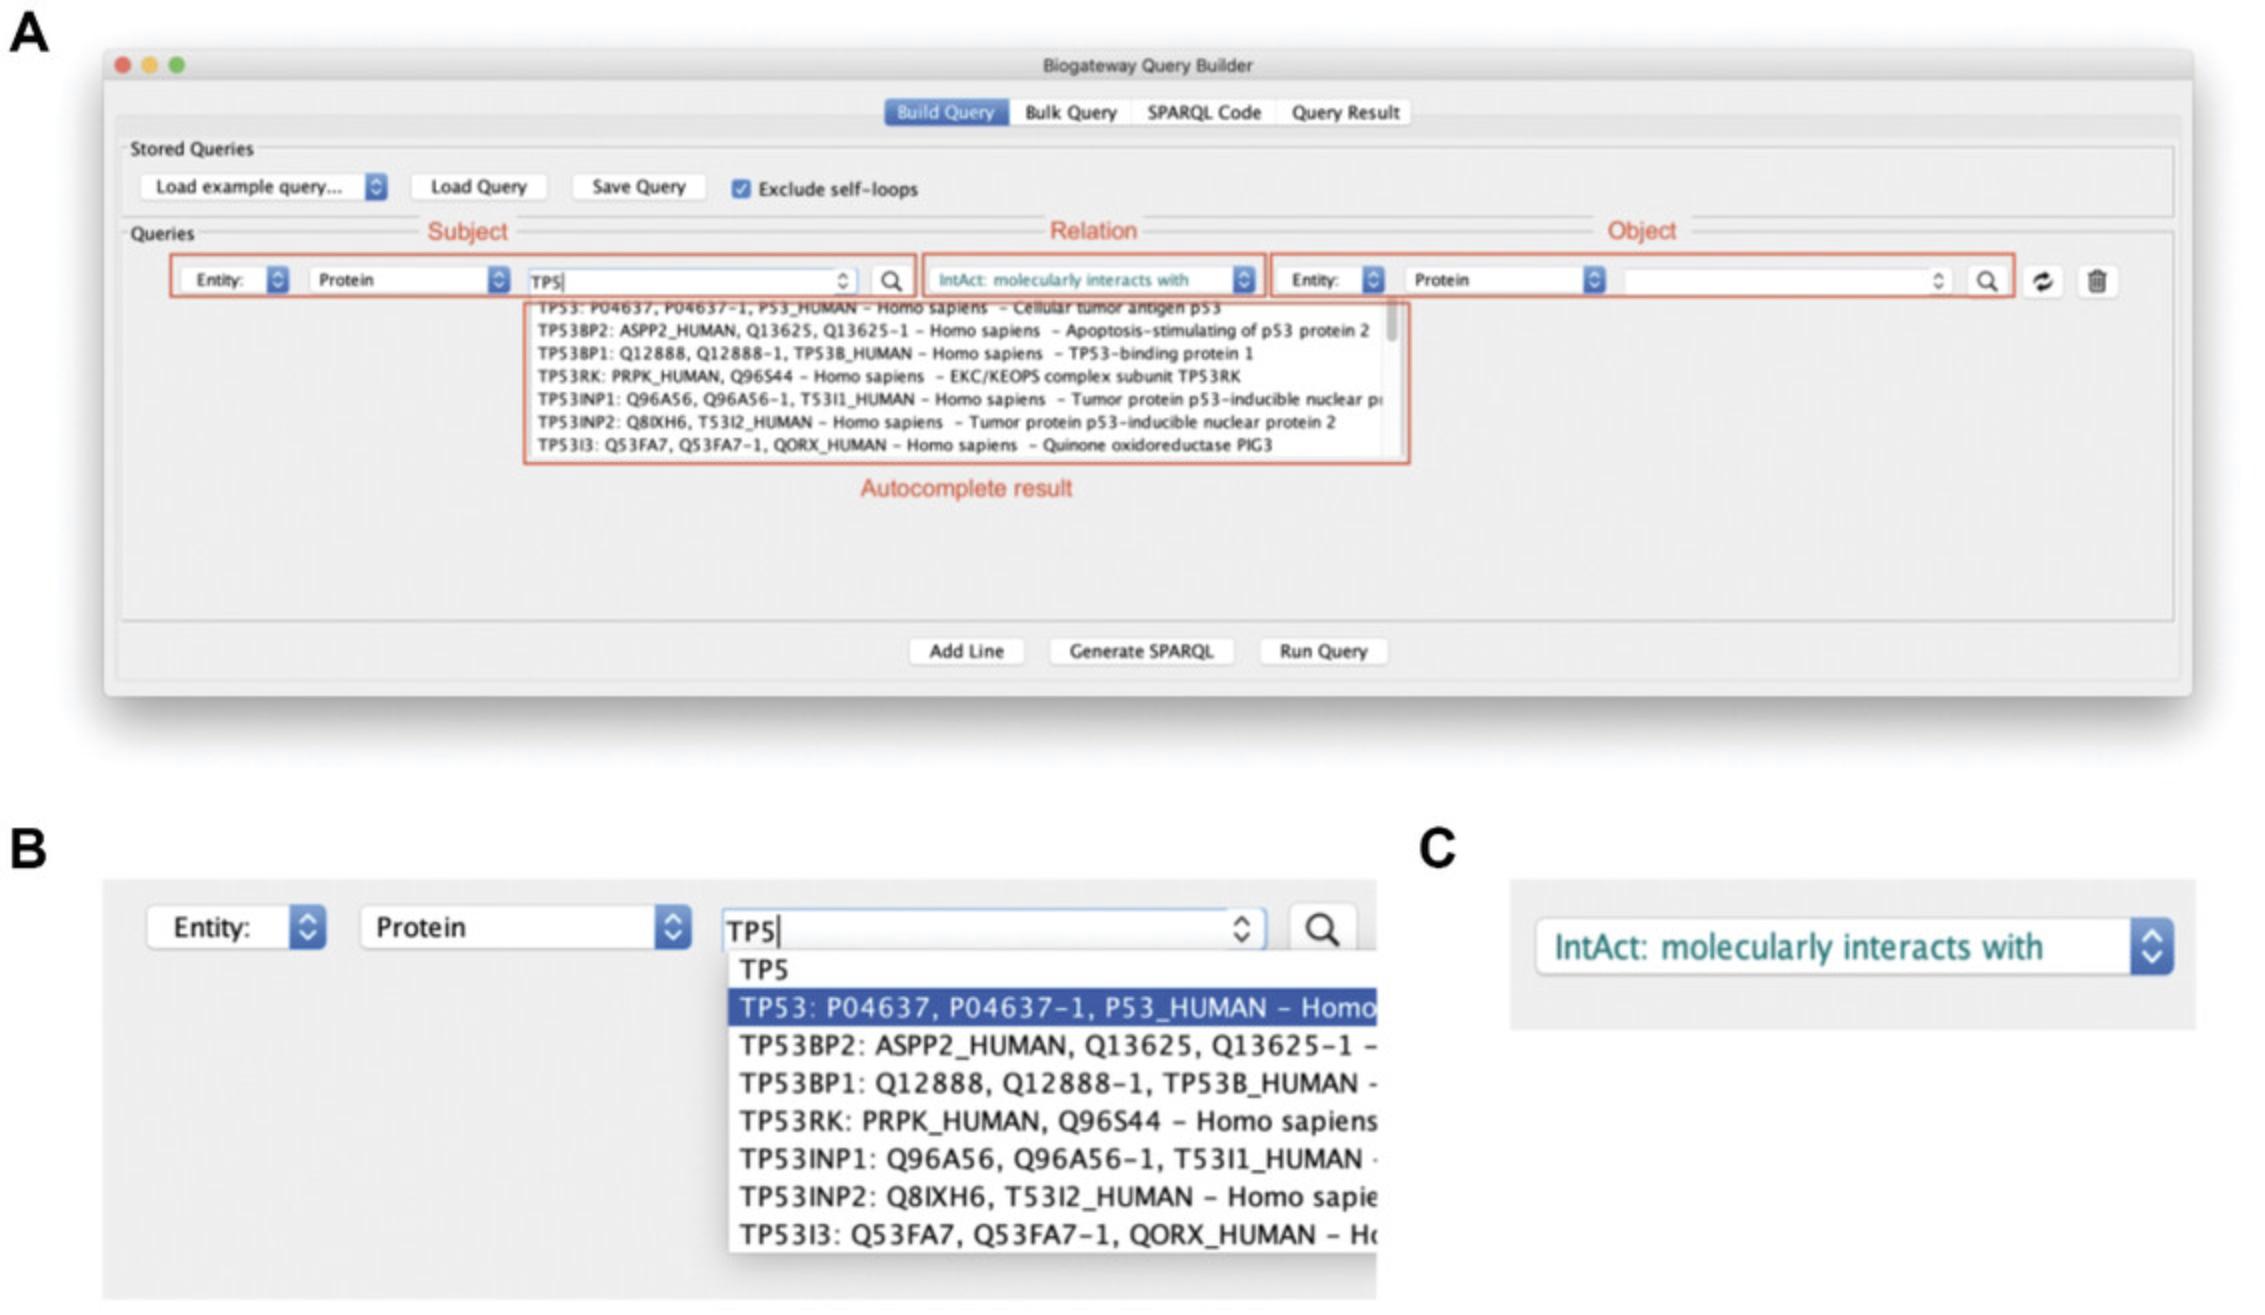
The Relation (Fig. 7C) states the type of relationship to search for between the Subject and the Object. The possible relationships are TF-TG interactions, protein-protein Interactions (PPIs), gene encoding for a protein, Gene Ontology Annotations (GOAs), involvement in a disease, and orthology. The app provides user support to flag queries that do not make sense: for instance, if the query aims to fetch relationships between a transcription factor (by definition a protein) and a gene, the entity types that do not match the query will be shown in red.
Necessary Resources
- See Basic Protocol 1
1.Introduce a new network in Cytoscape (File > New Network > Empty), and name it “Network 2.”
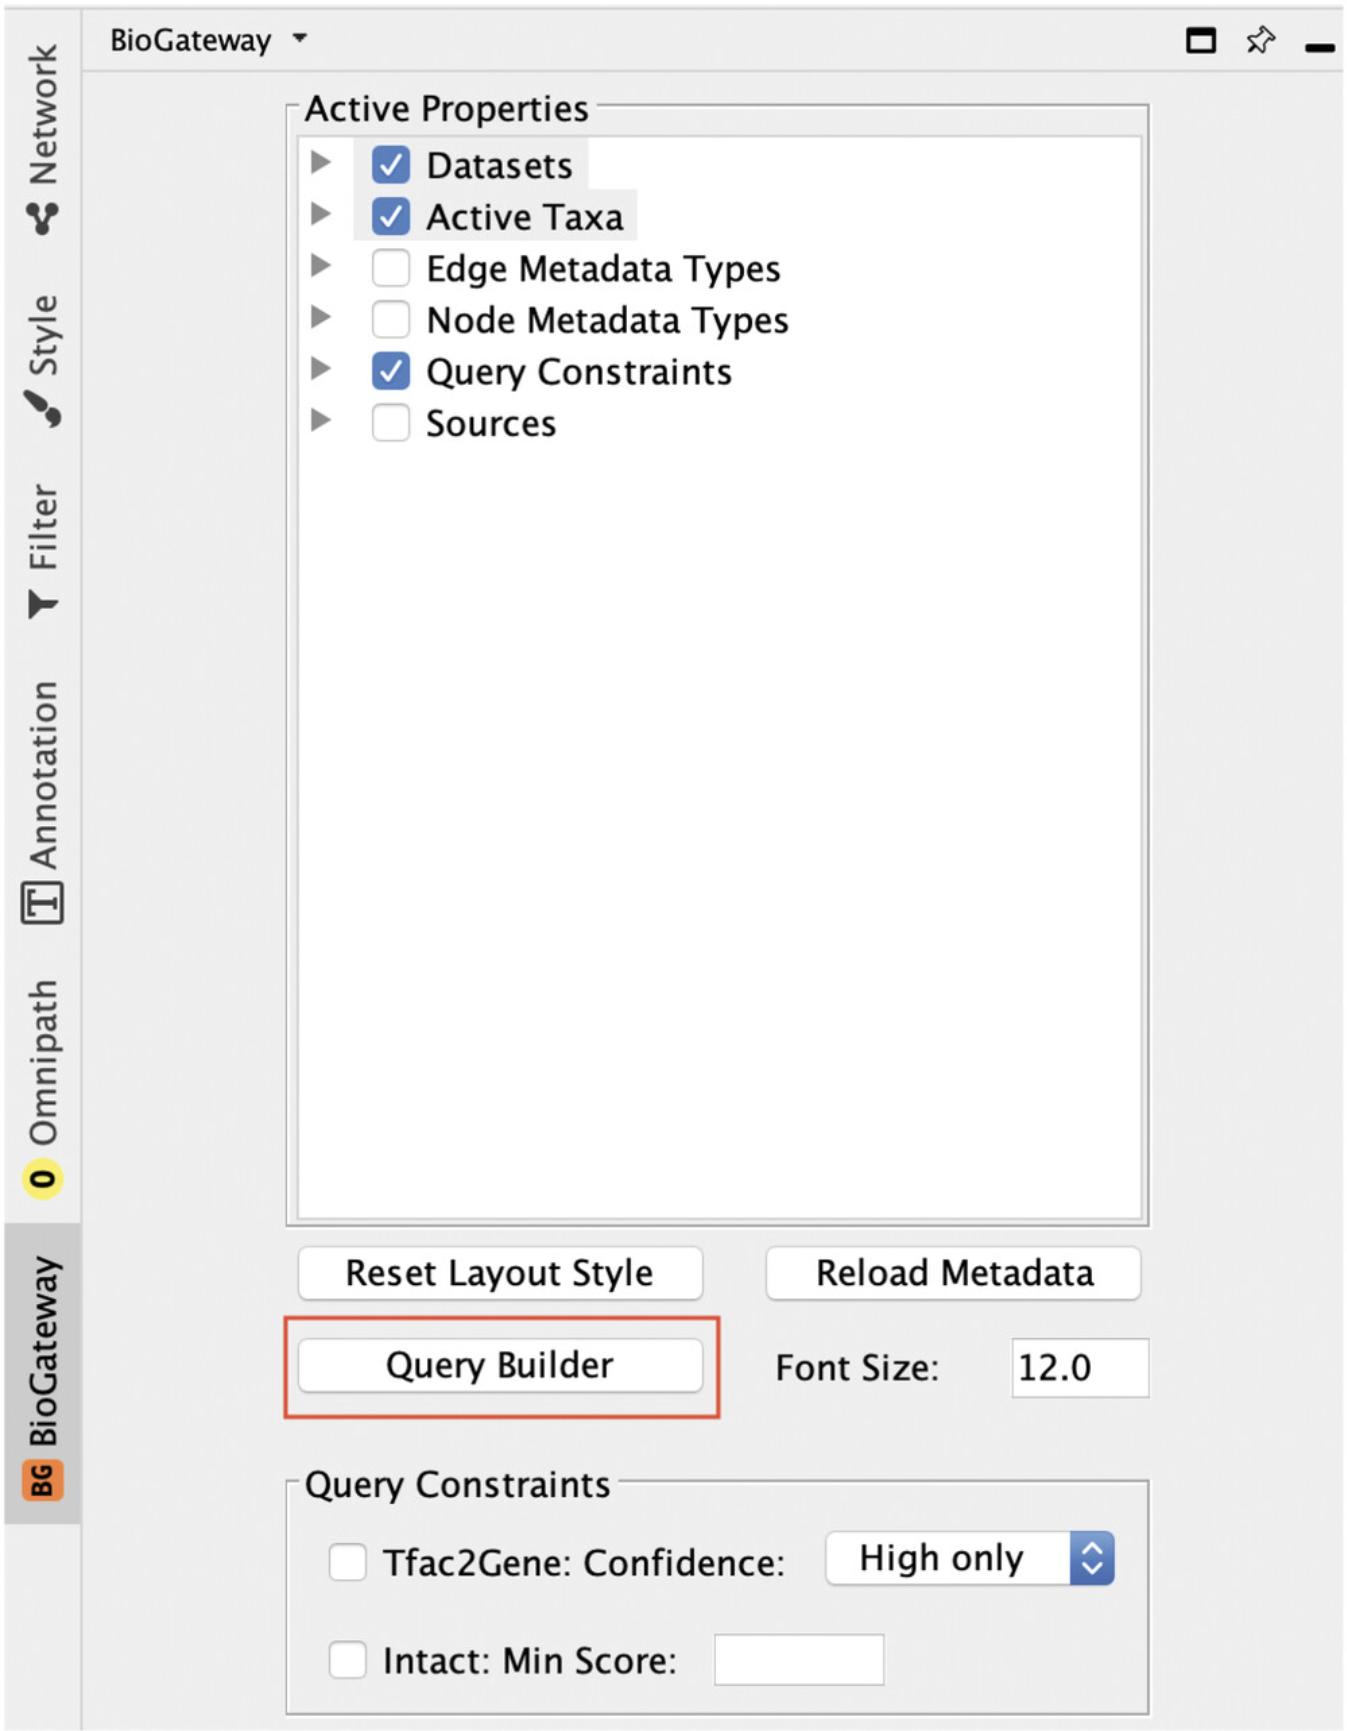
2.Select the Biogateway Control Pane l and open the Query Builder (Fig. 8).
3.This will open the Query Builder box that allows the user to compose queries line by line, by specifying a first entity type [either a specific one or a group (e.g., Set A)]; a relation type (to be chosen from a drop-down list); and a second entity (again either a specific one or a Set). After each query line, the results can be observed by pressing the Run Query button at the bottom of the query box. Based on the volume and details of the results, the user may decide either to apply additional selections in a next query line, by mentioning the same entities of sets, or add additional network information by defining new entities or sets.
4.The first entity is by default “protein,” and typing RASK in the box next to it will launch the autocomplete function. Note that with each character the autocomplete matches become more specific. Select the autocomplete suggestion: KRAS: KRAS2, RASK2, RASK_HUMAN, P01116−Homo Sapiens–GTPase KRas. Note that the autocomplete function returns multiple gene names (KRAS, KRAS2, RASK2) as it supports synonym searches, and that for the protein the UniProt identifier (RASK_HUMAN) and UniProt accession number (P01116) are provided.
5.The default relationship is set to “IntAct: molecularly interacts with,” so this can be left as is.
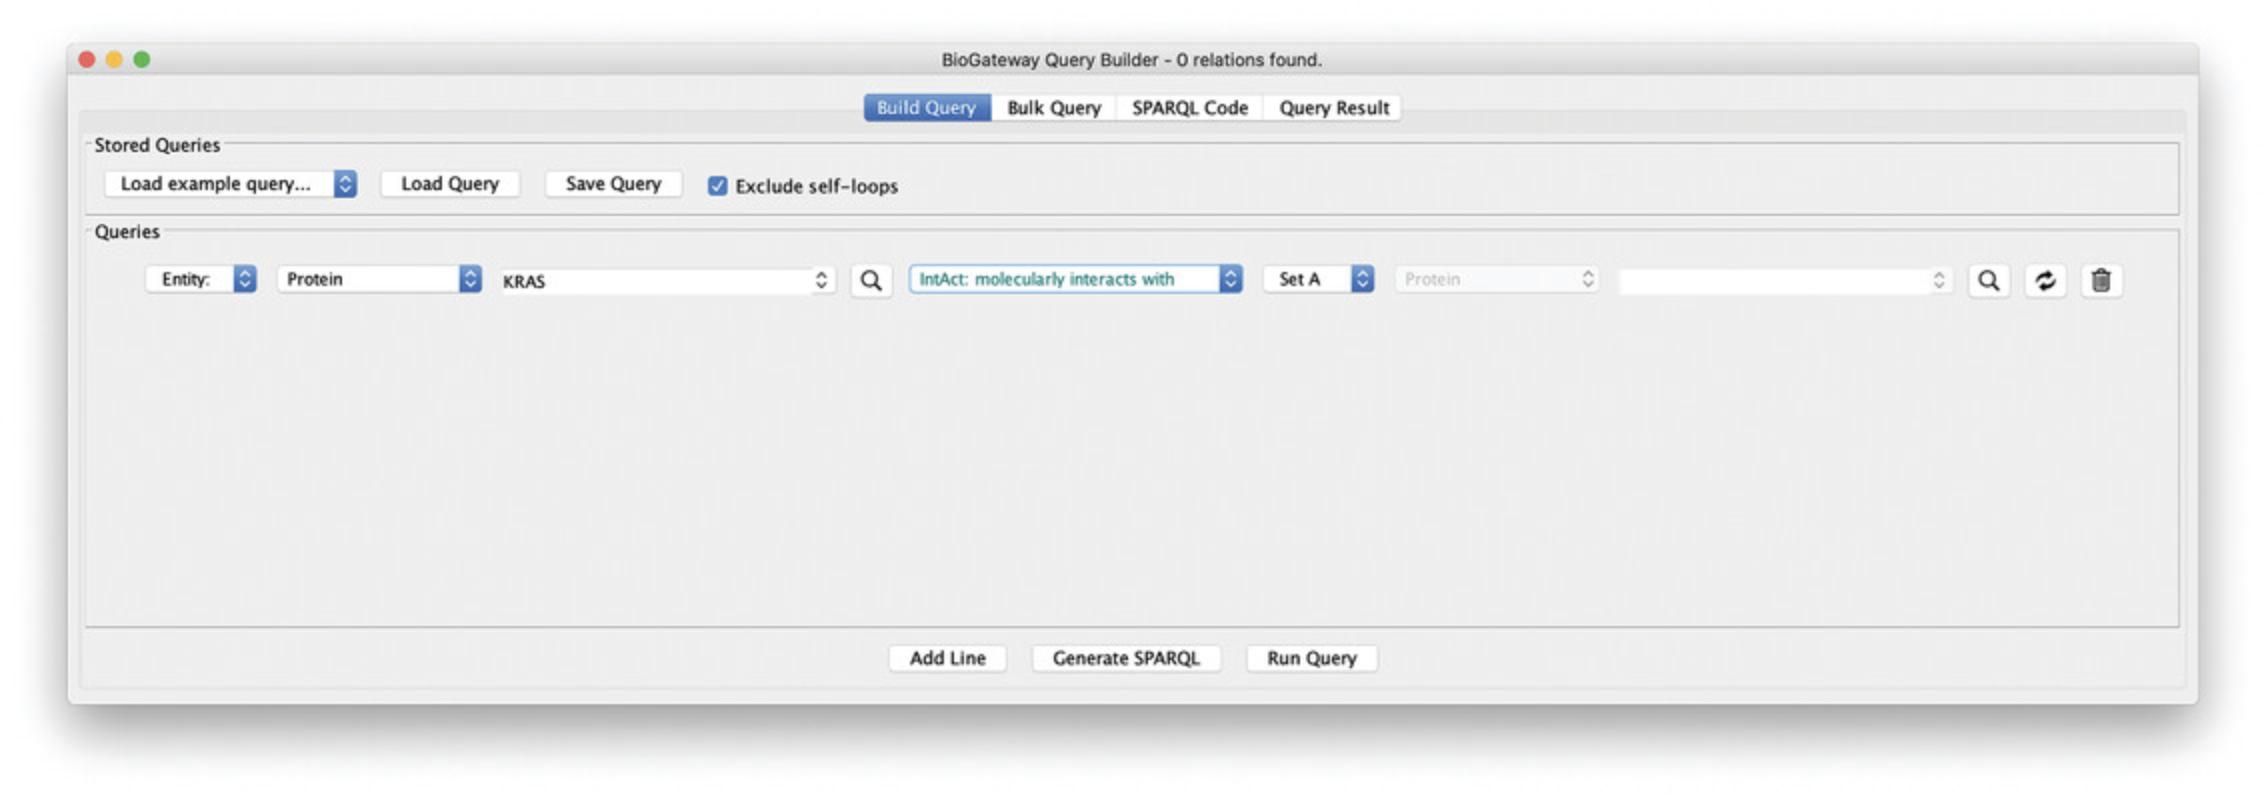
6.Define the entity that RASK should interact with, by selecting “Set A.” This query line will now search for all protein-protein interactions that include the RASK protein. Figure 9 shows the Query Builder after building the query defined so far.
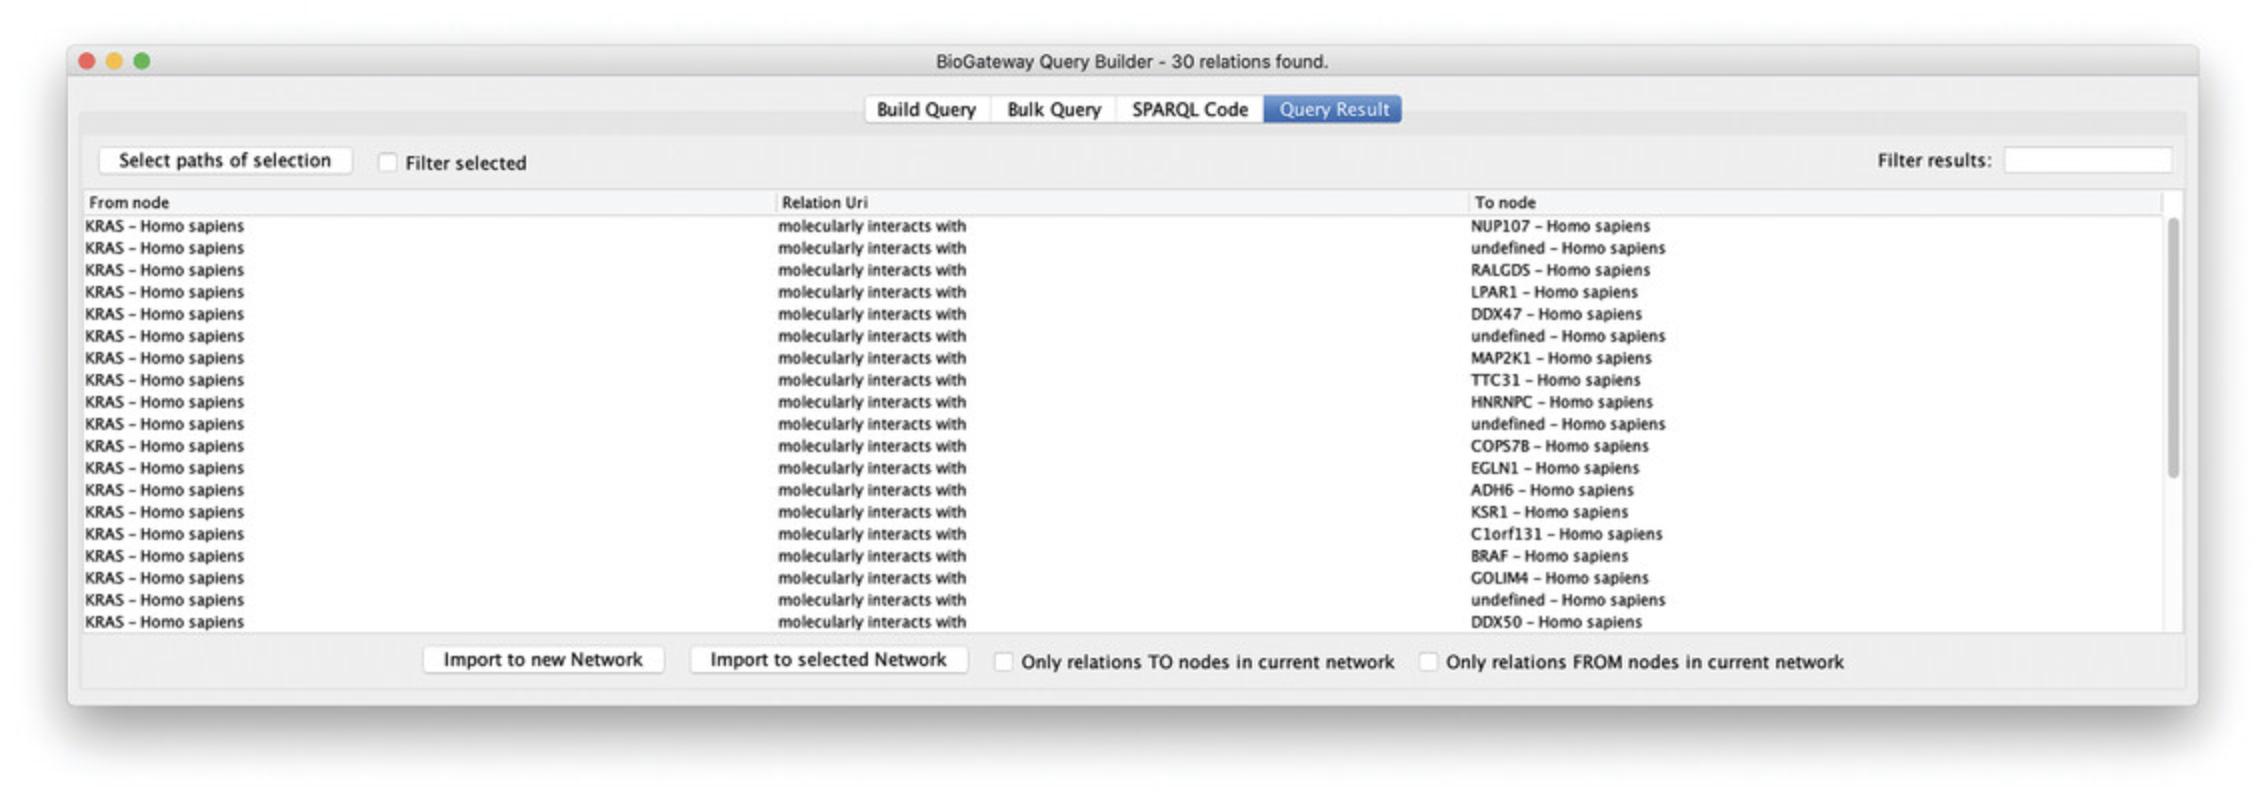
7.Note that when selecting Run Query, the Query Results window will open showing the PPIs that contain RASK (Fig. 10).
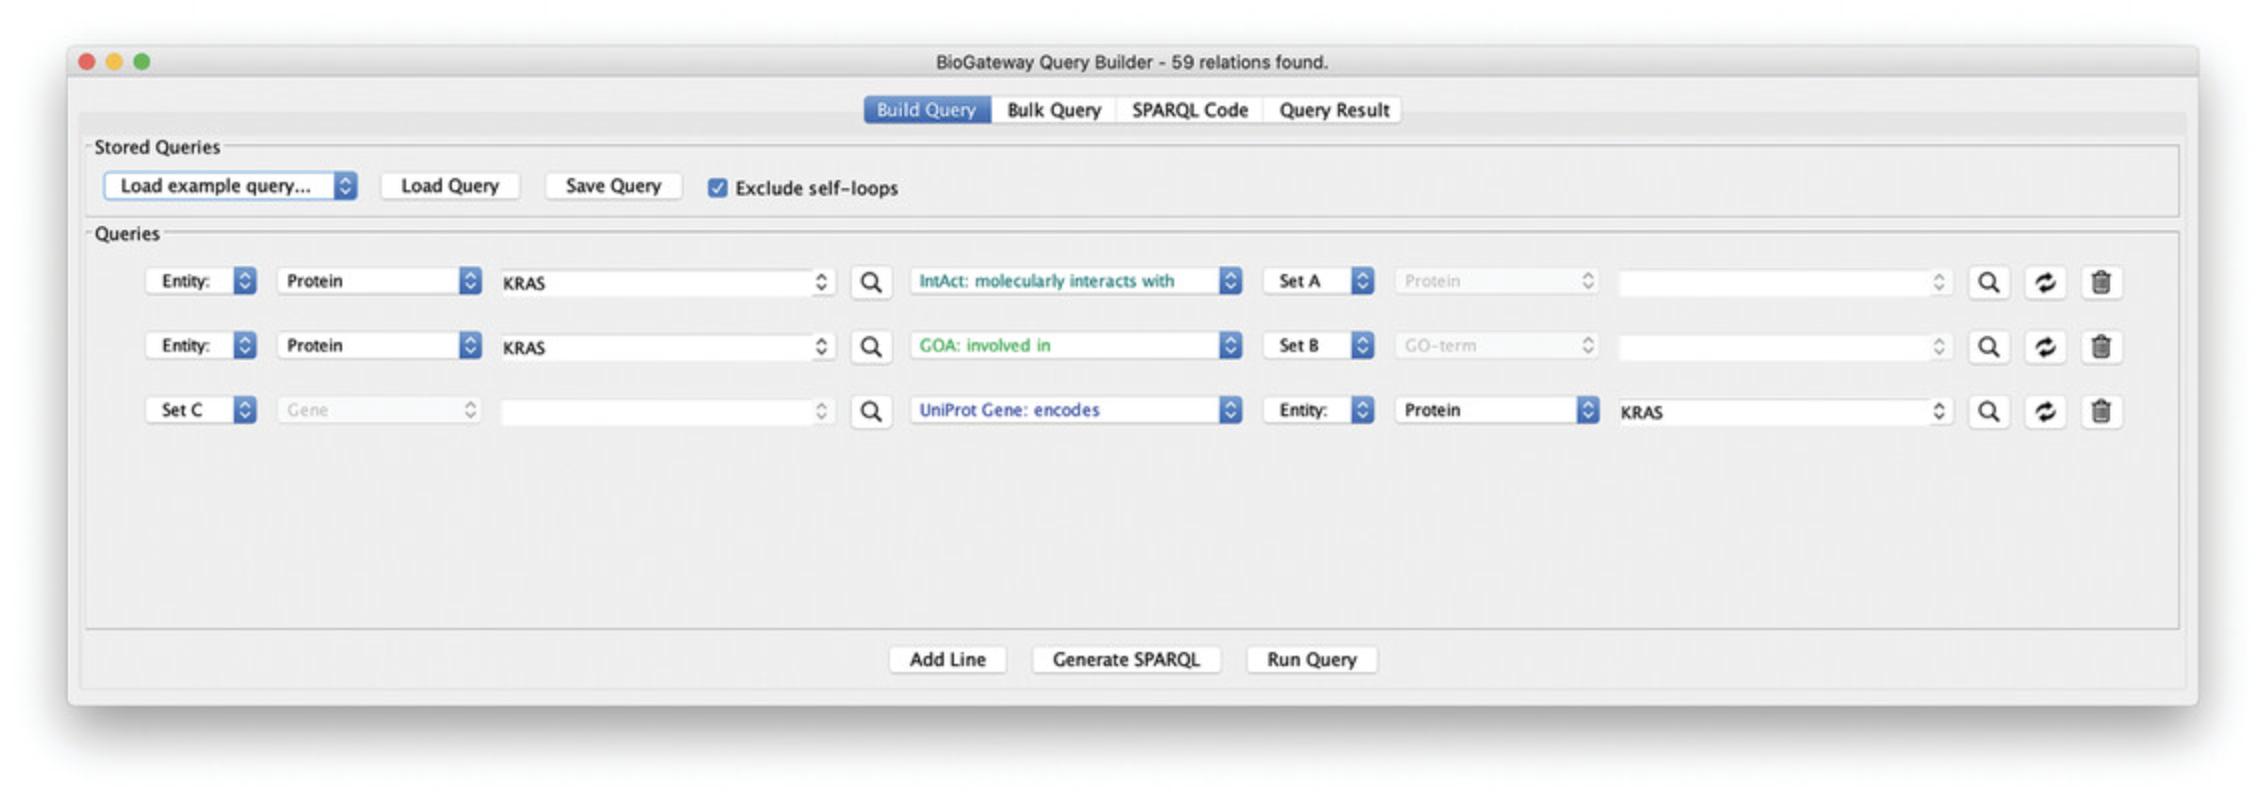
8.Next, go back to the Query Builder interface by clicking the Build Query button, and press Add Line (bottom of pane). Set the relation type to “GOA: involved in,” and again specify the KRAS protein as first entity. Select “Set B” as the second entity, specifying the query to fetch all GOA biological process annotations for KRAS.
9.Add one more query line to fetch the gene encoding the RASK protein: specify “gene” as first entity, and allow for multiple hits (Set C). Select “protein” as second entity, specify “RASK,” and select the RASK protein from the autocomplete result. Note that the gene needs to be specified first, as the “encodes” relationship has the TO direction (Fig. 11). Your query is now identical to the selection steps performed in Basic Protocol 1.Click Run Query, select all the results and Import to selected Network.
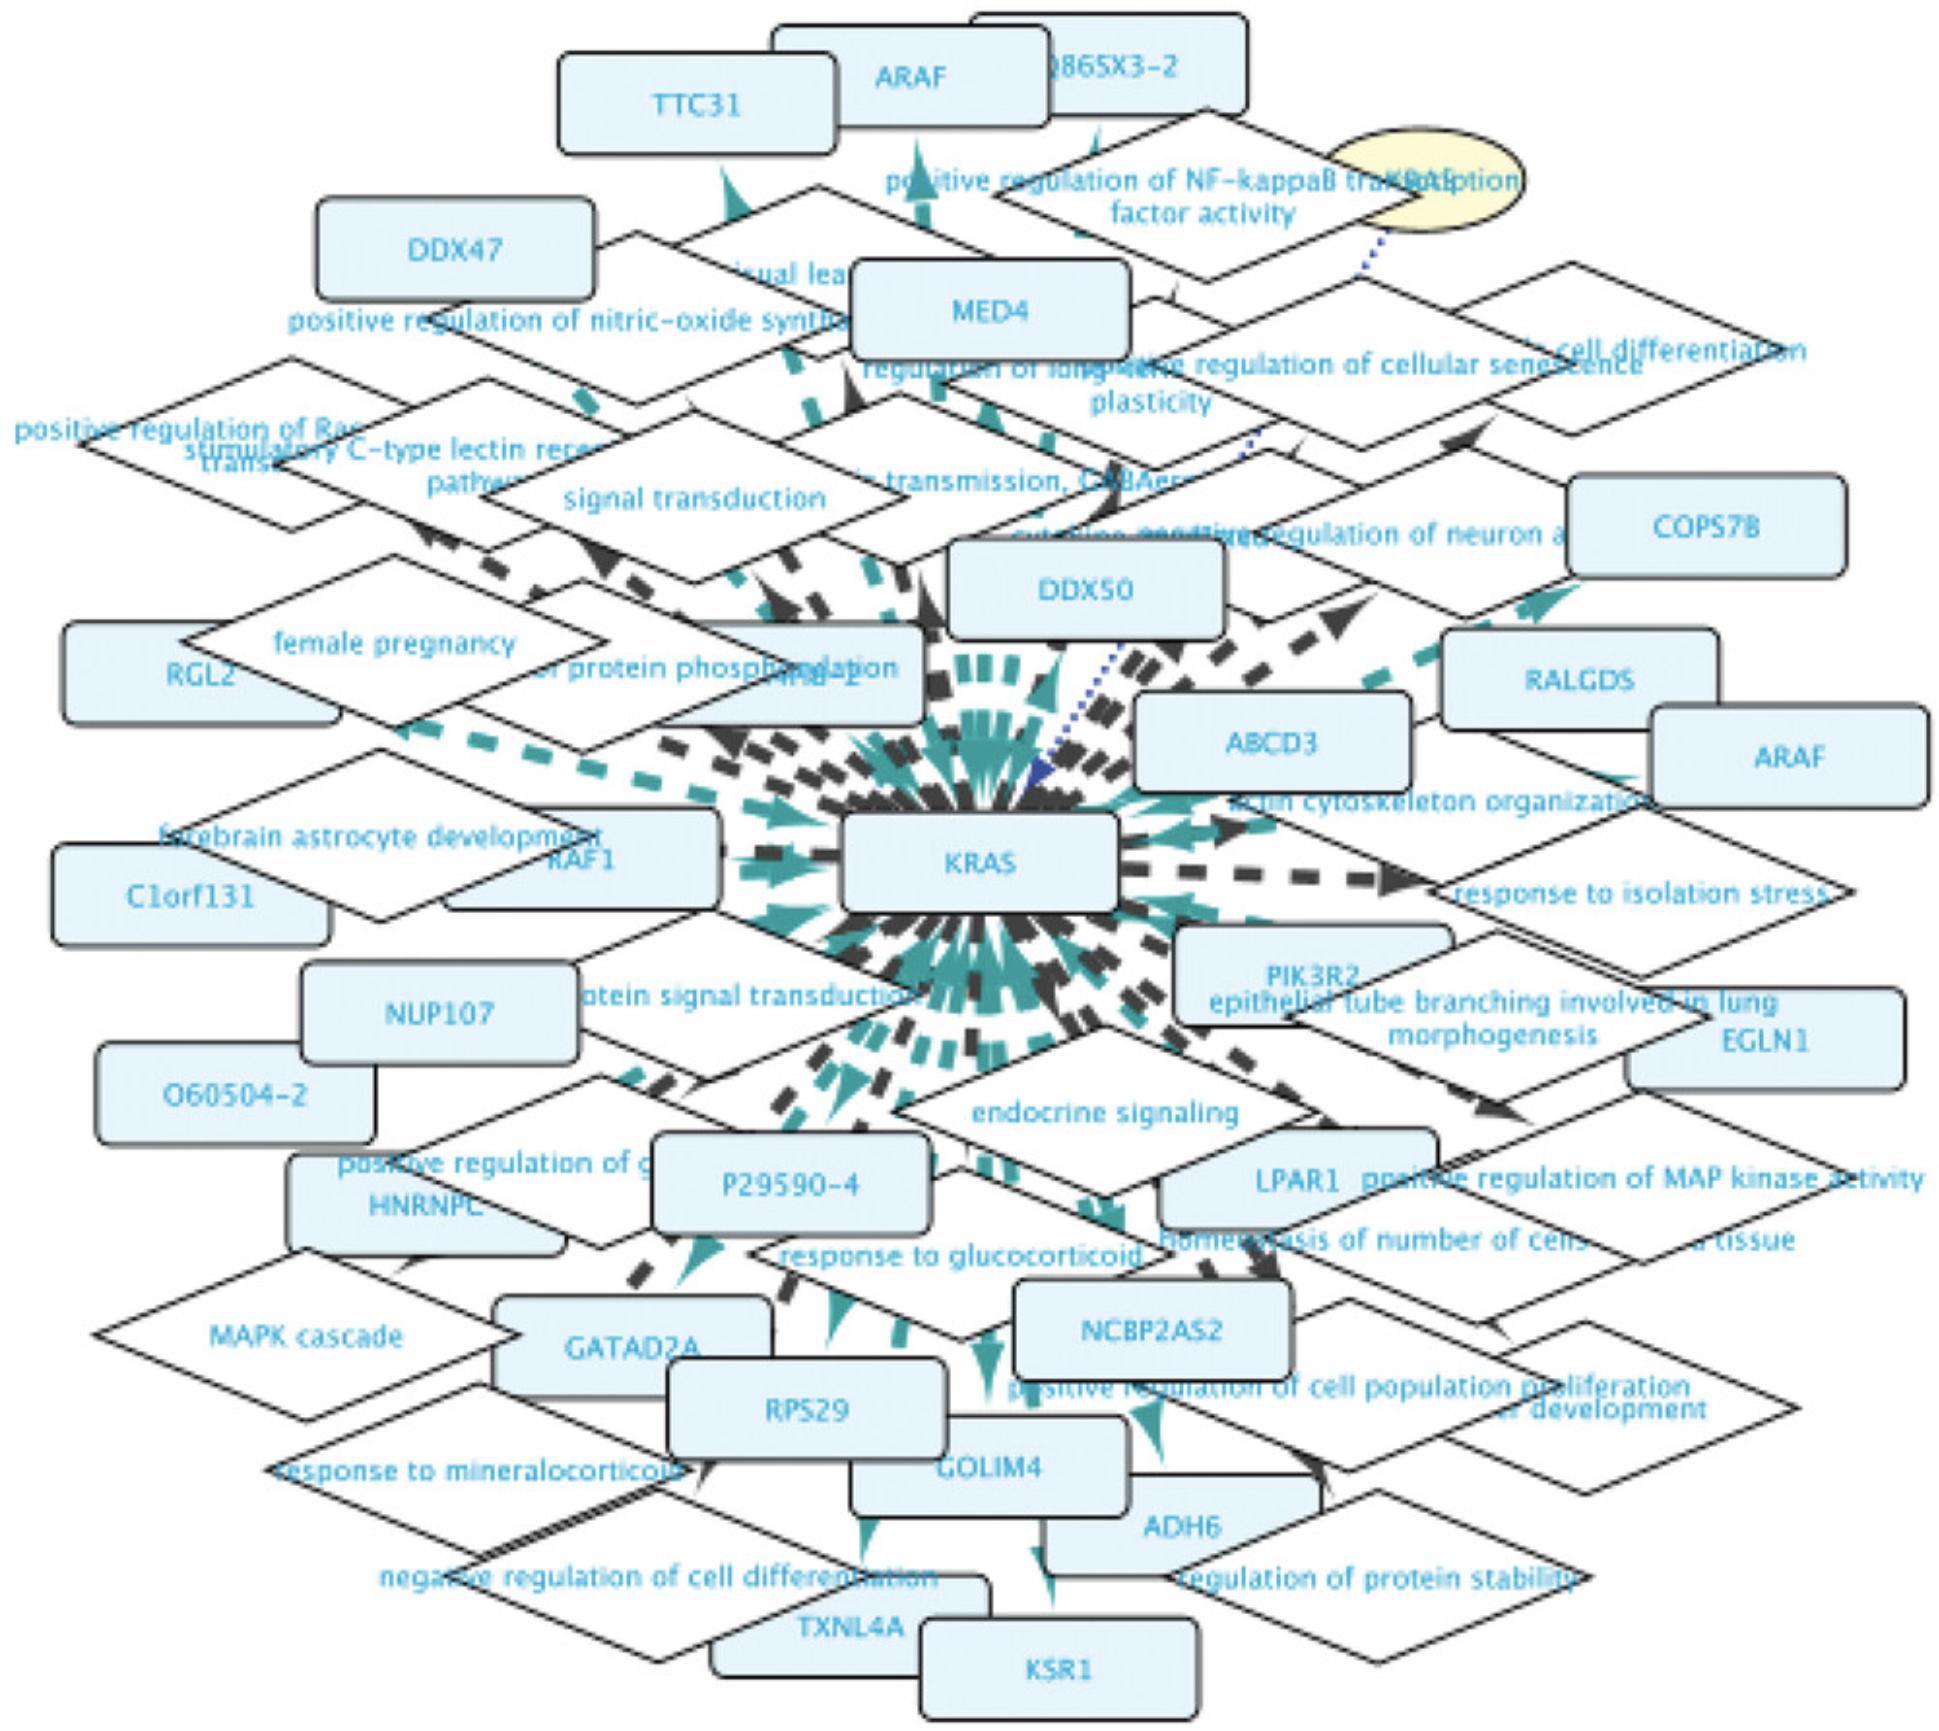
10.Cytoscape now has two networks, comparison will show that Network 1 is identical to Network 2 (Fig. 12).
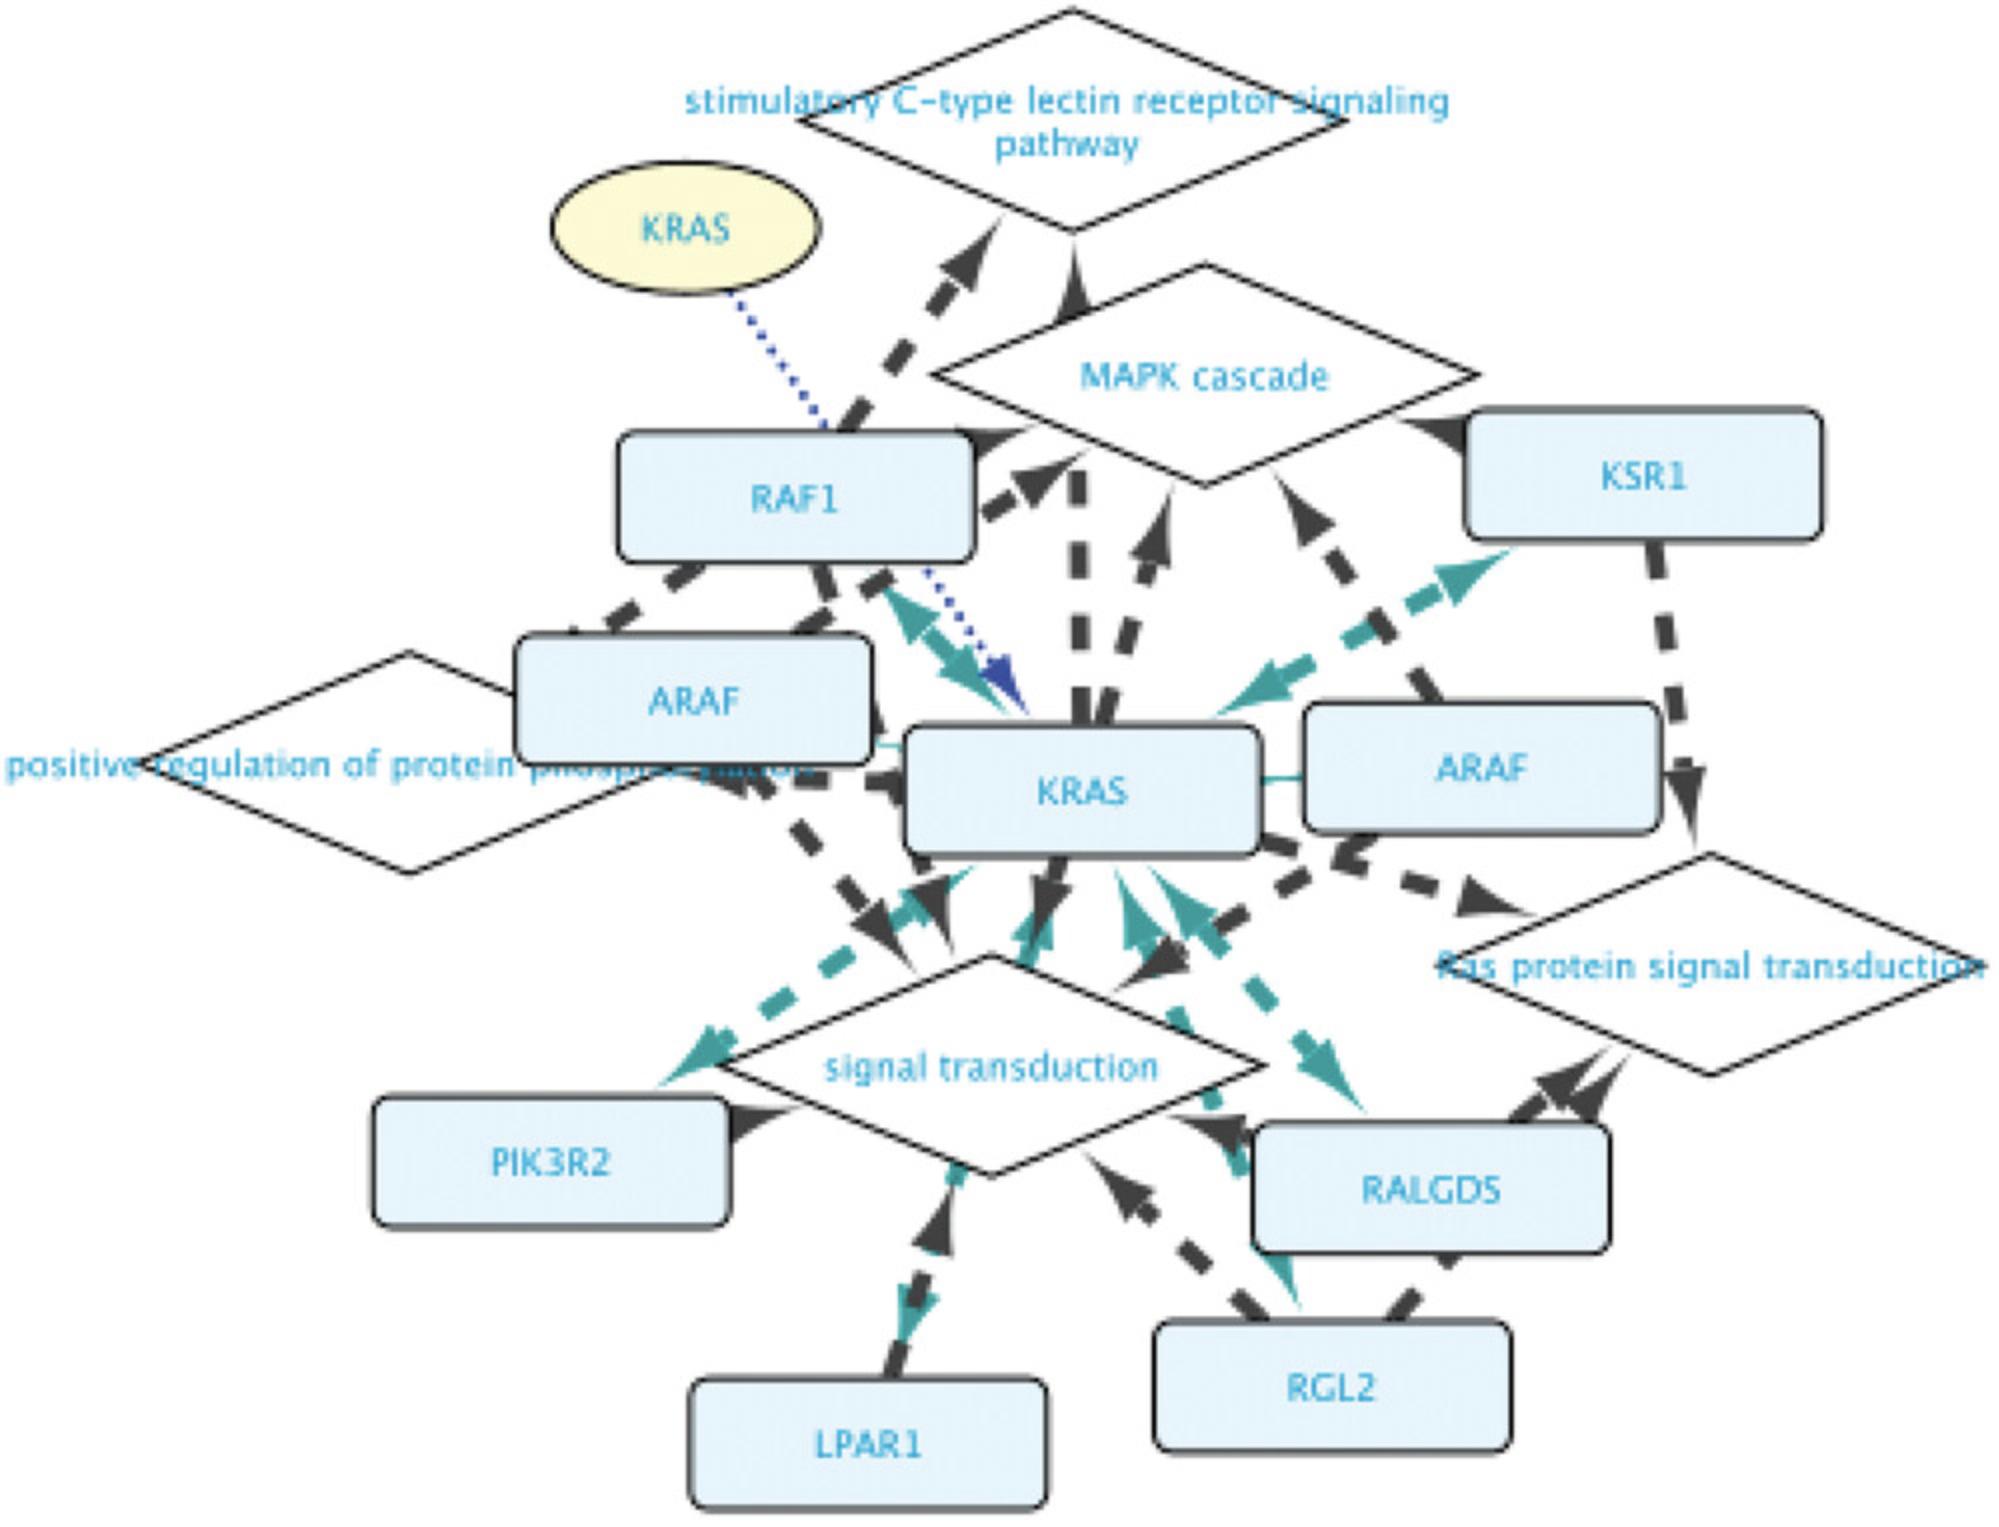
11.We will now refine the network by limiting the results to RASK interacting proteins that have the same biological process annotations as KRAS. Add a new query line, specify “Set A,” set the relationship to “GOA: involved in,” and specify the GO term as “Set B.” Run the query and observe that the number of relationships has now significantly dropped. Select all results and click Import to new Network.
12.The new network (Fig. 13) has only 25% of the nodes and half of the relationships, specifying a protein-protein interaction network around the RASK protein in which all pairs of interactors share the same biological process annotations.
13.In a last step, we will fetch the genes for all the proteins in the network and select transcription factors that regulate them. Because there will be many TFs, we will select only those that regulate both the RASK gene and one of the other genes, and we further select them to share the same annotations as the proteins in the network. The steps to do this are:
-
Fetch the genes coding for the proteins in set A: add a new query line and set the Subject Entity to “Set D” and its entity type to Gene. Next, set the relation type to “encodes,” and set the Object to “Set A” and its Entity type to Protein.
-
Fetch the transcription factors regulating Set D: add a new query line and set the Subject Entity to “Set E” and its Entity type to Protein. Now, set the relation type to “involved in regulation of” and set the Object Entity to “Set D” and its Entity Type to Gene.
-
Fetch the transcription factors regulating the RASK gene (which is not a member of set A!): add a new query line and set the Subject Entity to “Set E” and its Entity type to Protein. Next, select the relation type to “involved in regulation of.” Finally, set the Object Entity to “RASK” and its entity type to Gene.
-
Limit set E to TFs with annotations shared by PPI pairs: add a new query line and select “Set E” in the Subject Entity and Protein as its Entity type. Next, select “involved in” as the relation type, select “Set B” as the Object Entity, and set “GO term” as its Entity type. The resulting Query can be seen in Figure14.
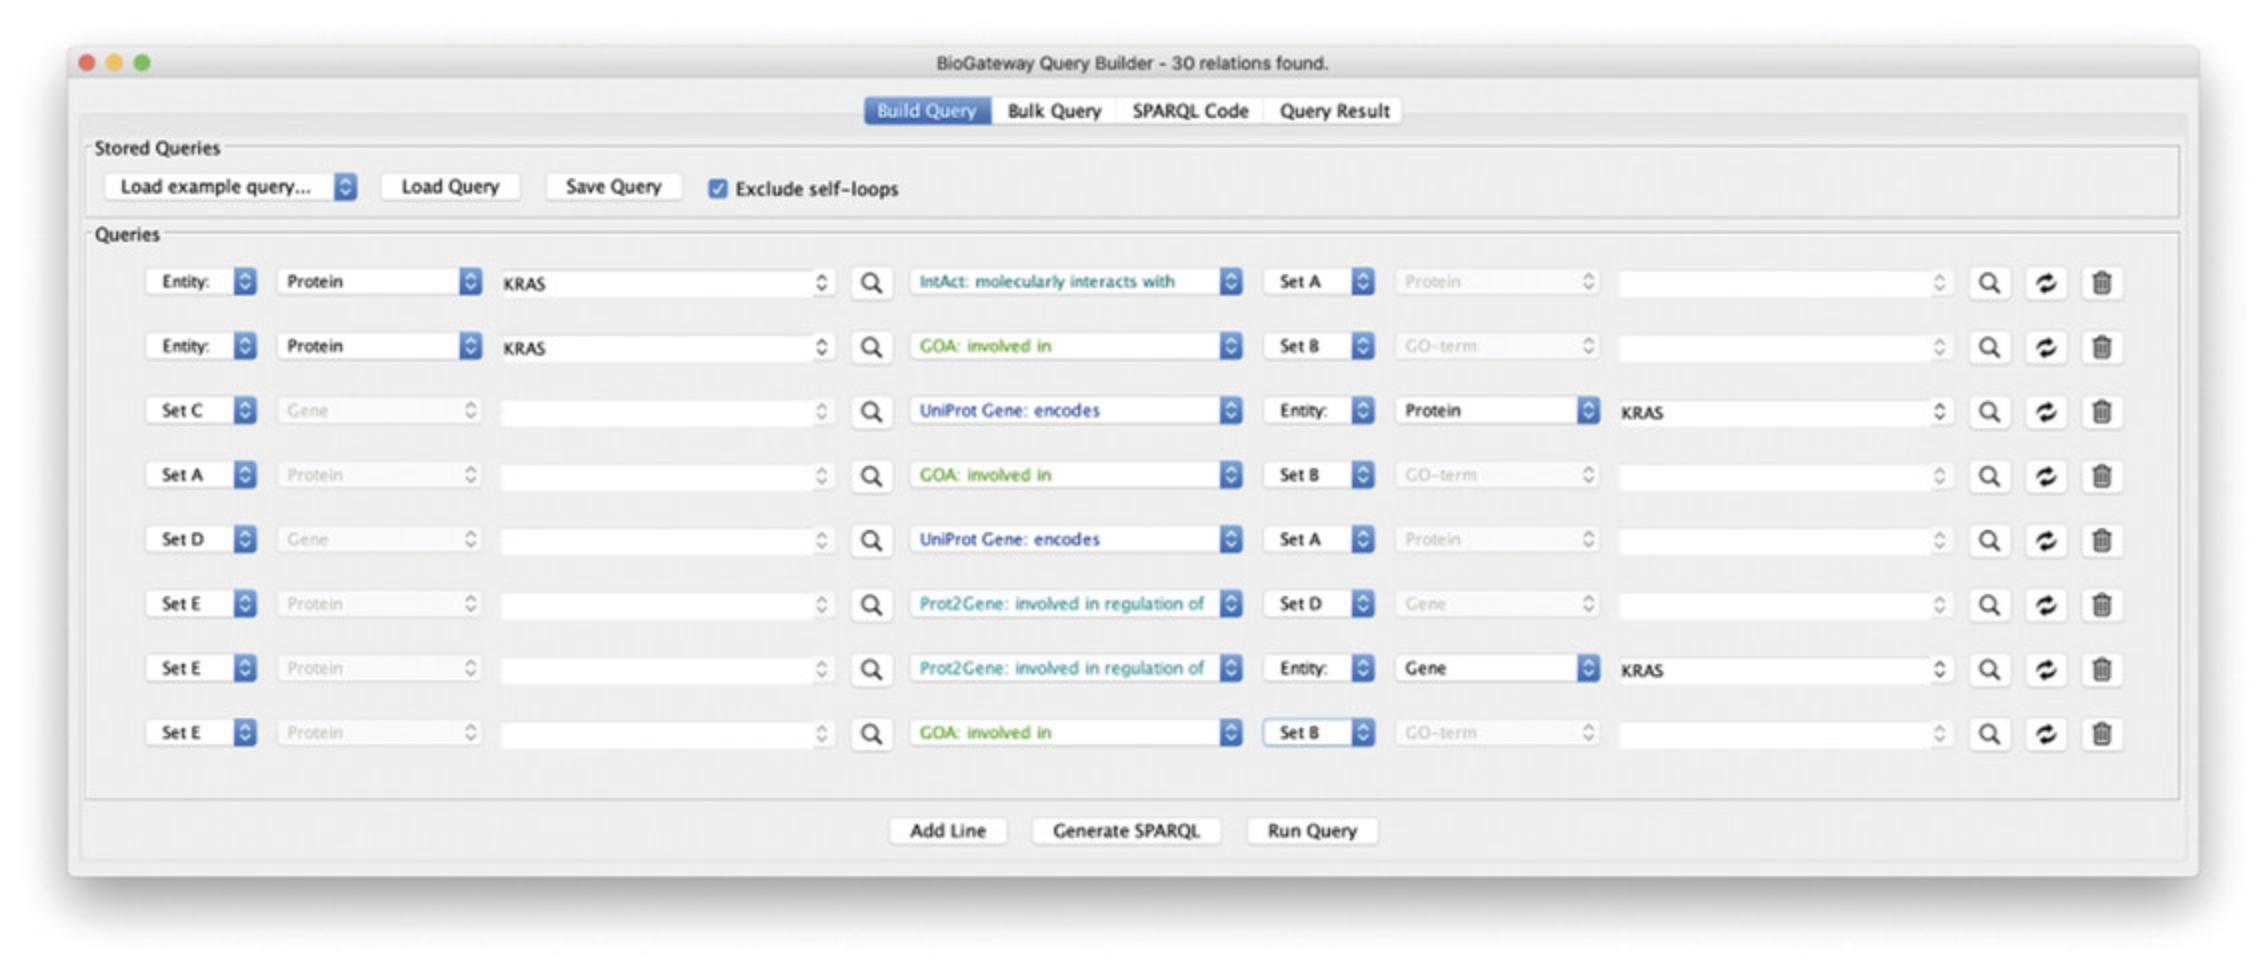
14.Queries can be saved and loaded by clicking the Save Query and Load Query buttons, respectively. Save the query and then click Run Query. Select all the results and Import to new Network.
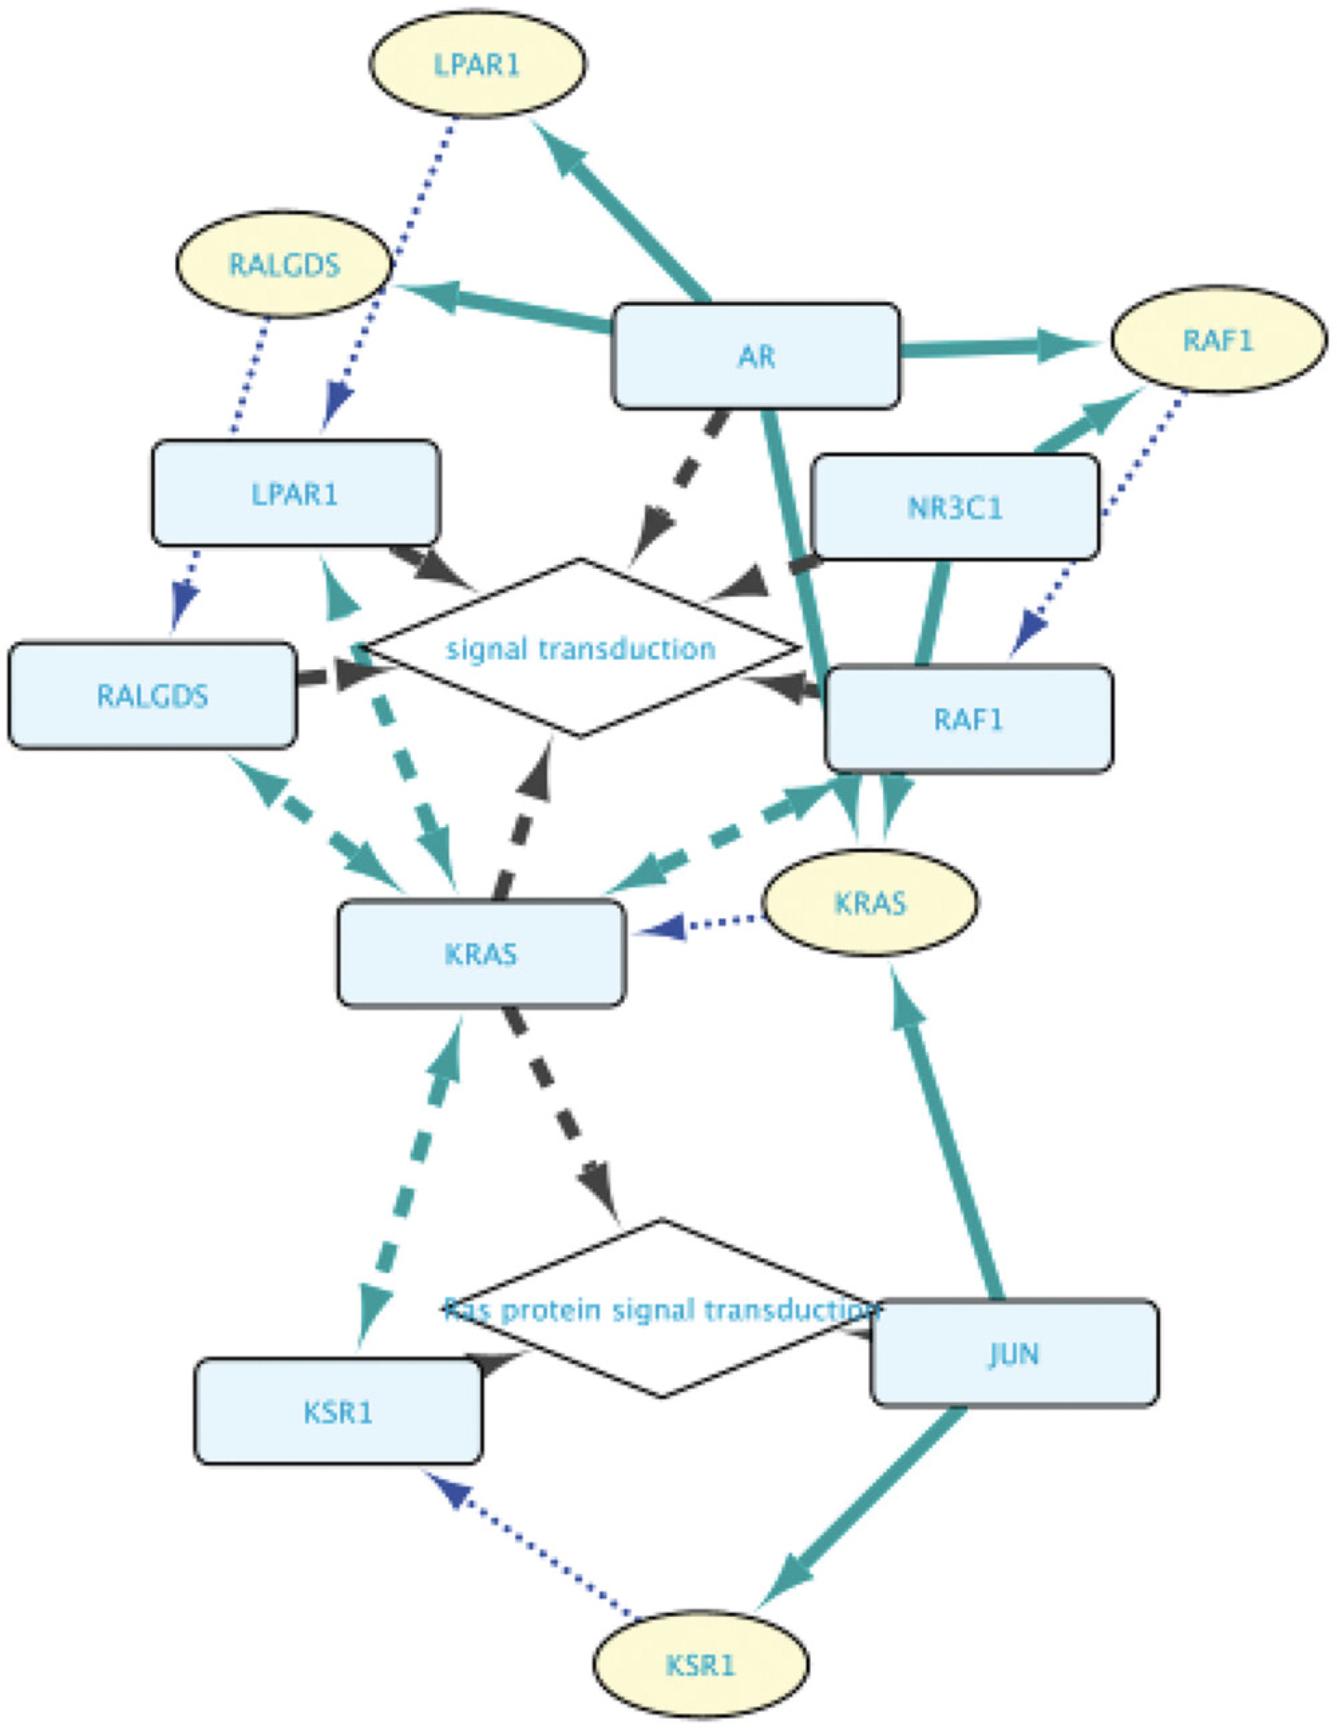
15.After pressing F5, the network will contain genes and proteins characterized by GO-BP terms Signal transduction and Ras signal transduction. In addition to the RASK protein, it contains other TFs interacting with it, the genes whose transcription they regulate, and the proteins encoded by these genes (Fig. 15).
Basic Protocol 3: EXPLORING MOLECULAR RELATIONSHIPS BETWEEN DISEASES
This protocol will take users deeper into building queries through the BioGateway Query Builder by constructing a multiline query. The overarching biological questions will be “What are some proteins that are relevant in both Breast and Colorectal Cancer? What Transcription Factors regulate the expression of the genes coding for these proteins?”. Through this, we will also introduce the users to the UniProt Disease graph, which stores annotations of proteins and their roles in different diseases. Thus, in this protocol, users will learn to create a network that satisfies several criteria in one query. The protocol will start from the Query Builder dialog. To open this dialog, please refer to Basic Protocol 2, step 2.
Necessary Resources
- See Basic Protocol 1
1.Open the BioGateway Query Builder.
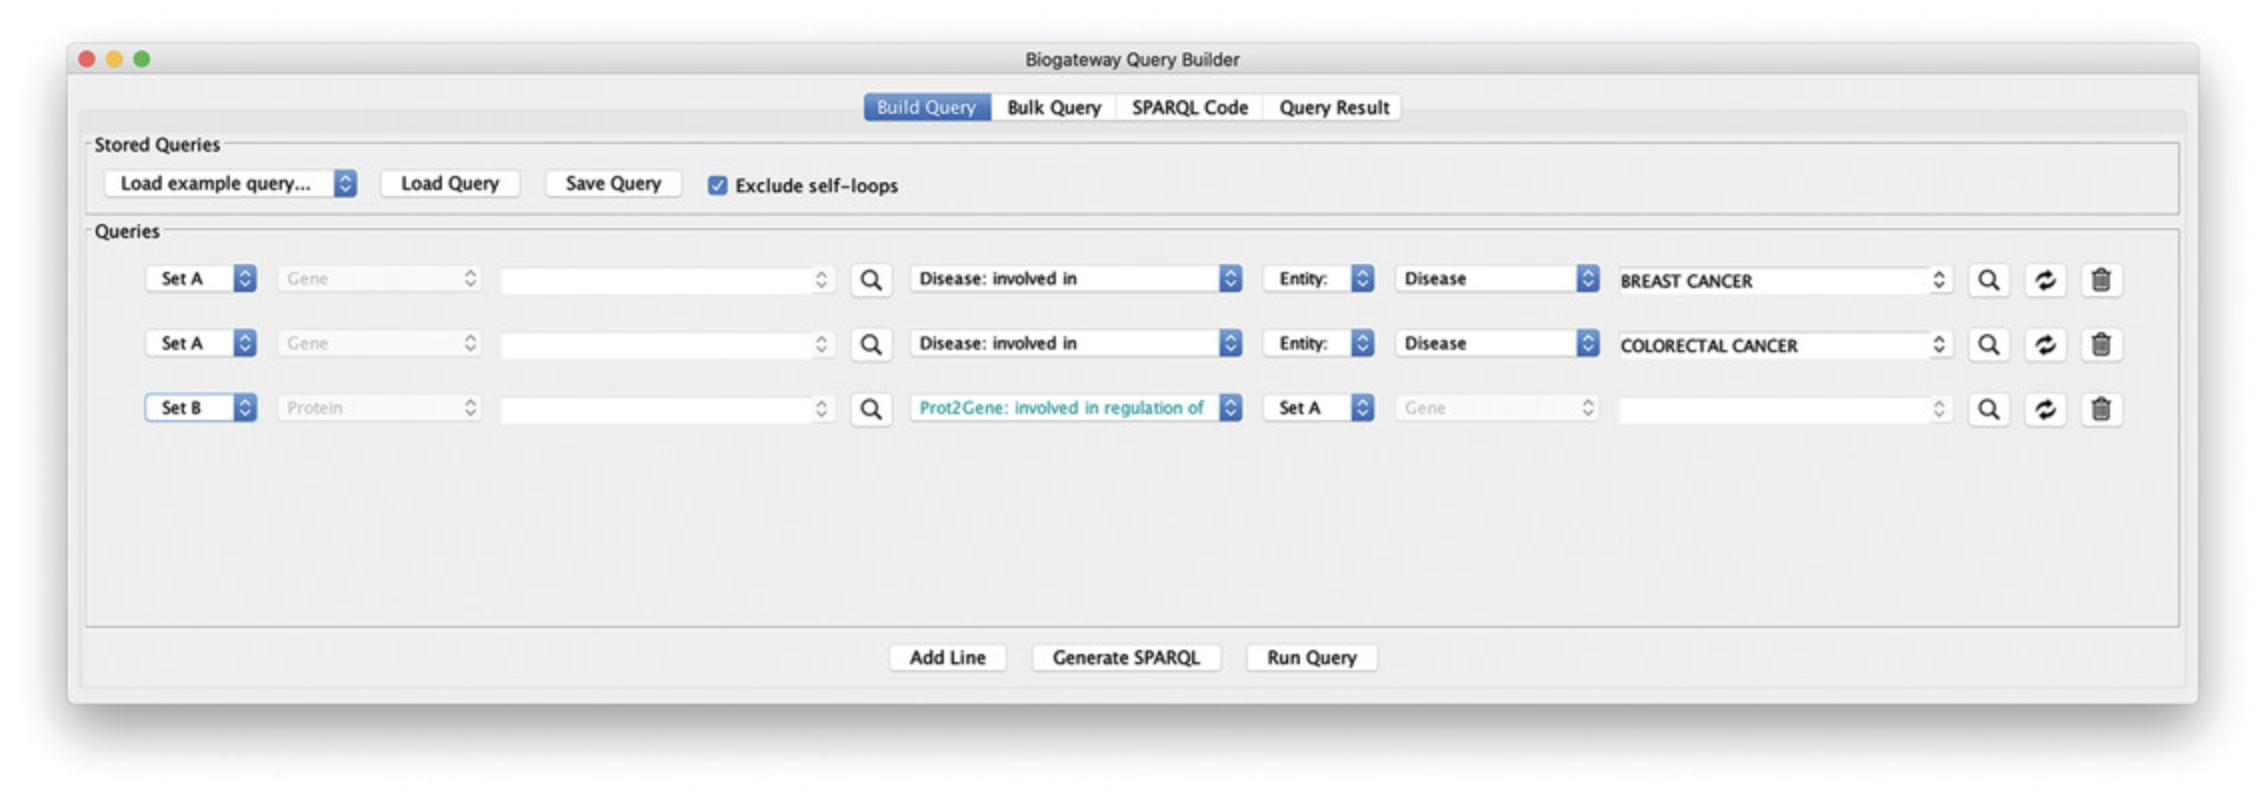
2.Create a line asking for all the proteins annotated to be involved in Breast Cancer: set the subject Entity to “Set A.” Now, select “Disease: involved in” as the relation type and type “BREAST CANCER” in the search field for the Object. In the autocomplete results, select “BREAST CANCER: BREAST CANCER, FAMILIAL.”
3.Add a second line to the query asking for all proteins annotated to be involved in Colorectal Cancer: add a query line and set the subject to “Set A.” Now, set the relation type to “Disease: involved in” as the relation type. Finally, type “COLORECTAL CANCER” in the search field for the Object and select “COLORECTAL CANCER: COLON CANCER, CRC” in the autocomplete results.
4.Add a third line querying for all TFs regulating the expression of the genes found in lines 1 and 2 of the query: set the subject to “Set B” and select the relation type to “involved in regulation of.” Next, set the Object to “Set A.” Figure 16 shows the resulting query.
5.Run the query by clicking the Run Query button.
6.In the Query Result window, select all results and import them to the Cytoscape canvas by clicking the Import to New Network button.
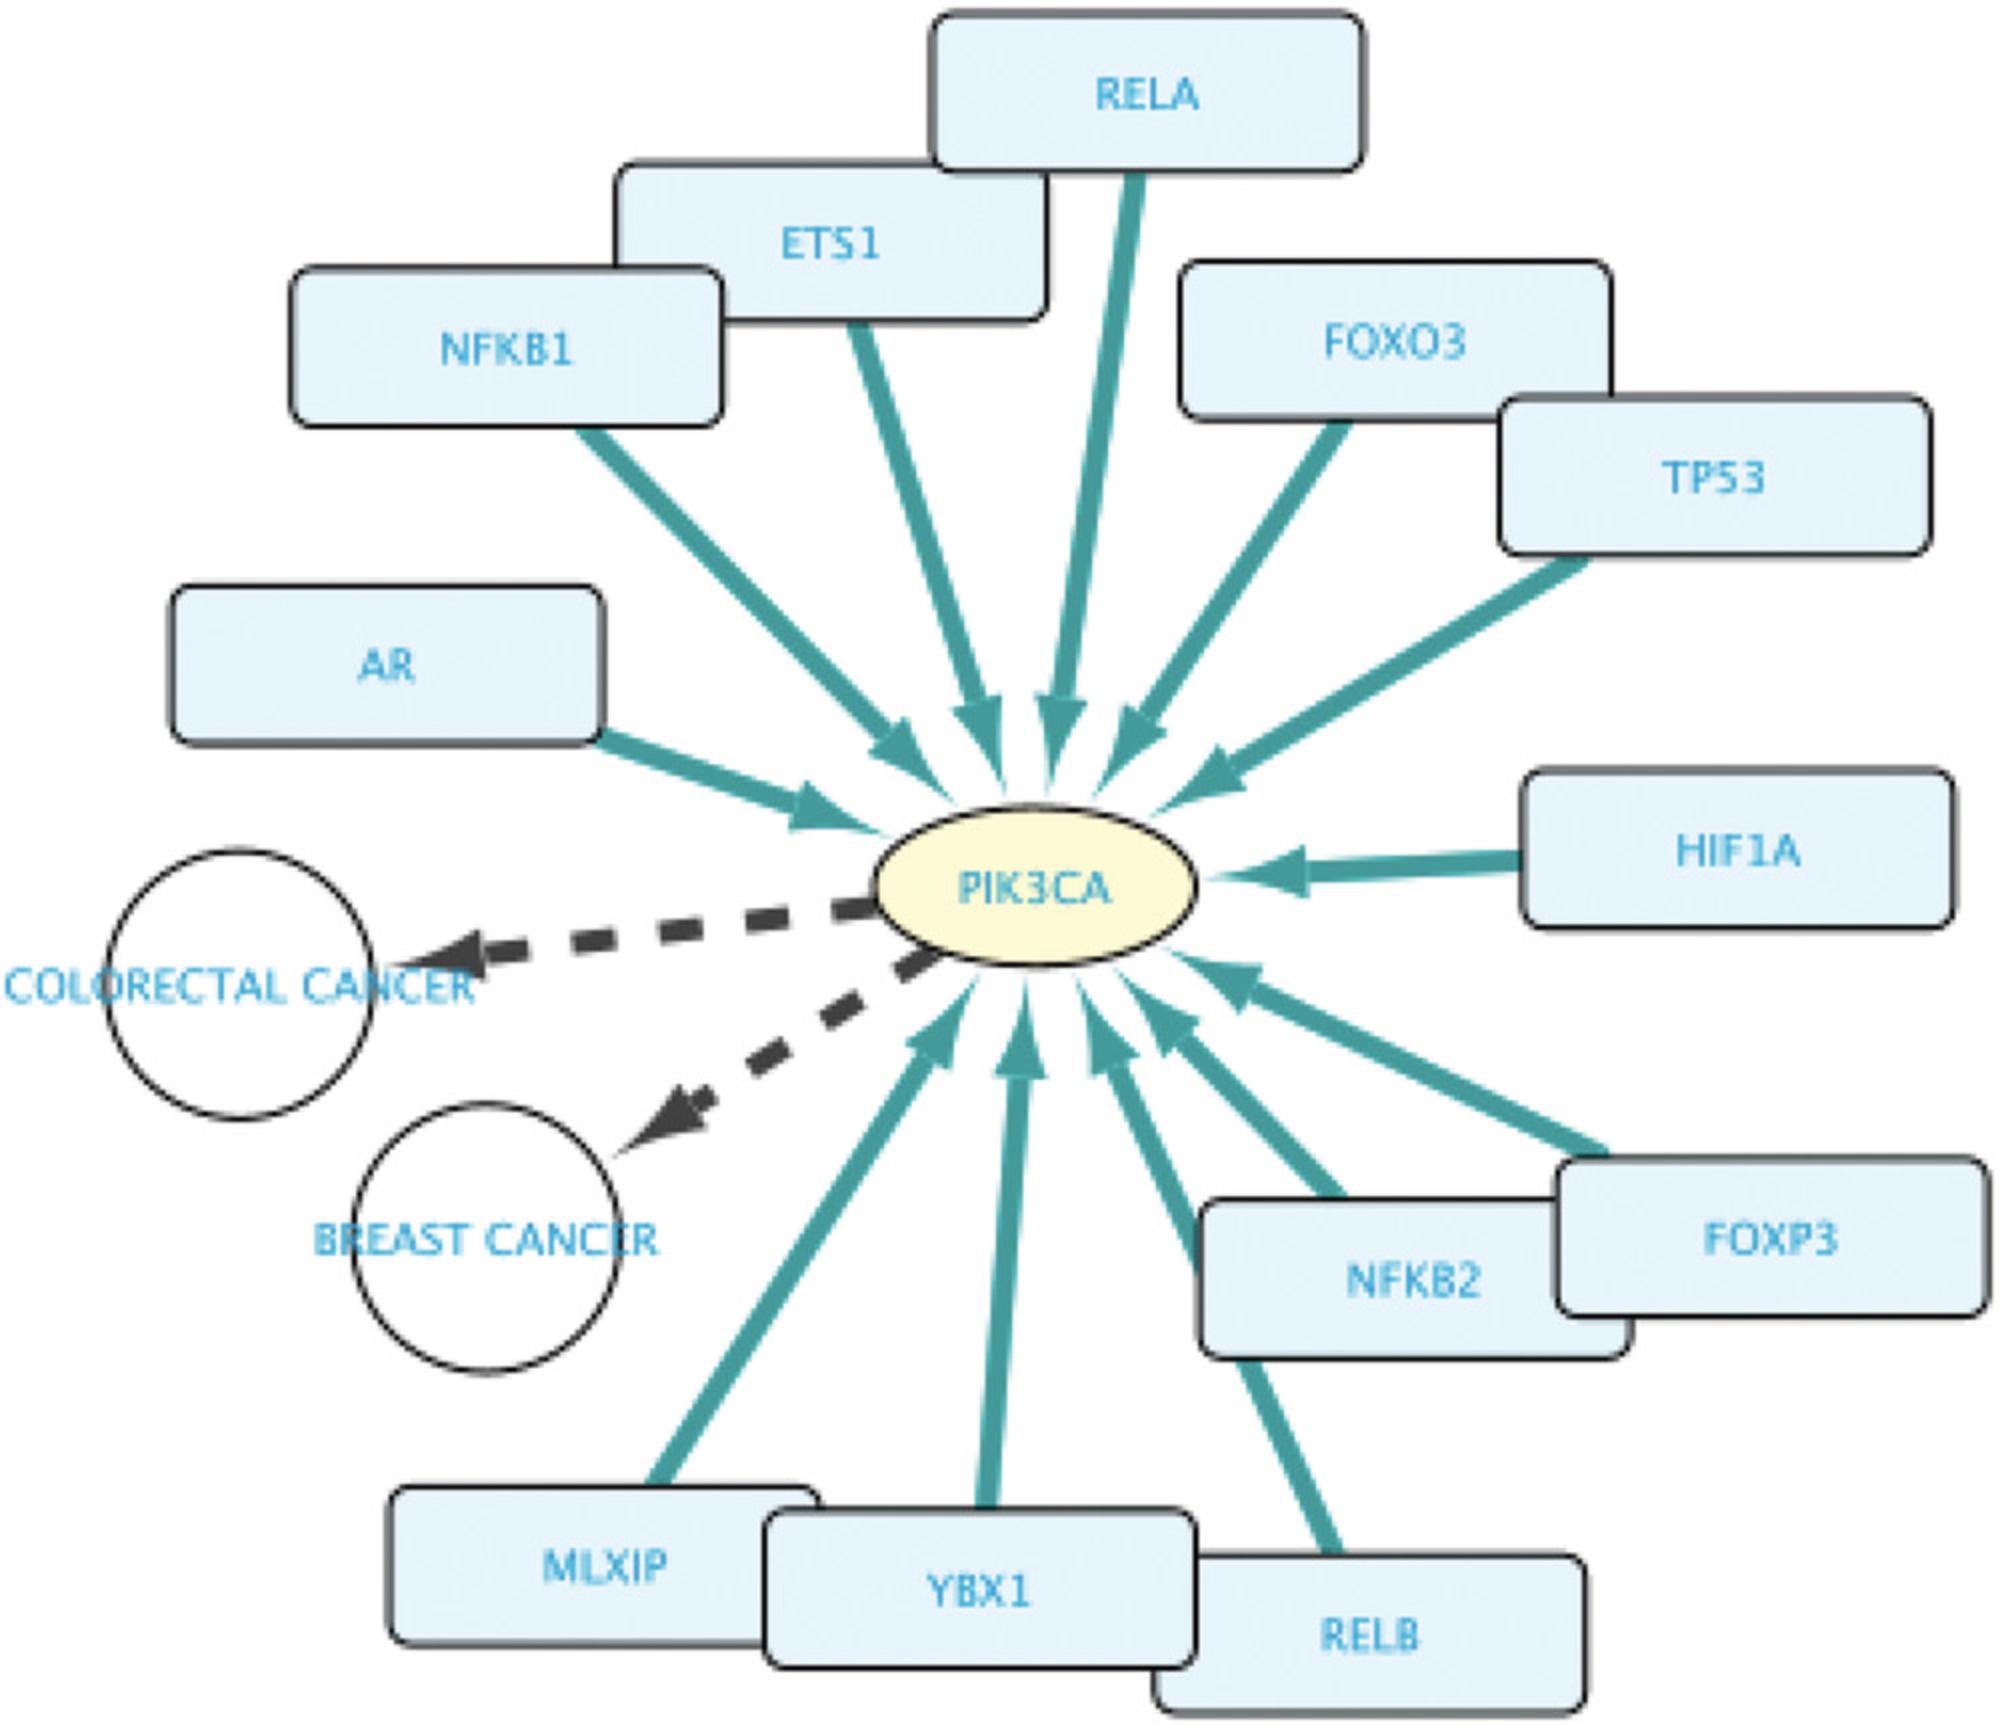
7.Press F5 and explore the resulting network (Fig. 17).
Basic Protocol 4: FIND PROTEINS WITH PROTEIN KINASE ACTIVITY INVOLVED IN A DISEASE AND EXPLORE THE CONTEXT AROUND THEM
With this protocol, we aim to set a first example where users employ both the Query Builder and the point-and-click-based interactions. It will start with making a two-line query in the Query Builder to create a network. Next, we will further expand the network by directly interacting with some of its nodes. This example will introduce a feature allowing users to import only relations between already existing nodes. The biological aim in this example will be to find proteins with kinase activity that are involved in colorectal cancer, the genes encoding for them, the interactome around the found proteins, and potentially relevant TF-TG interactions.
Necessary Resources
- See Basic Protocol 1
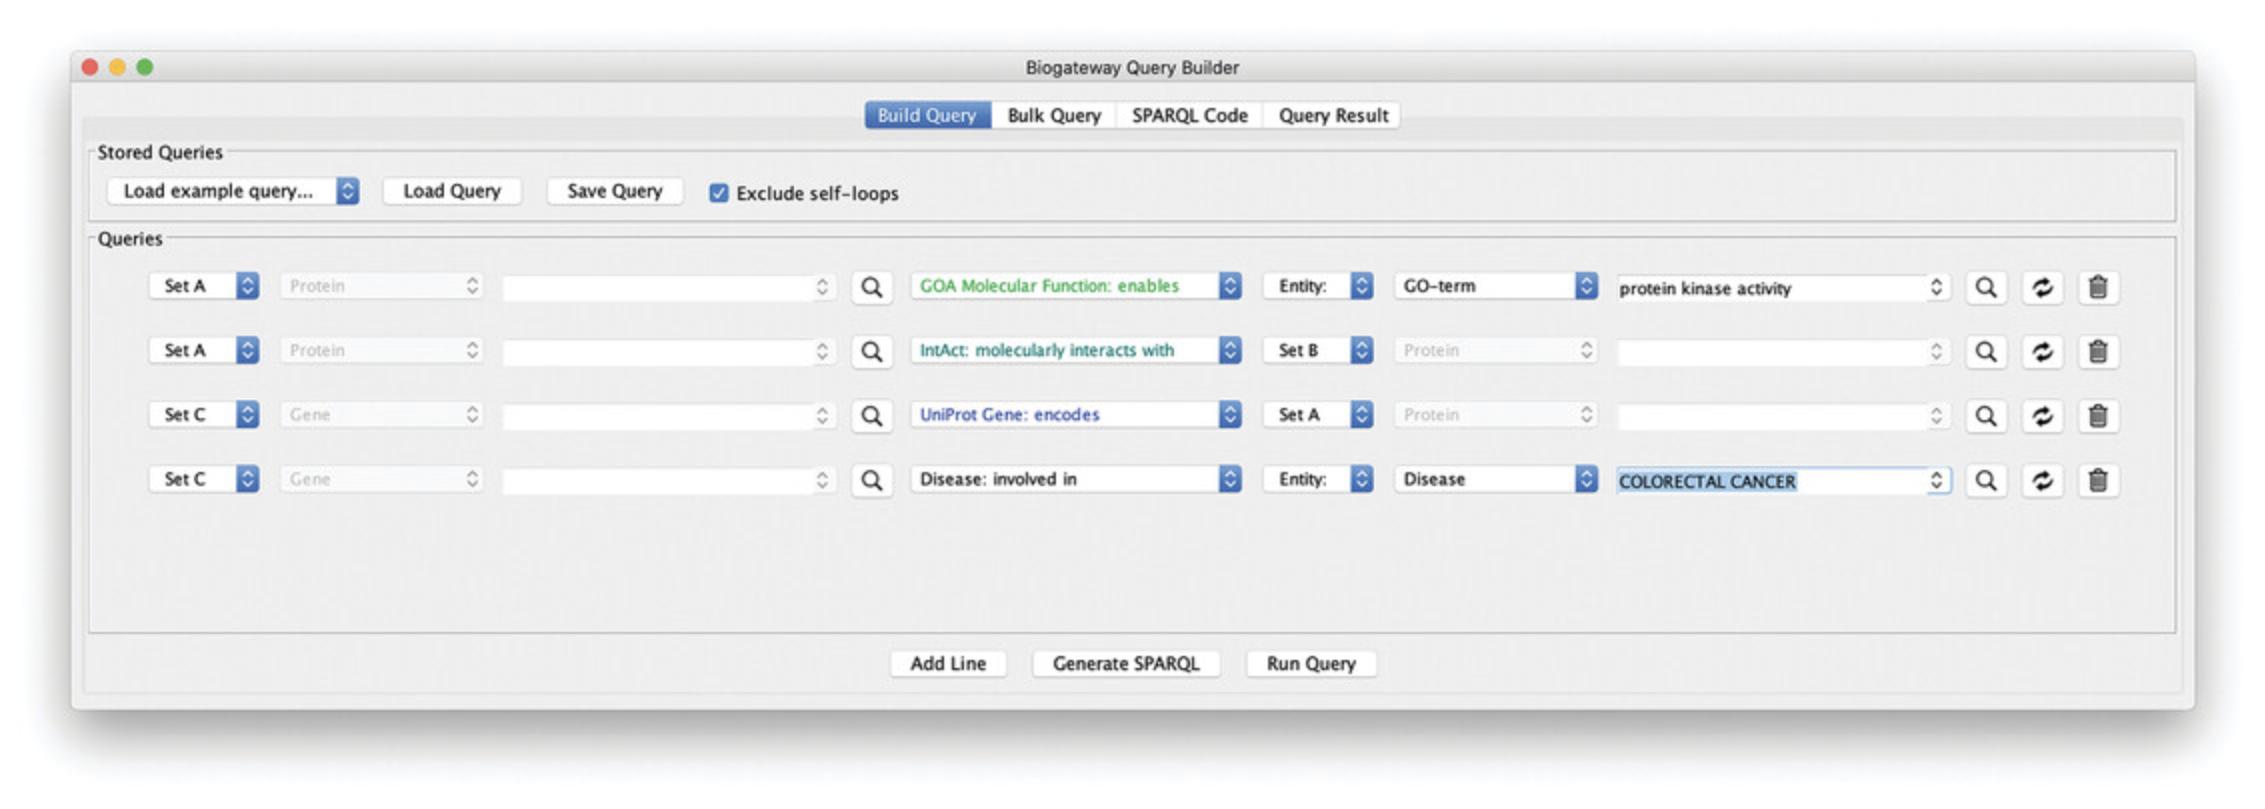
1.Build the first line of the query asking for proteins annotated with the Gene Ontology term “protein kinase activity”: set the Subject entity to “Set A” and the Relation type to “GOA: enables.” Type “protein kinase activity” in the Object search field and select the appropriate result.
2.Add a second line to the query by clicking the Add Line button. Set the Subject entity to “Set A” and the Relation type to “molecularly interacts with.” Now, set the Object entity to “Set B.”
3.Add another line to the query by clicking the Add Line button. Set the Subject entity to “Set C” and the Relation type to “encodes.” Finally, set the Object entity to “Set A.”
4.Add a last line asking for genes from line 3 that are involved in Colorectal Cancer: click the Add Line button. Set the Subject entity to “Set C” and the Relation type to “Disease: involved in.” Now, type “COLORECTAL CANCER” in the Object search field and select the result “COLORECTAL CANCER: COLON CANCER, CRC.” Figure 18 displays the resulting query in the Query Builder.
5.Run the query by clicking the Run Query button.
6.In the Query Result tab, select all results and import them by the Import to New Network button.
7.In the network, Select all nodes in the network by pressing Ctrl/Cmd + A. Now, right click anywhere on the canvas and select BioGateway > Fetch relations FROM selected > tfact2gene: involved in regulation of. In the Query Result dialog, select all results and import them by clicking the Import selected button.
8.Select all nodes in the network by pressing Ctrl/Cmd + A. Right click anywhere in the Cytoscape canvas and select Biogateway > Fetch relations FROM selected > UniProt Gene: encodes. This query will ask for the proteins encoded by the genes present in the network. Select all results in the Query Result dialog and import by clicking the Import selected button.
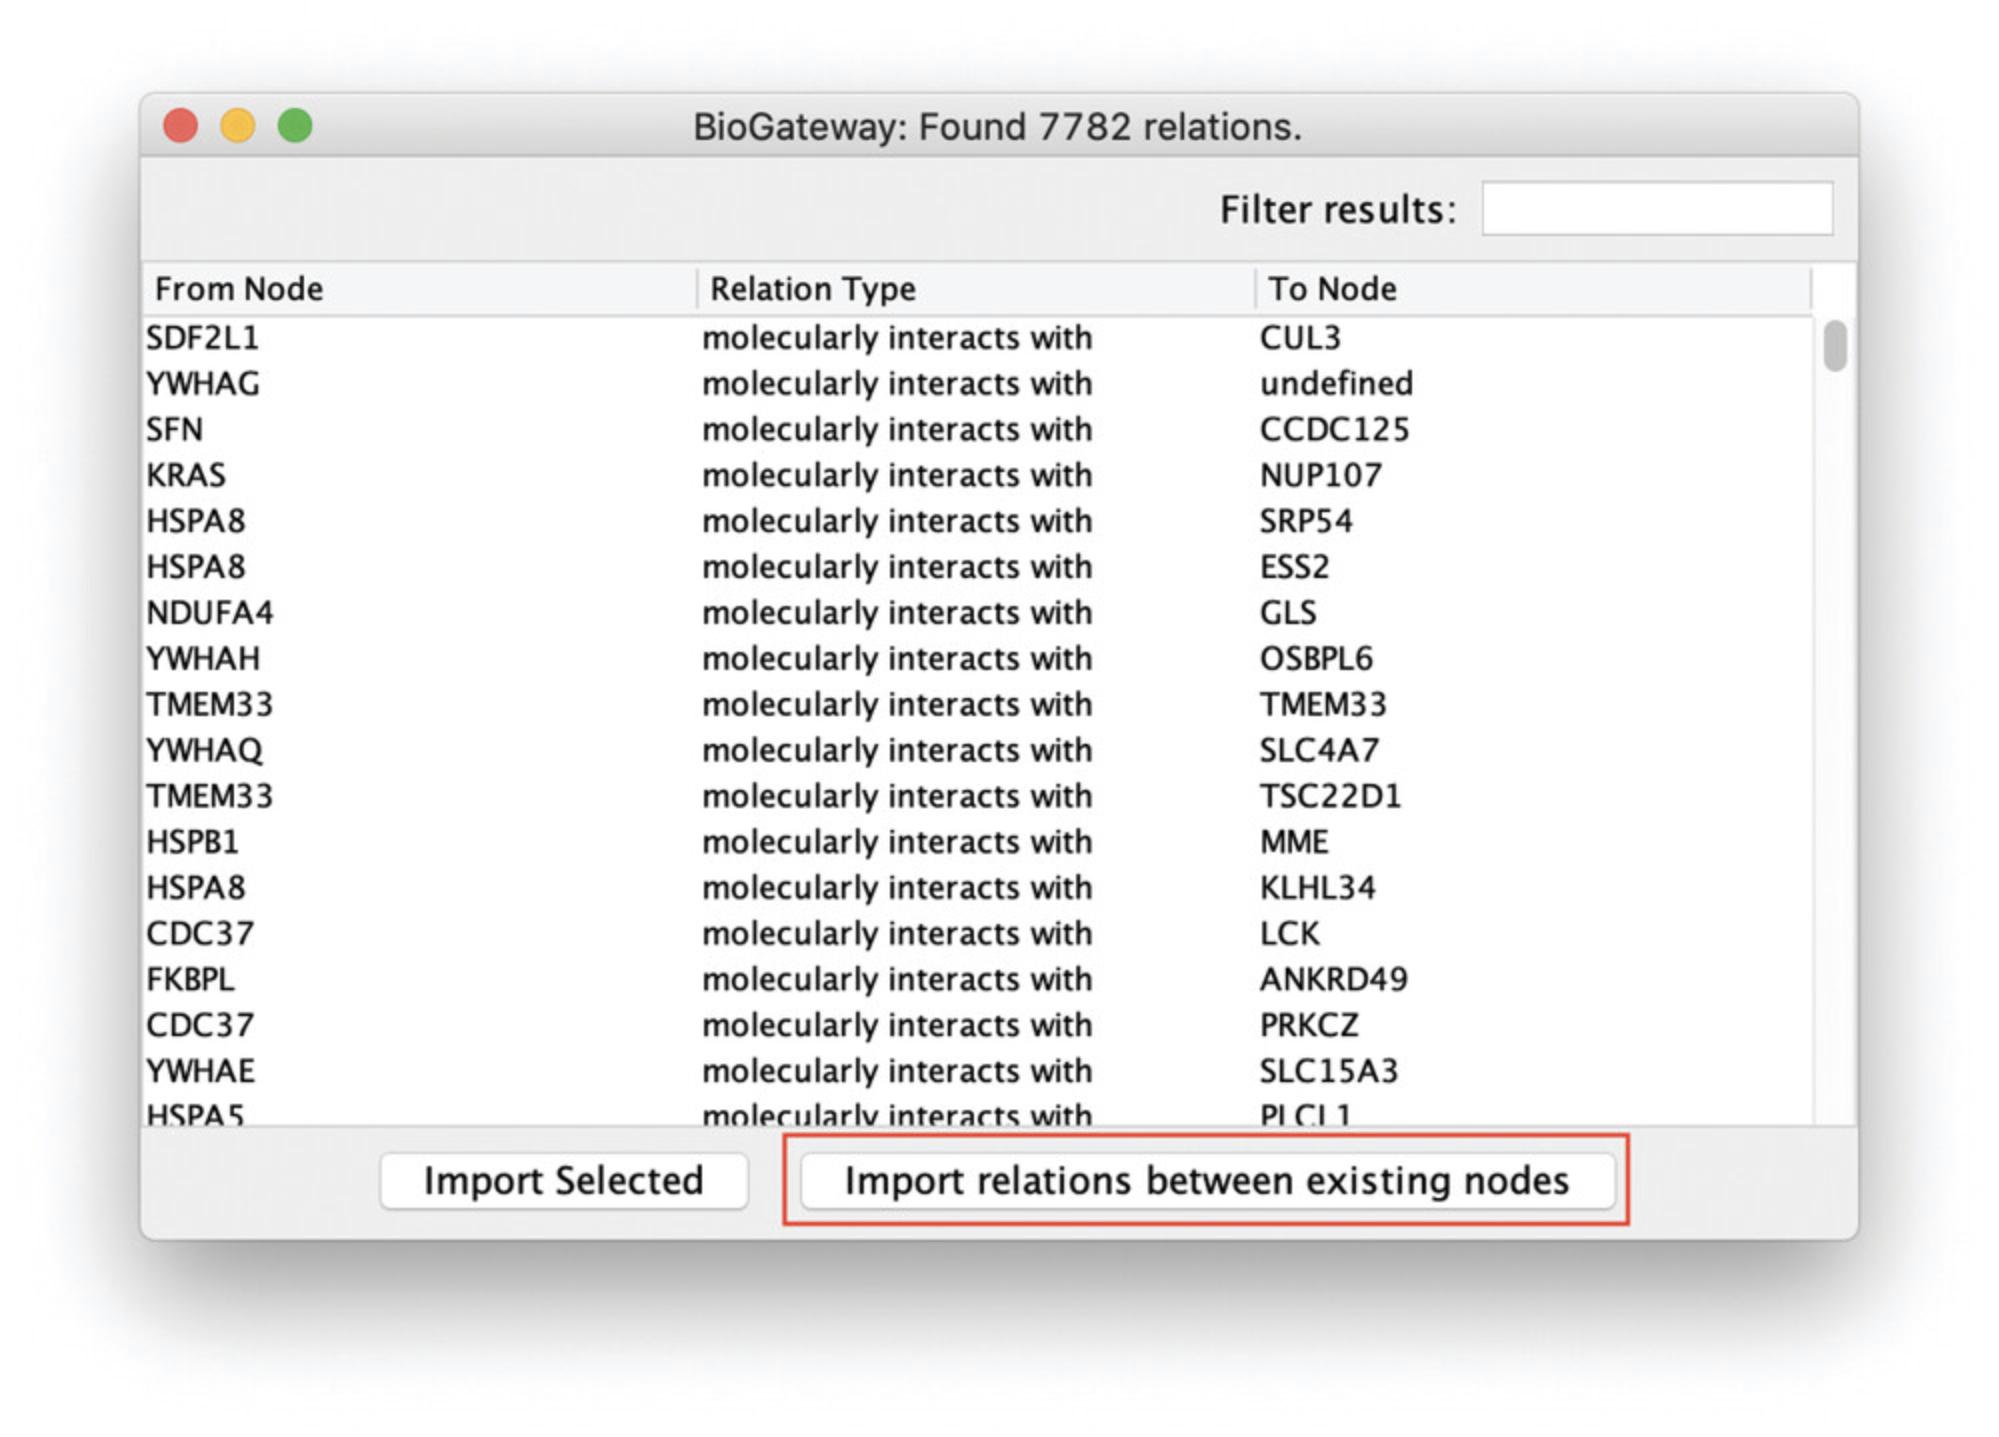
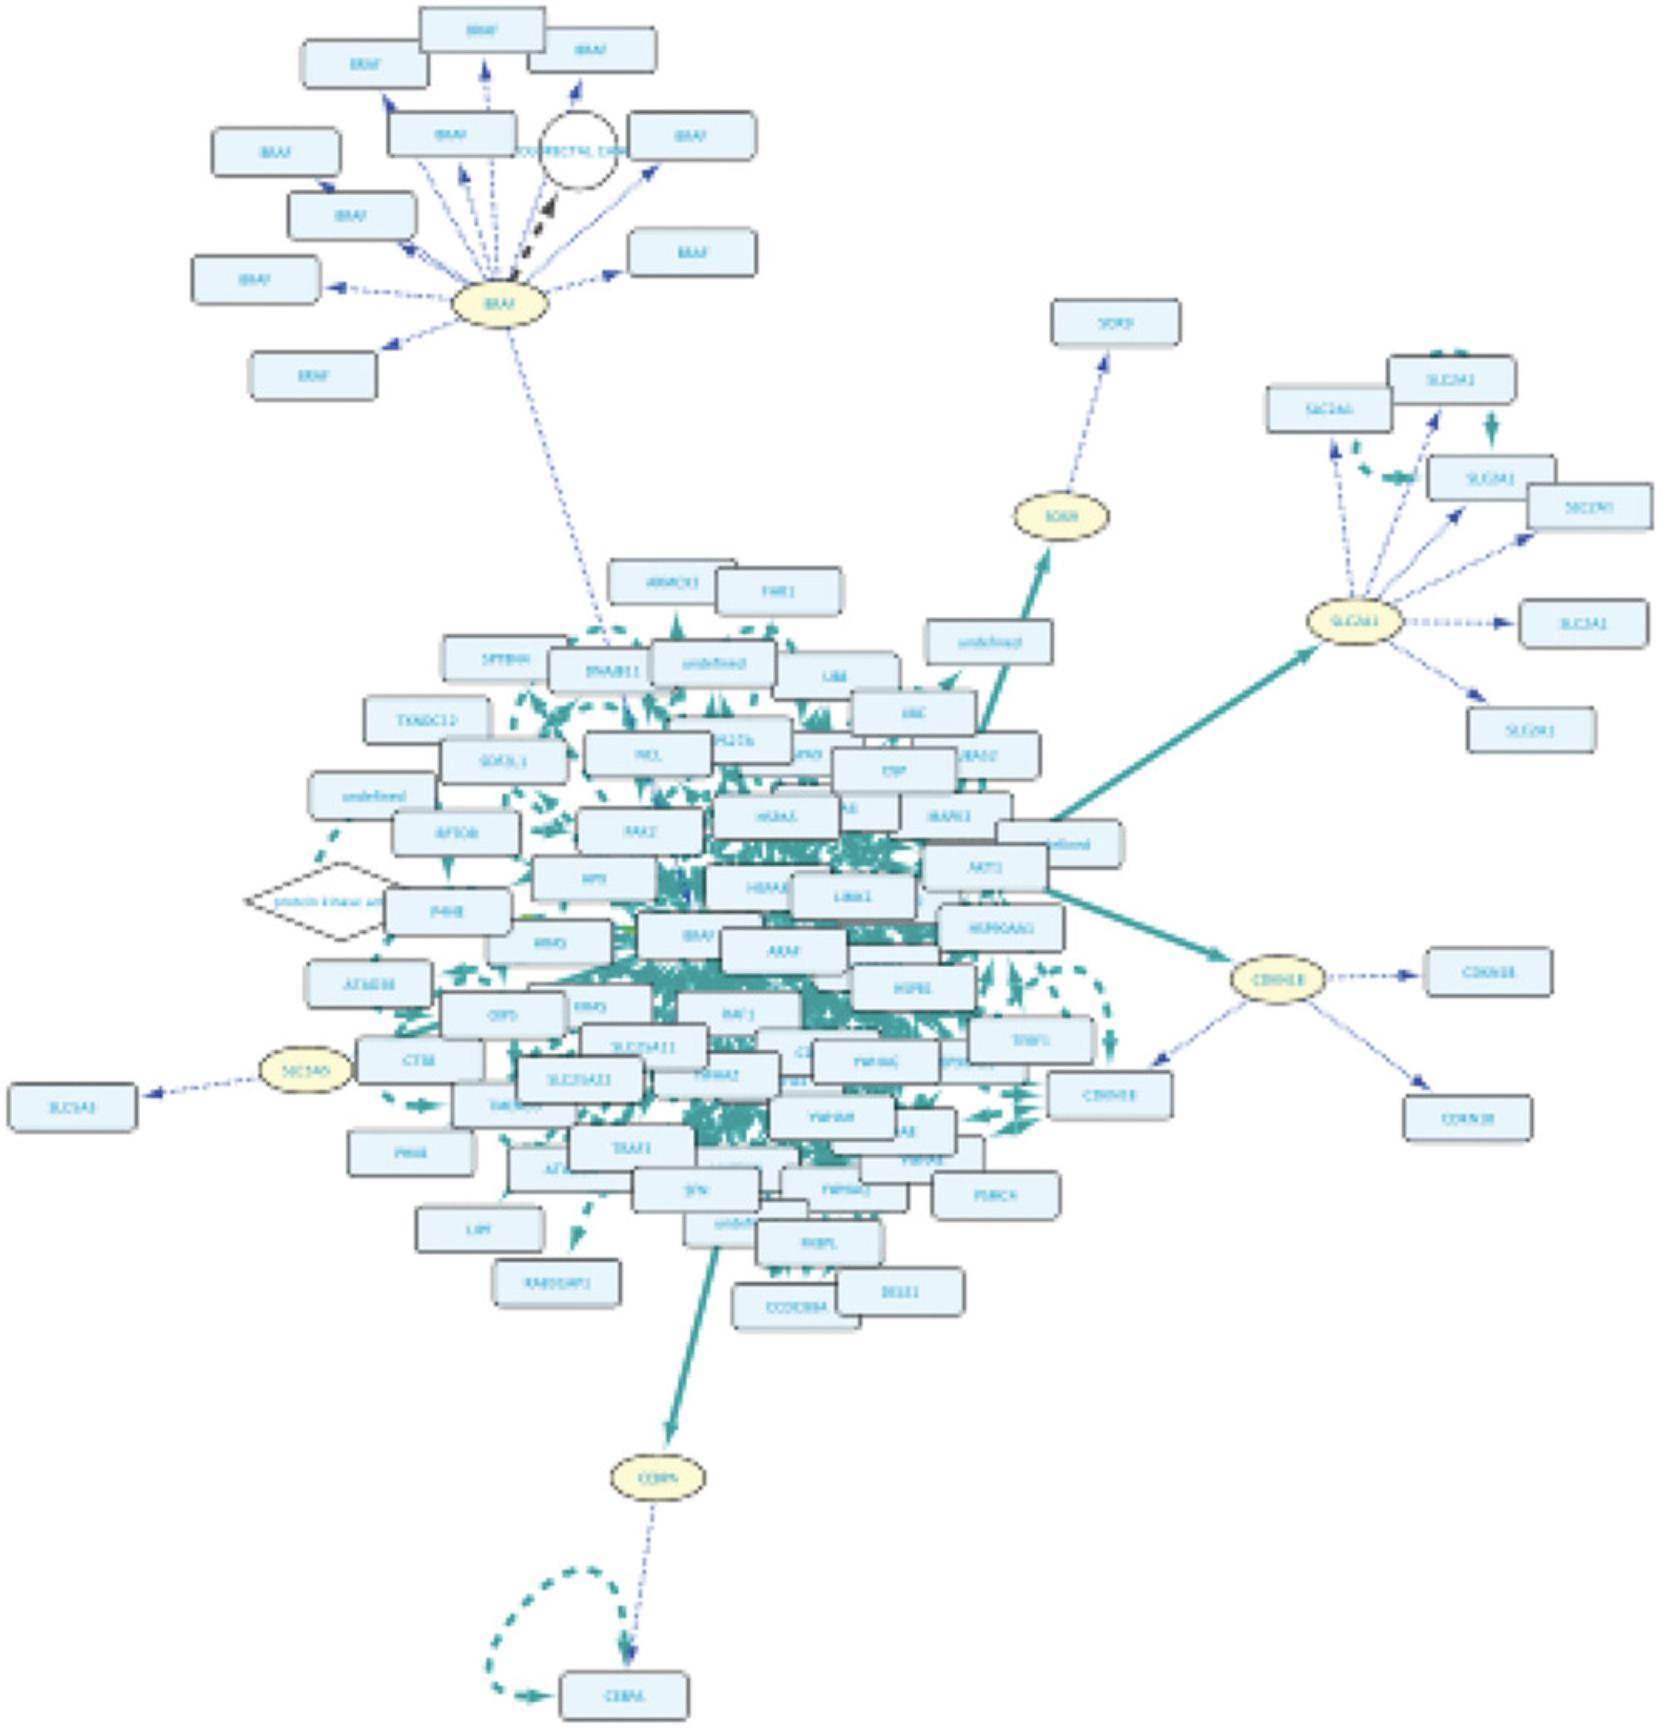
9.Select all nodes in the network by pressing Ctrl/Cmd + A. Right click anywhere on the Cytoscape canvas and select Biogateway > Fetch relations FROM selected > IntAct: molecularly interacts with. In the Query Result dialog, click the Import relations between existing nodes (Fig. 19). This will import only the interactions involving nodes that are already present in the network. Figure 20 shows the resulting network.
Basic Protocol 5: EXPLORING THE POTENTIAL DOWNSTREAM EFFECTS AFTER TARGETED INHIBITION OF PROTEINS
In this protocol, we will explore an advanced feature from the Query Builder that allows the users to Filter the results of their query and create a subnetwork from the filtered results. Through this, users can create wider queries, which will then be explored and curated in the Query Result window. The biological questions in this case are “What are the potential downstream effects after targeted inhibition of MAP3K7 and AKT1? Can we find a connection between the two affected proteins?.” To answer these questions, the protocol will start with the creation of a 5-line query on the Query Builder. Once getting the results, users will be guided through a series of steps to learn how to curate the results based on a text search and create a subnetwork based on the filtering.
Necessary Resources
- See Basic Protocol 1
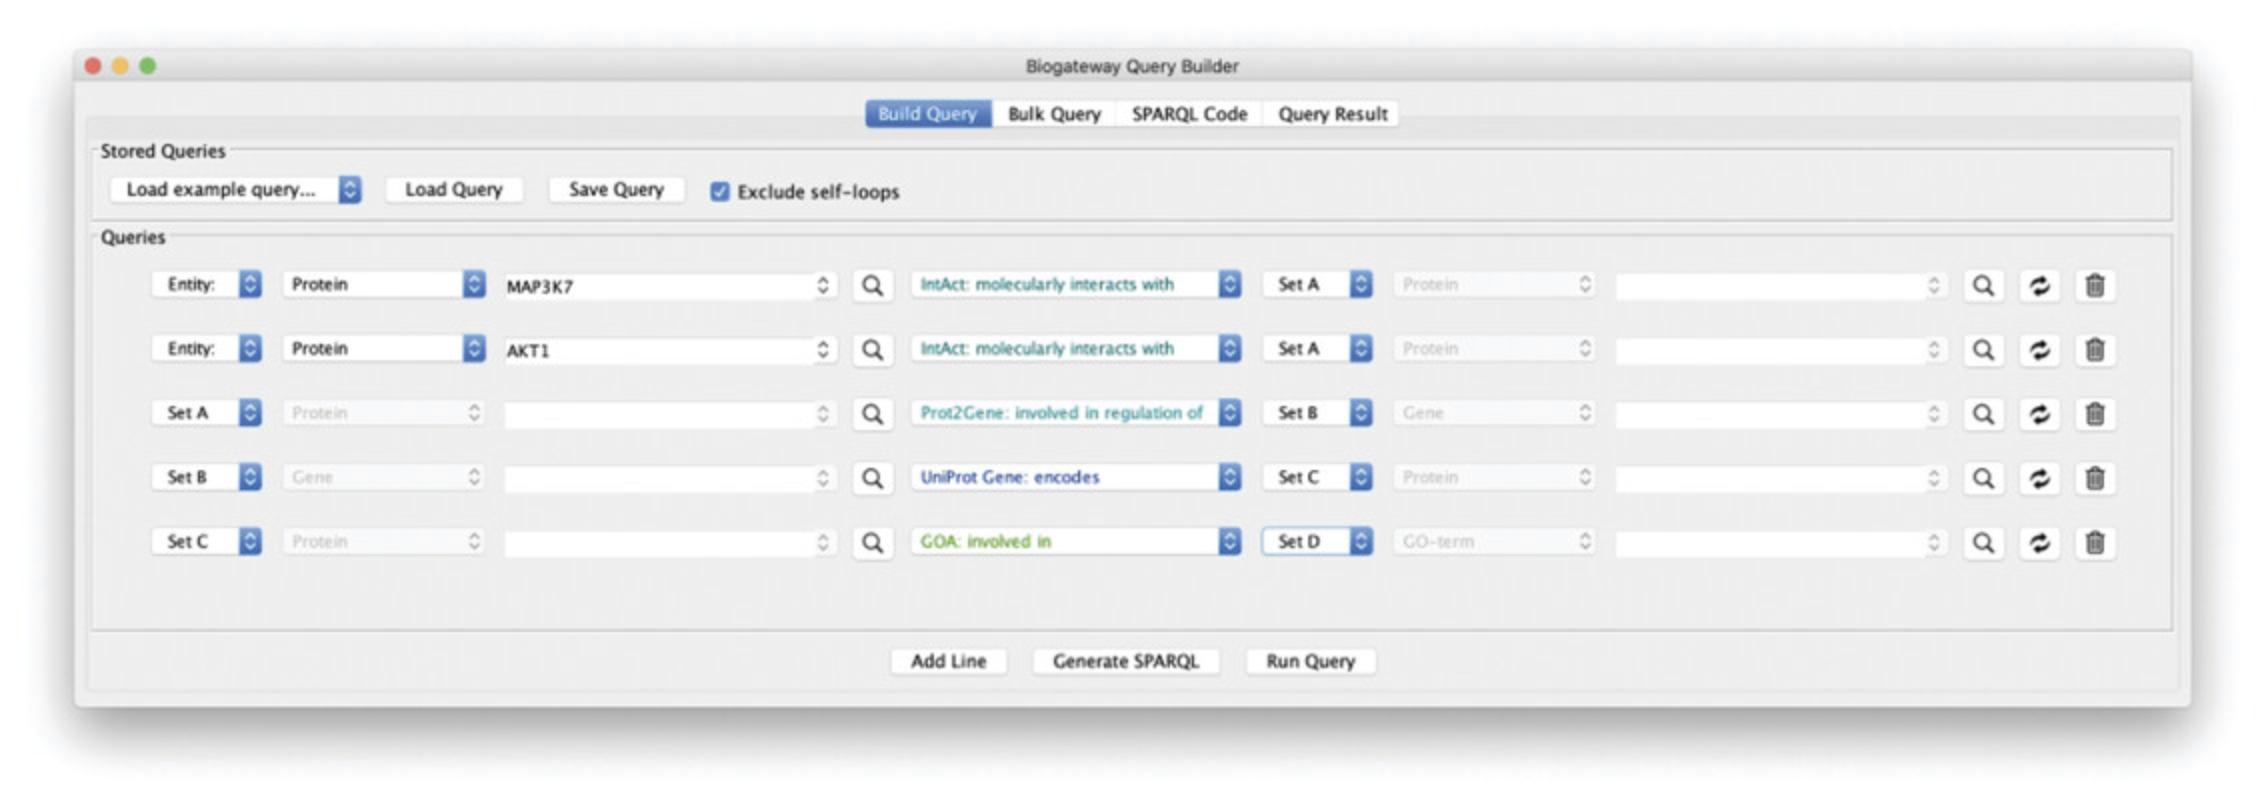
1.Build a query line asking for the proteins interacting with MAP3K7: type “MAP3K7” in the Subject search field and select the first result from the autocomplete results. Next, set the relation type to “molecularly interacts with” and the Object to “Set A.”
2.Add a new line asking for the proteins interacting with AKT1 from the set of proteins found in step 1: add a new query line and type “AKT1” in the search field for the Subject. Select the first result from the autocomplete function and set the relation type to “molecularly interacts with.” Now, set the Object to “Set A.”
3.Add a new line querying for the TGs of the TFs found in lines 1 and 2 of the query: add a new query line and set the Subject to “Set A.” Now, set the relation type to “involved in regulation of” and the Object to “Set B.”
4.Add a new line in order to get the proteins encoded by the genes found in step 3: add a new query line and set the Subject to “Set B.” Next, set the relation type to “encodes” and the Object to “Set C.”
5.Add a new line to find the GO Biological Process annotations for the proteins found in step 4: add a query line. Set the Subject to “Set C” and the relation type to “involved in.” Finally, set the Object to “Set D.” Figure 21 shows the Query Builder window after building the described query.
6.Run the query by clicking the Run Query button.
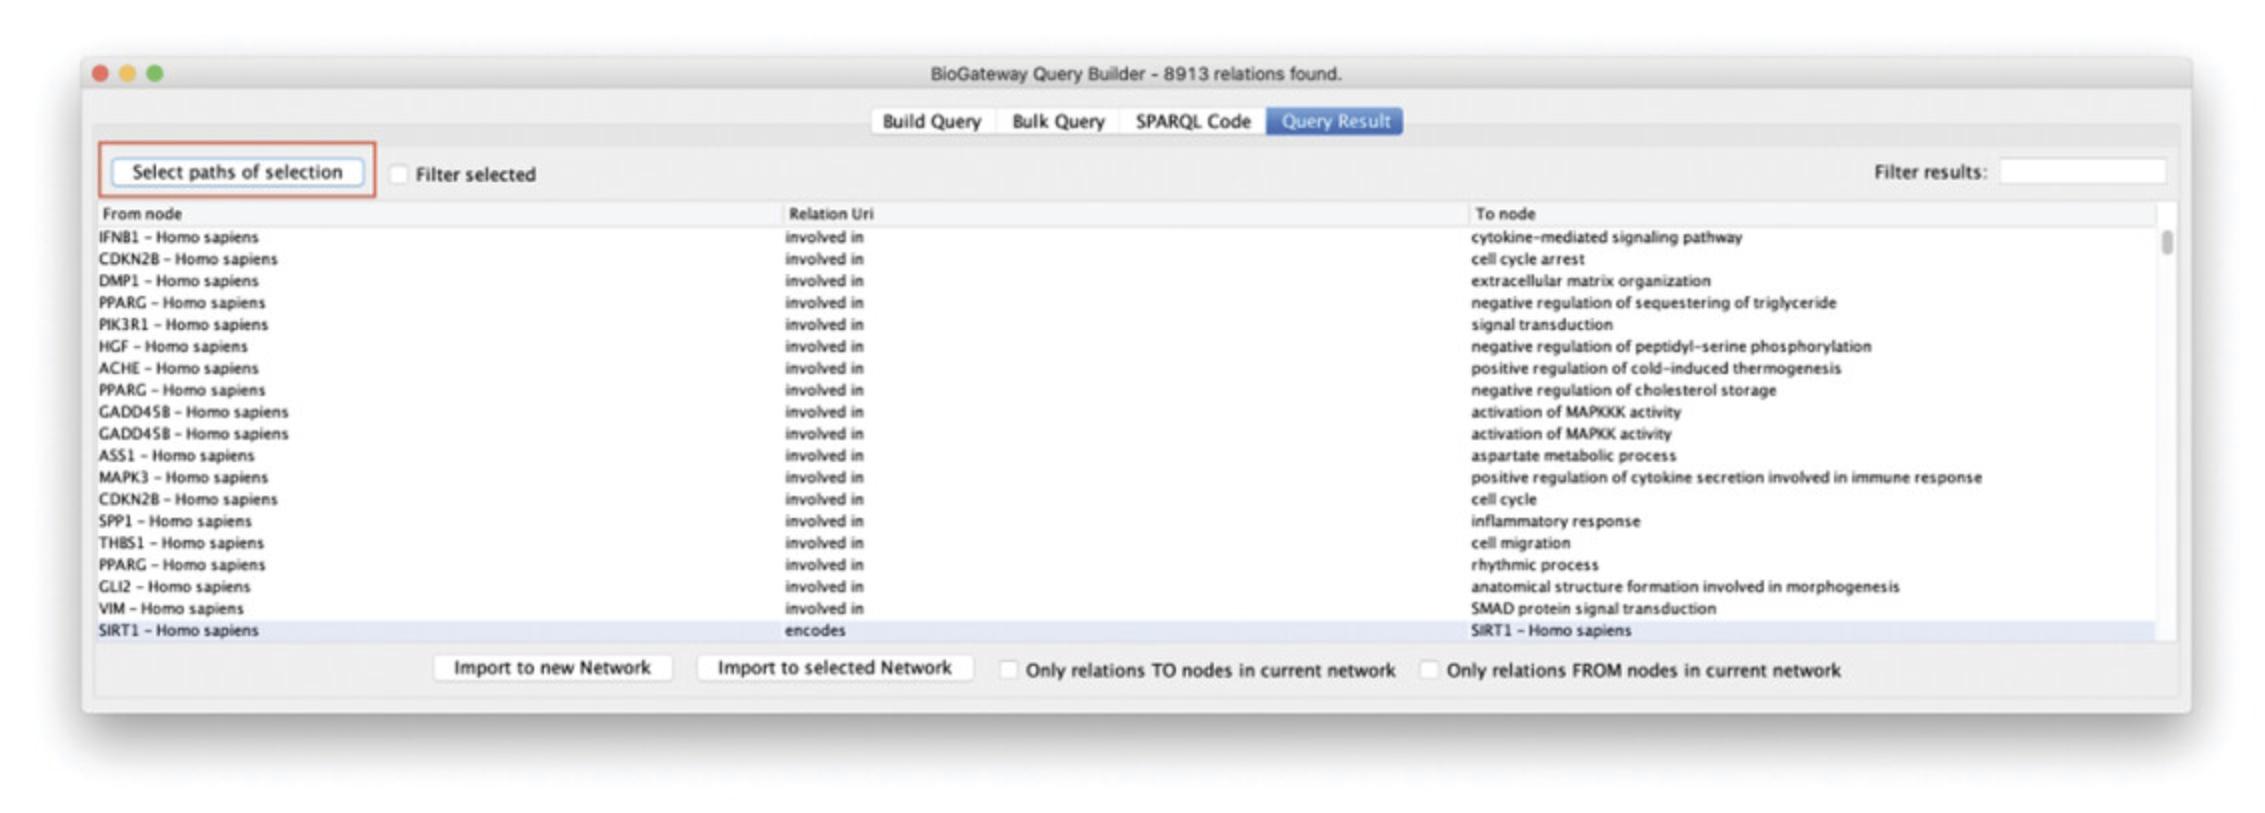
7.In the Query Result window, type “DNA damage” in the text field named “Filter results.” This will display only the results containing the entered text (Fig. 22).
8.Select all displayed results by pressing Ctrl/Cmd ± A.
9.Click the Select paths of selection button to find all nodes and relations leading to the filtered results found in step 10.
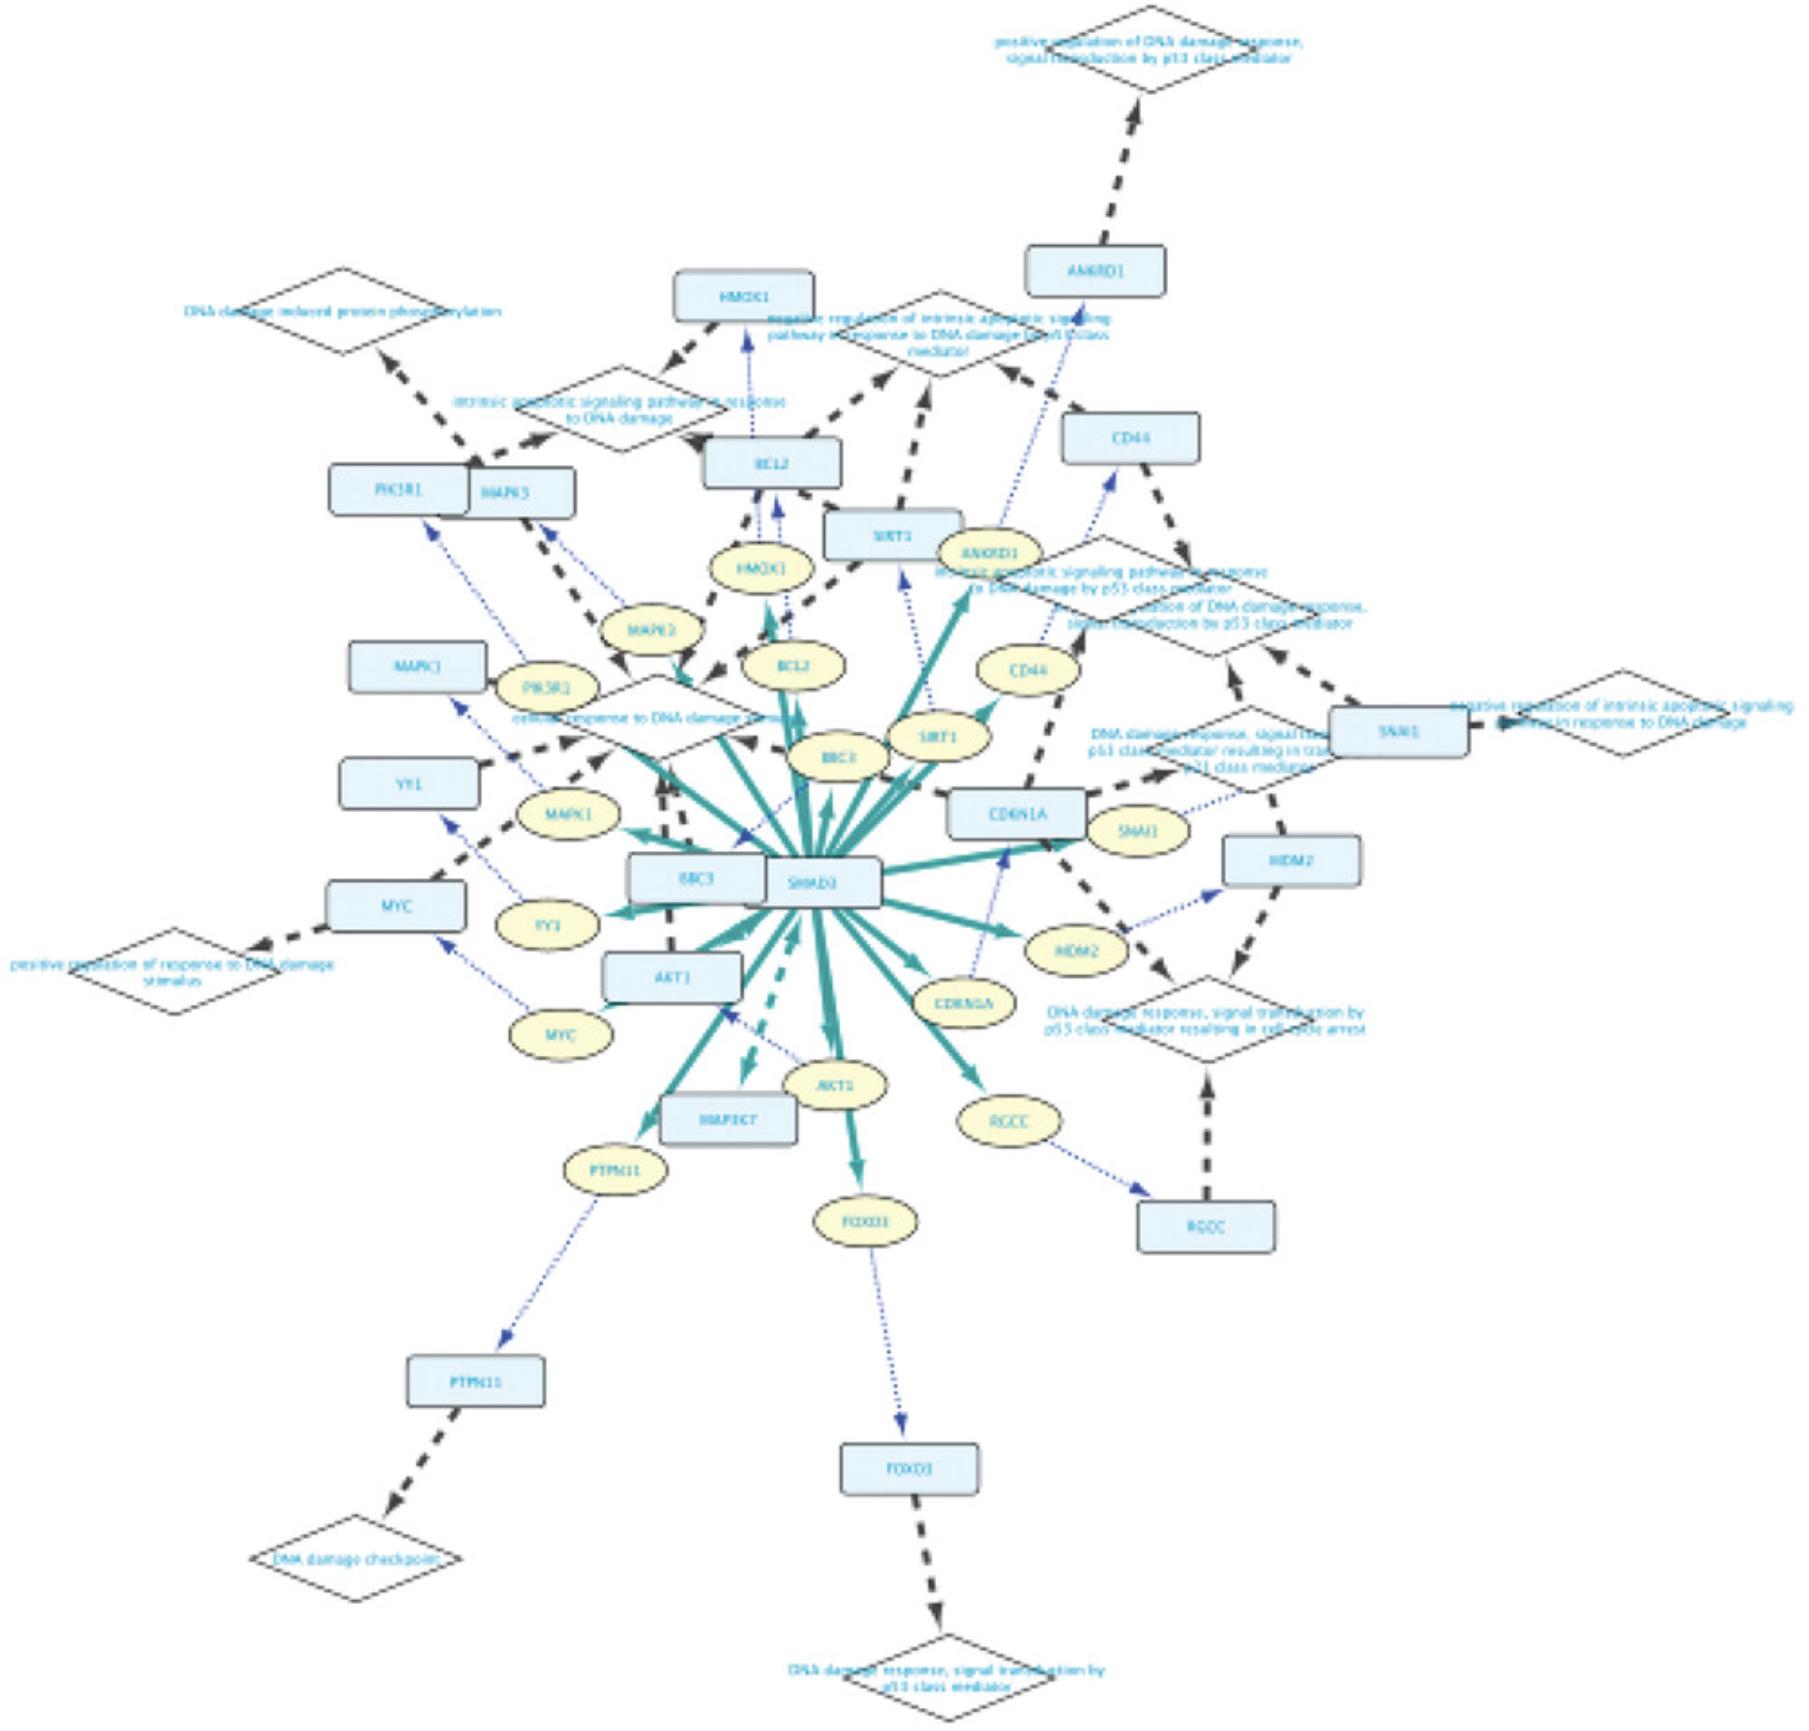
10.Click the Import selected nodes to new network button. Figure 23 displays the resulting network.
Support Protocol: INSTALLATION OF THE BIOGATEWAY PLUGIN THROUGH THE CYTOSCAPE APP MANAGER AND FROM SOURCE
This protocol will require a working installation of Cytoscape. The Cytoscape installer and instructions can be found at https://cytoscape.org/download.html. We will showcase how to install the BioGateway Cytoscape App by two different means. The first one, which we recommend, will demonstrate how to install the plugin through the Cytoscape built-in App Manager. The second one displays how to install the plugin from source, which can be useful if the users are not able to find the BioGateway Cytoscape App through the first option, or if they want to test a development version. More information for both alternative installations can be found at https://www.biogateway.eu/app/.
Installation through the Cytoscape App Manager
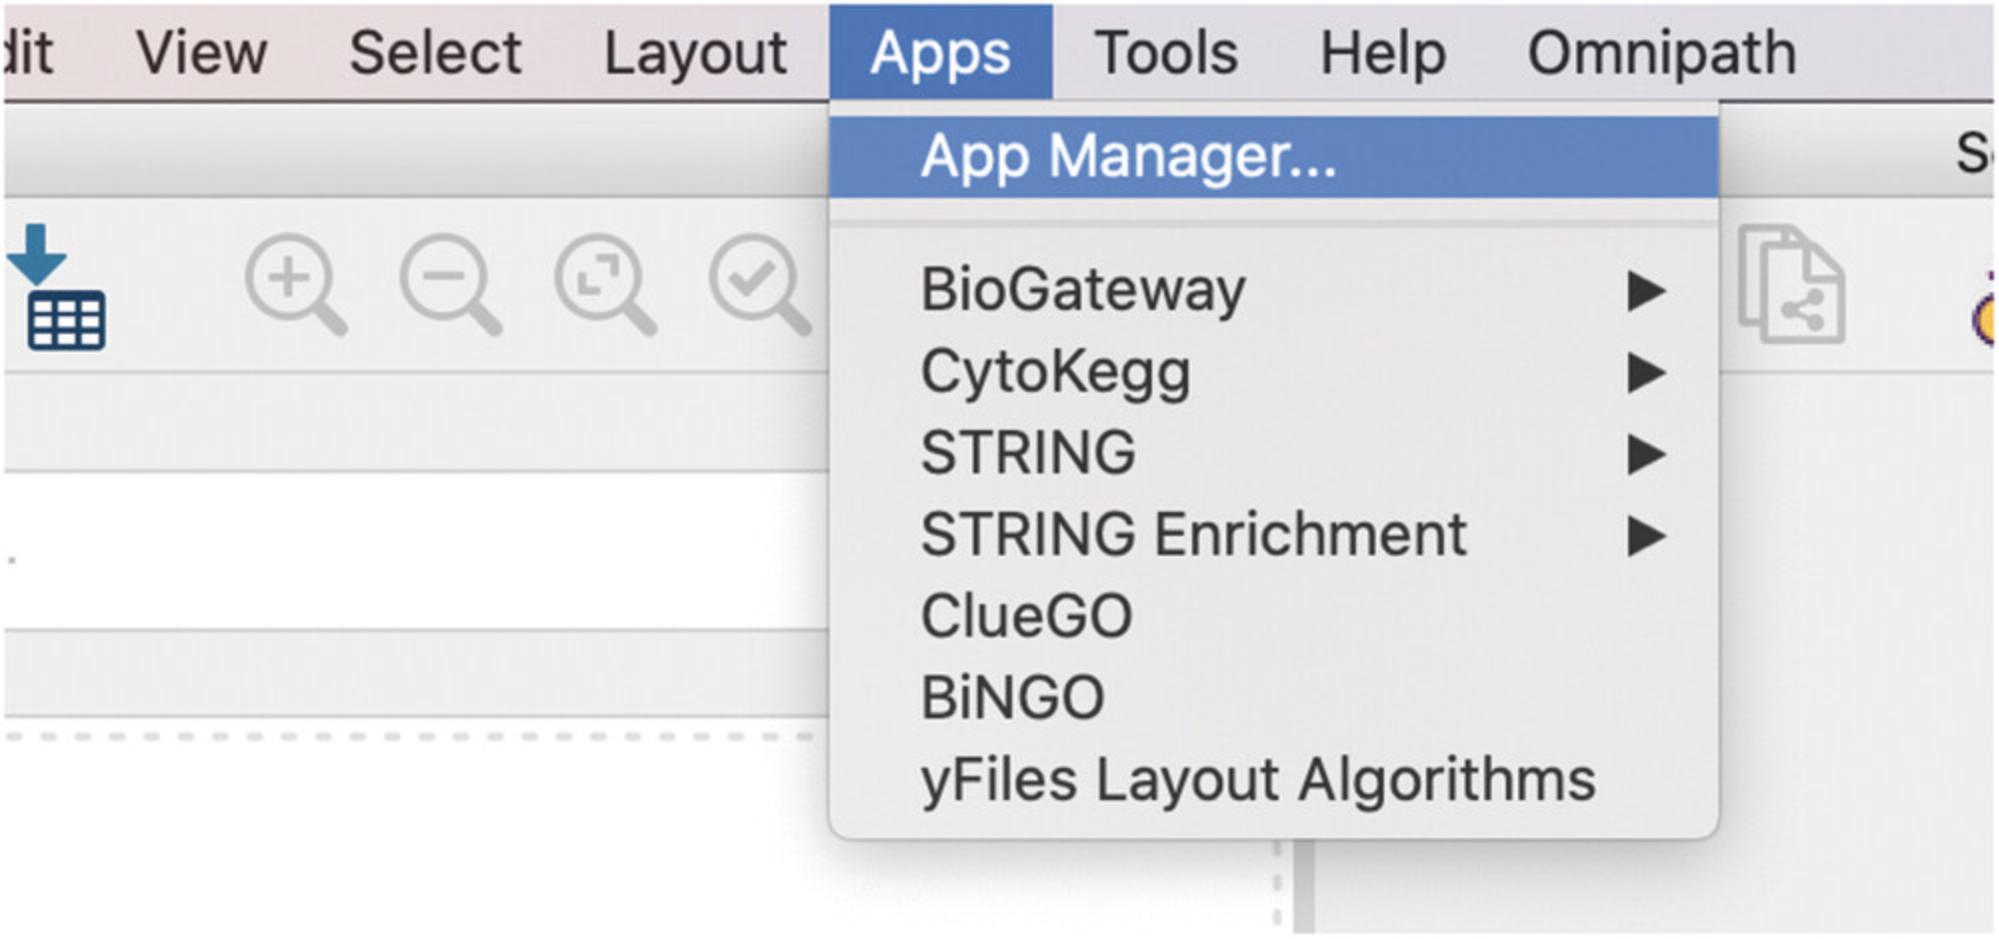
1.Open the Cytoscape App Manager by clicking on the Apps menu. Here, users will have to select the App Manager option (Fig. 24).
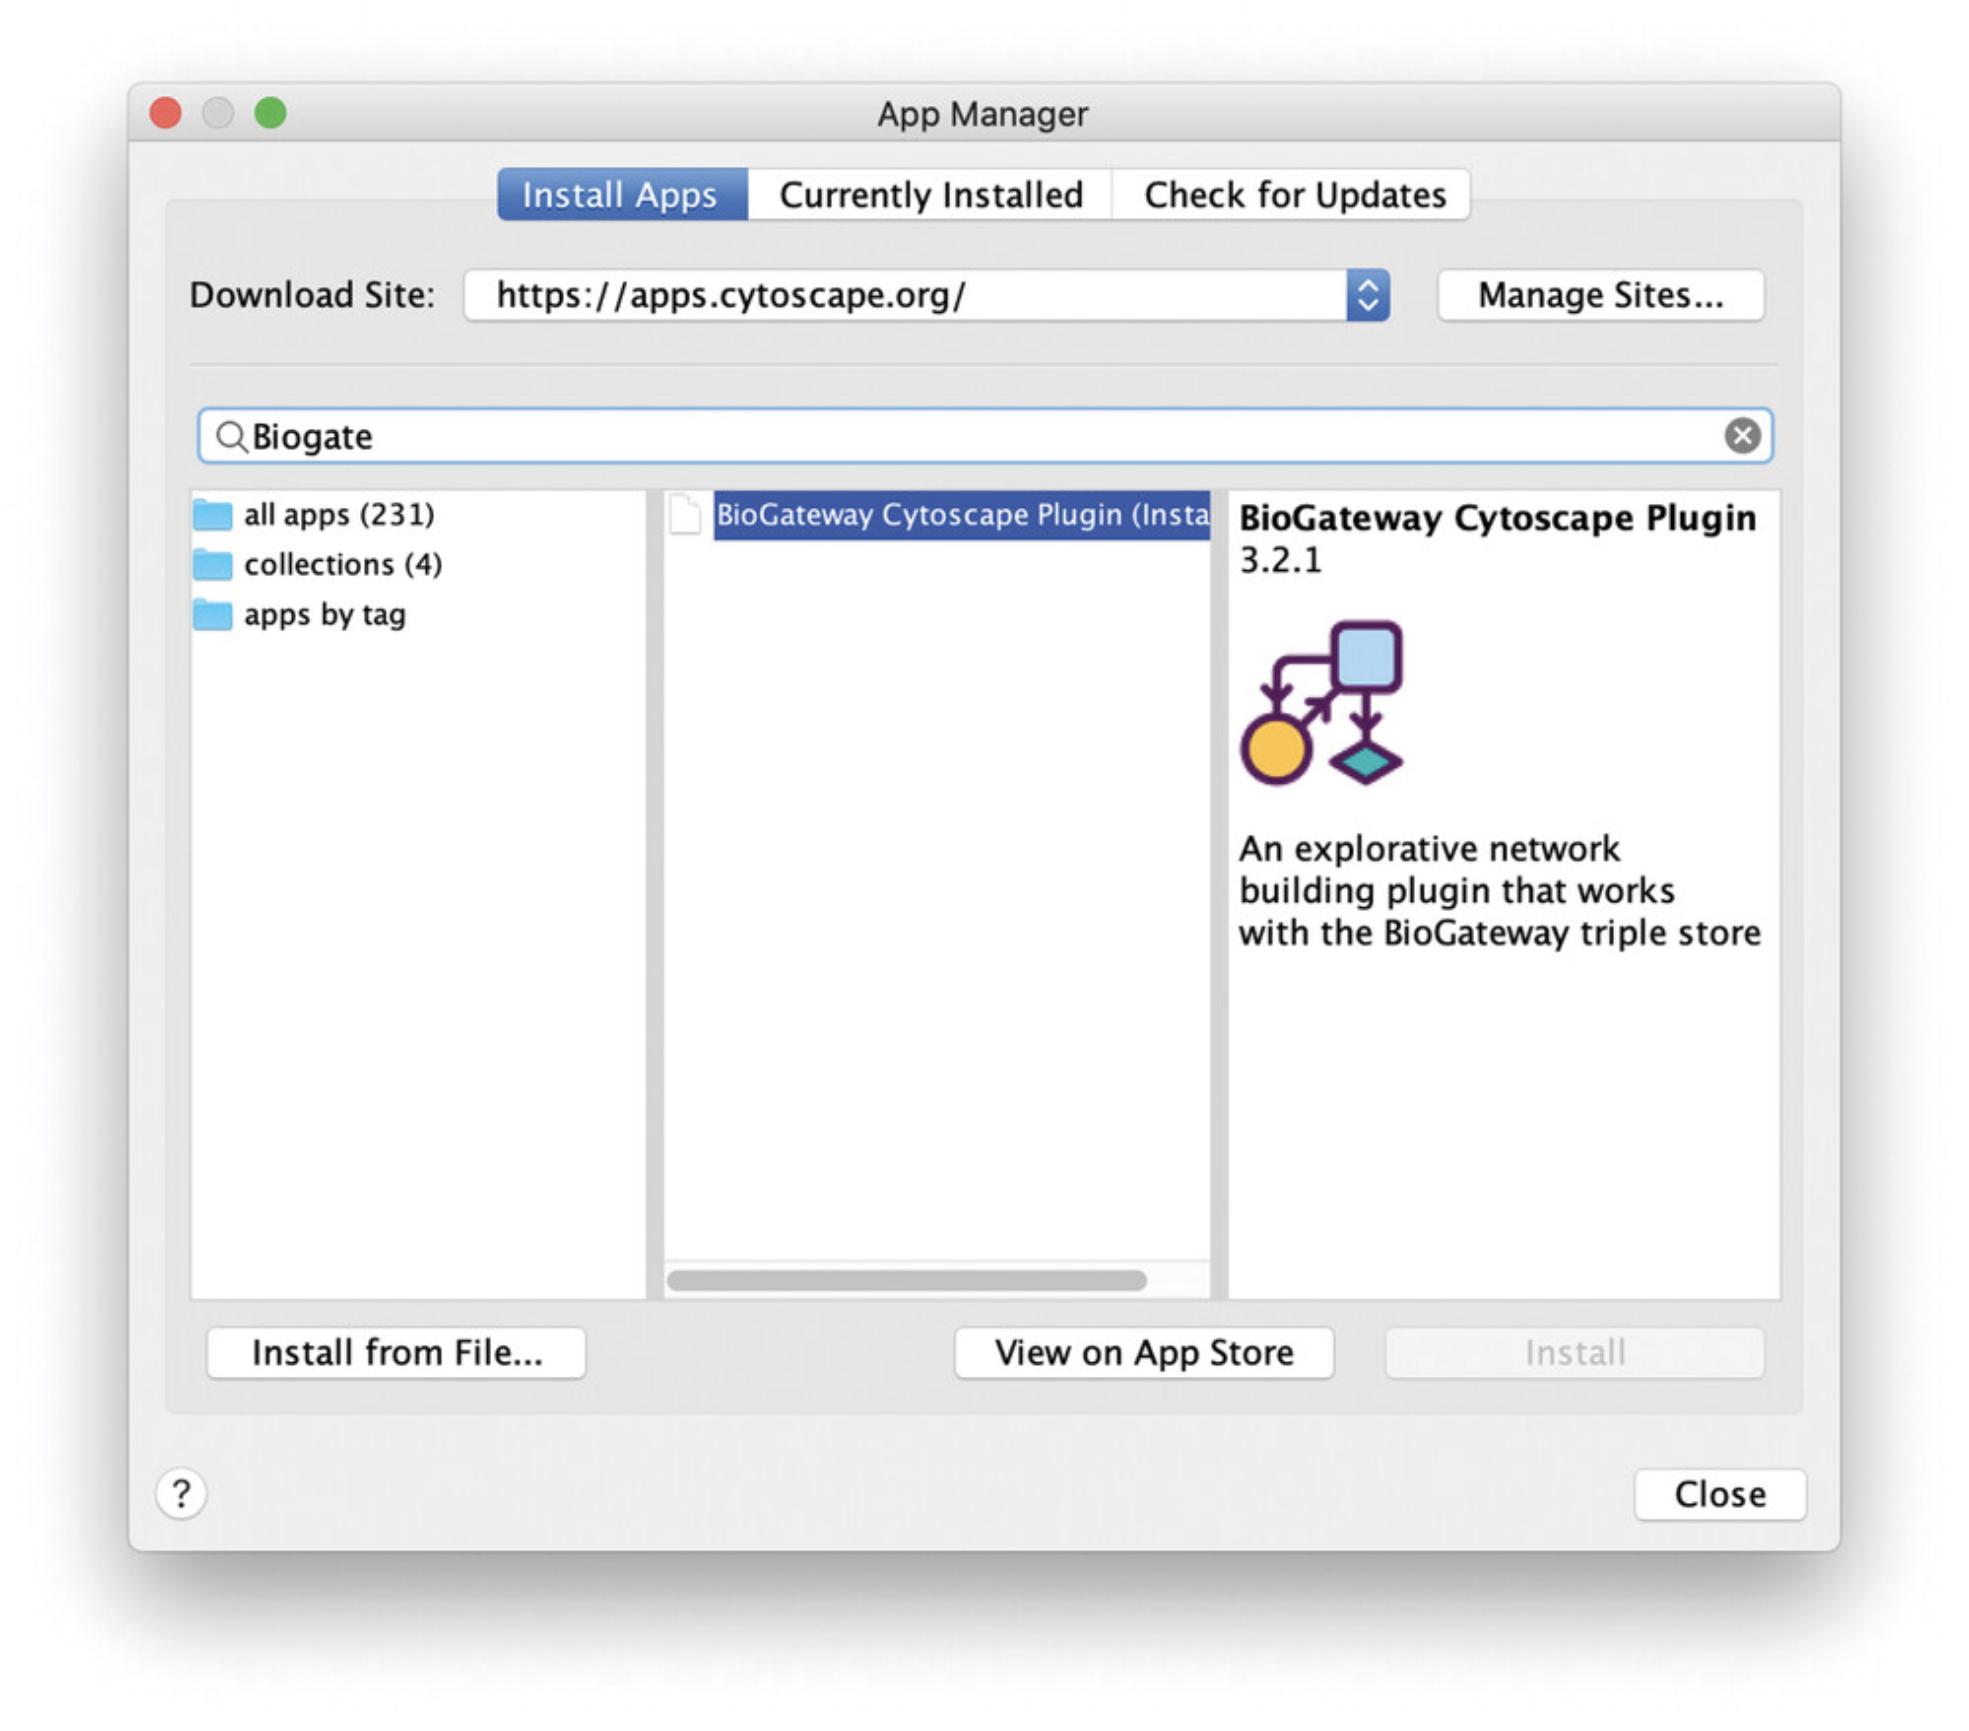
2.In the App Manager, under the Install Apps tab, type “Biogateway” in the search field.
3.Select the BioGateway Cytoscape plugin and click on the Install button (Fig. 25).
Installation from source
4.Download the BioGateway plugin source file from https://www.biogateway.eu/app/.
5.In Cytoscape, open the App Manager by clicking on the Apps menu.
6.In the App Manager, under the Install Apps tab, click on the button named Install from File …
7.In the new dialog, select the file downloaded in step 1.
COMMENTARY
Critical Parameters
The BioGateway Tab in the Cytoscape Control Panel contains all parameters that can be used to fine tune queries. To reproduce the protocols described here, users need to make sure that: (1) all the options under the Datasets tree are selected; (2) Homo sapiens is the only selected option under the Active Taxa tree; (3) only the options Protein: UniProt Accession and Protein: Annotation Score are selected under the Node Metadata Types tree; (4) no option is selected under the Query Constraints tree; and (5) all options are selected under the Sources tree.
Of course, all subfields of each of these settings could be activated by checking the main checkbox. However, the user should be careful with the subfields of the node and edge metadata, as the retrieval of those data during the query-building process may be very time consuming. It is advised to do queries without these subfields, and only import metadata as needed for a graph using the Reload Metadata button of the settings window.
Troubleshooting
Problem : When I open the Query Builder, I get the following message: “No datasets selected! Select one or more relation types for the datasets in the BioGateway tab of the Control Panel” (Fig. 26).

Solution : Open the BioGateway Tab in the Cytoscape Control Panel and select at least one of the options under the Datasets tree. To follow this protocol, select all of the available options.
Problem : When I launch a Query I get the following message: “The from/to field cannot be left blank when not using variables.” (Fig. 27).
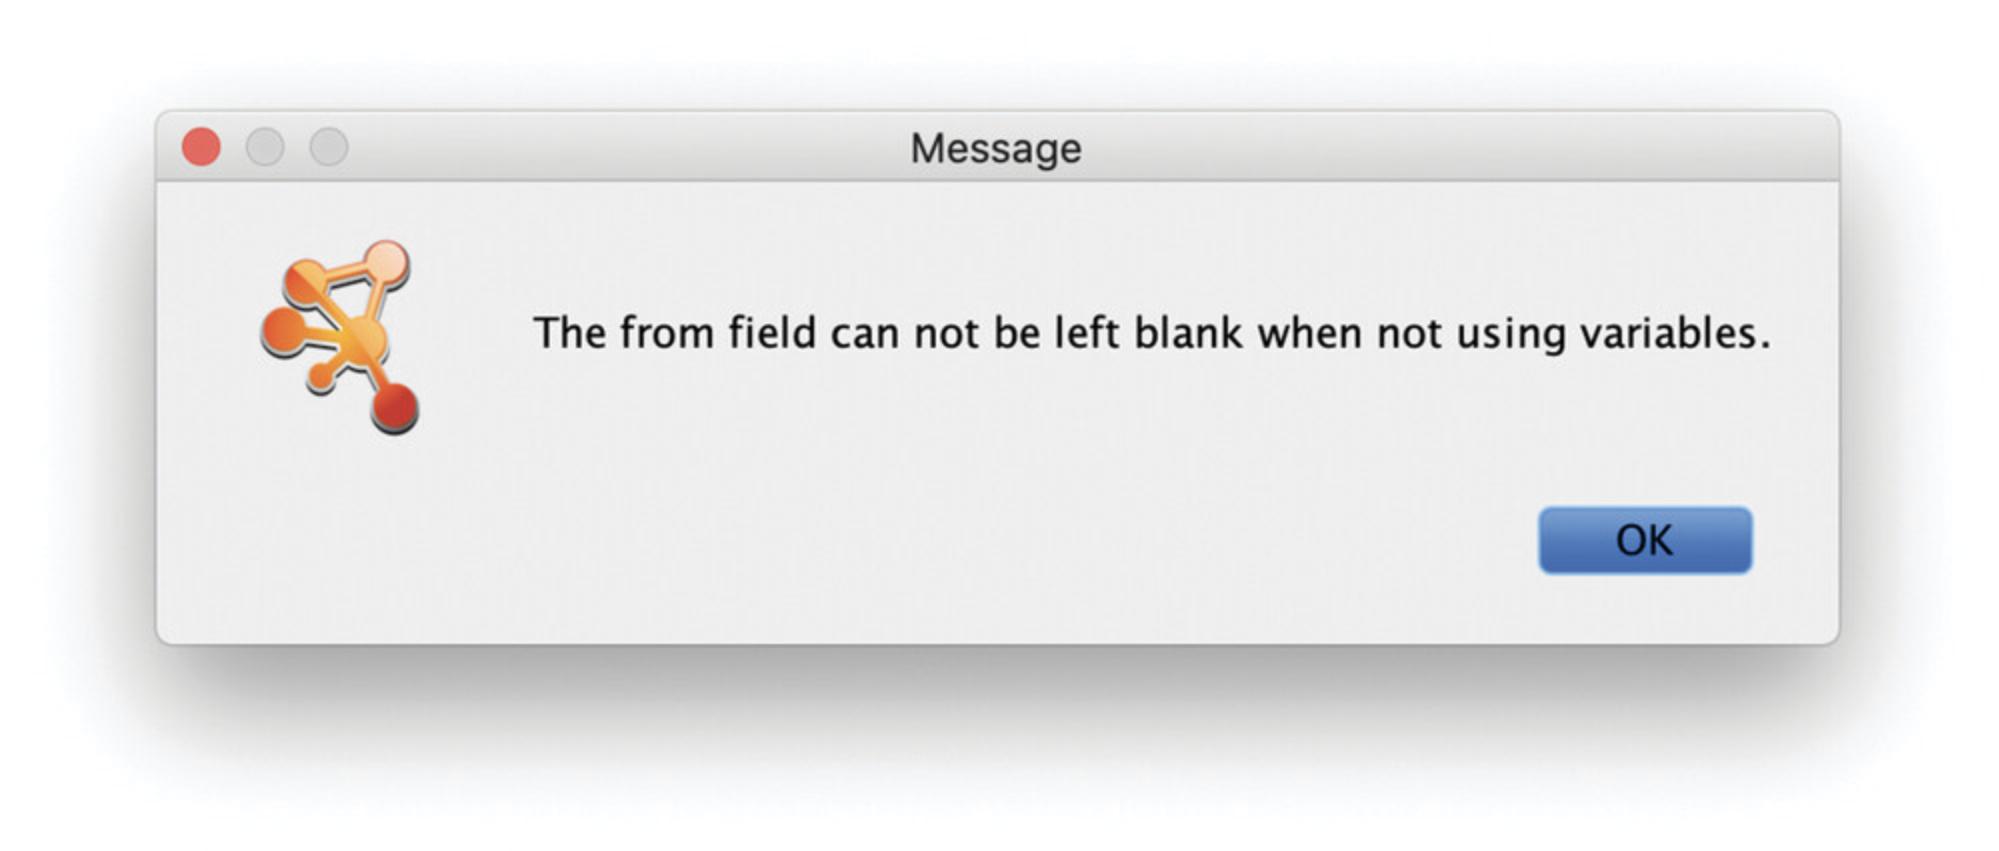
Solution : When querying for a specific entity, you have to specify a name; only for Sets can the name field remain empty.
Problem : The network does not show the same layout as the one I see in the figures.
Solution : Open the BioGateway Tab in the Cytoscape Control Panel and click the Reset Layout Style button. Next, open the Style Tab in the Cytoscape Control Panel and open the drop-down menu under Style. There, select BioGateway.
Problem : When I look for all proteins encoded by a gene, I get several nodes with the same name.
Solution : BioGateway uses the Gene name for all proteins encoded by that gene. The node attribute table displays the UniProtKB Accession for each individual protein as part of the BioGateway UIR (e.g., http://rdf.biogateway.eu/prot/9606/chr-7/BRAF/UPI000D1961A6; the bold part is the UniProtKB AC). Users can query UniProt with these accession numbers in order to find out more about this node so that they can expand on interesting proteins. In addition, the node table also contains a field for the UniProt Annotation Score, where higher scores indicate a more reliable annotation of the selected node.
Problem : Importing nodes into the network takes too much time and shows the message “Loading edge metadata.”
Solution : Open the BioGateway tab in the Cytoscape Control Panel. There, expand the “Edge Metadata Types” and “Node Metadata Types” trees and make sure that only the metadata types of interest are loaded. In general, the higher the number of selected metadata types, the longer it will take to load the nodes into the Network.
Time Considerations
Basic Protocol 1: 5 min.
Basic Protocol 2: 5-10 min.
Basic Protocol 3: 5-10 min.
Basic Protocol 4: 10 min.
Basic Protocol 5: 10 min.
Support Protocol: 5-10 min.
Author Contributions
Rafel Riudavets Puig : Methodology; validation; visualization; writing-original draft. Stian Holmås : Formal analysis; methodology; resources; software; validation; visualization. Vladimir Mironov : Data curation; investigation; methodology; resources; software; supervision; writing-review & editing. Martin Kuiper : Conceptualization; funding acquisition; methodology; project administration; supervision; validation; writing-original draft.
Acknowledgments
We are grateful for the help of Miguel Vazquez in building an RDF graph from many different resources with currently available relationships between mammalian transcription factors and their target genes (the tfact2gene graph).
Literature Cited
- Aranda, B., Blankenburg, H., Kerrien, S., Brinkman, F. S., Ceol, A., Chautard, E., … Gaulton, A. (2011). PSICQUIC and PSISCORE: Accessing and scoring molecular interactions. Nature Methods , 8(7), 528–529. doi: 10.1038/nmeth.1637.
- Ashburner, M., Ball, C. A., Blake, J. A., Botstein, D., Butler, H., Cherry, J. M., … Sherlock, G. (2000). Gene ontology: Tool for the unification of biology. The Gene Ontology Consortium. Nature Genetics , 25(1), 25–29. doi: 10.1038/75556.
- Bovolenta, L. A., Acencio, M. L., & Lemke, N. (2012). HTRIdb: An open-access database for experimentally verified human transcriptional regulation interactions. BMC Genomics , 13, 405. doi: 10.1186/1471-2164-13-405.
- Carrasco Pro, S., Dafonte Imedio, A., Santoso, C. S., Gan, K. A., Sewell, J. A., Martinez, M., … Fuxman Bass, J. I. (2018). Global landscape of mouse and human cytokine transcriptional regulation. Nucleic Acids Research , 46(18), 9321–9337. doi: 10.1093/nar/gky787.
- Essaghir, A., Toffalini, F., Knoops, L., Kallin, A., van Helden, J., & Demoulin, J.-B. (2010). Transcription factor regulation can be accurately predicted from the presence of target gene signatures in microarray gene expression data. Nucleic Acids Research , 38(11), e120. doi: 10.1093/nar/gkq149.
- Federhen, S. (2012). The NCBI Taxonomy database. Nucleic Acids Research , 40(Database issue), D136–D143. doi: 10.1093/nar/gkr1178.
- Hamosh, A., Scott, A. F., Amberger, J. S., Bocchini, C. A., & McKusick, V. A. (2005). Online Mendelian Inheritance in Man (OMIM), a knowledgebase of human genes and genetic disorders. Nucleic Acids Research , 33(Database issue), D514–D517. doi: 10.1093/nar/gki033.
- Han, H., Cho, J.-W., Lee, S., Yun, A., Kim, H., Bae, D., … Lee, I. (2018). TRRUST v2: An expanded reference database of human and mouse transcriptional regulatory interactions. Nucleic Acids Research , 46(D1), D380–D386. doi: 10.1093/nar/gkx1013.
- Holmås, S., Puig, R. R., Acencio, M. L., Mironov, V., & Kuiper, M. (2019). The Cytoscape BioGateway App: Explorative network building from the BioGateway triple store. Bioinformatics , 2019, btz835. doi: 10.1093/bioinformatics/btz835.
- Huang, T., Huang, X., Shi, B., & Yao, M. (2019). GEREDB: Gene expression regulation database curated by mining abstracts from literature. Journal of Bioinformatics and Computational Biology , 17(4), 1950024. doi: 10.1142/S0219720019500240.
- Licata, L., Lo Surdo, P., Iannuccelli, M., Palma, A., Micarelli, E., Perfetto, L., … Cesareni, G. (2020). SIGNOR 2.0, the SIGnaling Network Open Resource 2.0: 2019 update. Nucleic Acids Research , 48(D1), D504–D510.
- Orchard, S., Ammari, M., Aranda, B., Breuza, L., Briganti, L., Broackes-Carter, F., … Hermjakob, H. (2014). The MIntAct project–IntAct as a common curation platform for 11 molecular interaction databases. Nucleic Acids Research , 42(Database issue), D358–D363. doi: 10.1093/nar/gkt1115.
- Prud'hommeaux, E., & Seaborne, A. (2008). SPARQL query language for RDF. Retrieved from http://www.w3.org/TR/rdf-sparql-query/.
- Shannon, P., Markiel, A., Ozier, O., Baliga, N. S., Wang, J. T., Ramage, D., … Ideker, T. (2003). Cytoscape: A software environment for integrated models of biomolecular interaction networks. Genome Research , 13(11), 2498–2504. doi: 10.1101/gr.1239303.
- The Gene Ontology Consortium, & The Gene Ontology Consortium. (2019). The Gene Ontology Resource: 20 years and still GOing strong. Nucleic Acids Research , 47(Issue D1), D330–D338. doi: 10.1093/nar/gky1055.
- UniProt Consortium. (2019). UniProt: A worldwide hub of protein knowledge. Nucleic Acids Research , 47(D1), D506–D515.
Internet Resources
The website for the BioGateway Cytoscape app.
The Cytoscape homepage.
Citing Literature
Number of times cited according to CrossRef: 4
- Yucheng Zhong, Jun Zhao, Hao Deng, Yaqin Wu, Li Zhu, Meiqiong Yang, Qianru Liu, Guoqun Luo, Wenmin Ma, Huan Li, Integrative bioinformatics analysis to identify novel biomarkers associated with non-obstructive azoospermia, Frontiers in Immunology, 10.3389/fimmu.2023.1088261, 14 , (2023).
- Qianqian Zhao, Yongliang Tang, Luyu Zhang, Na Sun, Qiling Liu, Rongqiang Zhang, Biological Functions of Selenoprotein Glutathione Peroxidases (GPXs) and their Expression in Osteoarthritis, Journal of Inflammation Research, 10.2147/JIR.S388934, Volume 16 , (183-196), (2023).
- Yucheng Zhong, Xiaoqing Chen, Jun Zhao, Hao Deng, Xiaohang Li, Zhongju Xie, Bingyu Zhou, Zhuojie Xian, Xiaoqin Li, Guoqun Luo, Huan Li, Integrative analyses of potential biomarkers and pathways for non-obstructive azoospermia, Frontiers in Genetics, 10.3389/fgene.2022.988047, 13 , (2022).
- Yan Li, Hui Shi, Zhenjun Zhao, Minghui Xu, Identification of castration-dependent and -independent driver genes and pathways in castration-resistant prostate cancer (CRPC), BMC Urology, 10.1186/s12894-022-01113-5, 22 , 1, (2022).

