Loading and Execution of Automatic Watering and Weighing
Magdalena M Julkowska, Hayley Sussman, Olga Khmelnitsky
Abstract
This is part of a bigger phenotyping project at the Julkowska lab in Boyce Thompson Institute in Ithaca,NY.
Steps
Loading the Experiment
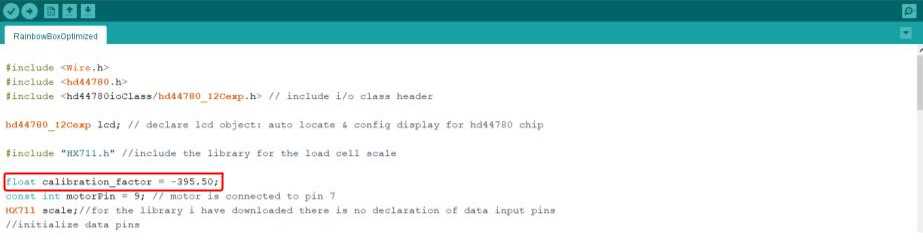
Download the AAWsmobox.ino code from GitHub (insert link here) to a location in your computer that is easy to access with all other Arduino codes that you will be using.
Open Arduino IDE and open AAWsmobox.ino
After completing the calibration protocol, take note of the final calibration factor. Type in that calibration factor here:
Calculate the reference weight (REF) for each pot in the experiment
Begin by filling 4 X 4 pots with soil. Air dry soil for 2 days to obtain the reference for 0% water holding capacity (WHC)
Load the pots into a tray. Fill the tray with about an inch of water and water pots from the top (making sure not to lose any soil in the process). Check back in a couple of hours to add extra water if necessary. Let pots soak for a few hours, adding water as needed to obtain a reference for 100% WHC.
Subtract the values for 100% WHC and 0% WHC to get the max water held by the soil.
Divide by 100 to get the value representing the grams of water necessary to increase the WHC by 1%
Multiply the value calculated in Step 4.4 by the percentage WHC you are trying to achieve. For instance, if you got a value of 2 grams of water for step 4.4. And you are trying to achieve a WHC of 10% multiple 2 grams by 10 to get 20 grams of water needed to get the pot to 10% WHC. Therefore, during your experiment you will water the pot to its 0% WHC PLUS 20 grams.
In simplified terms the equation reads:
((100%WHC - 0%WHC)/100) * Experimental WHC(%))
You will have to calculate this for every pot.
#尊敬的用户,由于网络监管政策的限制,部分内容暂时无法在本网站直接浏览。我们已经为您准备了相关原始数据和链接,感谢您的理解与支持。https://lh6.googleusercontent.com/iDiJnC_tWPcbKt40HLjM8bS56mCS4n1GN3-uqmxpGBtMdGM1IvIDqd2OirYWg8f05EFWUzTB07jKhZuPQHdqw5vbSVVSZZfsxaljsV9GMy7D6-5akMnSUNS1HBRpFzfLqPH033wMF6WUnmFkYON72FyVZ6ybhIZAlv26obJeruo-e59qEBk-kDvRDlFAdwOnce the REF weights and calibration code are inputted, make sure to Verify the code. If successful, upload the code to the Arduino via USB cable. Wait until the bottom terminal reads 'Done uploading'
Connecting to Data Streamer
Open Microsoft Excel and select the 'Data Streamer' tab.
Select 'Connect a Device'. A drop-down menu will appear and the COM port where your Arduino is plugged in should say 'Arduino UNO' next to it
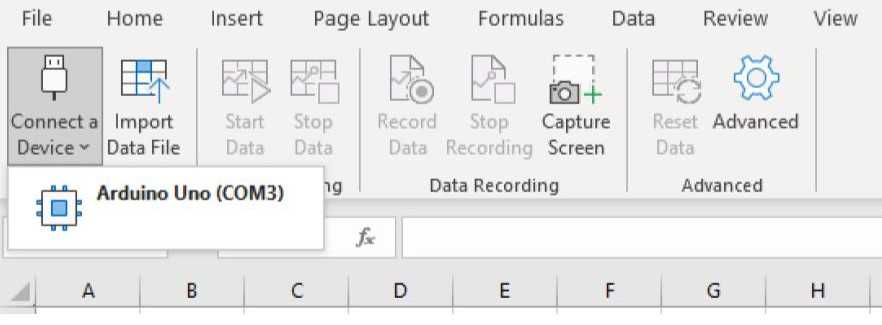
Select the correct COM port. Once you select the COM port the Excel sheet will automatically reformat for data collection. At this point your screen will look something like this:

Before you press the button on the Arduino to start measurements remember to change the settings in the Data Streamer to increase the number of rows. You can do this by going to the 'Settings' tab at the bottom of the screen and manually changing the number of rows. It is CRITICAL that you do this before data entries come in because once you change it, it will restart the data collection and start from scratch.

Executing the Experiment
After the Data Streamer is properly set up and connected, load your first pot onto the scale, press the pushbutton, and begin measurements.
During the experiment keep a secondary smaller container to help you refill the water tank when water runs low. Also, ensure a dry and clean area around all wiring and the box.
If water seeps into the secondary basin make sure to add it back to the pot and dry off the saucer so as to not affect the accuracy of the scale.
