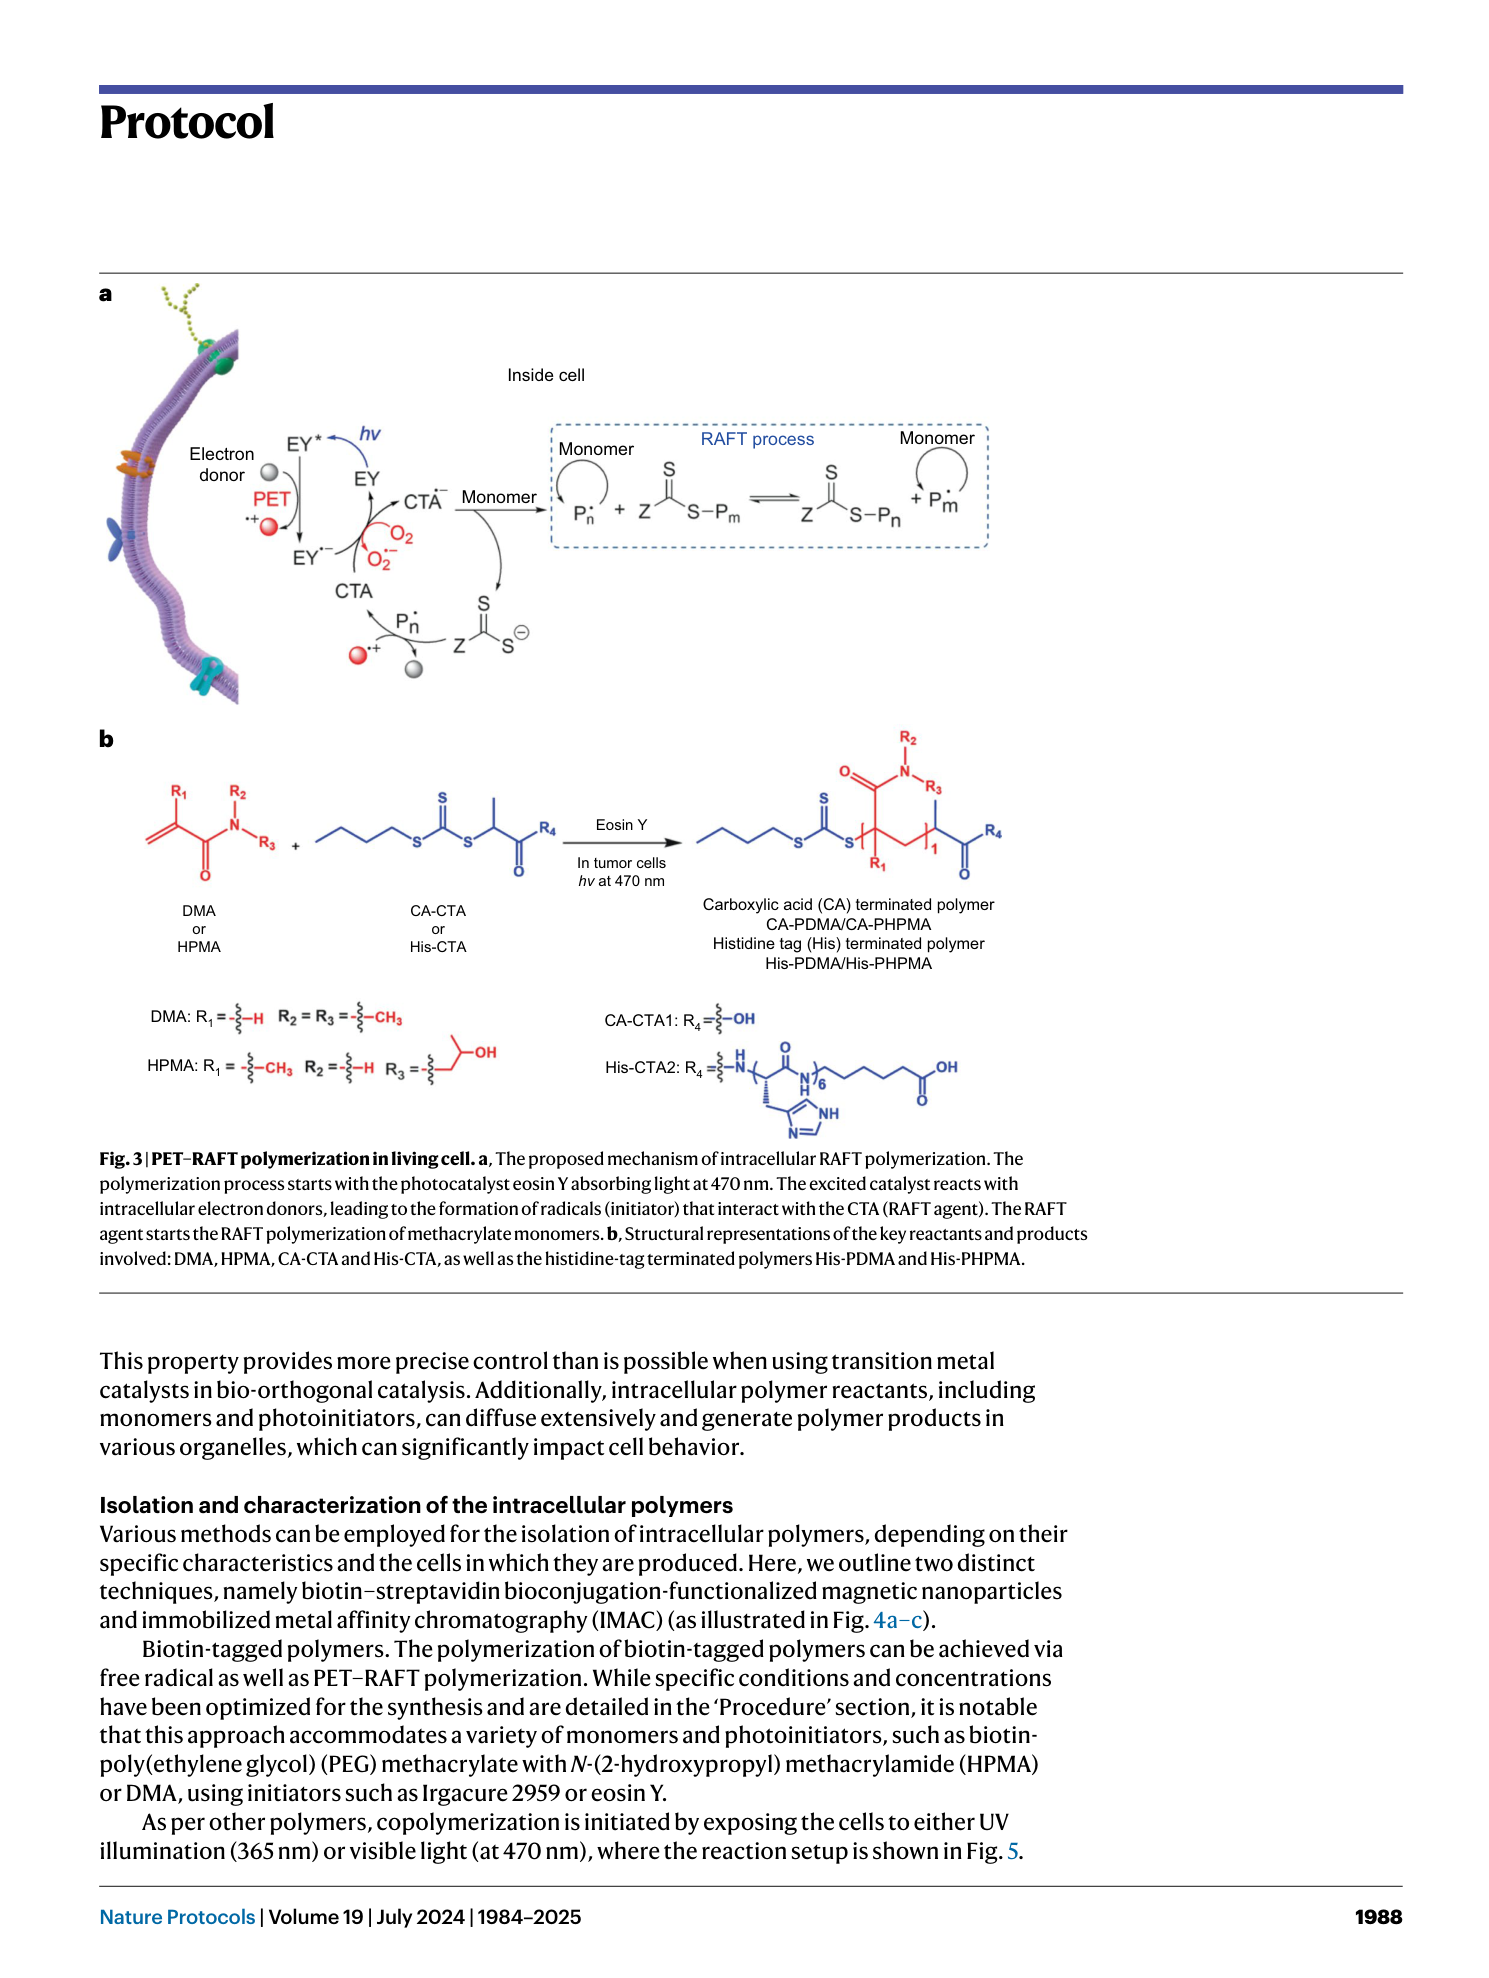
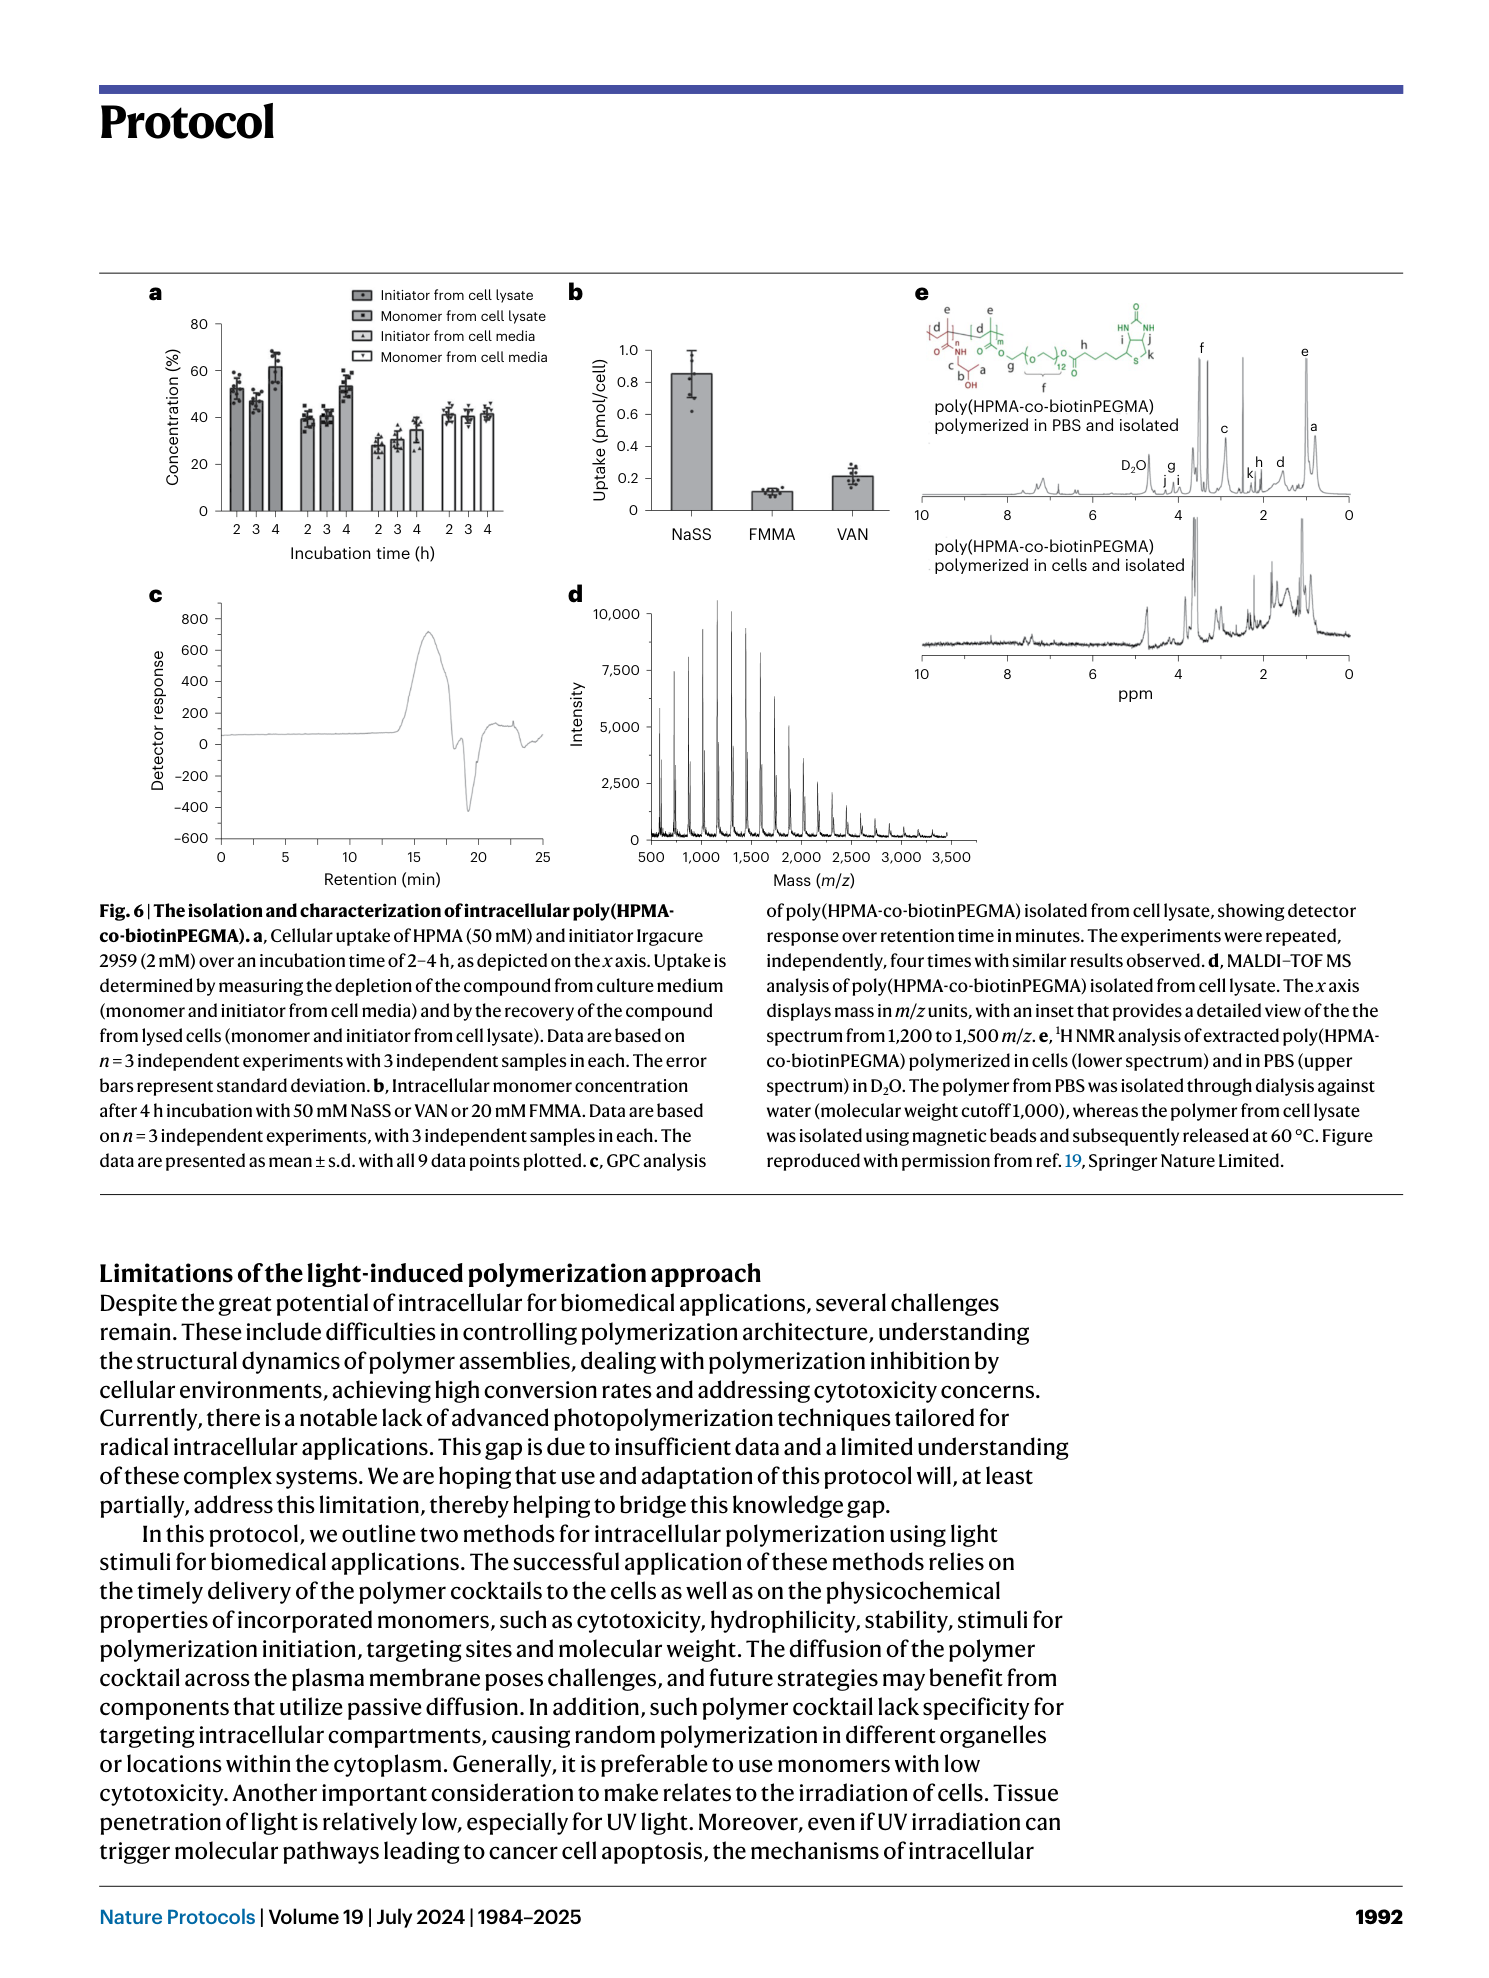
Light-mediated intracellular polymerization
Mohamed Abdelrahim, Quan Gao, Yichuan Zhang, Weishuo Li, Qi Xing, Mark Bradley, Jin Geng
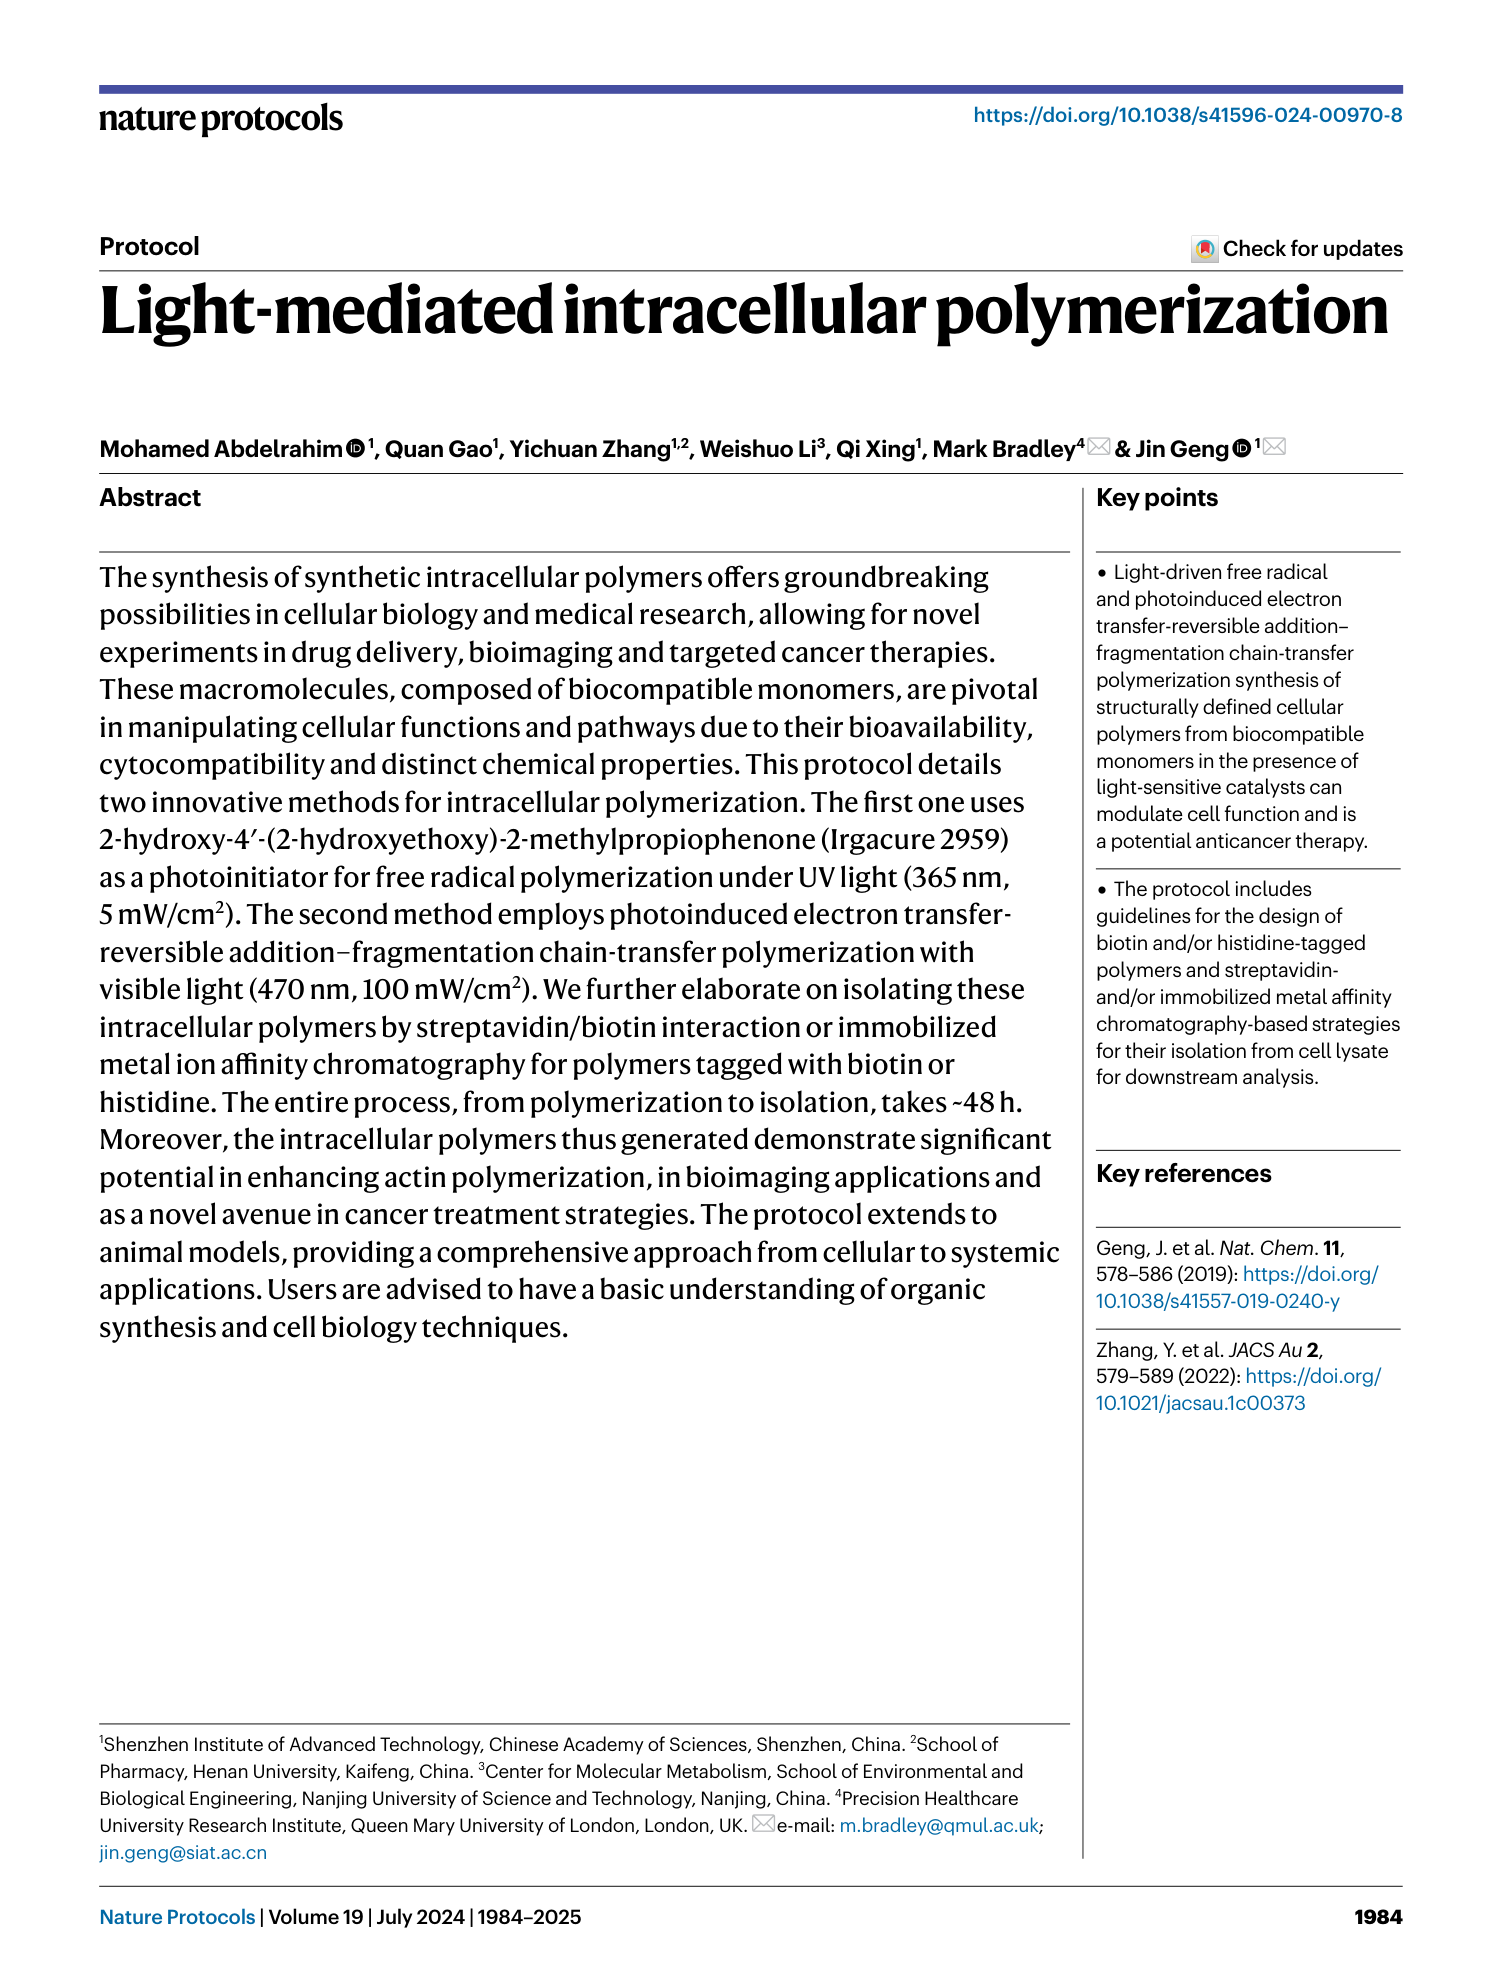
intracellular polymerization
light-mediated synthesis
biocompatible monomers
photoinduced electron transfer
anticancer therapy
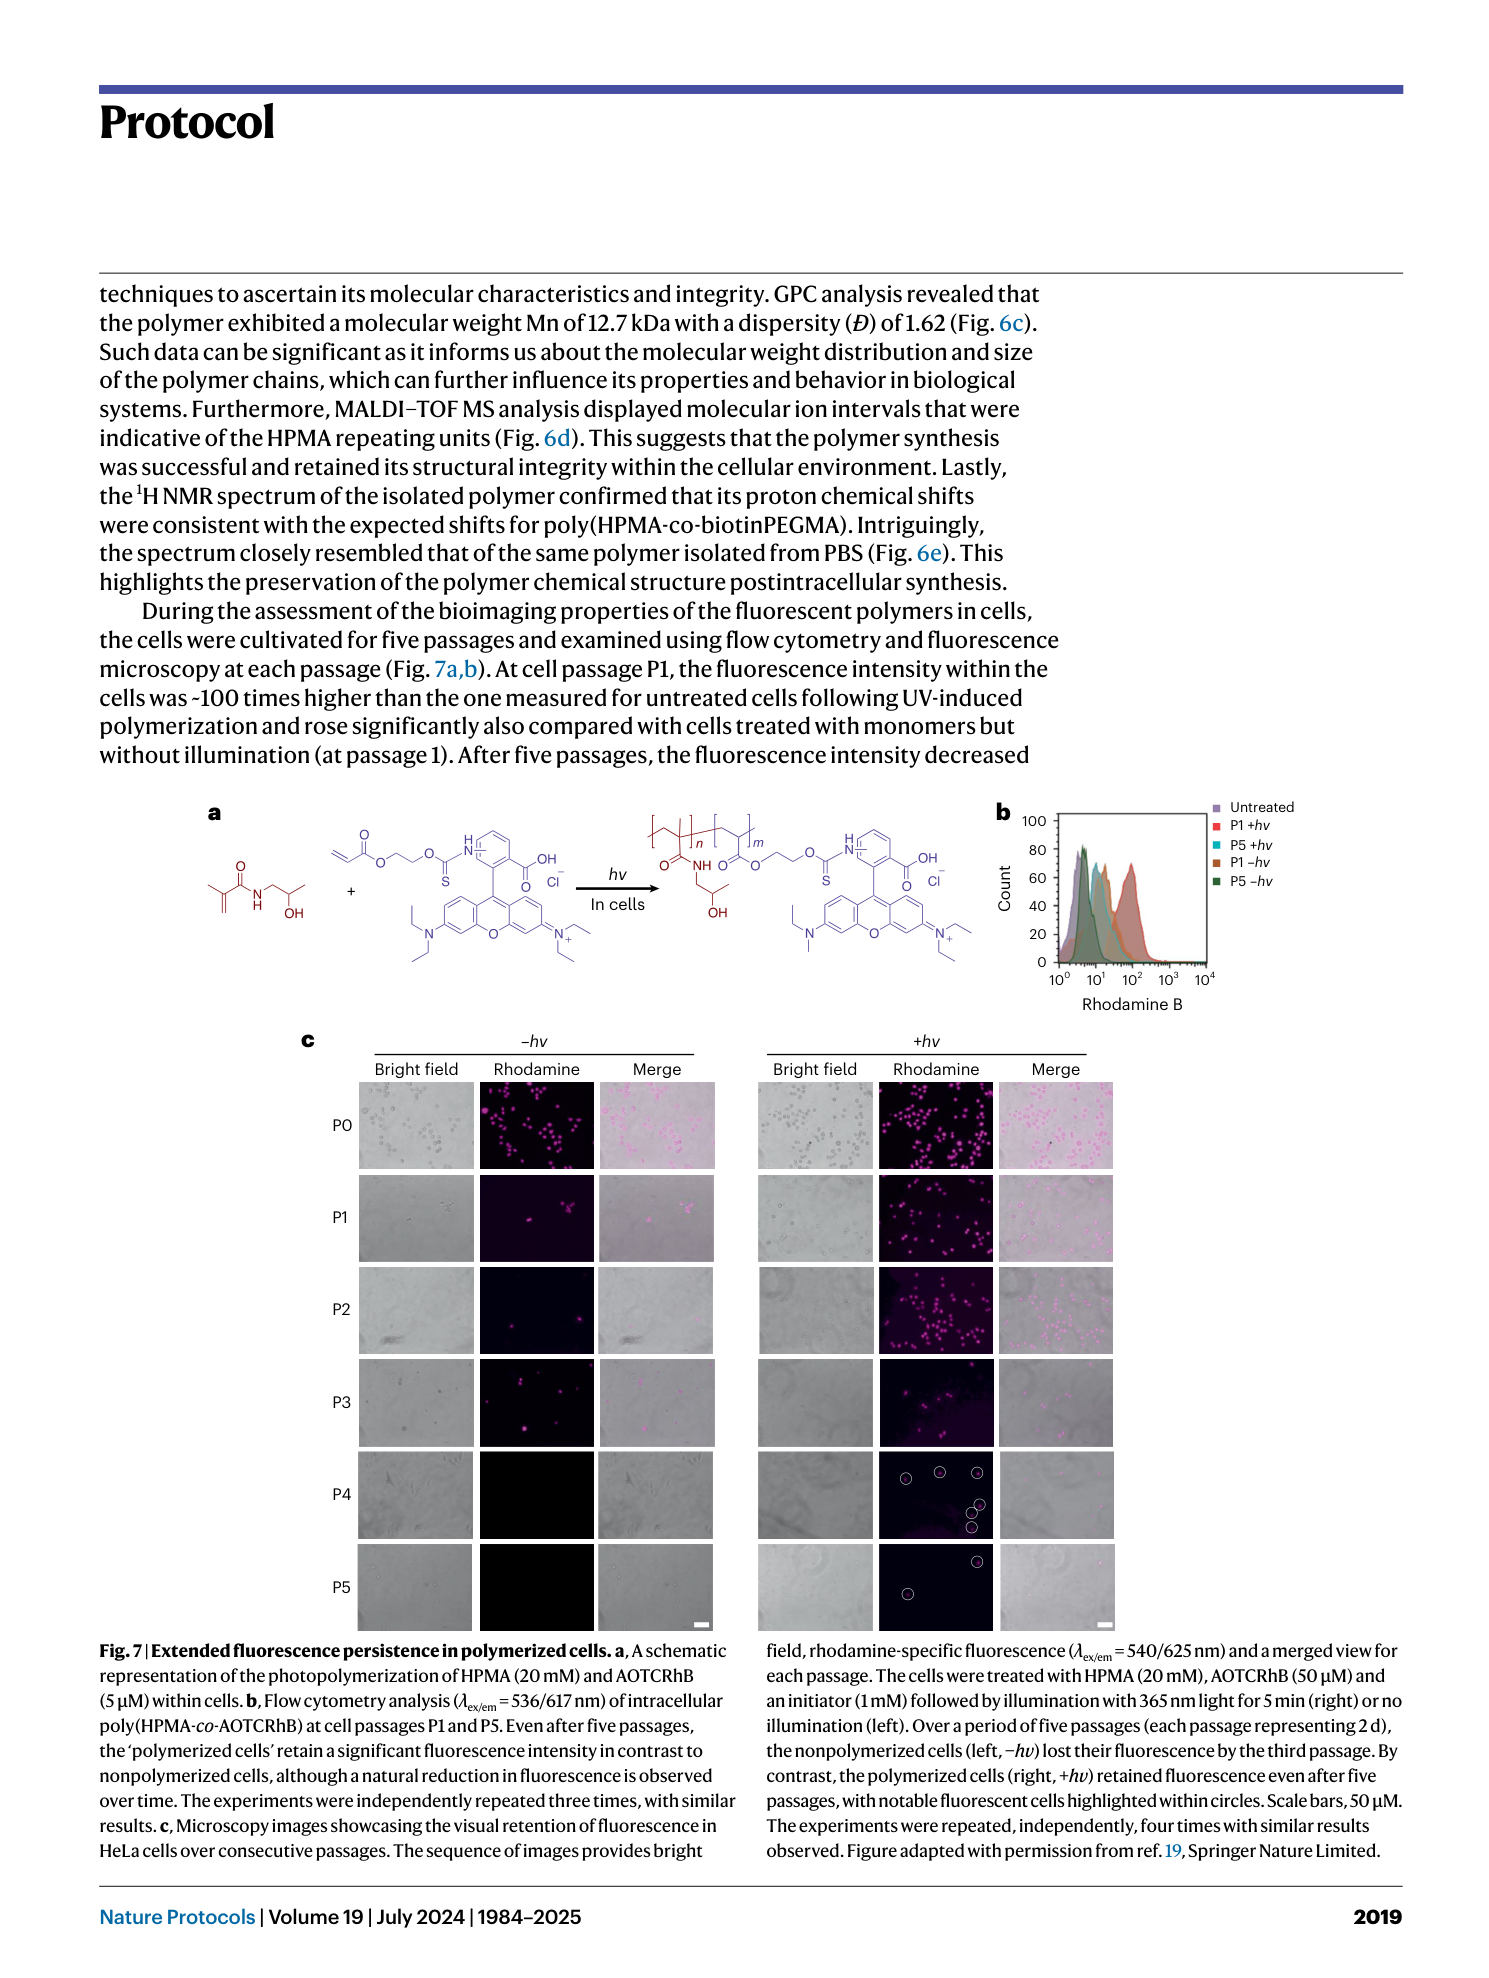


Extended
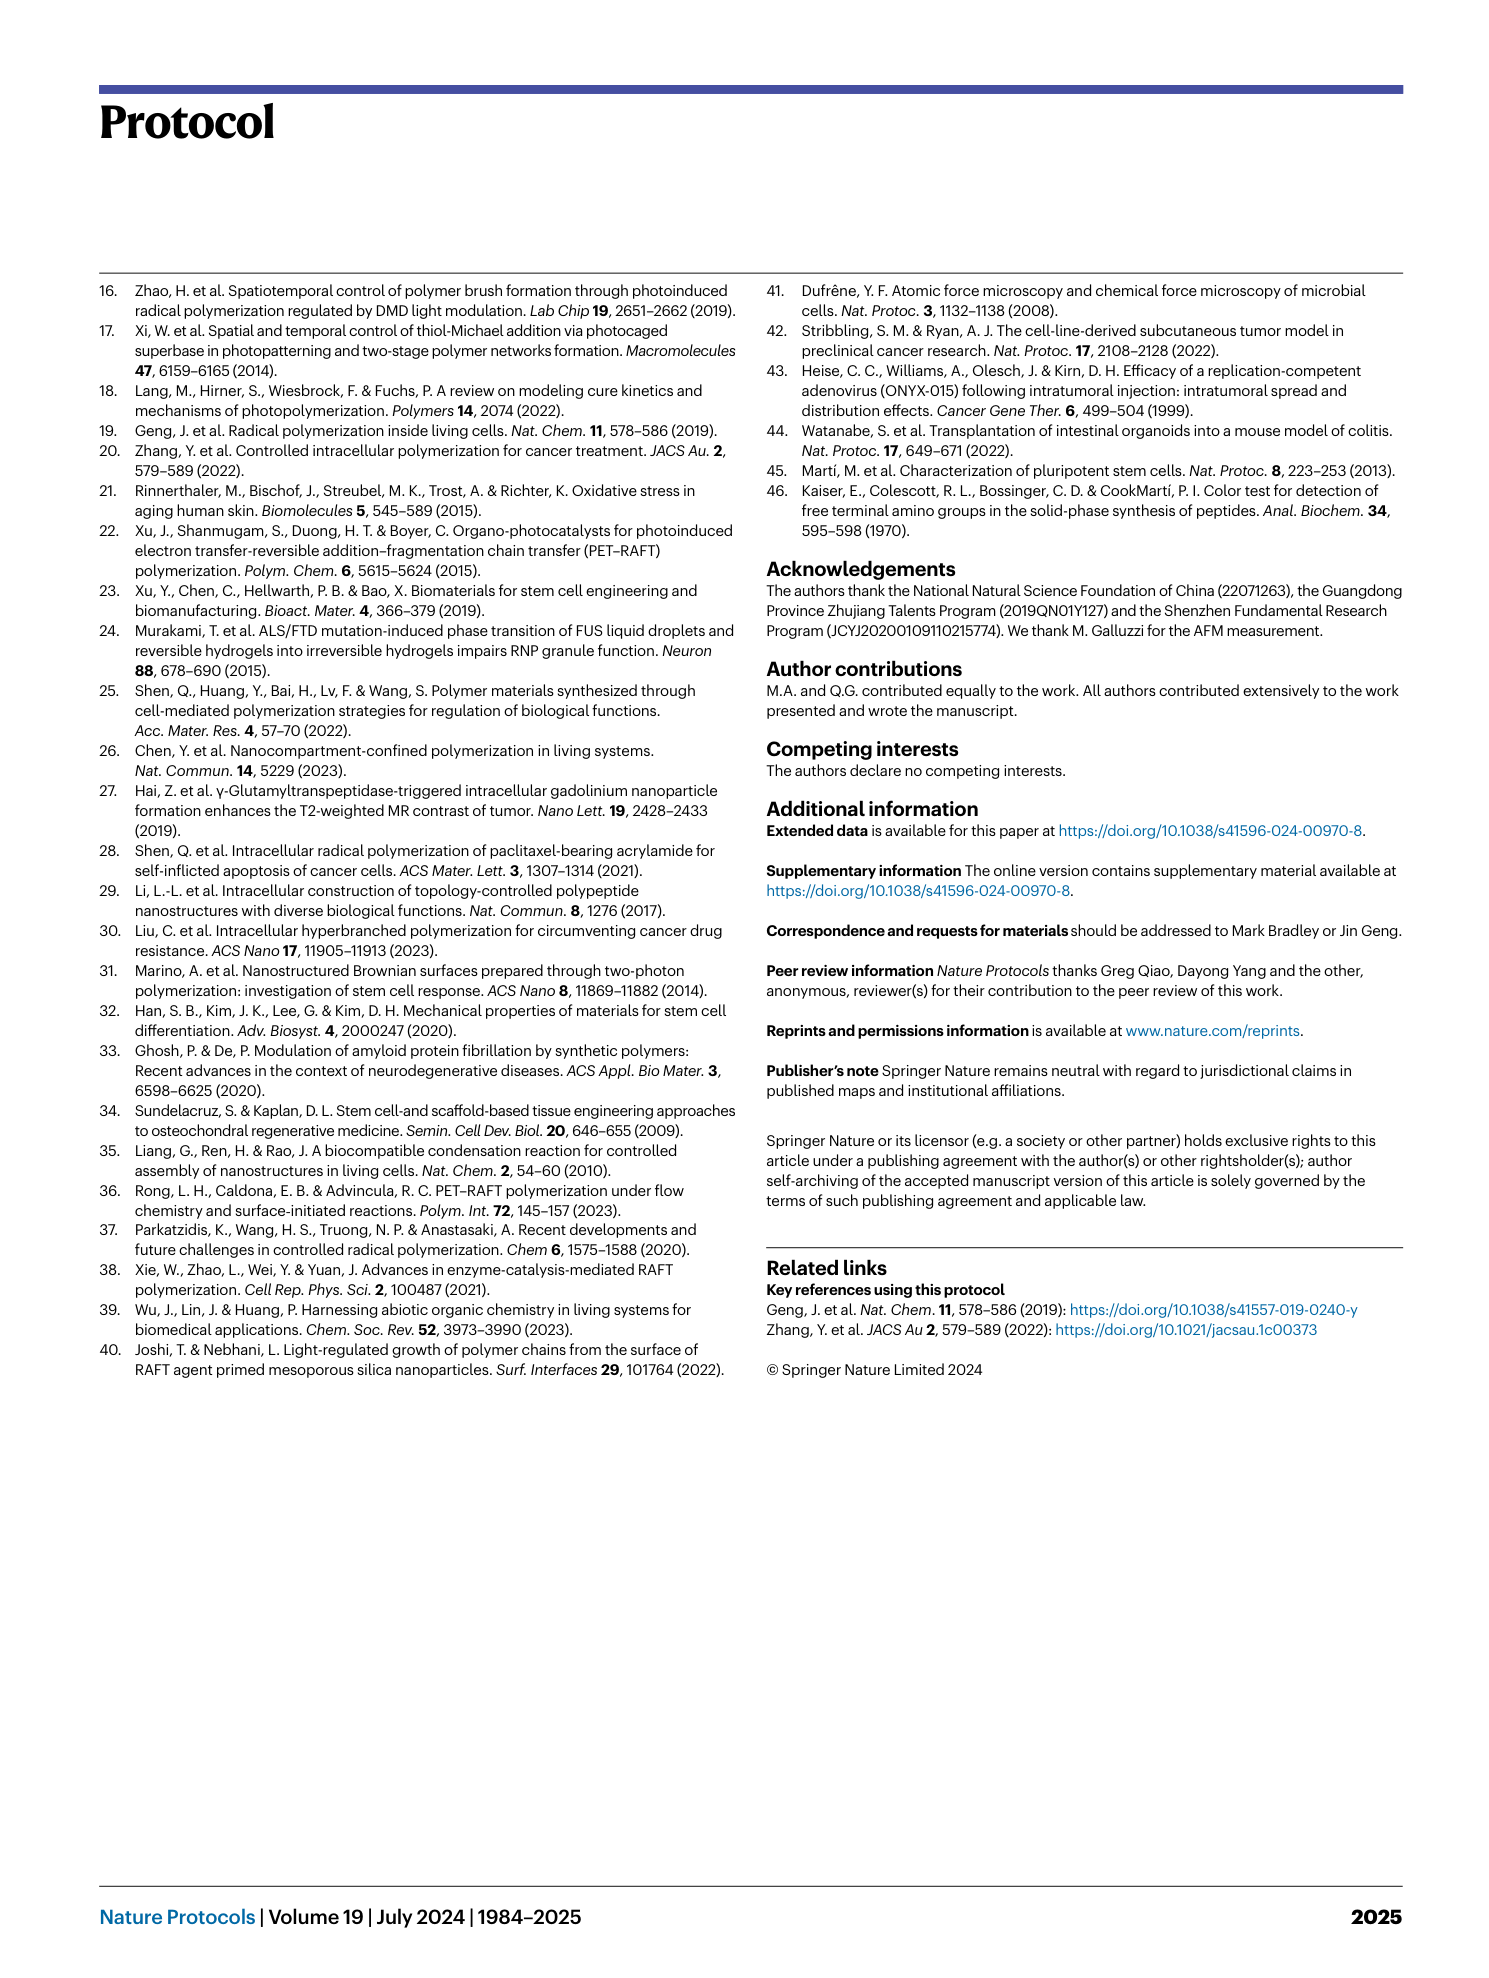
Extended Data Fig. 1 Concentration calibrations of DMA, HPMA, CA-CTA, and Eosin Y and 1 H NMR of isolated polymer.
a , UV-vis spectral representation of DMA at concentrations of 1, 5, 10, 20, and 50 mM. b , UV-vis spectra showcasing HPMA at concentrations of 2, 5, 10, 20, and 50 mM. c , UV-vis spectra of CA-CTA at concentrations of 0.02, 0.1, 0.2, 0.5, and 1.0 mM. d , UV-vis spectral plots of Eosin Y at concentrations of 0.002, 0.01, 0.02, 0.05, and 0.1 mM. e , The graphical depiction of cellular uptake data. This data was quantified utilizing UV-vis spectroscopy. f , g , 1 H NMR spectra (recorded in D2O) of isolated polymers. f , Displays the 1 H NMR spectrum for His-PDMA. The upper spectrum represents the polymer when polymerized in PBS, whereas the lower spectrum is for the polymerized variant in cells. g , Showcases the 1 H NMR spectrum for His-PHPMA. As with (f), the upper graph pertains to the polymer processed in PBS, and the lower represents the cell-polymerized version. For both (f) and (g), the polymer isolated from PBS underwent a dialysis process against water with a molecular weight cut-off (MWCO) of 1,000. On the other hand, the polymers derived from cell lysates were isolated using magnetic beads and then released at a temperature of 60 °C. Panels a–e reproduced with permission from ref. 20 , American Chemical Society.
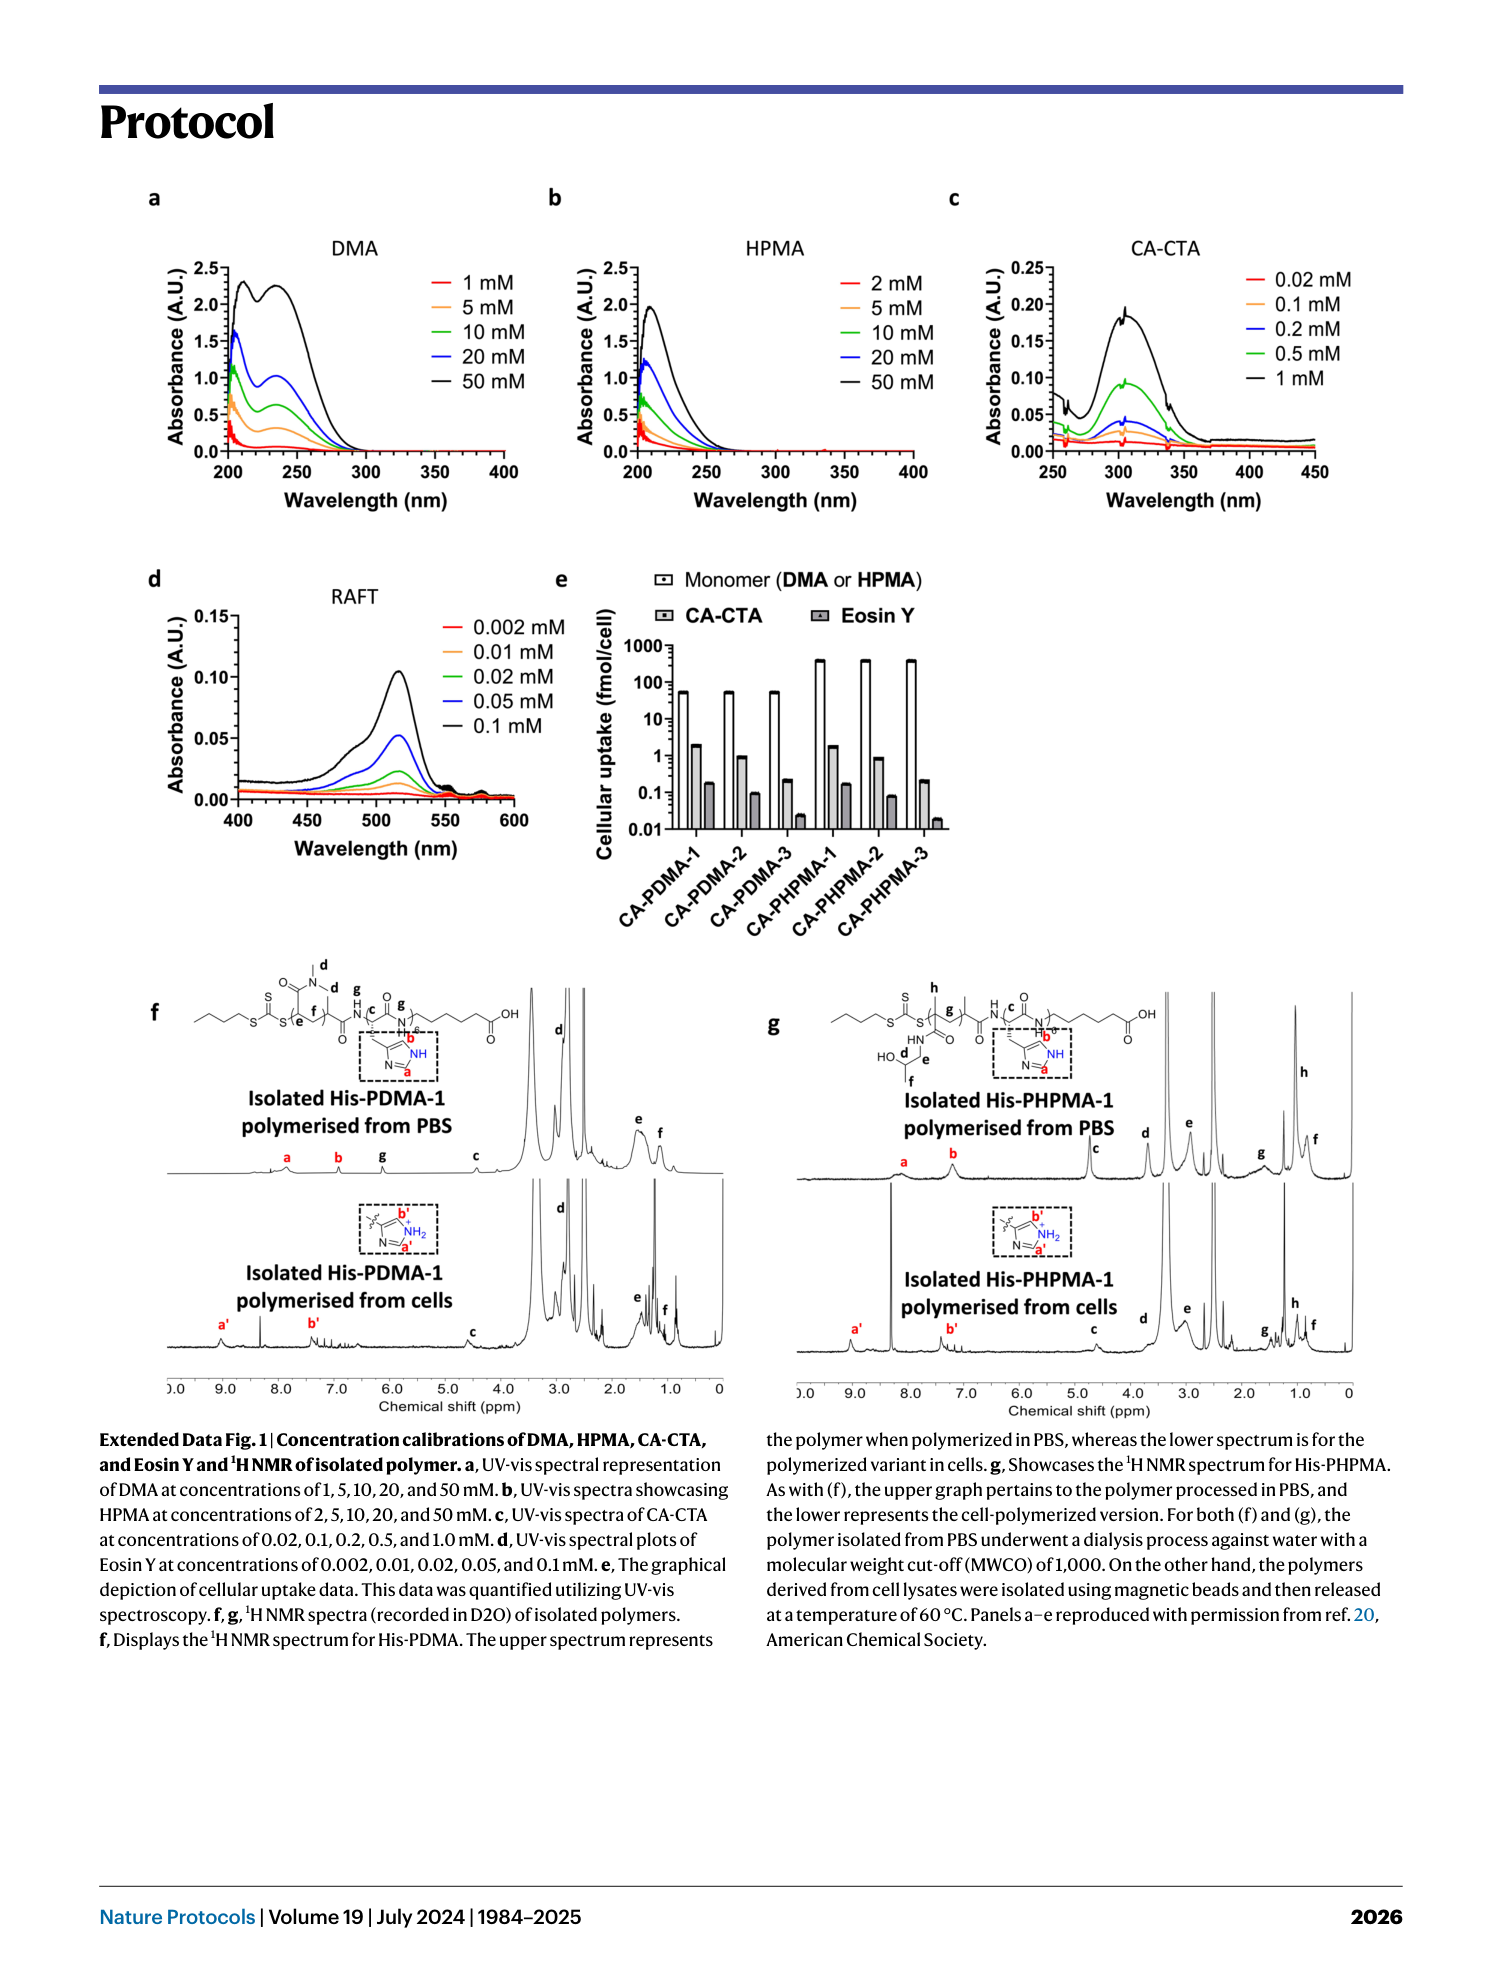
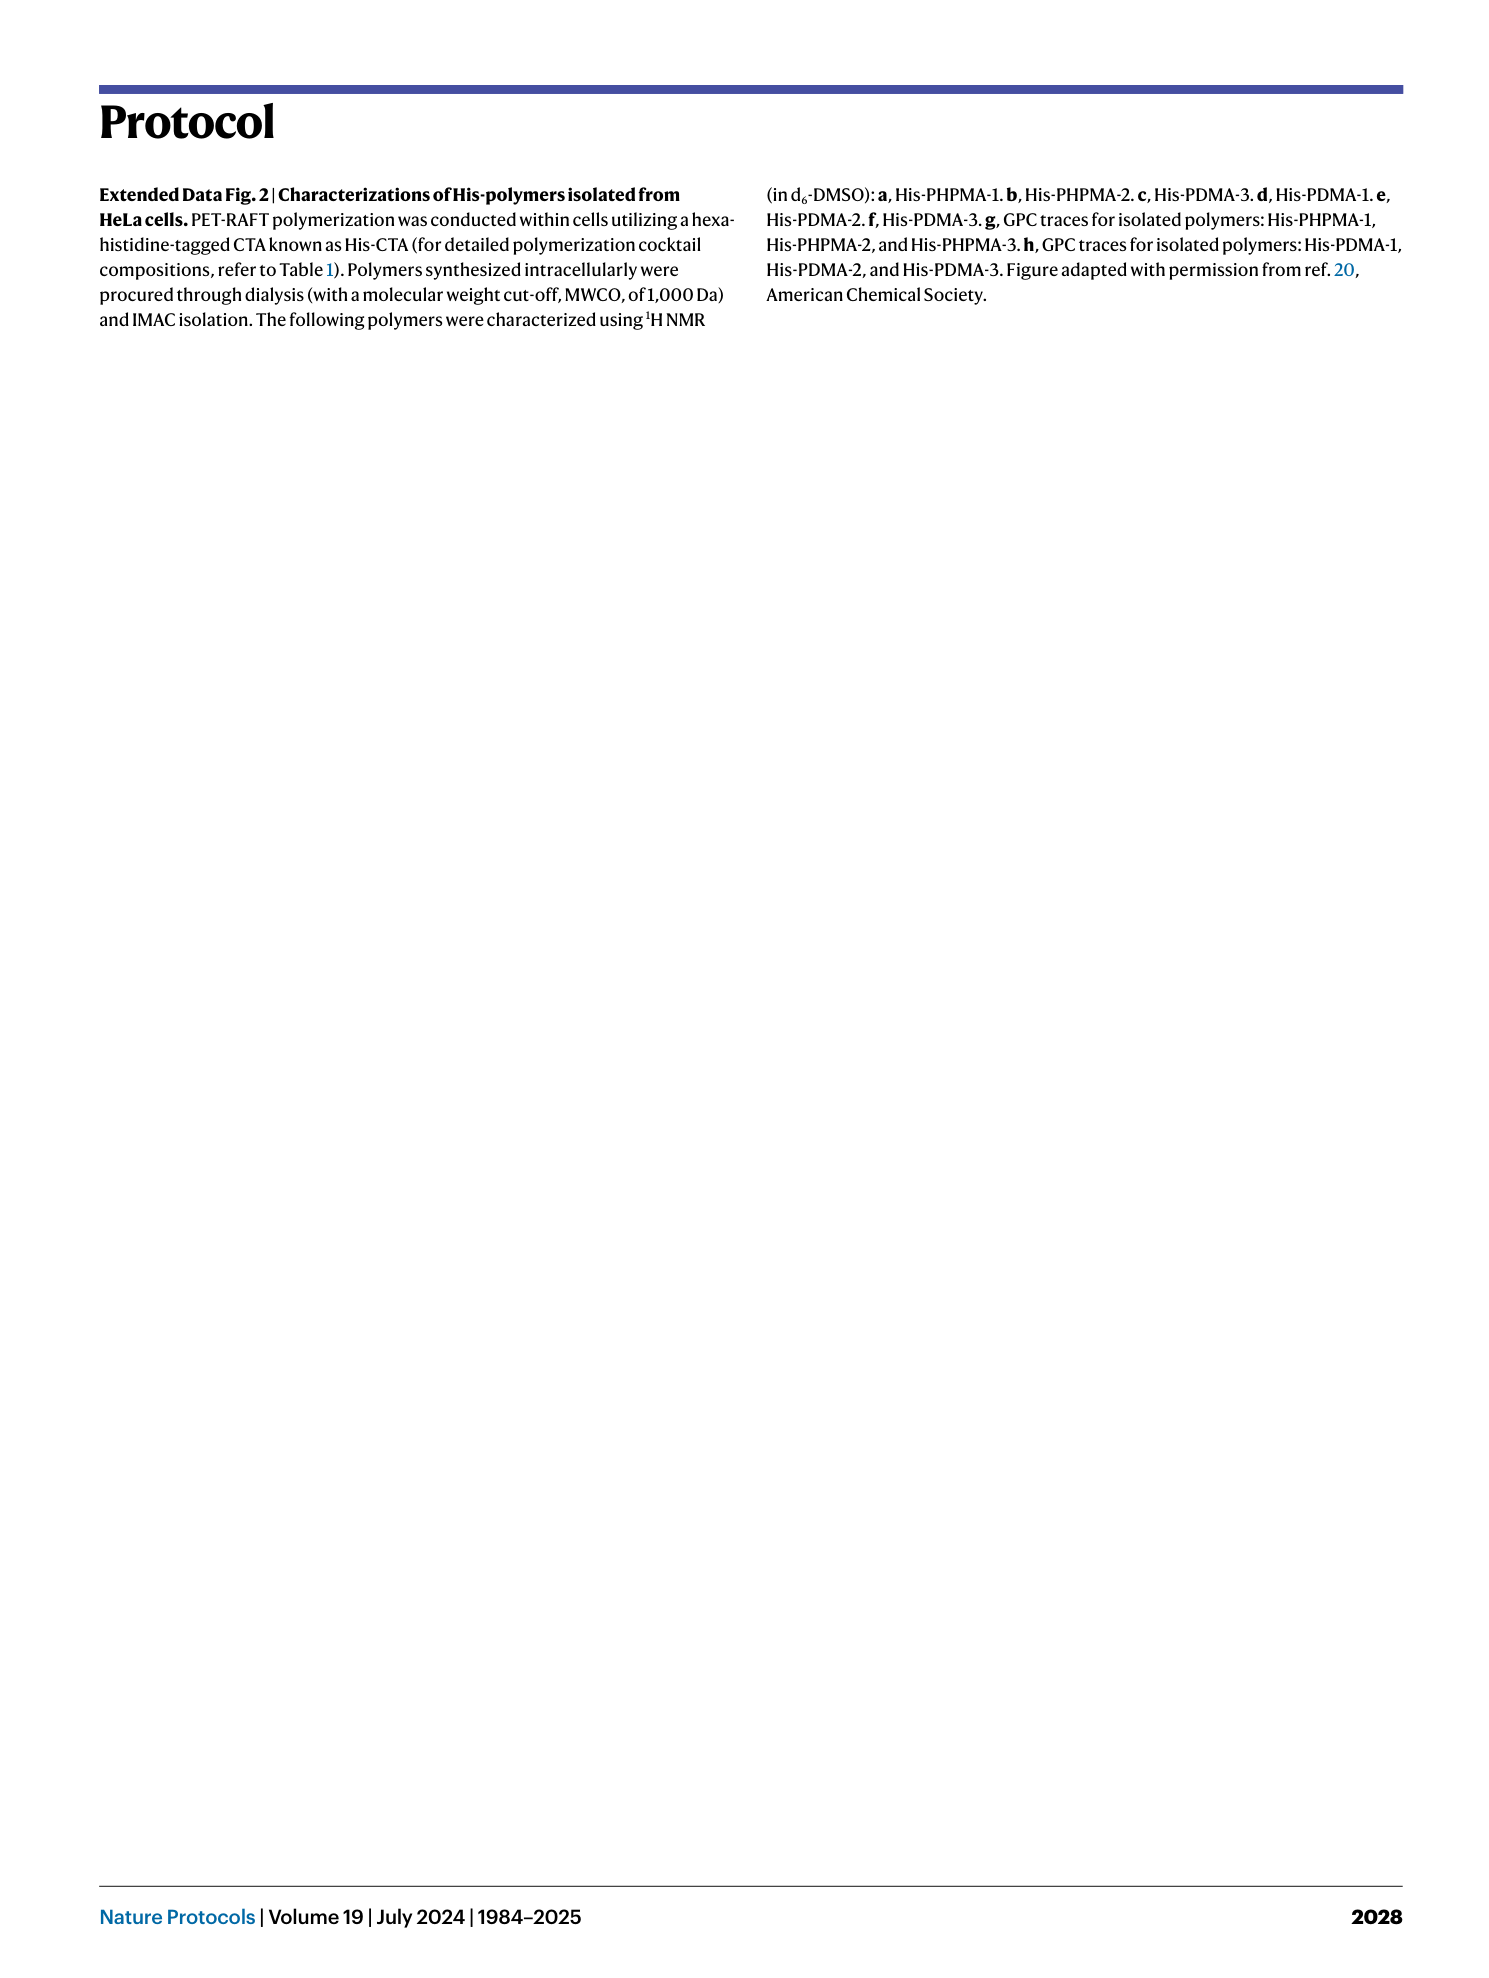
Extended Data Fig. 2 Characterizations of His-polymers isolated from HeLa cells.
PET-RAFT polymerization was conducted within cells utilizing a hexa-histidine-tagged CTA known as His-CTA (for detailed polymerization cocktail compositions, refer to Table 1 ). Polymers synthesized intracellularly were procured through dialysis (with a molecular weight cut-off, MWCO, of 1,000 Da) and IMAC isolation. The following polymers were characterized using 1 H NMR (in d 6 -DMSO): a , His-PHPMA-1. b , His-PHPMA-2. c , His-PDMA-3. d , His-PDMA-1. e , His-PDMA-2. f , His-PDMA-3. g , GPC traces for isolated polymers: His-PHPMA-1, His-PHPMA-2, and His-PHPMA-3. h , GPC traces for isolated polymers: His-PDMA-1, His-PDMA-2, and His-PDMA-3. Figure adapted with permission from ref. 20 , American Chemical Society.
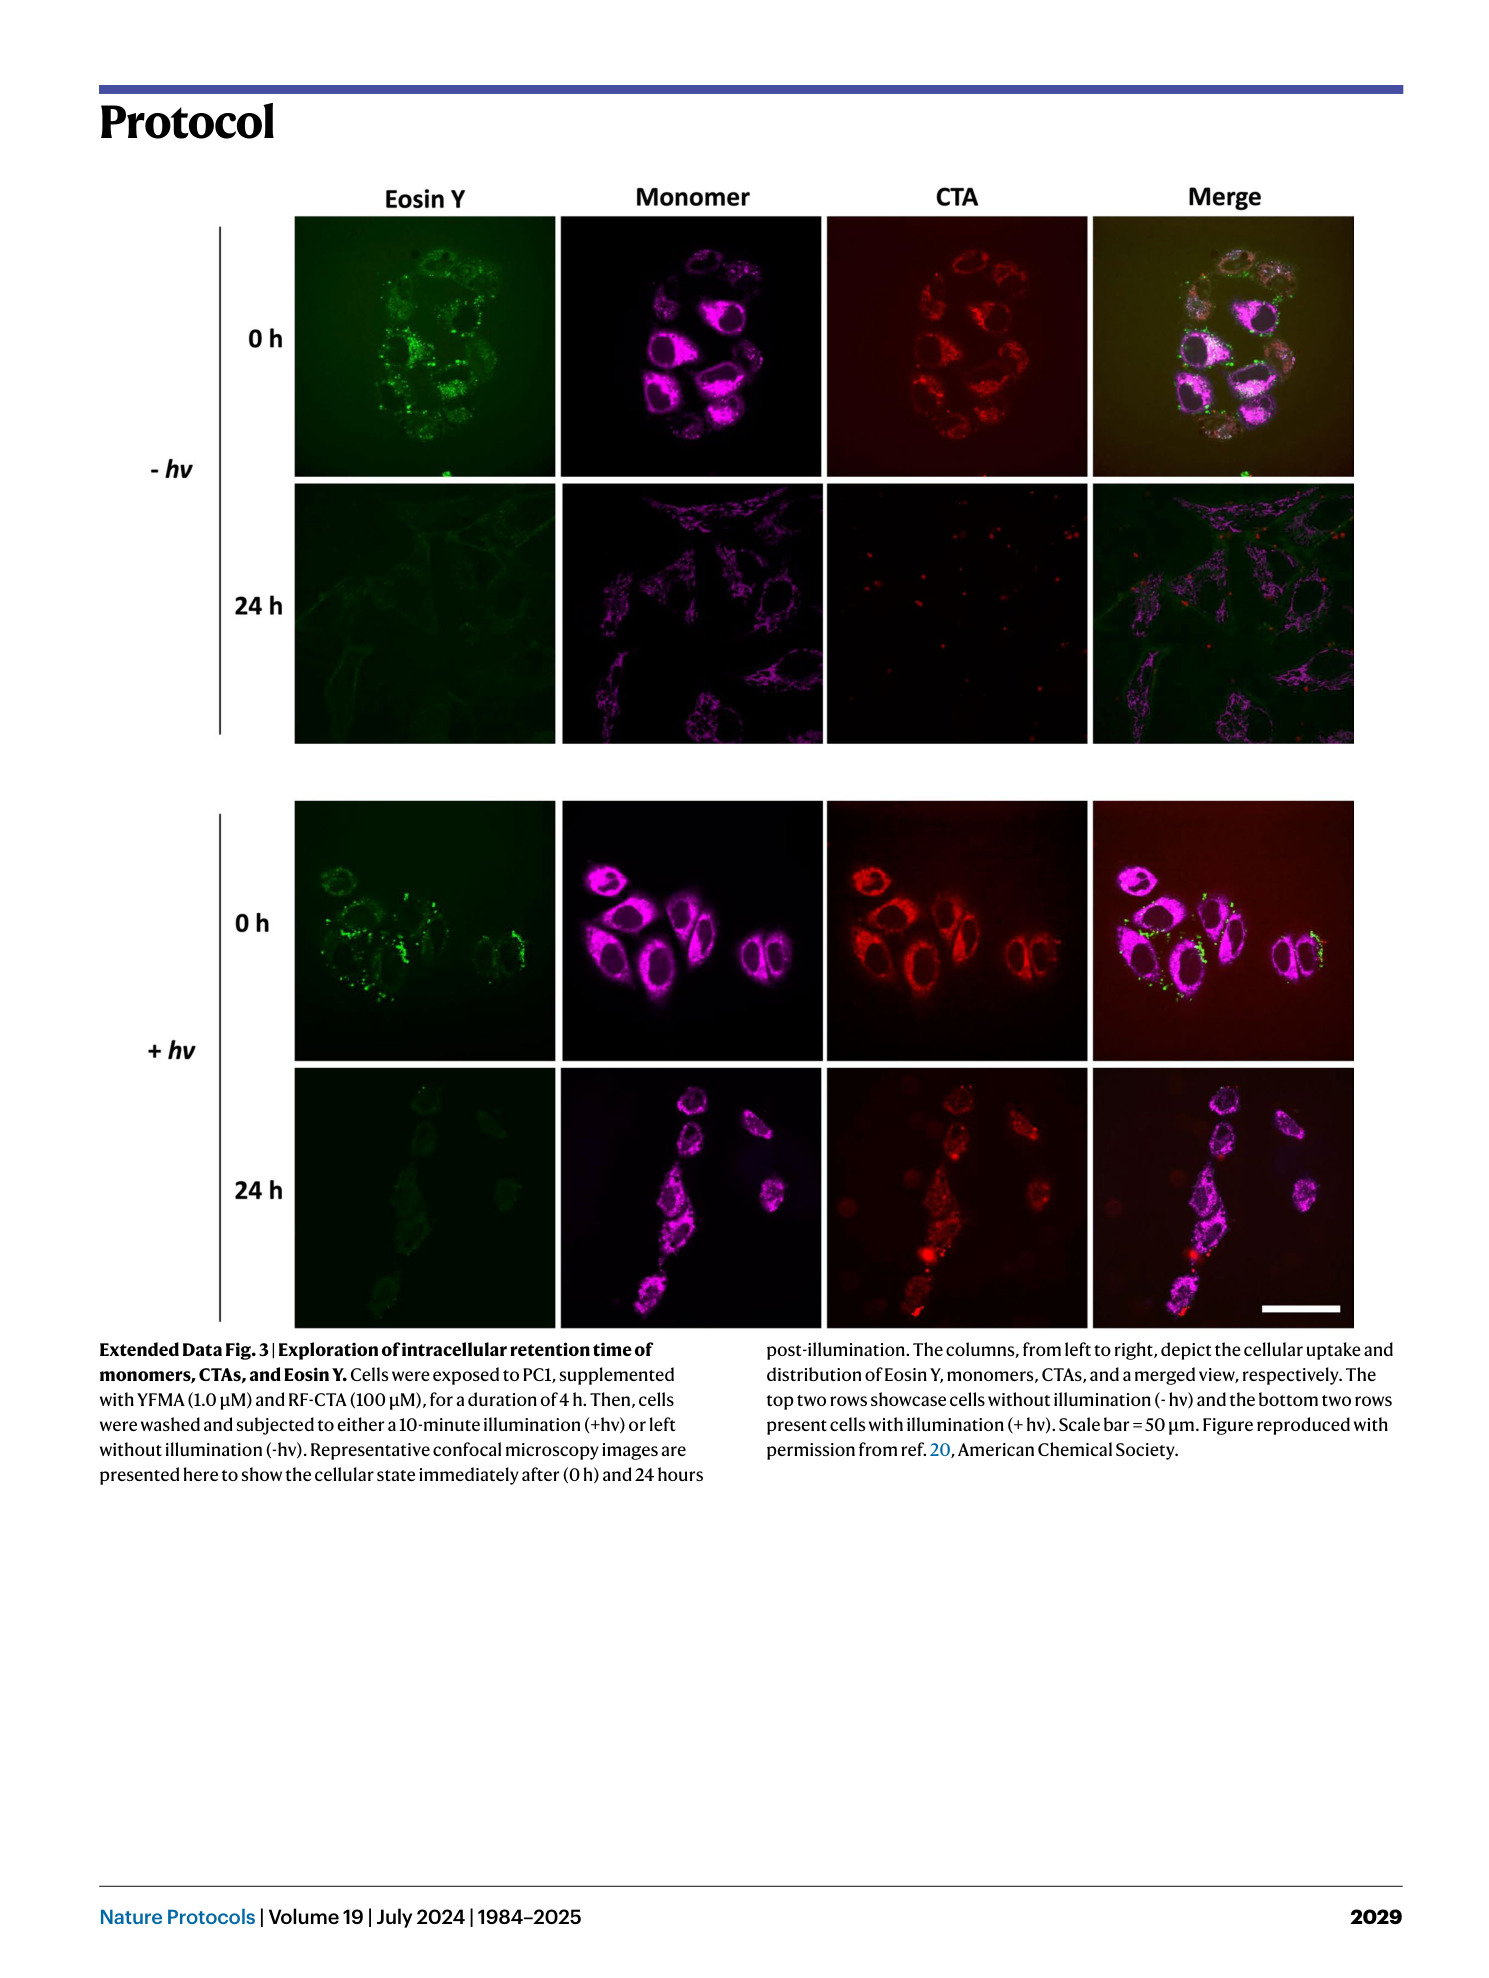
Extended Data Fig. 3 Exploration of intracellular retention time of monomers, CTAs, and Eosin Y.
Cells were exposed to PC1, supplemented with YFMA (1.0 µM) and RF-CTA (100 µM), for a duration of 4 h. Then, cells were washed and subjected to either a 10-minute illumination (+hv) or left without illumination (-hv). Representative confocal microscopy images are presented here to show the cellular state immediately after (0 h) and 24 hours post-illumination. The columns, from left to right, depict the cellular uptake and distribution of Eosin Y, monomers, CTAs, and a merged view, respectively. The top two rows showcase cells without illumination (- hν) and the bottom two rows present cells with illumination (+ hν). Scale bar = 50 µm. Figure reproduced with permission from ref. 20 , American Chemical Society.
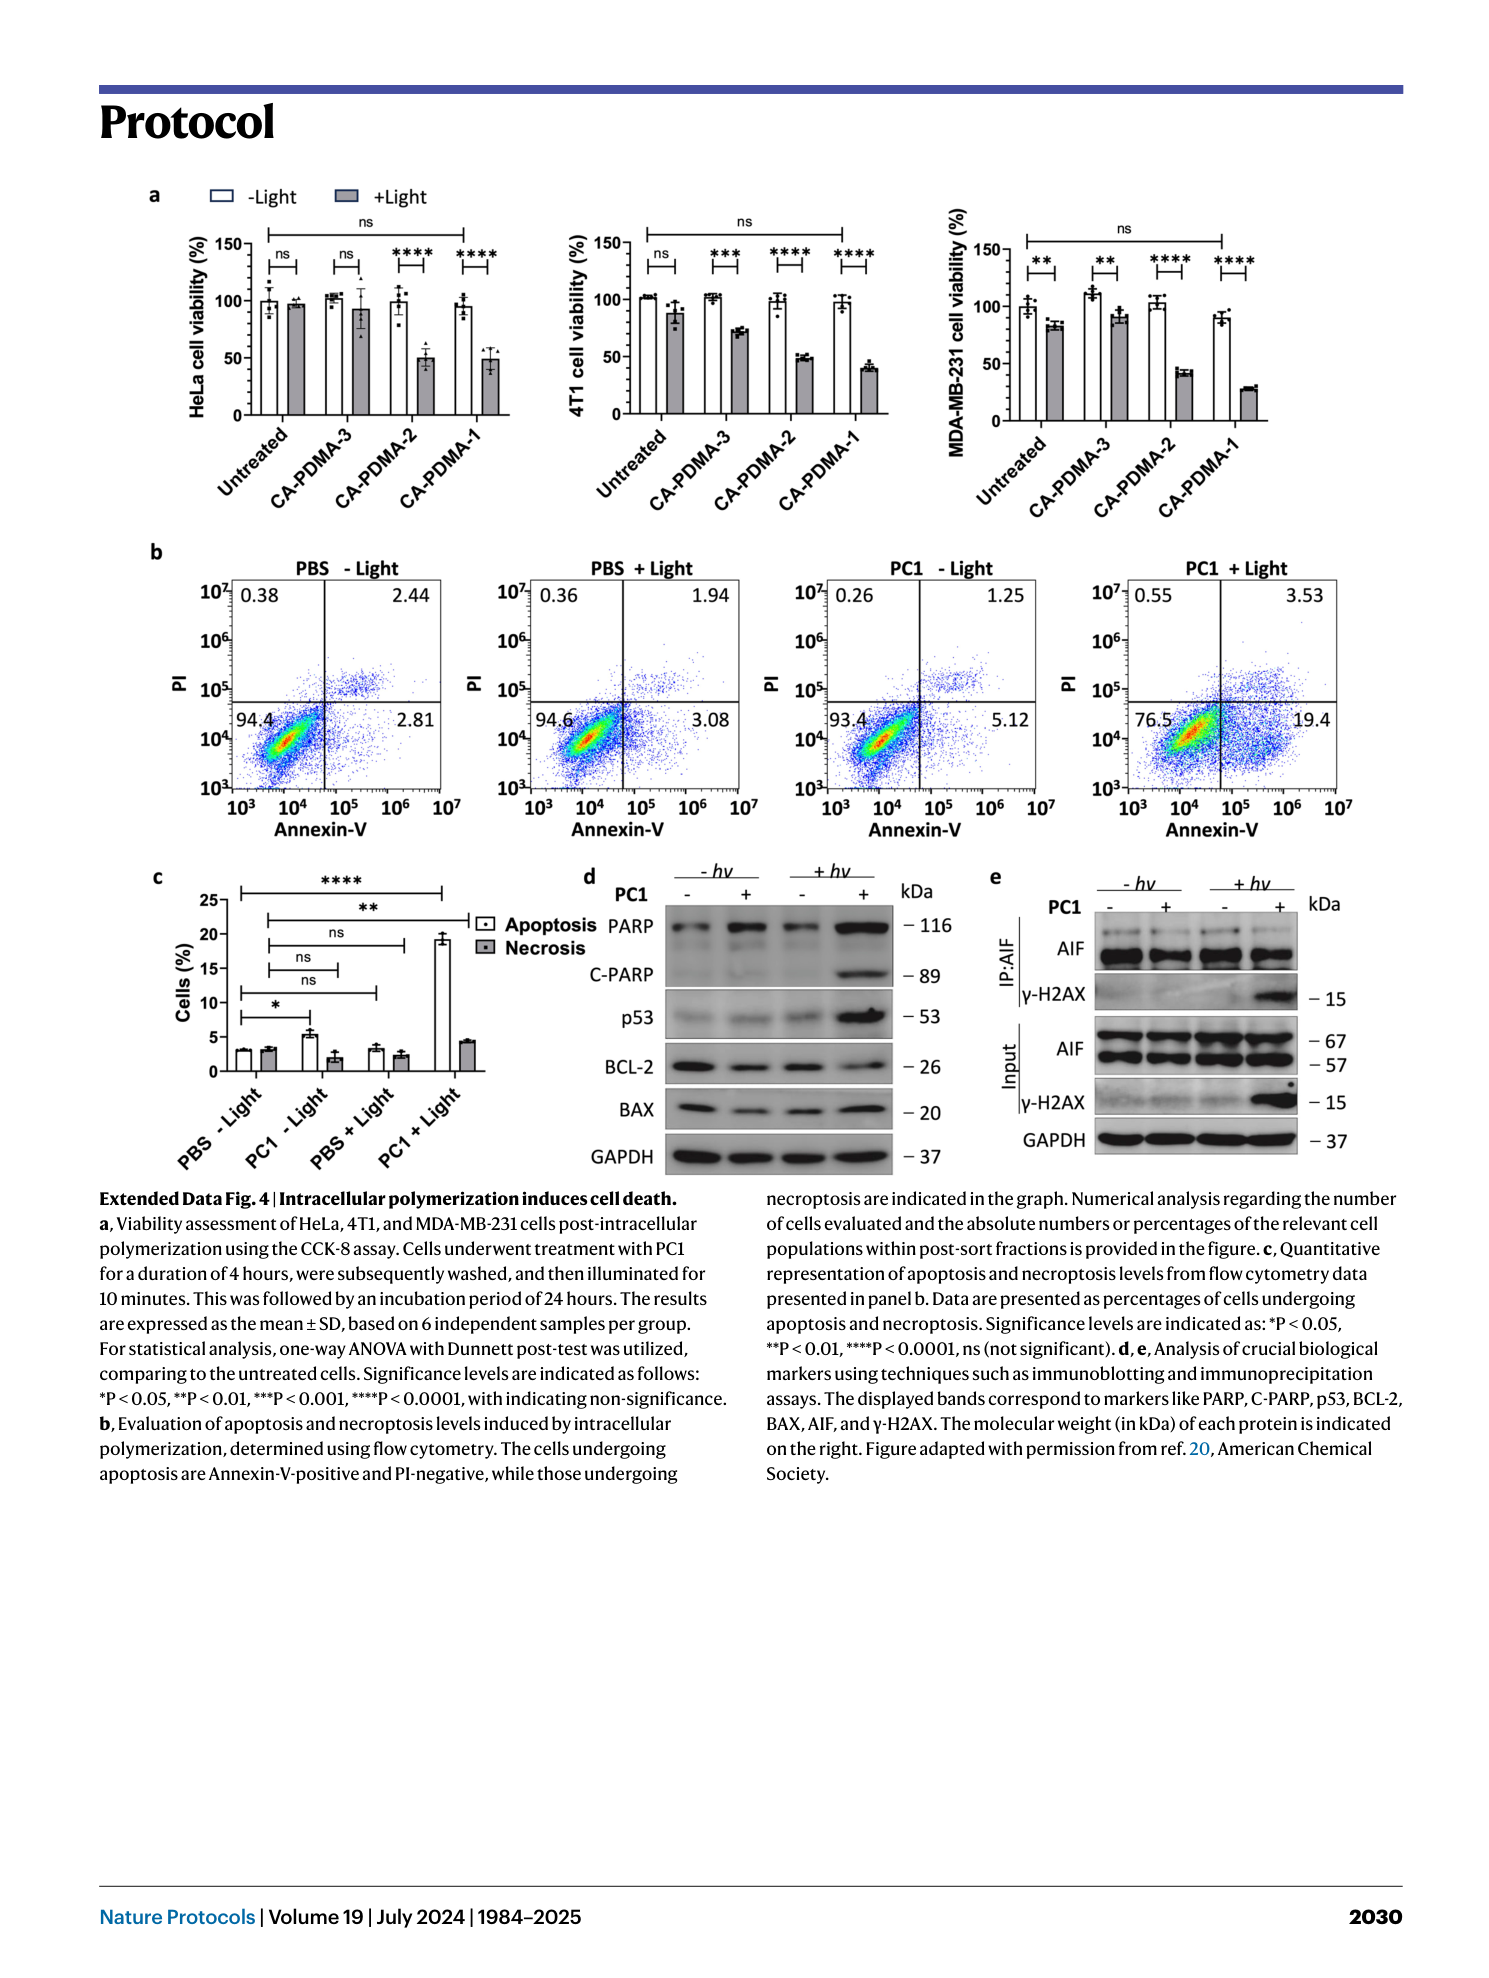
Extended Data Fig. 4 Intracellular polymerization induces cell death.
a , Viability assessment of HeLa, 4T1, and MDA-MB-231 cells post-intracellular polymerization using the CCK-8 assay. Cells underwent treatment with PC1 for a duration of 4 hours, were subsequently washed, and then illuminated for 10 minutes. This was followed by an incubation period of 24 hours. The results are expressed as the mean ± SD, based on 6 independent samples per group. For statistical analysis, one-way ANOVA with Dunnett post-test was utilized, comparing to the untreated cells. Significance levels are indicated as follows: *P < 0.05, **P < 0.01, ***P < 0.001, ****P < 0.0001, with indicating non-significance. b , Evaluation of apoptosis and necroptosis levels induced by intracellular polymerization, determined using flow cytometry. The cells undergoing apoptosis are Annexin-V-positive and PI-negative, while those undergoing necroptosis are indicated in the graph. Numerical analysis regarding the number of cells evaluated and the absolute numbers or percentages of the relevant cell populations within post-sort fractions is provided in the figure. c , Quantitative representation of apoptosis and necroptosis levels from flow cytometry data presented in panel b. Data are presented as percentages of cells undergoing apoptosis and necroptosis. Significance levels are indicated as: *P < 0.05, **P < 0.01, ****P < 0.0001, ns (not significant). d , e , Analysis of crucial biological markers using techniques such as immunoblotting and immunoprecipitation assays. The displayed bands correspond to markers like PARP, C-PARP, p53, BCL-2, BAX, AIF, and γ-H2AX. The molecular weight (in kDa) of each protein is indicated on the right. Figure adapted with permission from ref. 20 , American Chemical Society.
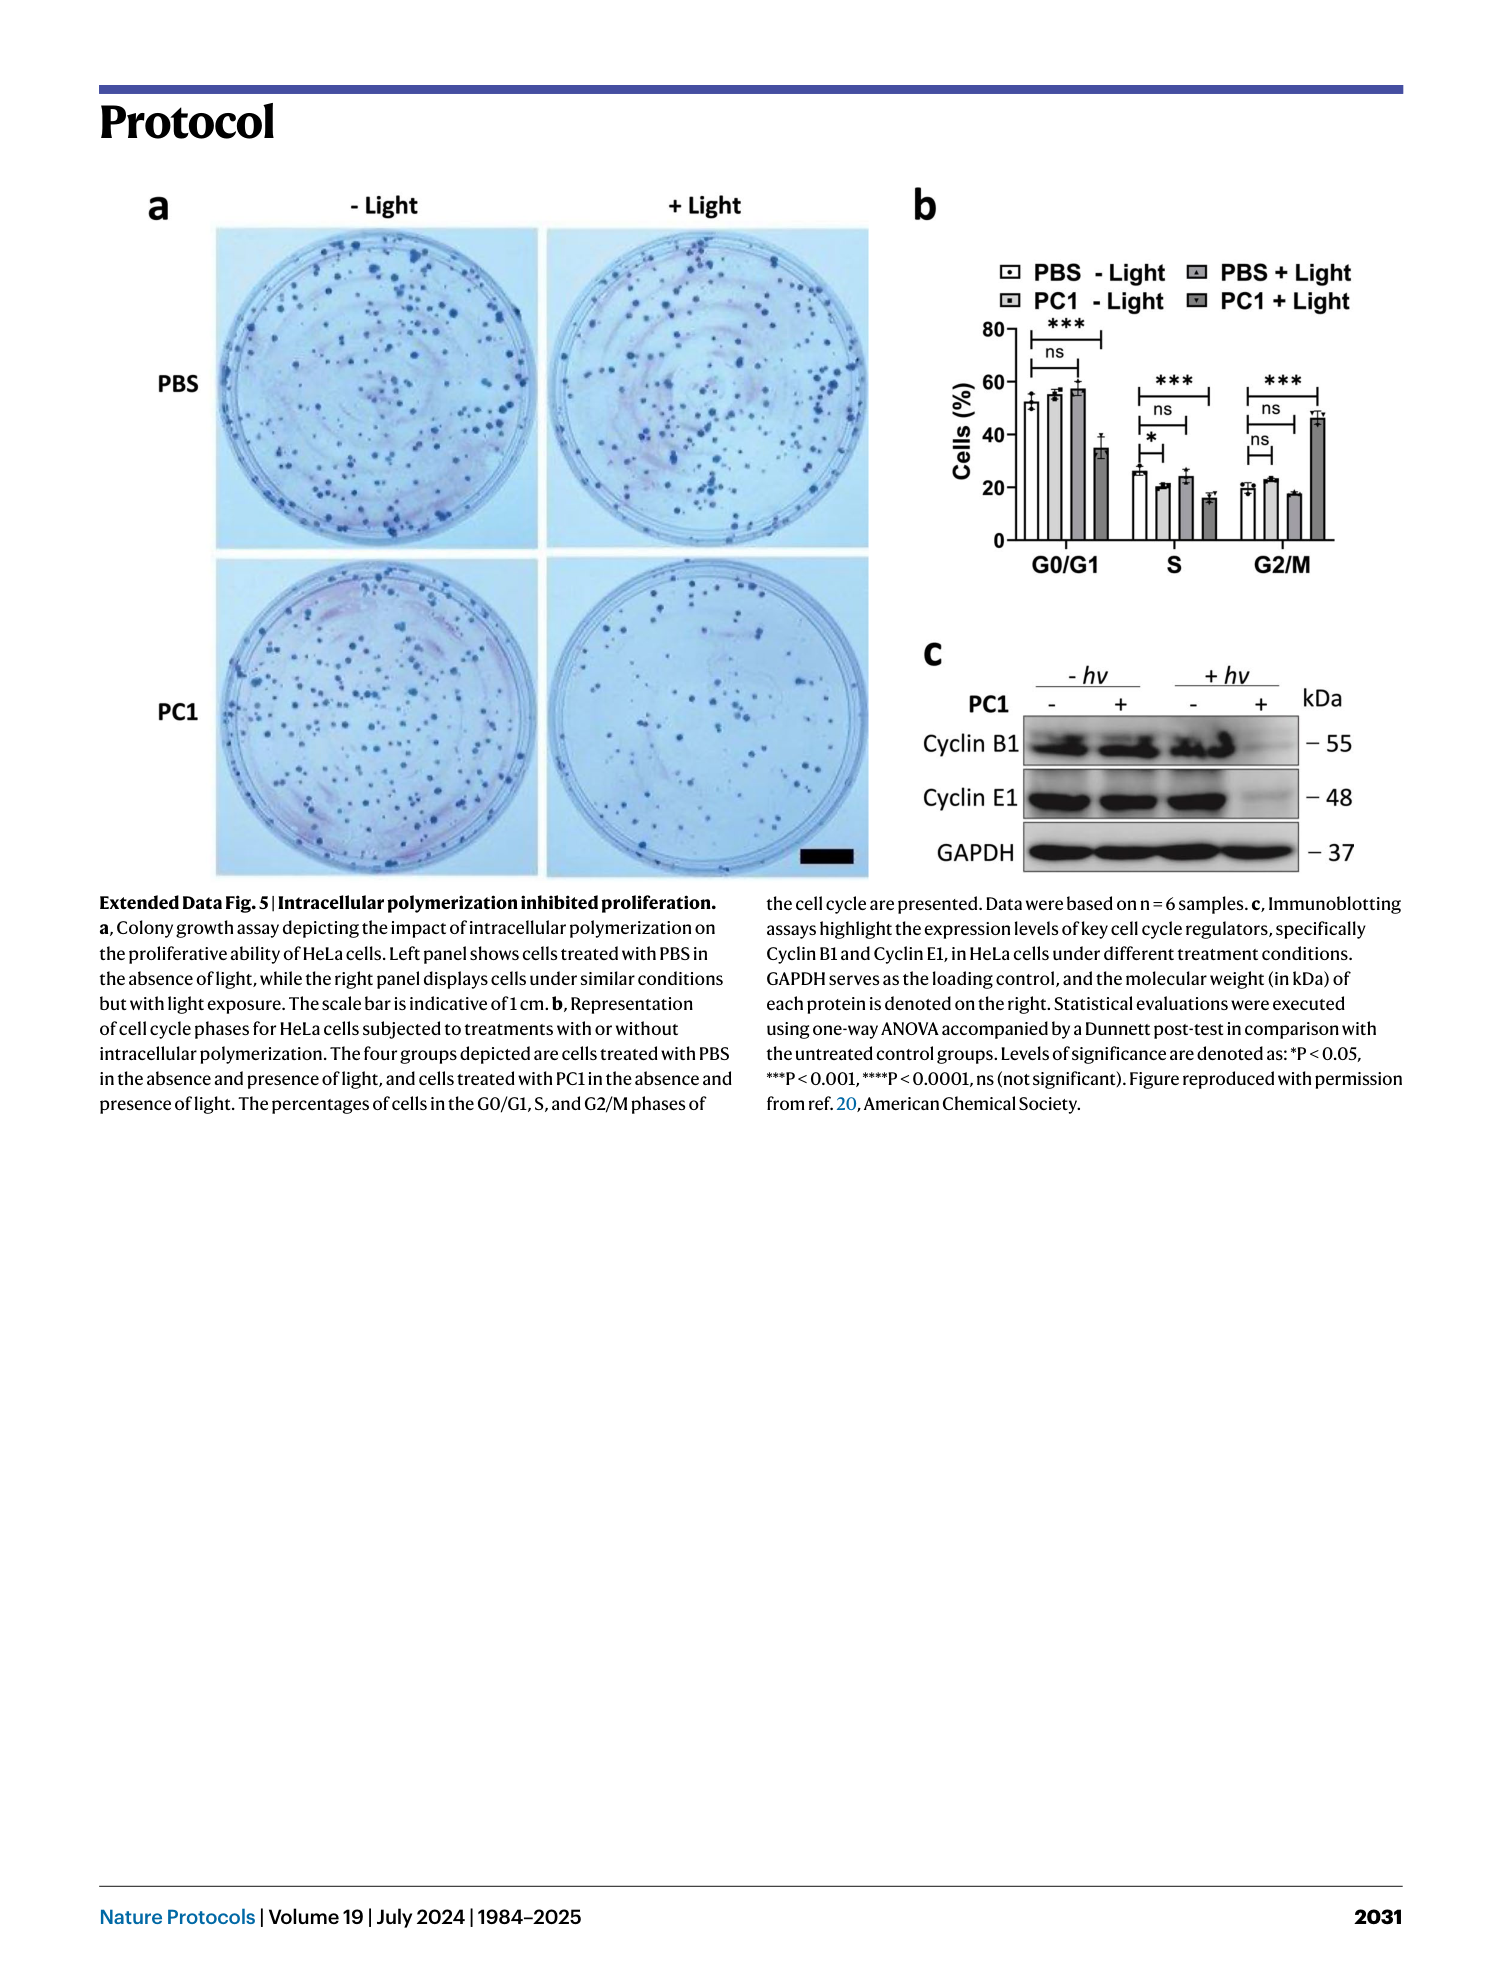
Extended Data Fig. 5 Intracellular polymerization inhibited proliferation.
a , Colony growth assay depicting the impact of intracellular polymerization on the proliferative ability of HeLa cells. Left panel shows cells treated with PBS in the absence of light, while the right panel displays cells under similar conditions but with light exposure. The scale bar is indicative of 1 cm. b , Representation of cell cycle phases for HeLa cells subjected to treatments with or without intracellular polymerization. The four groups depicted are cells treated with PBS in the absence and presence of light, and cells treated with PC1 in the absence and presence of light. The percentages of cells in the G0/G1, S, and G2/M phases of the cell cycle are presented. Data were based on n = 6 samples. c , Immunoblotting assays highlight the expression levels of key cell cycle regulators, specifically Cyclin B1 and Cyclin E1, in HeLa cells under different treatment conditions. GAPDH serves as the loading control, and the molecular weight (in kDa) of each protein is denoted on the right. Statistical evaluations were executed using one-way ANOVA accompanied by a Dunnett post-test in comparison with the untreated control groups. Levels of significance are denoted as: *P < 0.05, ***P < 0.001, ****P < 0.0001, ns (not significant). Figure reproduced with permission from ref. 20 , American Chemical Society.
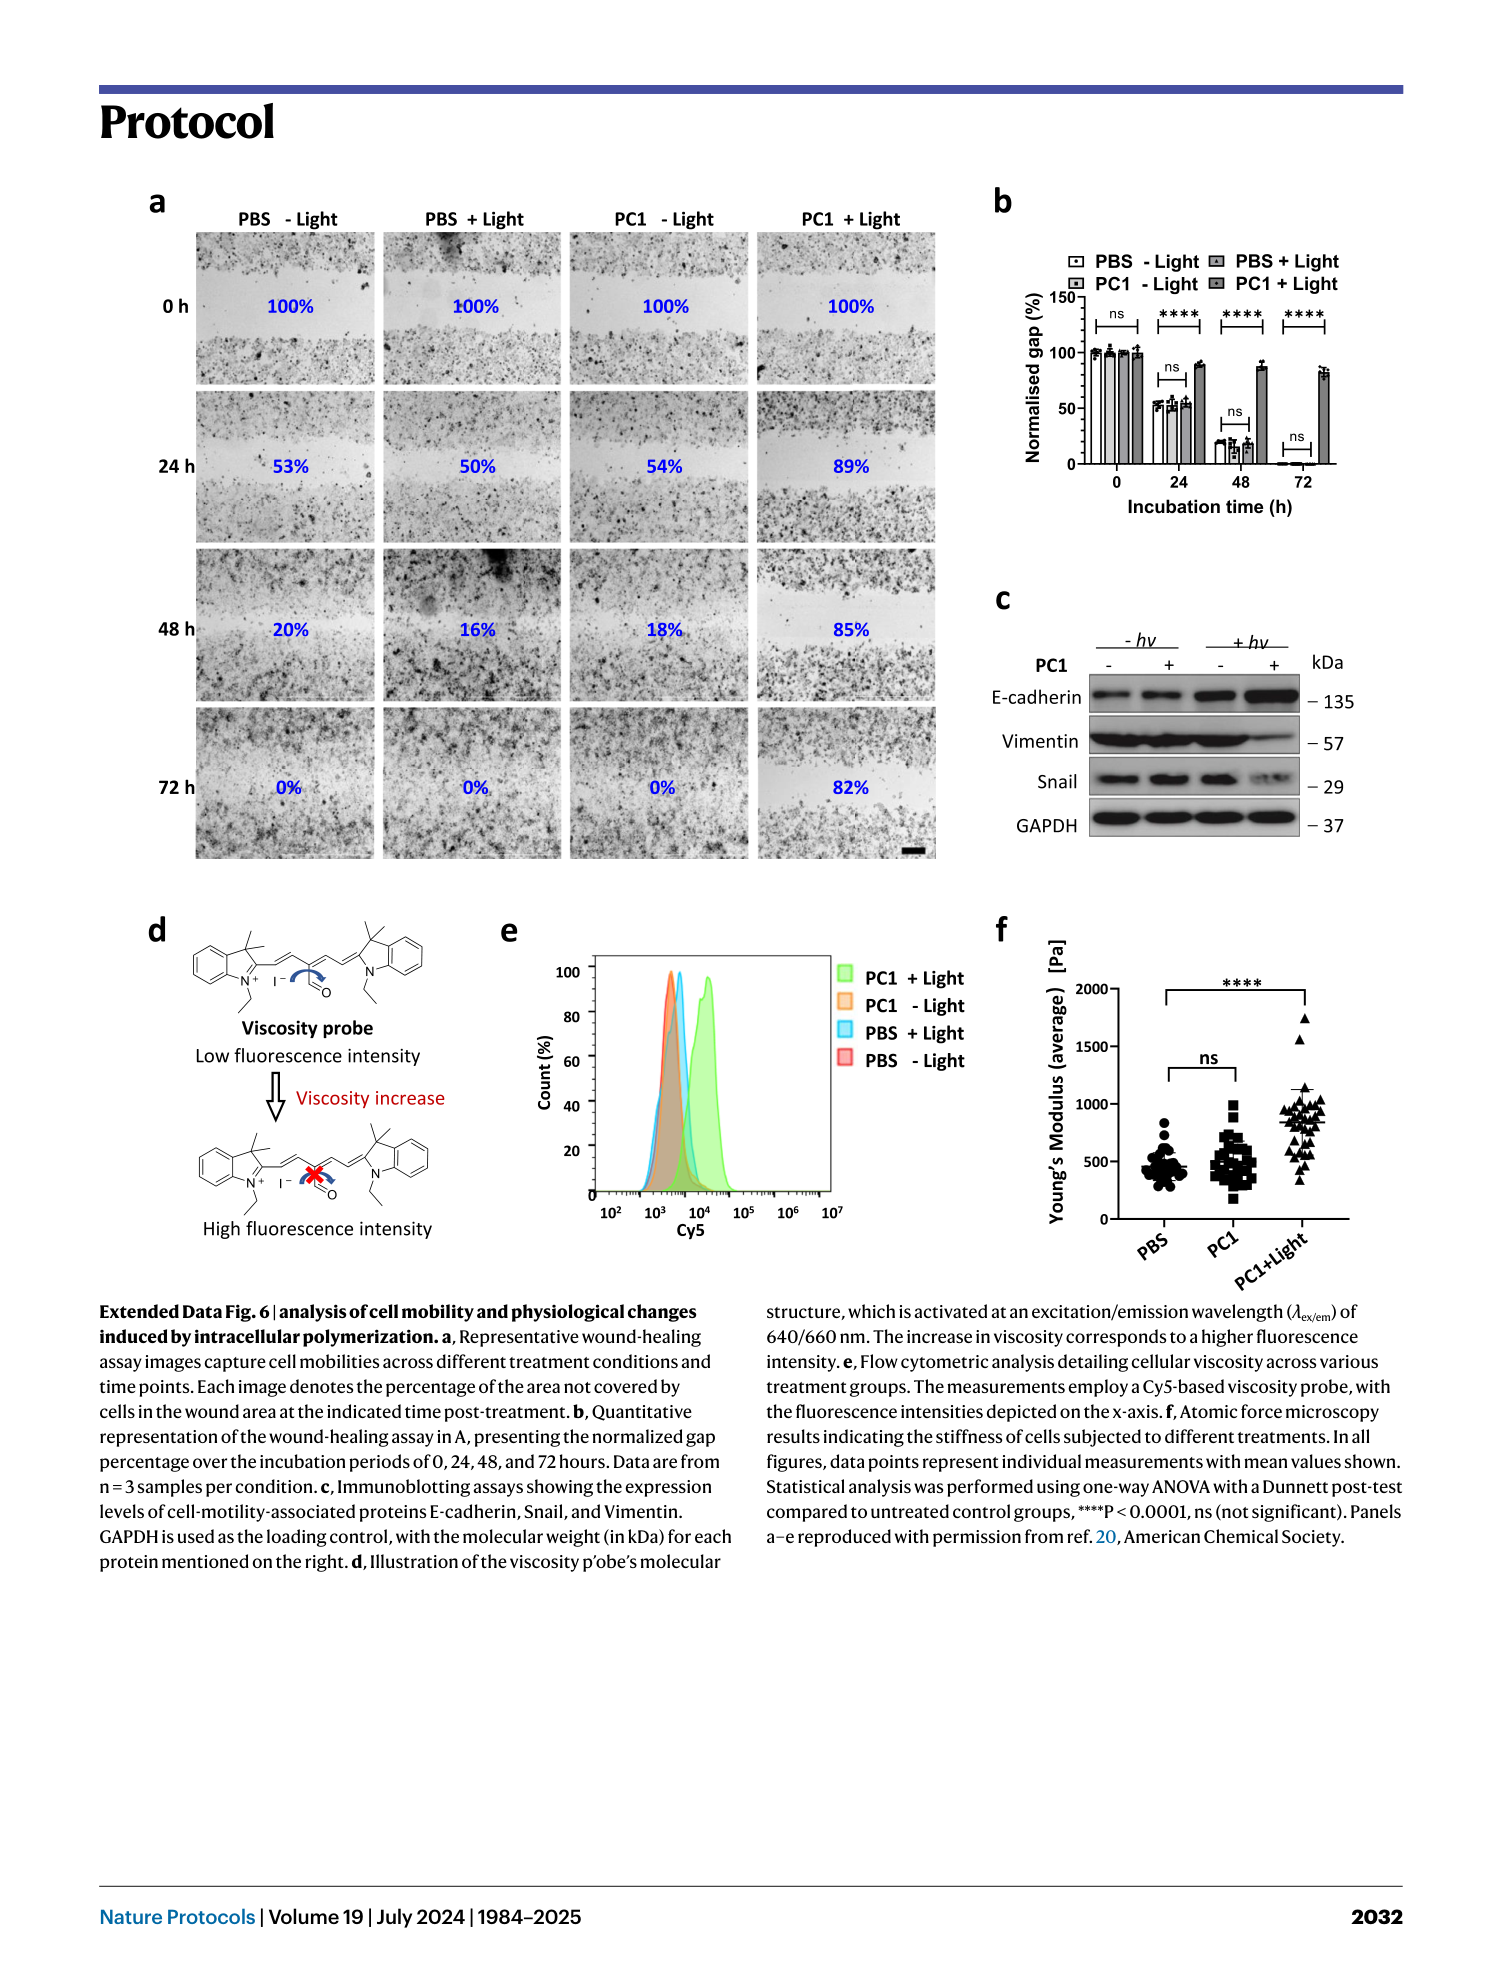
Extended Data Fig. 6 analysis of cell mobility and physiological changes induced by intracellular polymerization.
a , Representative wound-healing assay images capture cell mobilities across different treatment conditions and time points. Each image denotes the percentage of the area not covered by cells in the wound area at the indicated time post-treatment. b , Quantitative representation of the wound-healing assay in A, presenting the normalized gap percentage over the incubation periods of 0, 24, 48, and 72 hours. Data are from n = 3 samples per condition. c , Immunoblotting assays showing the expression levels of cell-motility-associated proteins E-cadherin, Snail, and Vimentin. GAPDH is used as the loading control, with the molecular weight (in kDa) for each protein mentioned on the right. d , Illustration of the viscosity p’obe’s molecular structure, which is activated at an excitation/emission wavelength ( λ ex/em ) of 640/660 nm. The increase in viscosity corresponds to a higher fluorescence intensity. e , Flow cytometric analysis detailing cellular viscosity across various treatment groups. The measurements employ a Cy5-based viscosity probe, with the fluorescence intensities depicted on the x-axis. f , Atomic force microscopy results indicating the stiffness of cells subjected to different treatments. In all figures, data points represent individual measurements with mean values shown. Statistical analysis was performed using one-way ANOVA with a Dunnett post-test compared to untreated control groups, ****P < 0.0001, ns (not significant). Panels a–e reproduced with permission from ref. 20 , American Chemical Society.
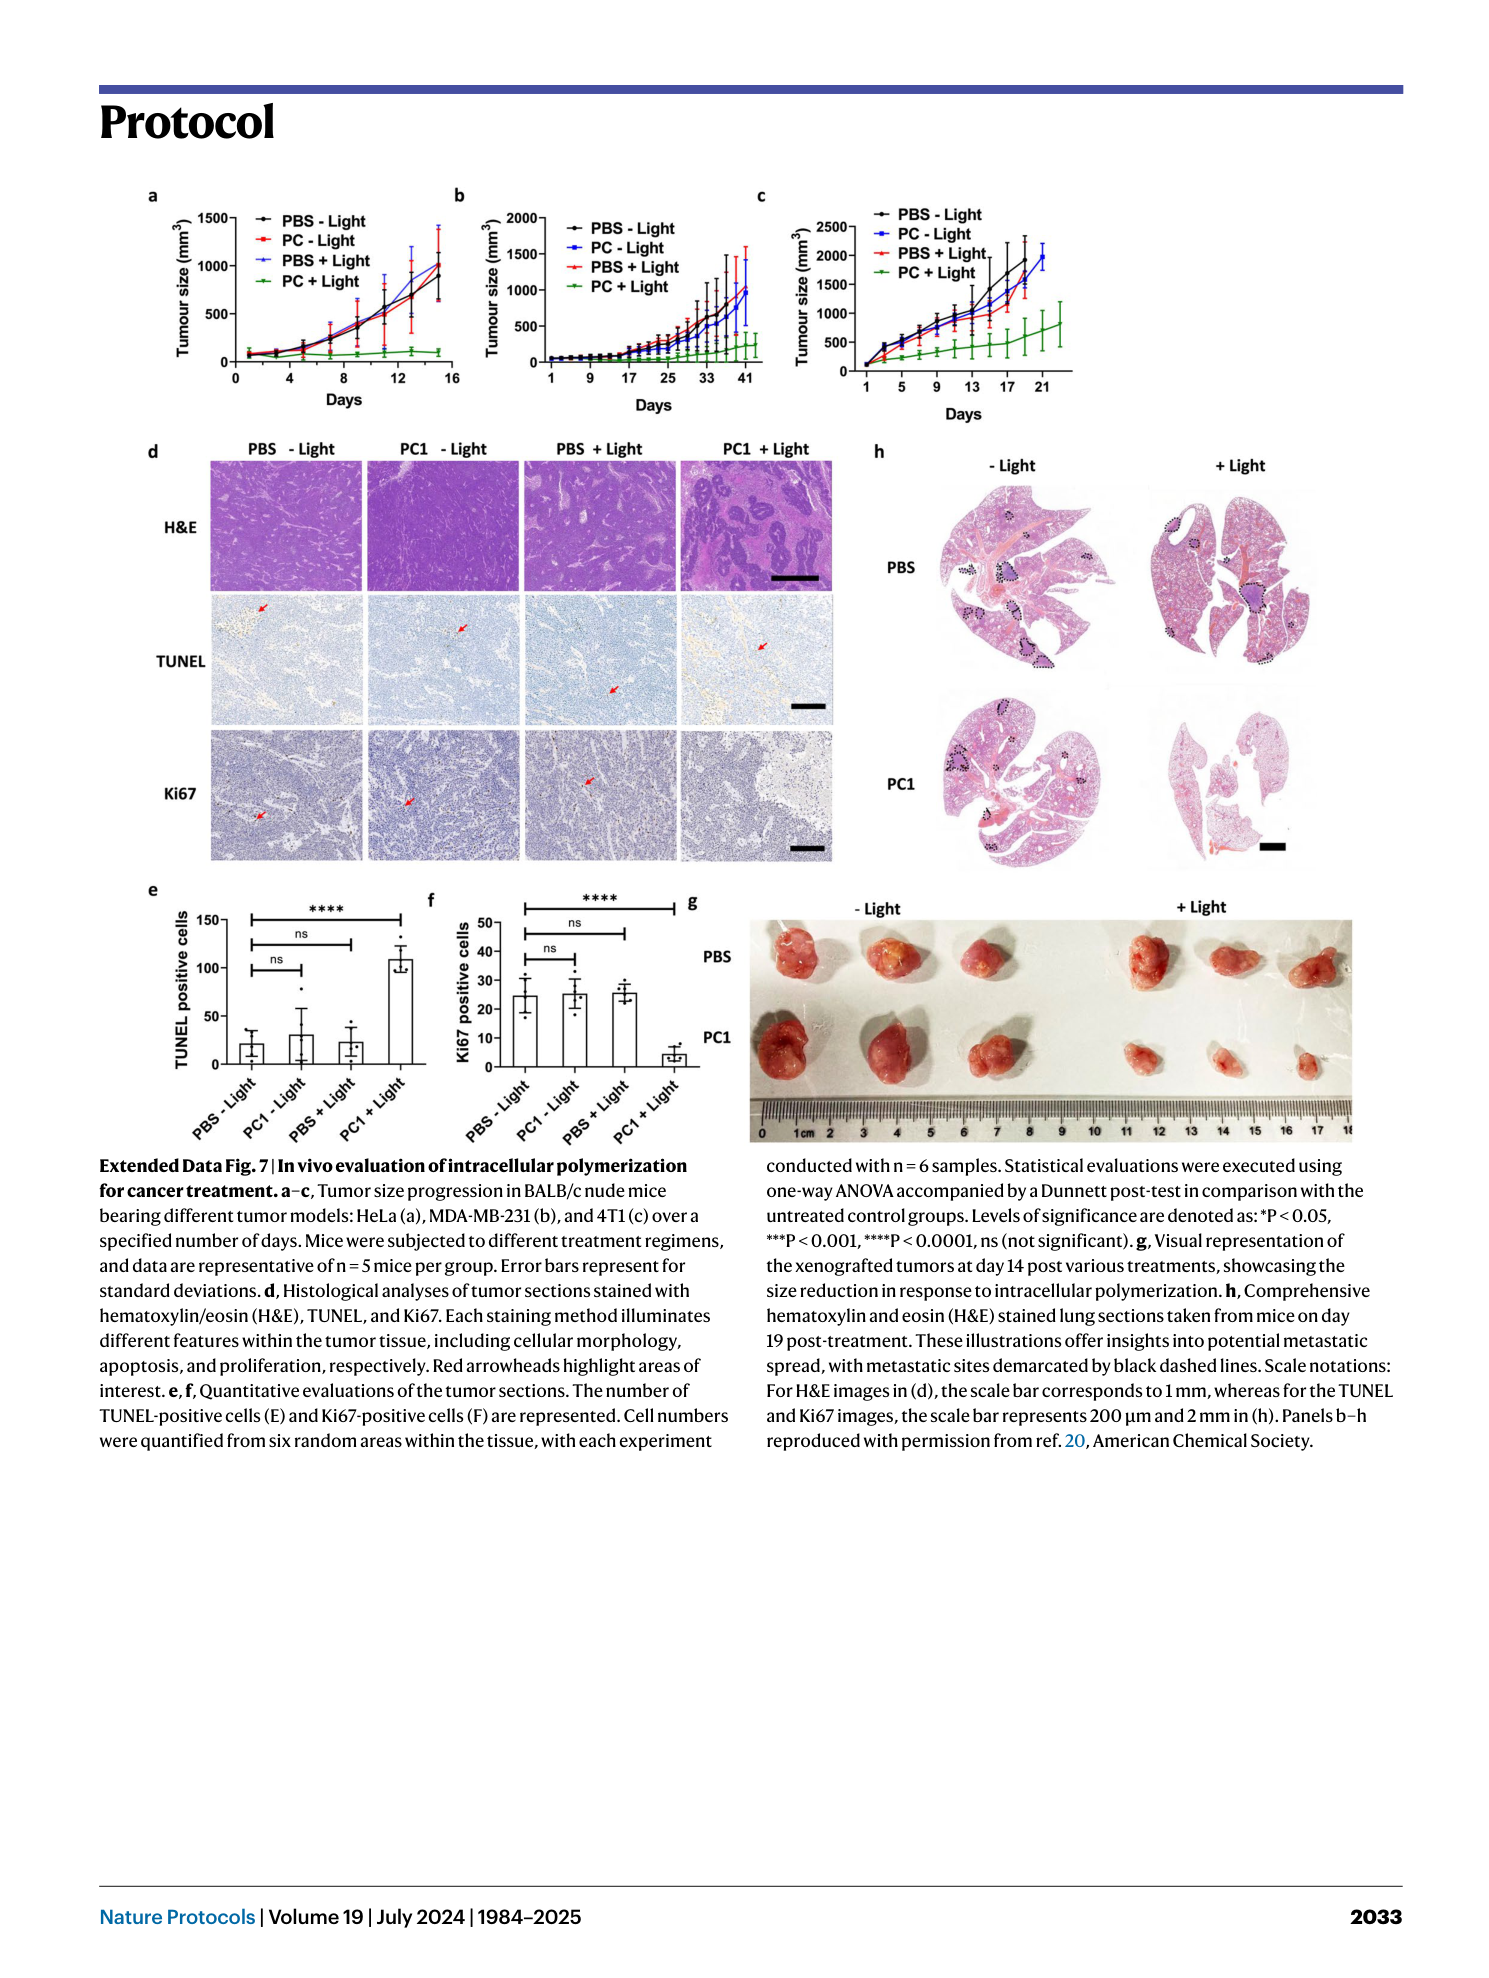
Extended Data Fig. 7 In vivo evaluation of intracellular polymerization for cancer treatment.
a–c , Tumor size progression in BALB/c nude mice bearing different tumor models: HeLa (a), MDA-MB-231 (b), and 4T1 (c) over a specified number of days. Mice were subjected to different treatment regimens, and data are representative of n = 5 mice per group. Error bars represent for standard deviations. d , Histological analyses of tumor sections stained with hematoxylin/eosin (H&E), TUNEL, and Ki67. Each staining method illuminates different features within the tumor tissue, including cellular morphology, apoptosis, and proliferation, respectively. Red arrowheads highlight areas of interest. e , f , Quantitative evaluations of the tumor sections. The number of TUNEL-positive cells (E) and Ki67-positive cells (F) are represented. Cell numbers were quantified from six random areas within the tissue, with each experiment conducted with n = 6 samples. Statistical evaluations were executed using one-way ANOVA accompanied by a Dunnett post-test in comparison with the untreated control groups. Levels of significance are denoted as: *P < 0.05, ***P < 0.001, ****P < 0.0001, ns (not significant). g , Visual representation of the xenografted tumors at day 14 post various treatments, showcasing the size reduction in response to intracellular polymerization. h , Comprehensive hematoxylin and eosin (H&E) stained lung sections taken from mice on day 19 post-treatment. These illustrations offer insights into potential metastatic spread, with metastatic sites demarcated by black dashed lines. Scale notations: For H&E images in (d), the scale bar corresponds to 1 mm, whereas for the TUNEL and Ki67 images, the scale bar represents 200 μm and 2 mm in (h). Panels b–h reproduced with permission from ref. 20 , American Chemical Society.
