INVADEseq to identify cell-adherent or invasive bacteria and the associated host transcriptome at single-cell-level resolution
Jorge Luis Galeano Niño, Hanrui Wu, Kaitlyn D. LaCourse, Harini Srinivasan, Matthew Fitzgibbon, Samuel S. Minot, Cassie Sather, Christopher D. Johnston, Susan Bullman


Supplementary information
Supplementary Information
Supplementary Fig. 1.
Reporting Summary
Supplementary Table
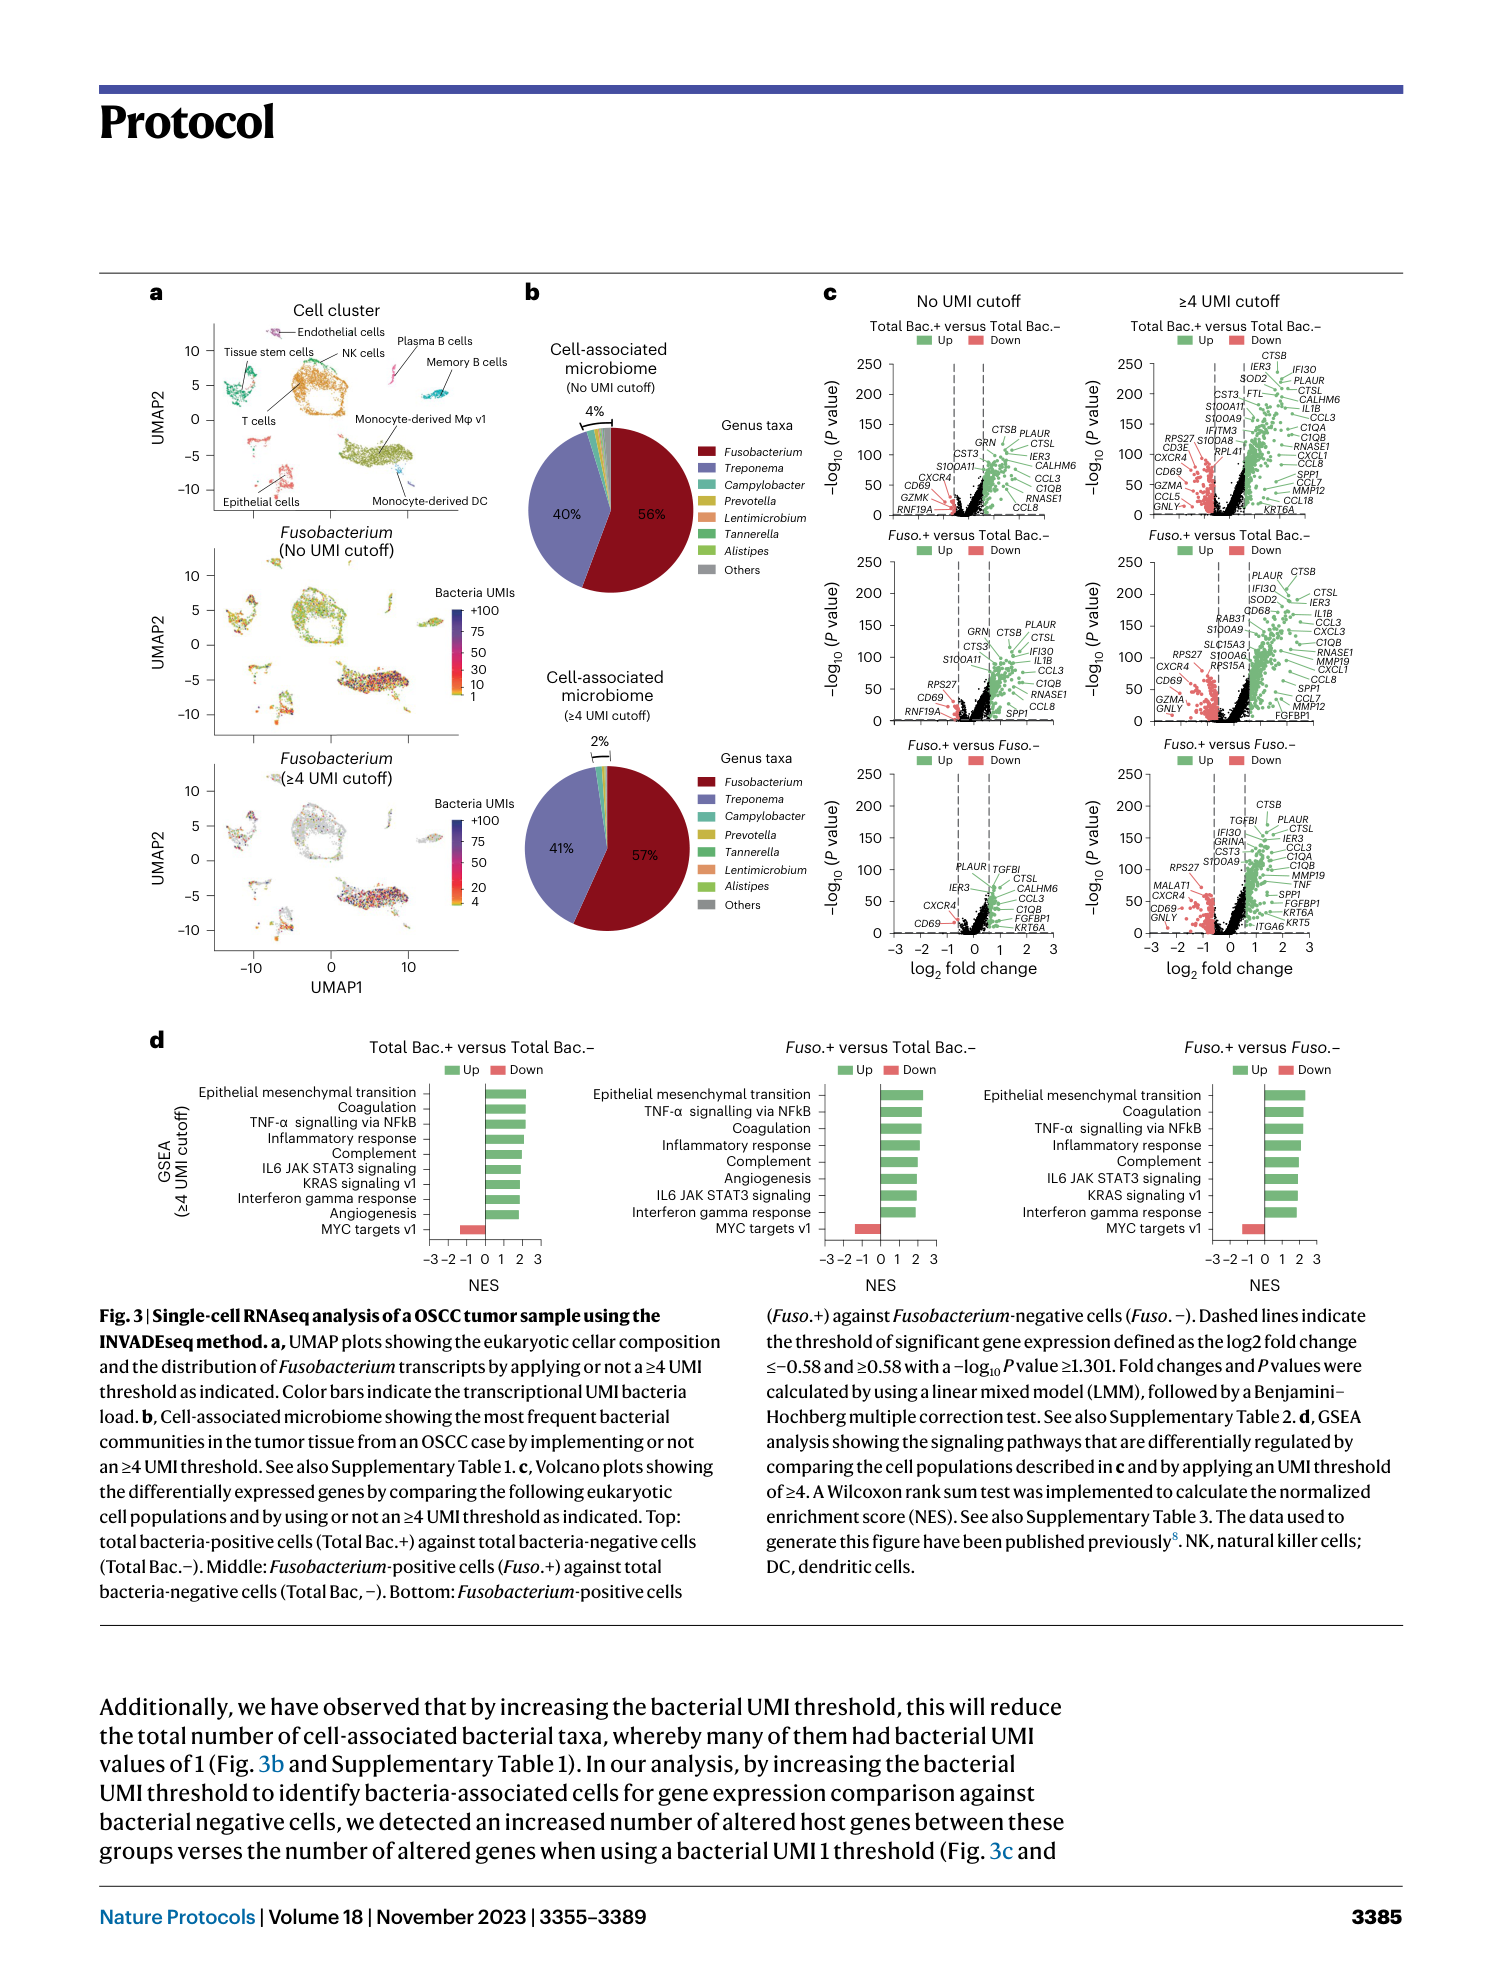
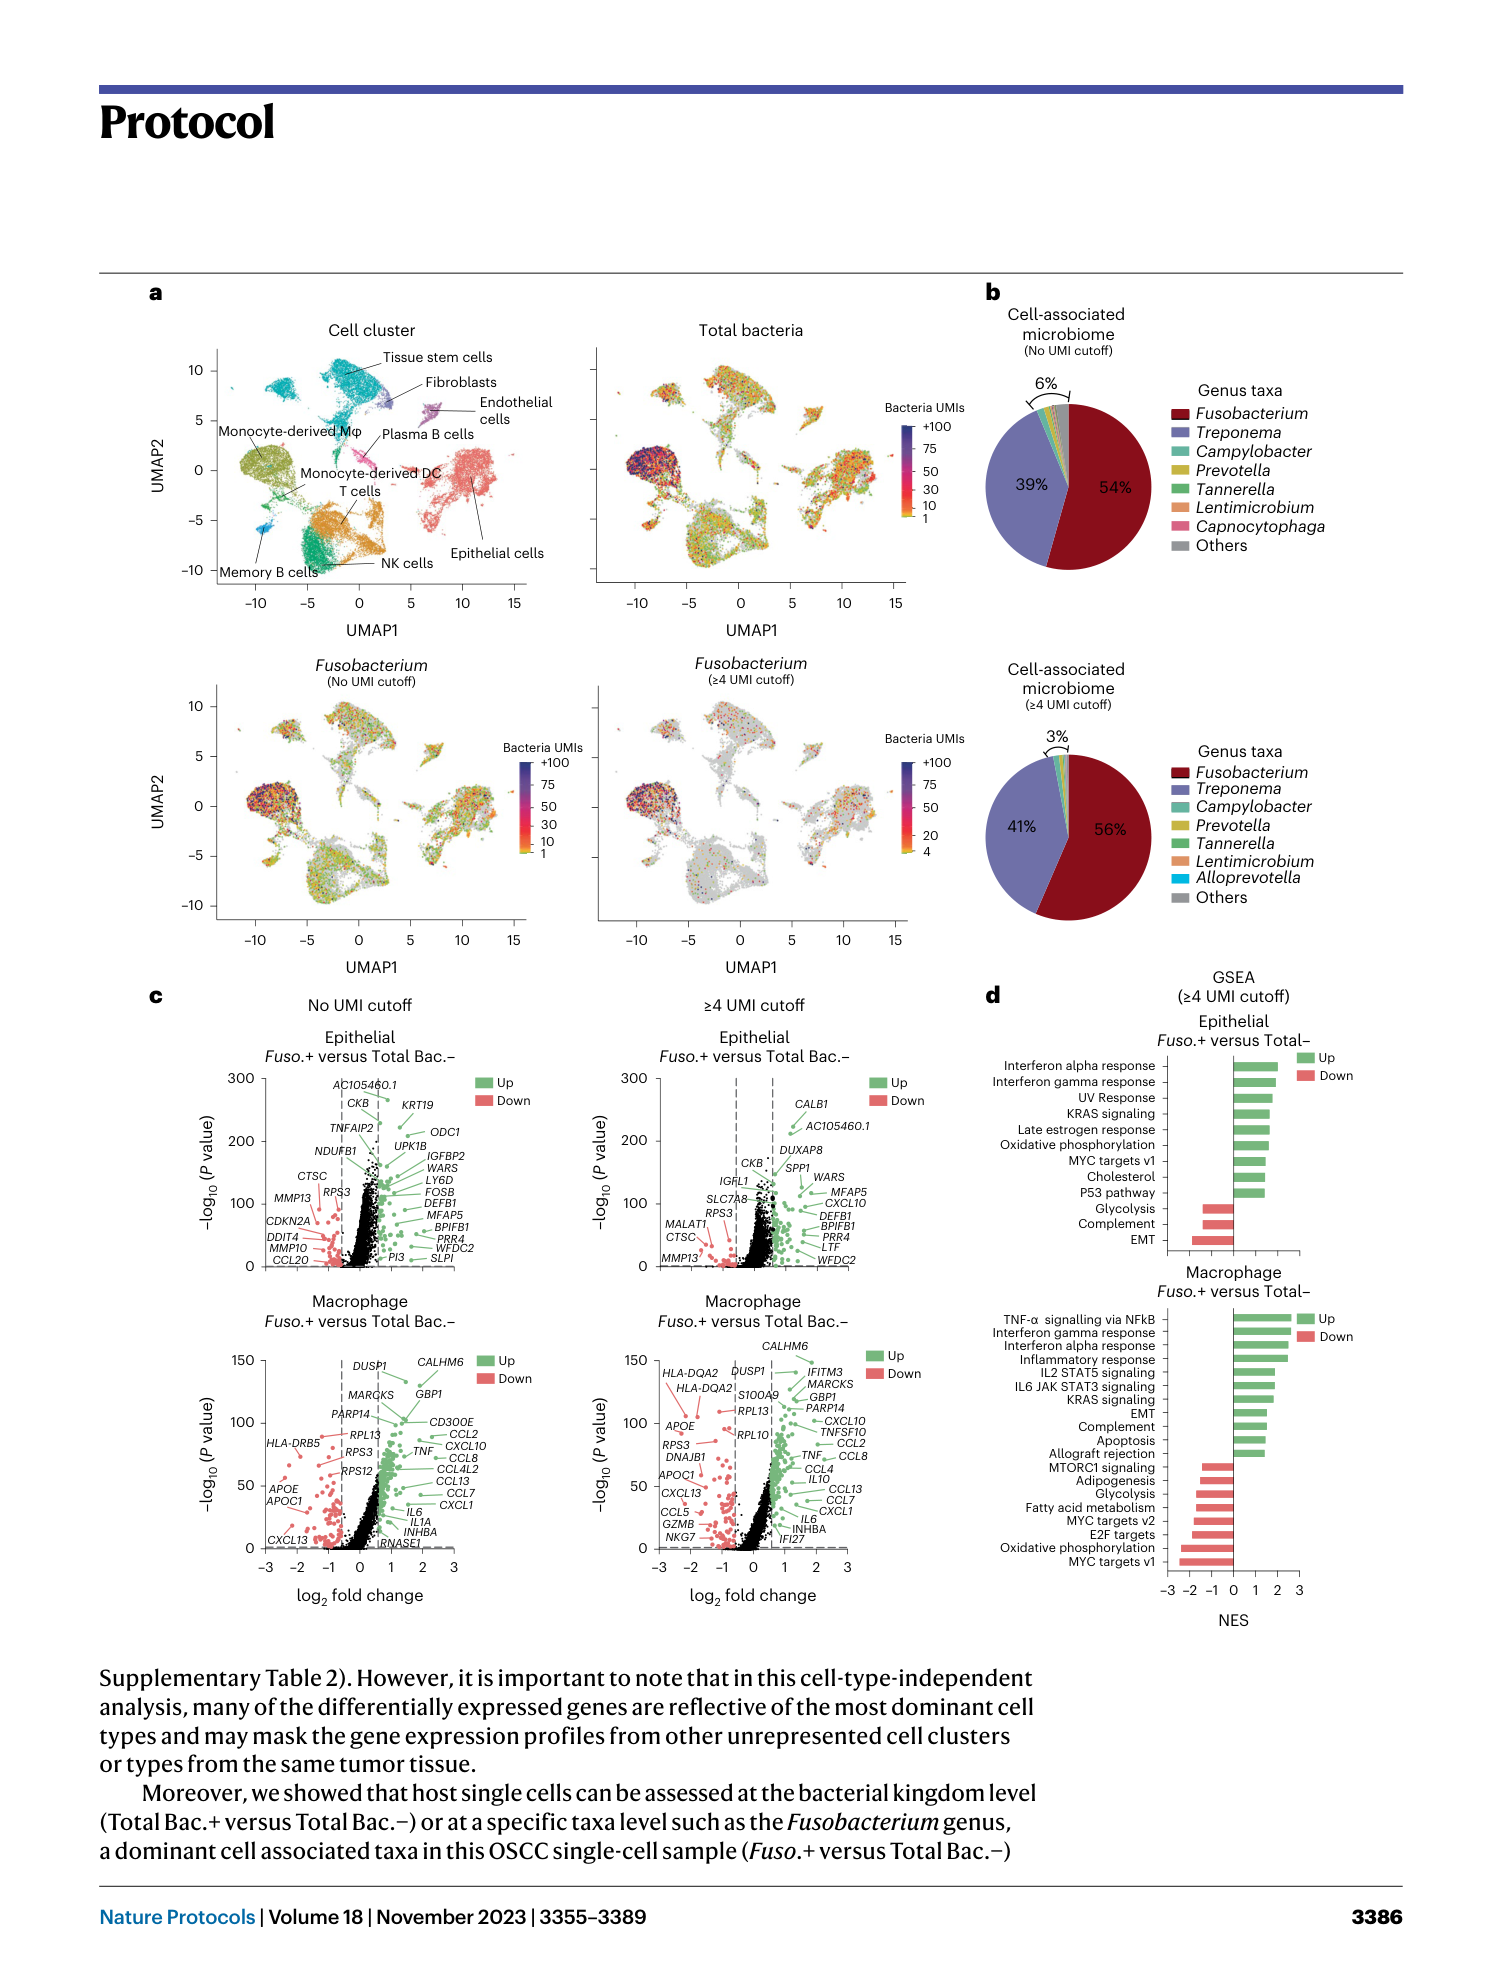
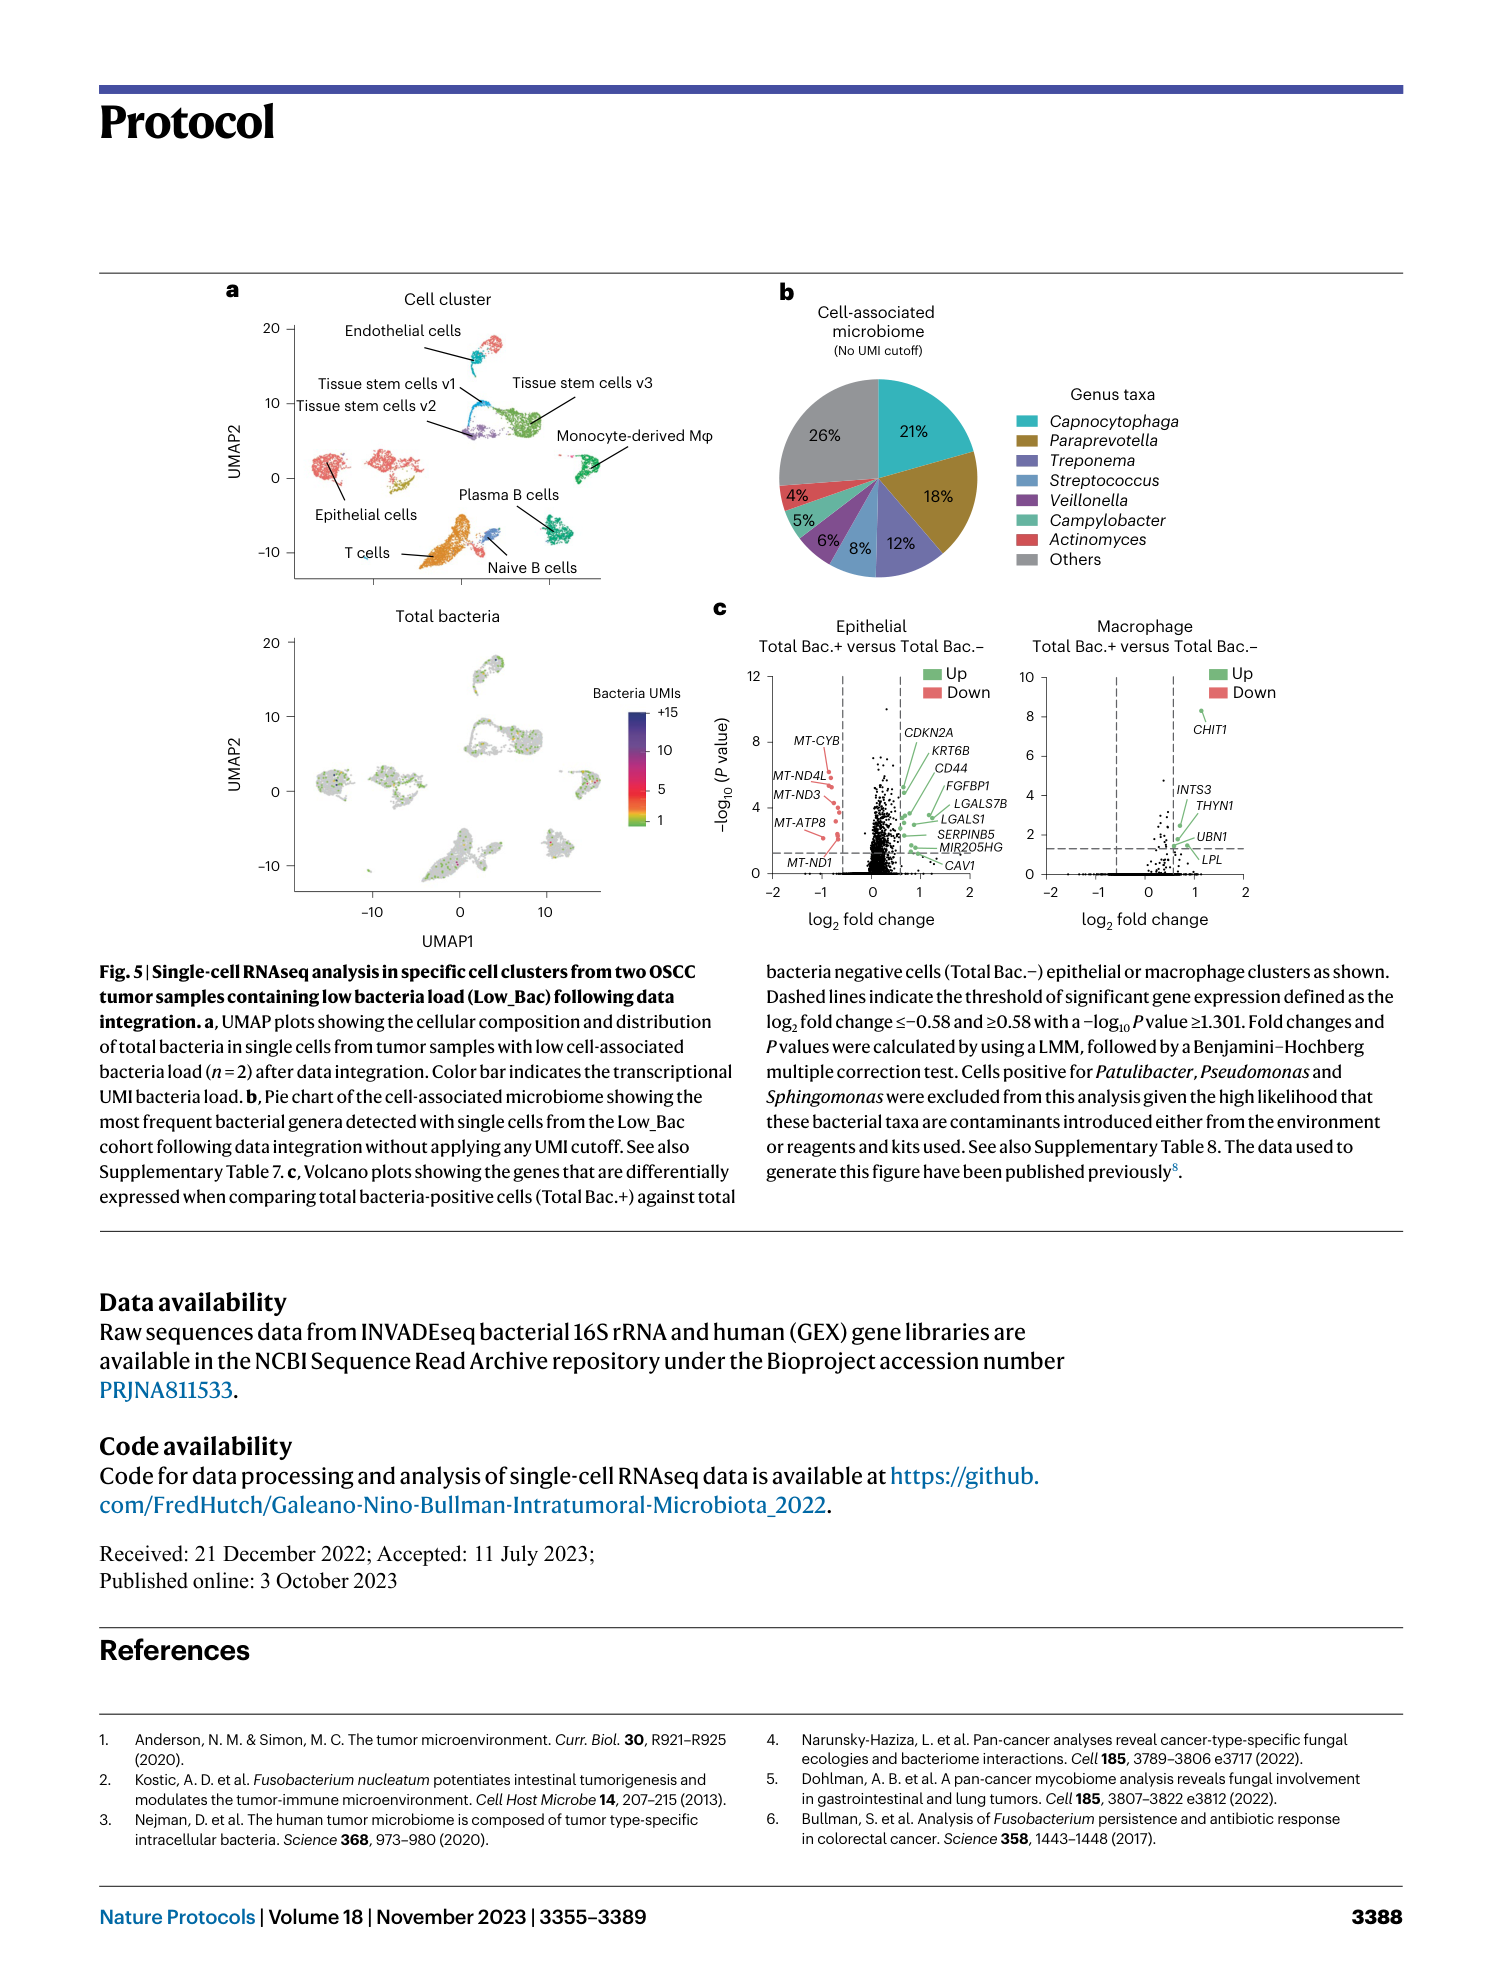
Supplementary Table 1: scRNAseq: cell-associated microbiome composition in an individual OSCC patient. The table indicates the microbiome composition in a OSCC sample, including the number of UMI transcripts for each bacterium per cell. The relative abundance (%) for each bacterium is plotted in Fig. 3b. The data used to generate this table has been published previously 8 . Supplementary Table 2: scRNAseq: gene expression profile for an individual OSCC patient. All cluster analysis. Differential expression analysis between cellular groups as shown in Fig. 3c. The analysis was performed using the FindMarker function from the Seurat package based on the Wilcoxon rank sum test. The log2 fold change is calculated based on the difference in the gene expression average between two groups. Adjusted P values were calculated using the Bonferroni correction test for each gene in the dataset. P values <0.05 indicate significant differential gene regulation between experimental conditions. The data used to generate this table have been published previously 8 . Supplementary Table 3 : scRNAseq: GSEA for an individual OSCC patient. All cluster analysis. GSEA between cellular groups as shown in Fig. 3d. The analysis was performed using the FindMarker function from the Seurat package based on the Wilcoxon rank sum test. The log2 fold change is calculated based on the difference in the gene expression average between two groups. Adjusted P values were calculated using the Bonferroni correction test for each gene in the dataset. P values <0.05 indicate significant differential gene regulation between experimental conditions. The data used to generate this table have been published previously 8 . Supplementary Table 4: scRNAseq. cell-associated microbiome composition from the high bacteria load OSCC cohort (High_Bac). The table indicates the microbiome composition in samples from the High_Bac cohort including the number of UMI transcripts for each bacterium. Relative abundance for each bacterium was plotted in Fig. 4b. The data used to generate this table have been published previously 8 . Supplementary Table 5: scRNAseq: gene expression profile in specific cell clusters from the high bacteria load OSCC cohort (High_Bac). Integrated data. Differential expression analysis between cellular groups as shown in Fig. 4c. The analysis was performed using the FindMarker function from the Seurat package based on the Wilcoxon rank sum test. The log2 fold change is calculated based on the difference in the gene expression average between two groups. Adjusted P values were calculated using the Bonferroni correction test for each gene in the dataset. P values <0.05 indicate significant differential gene regulation between experimental conditions. The data used to generate this table have been published previously 8 . Supplementary Table 6: scRNAseq: GSEA for specific cell clusters from the high bacteria load OSCC cohort (High_Bac). Integrated data. GSEA between cellular groups as shown in Fig. 4d. The analysis was performed using the FindMarker function from the Seurat package based on the Wilcoxon Rank Sum test. The log2 fold change is calculated based on the difference in the gene expression average between two groups. Adjusted P values were calculated using the Bonferroni correction test for each gene in the dataset. P values <0.05 indicate significant differential gene regulation between experimental conditions. The data used to generate this table have been published previously 8 . Supplementary Table 7: scRNAseq: cell-associated microbiome composition from the low bacterial load OSCC cohort (Low_Bac). The table indicates the microbiome composition in samples from the Low_Bac cohort including the number of UMI transcripts for each bacterium. The relative abundance (%) for each bacterium was plotted in Fig. 5b. The data used to generate this table have been published previously 8 . Supplementary Table 8: scRNAseq: gene expression profile in specific cell clusters from the low bacteria load OSCC cohort (Low_Bac). Integrated data. Differential expression analysis between cellular groups as shown in Fig. 5c. The analysis was performed using the FindMarker function from the Seurat package based on the Wilcoxon rank sum test. The log2 fold change is calculated based on the difference in the gene expression average between two groups. Adjusted P values were calculated using the Bonferroni correction test for each gene in the dataset. P values <0.05 indicate significant differential gene regulation between experimental conditions. The data used to generate this table have been published previously 8 .
