A guide to precise measurements of isotope abundance by ESI-Orbitrap MS
Kristýna Kantnerová, Nils Kuhlbusch, Dieter Juchelka, Andreas Hilkert, Sebastian Kopf, Cajetan Neubauer

Extended
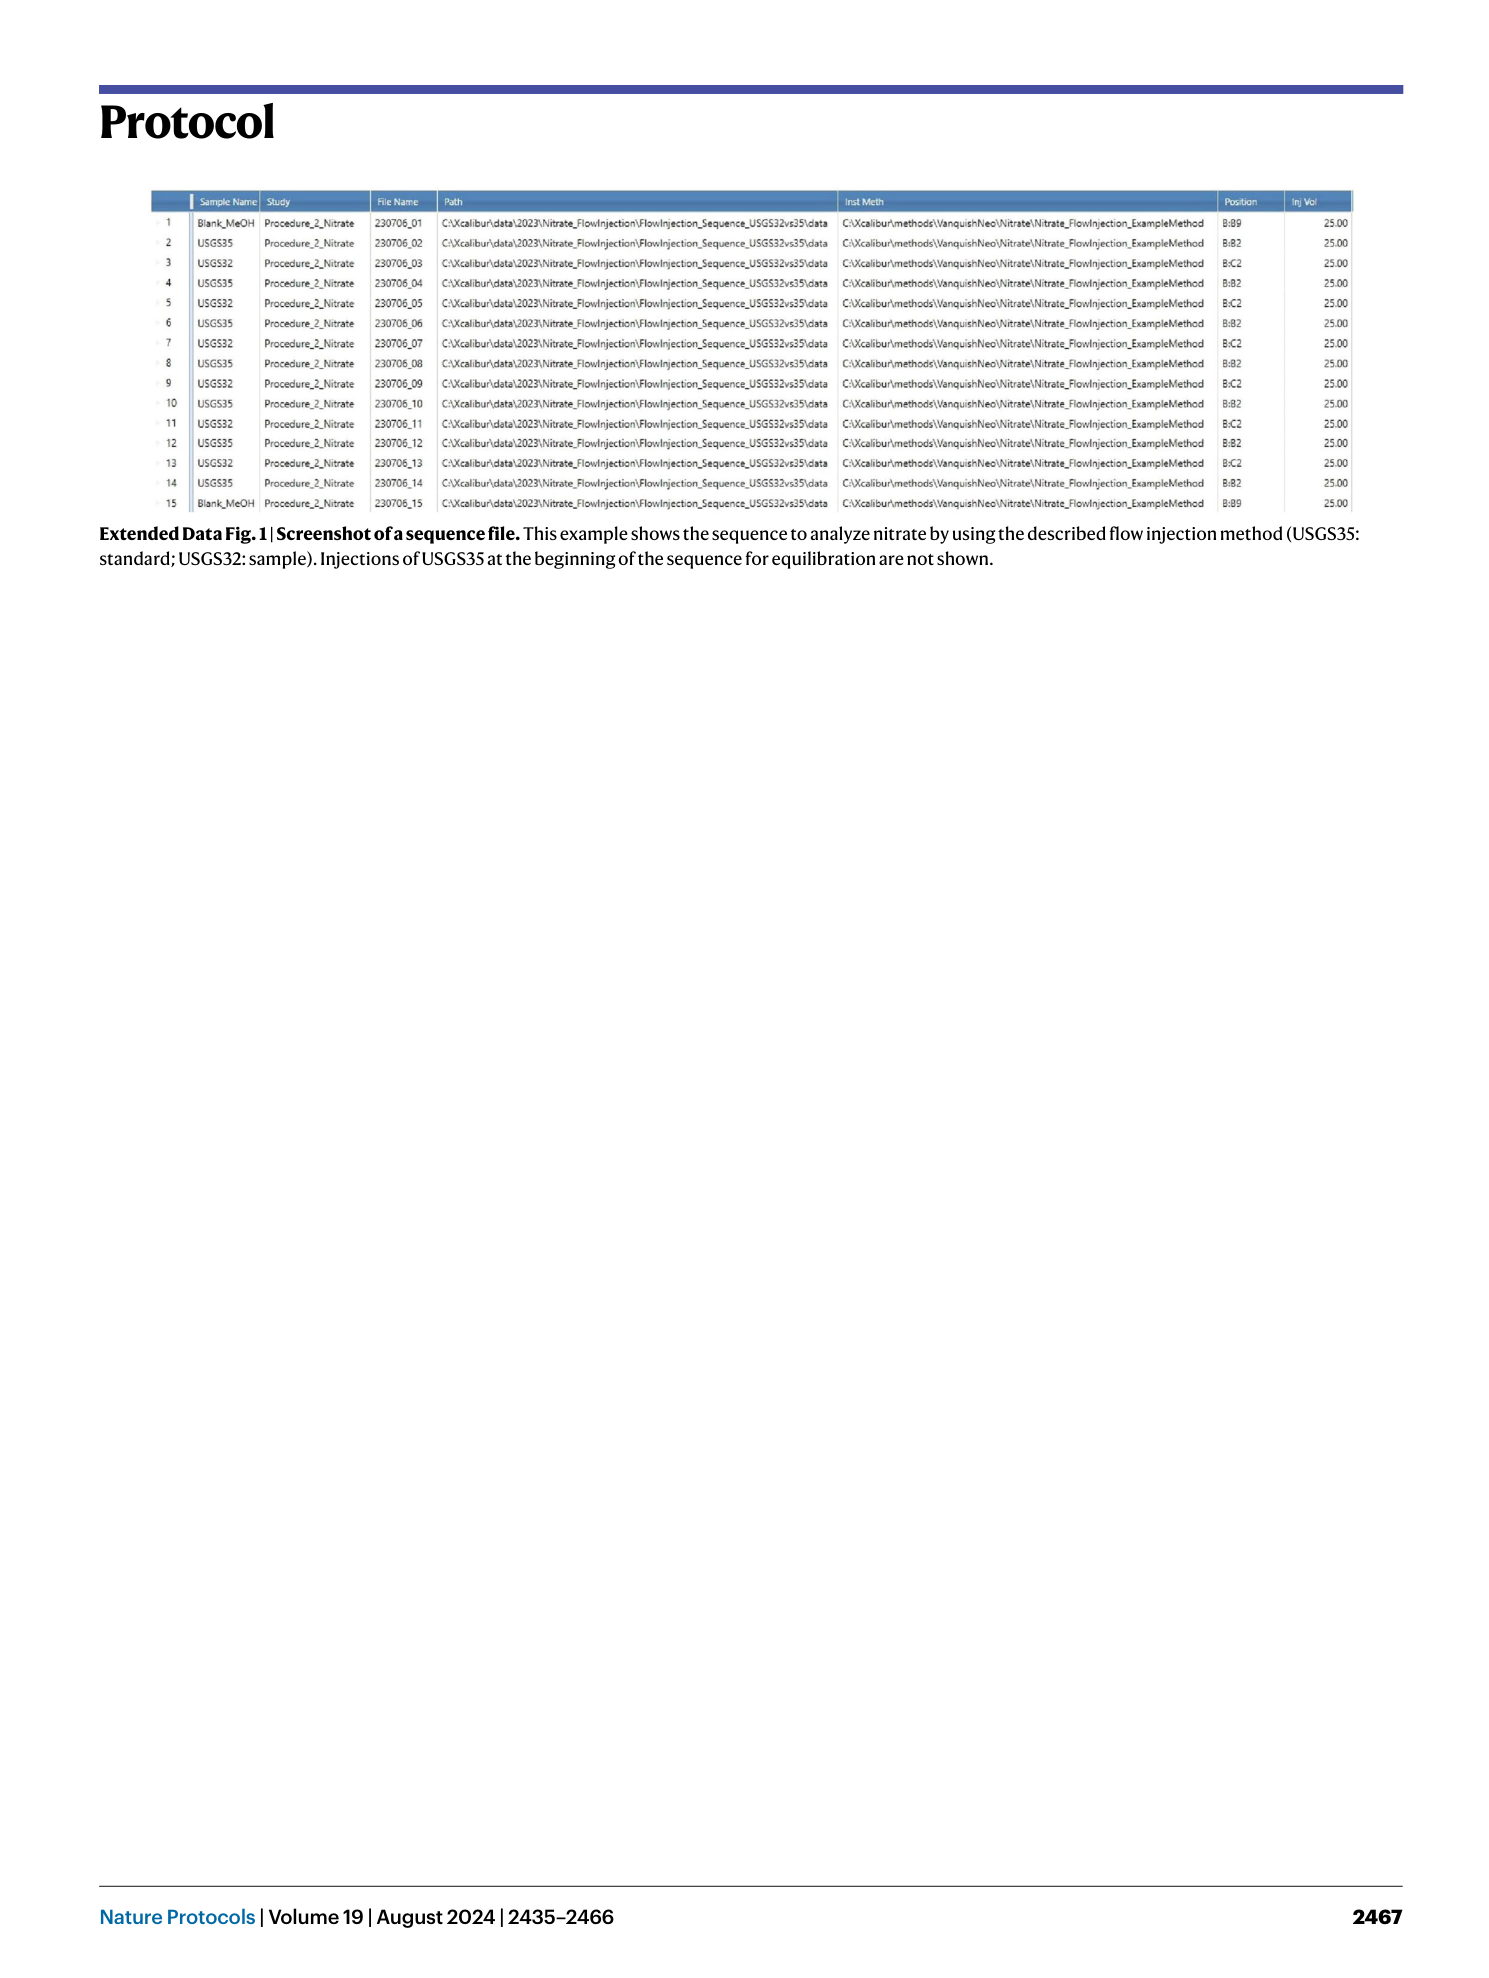
Extended Data Fig. 1 Screenshot of a sequence file.
This example shows the sequence to analyze nitrate by using the described flow injection method (USGS35: standard; USGS32: sample). Injections of USGS35 at the beginning of the sequence for equilibration are not shown.
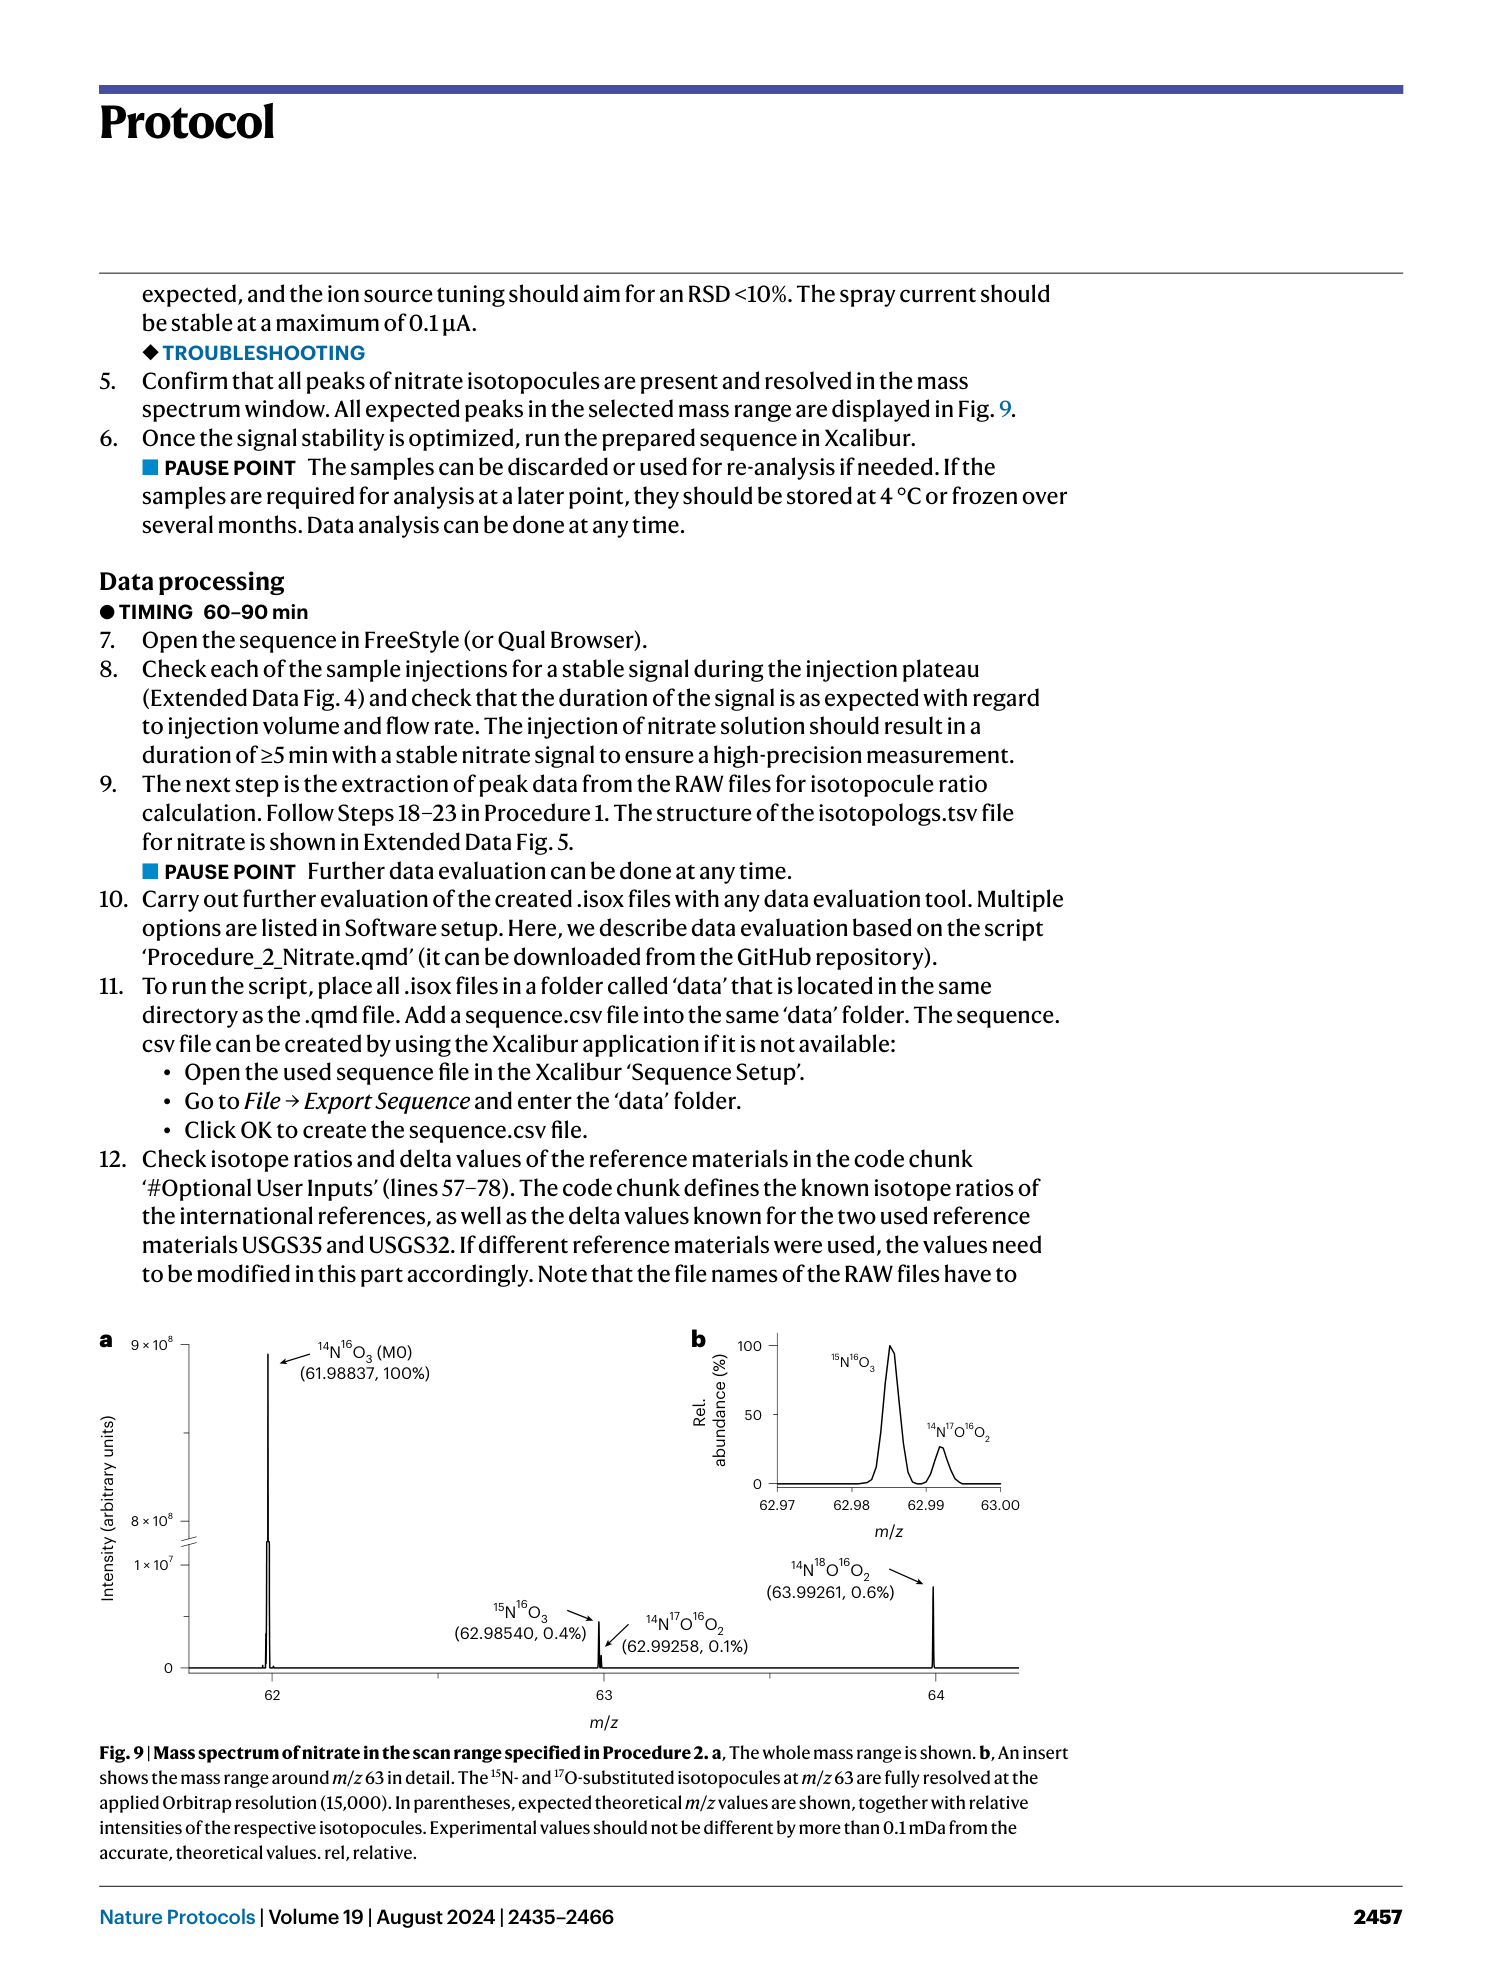
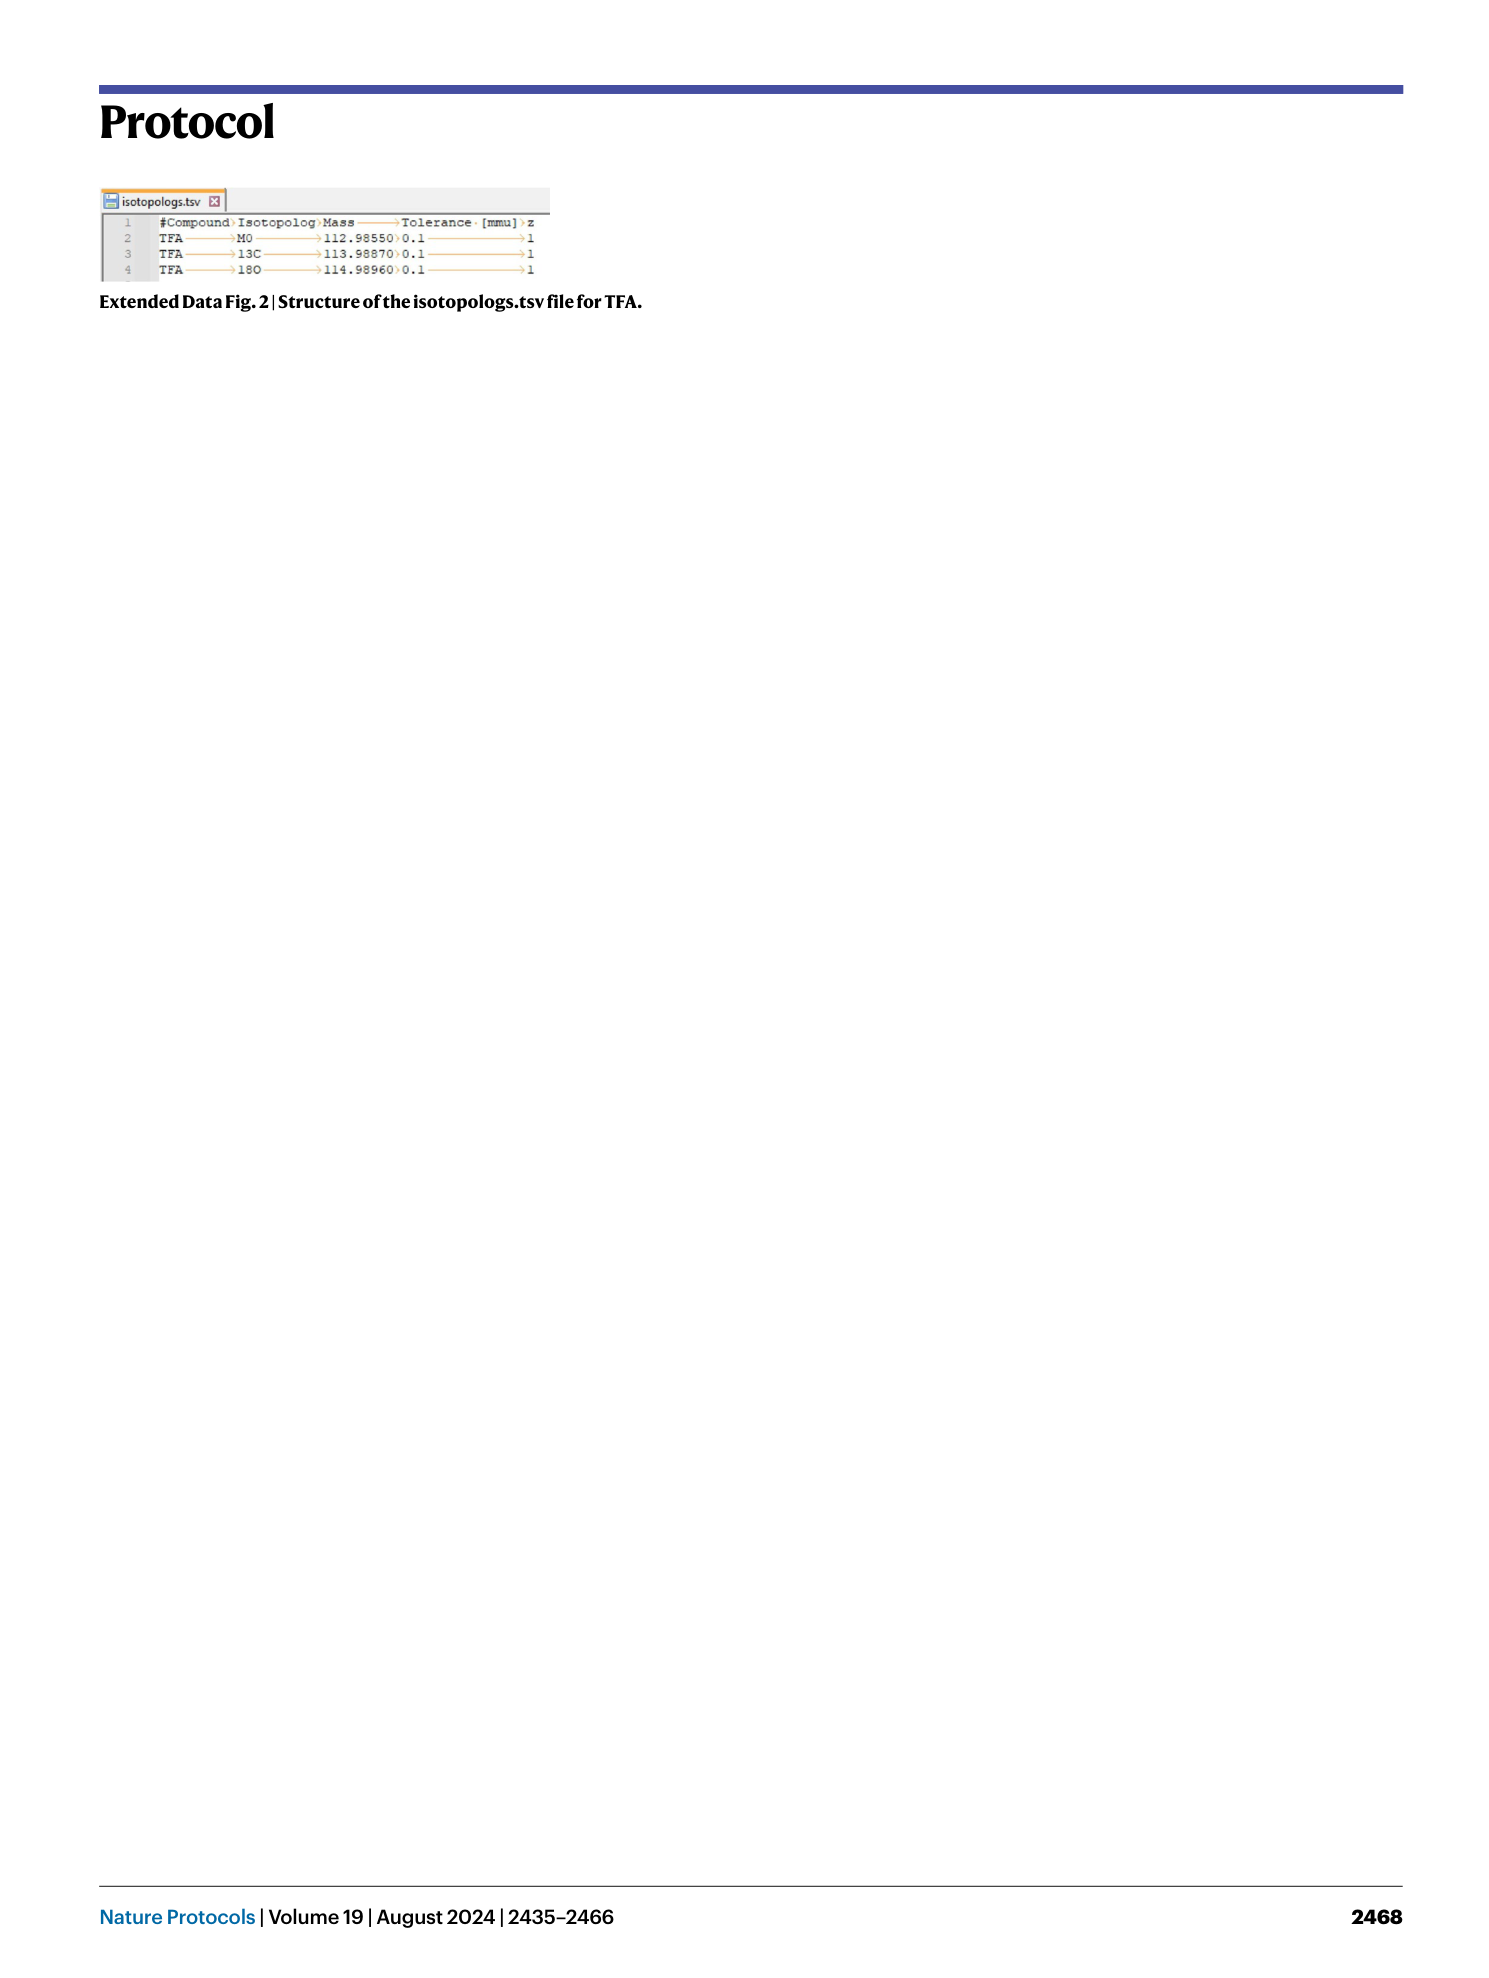
Extended Data Fig. 2
Structure of the isotopologs.tsv file for TFA.
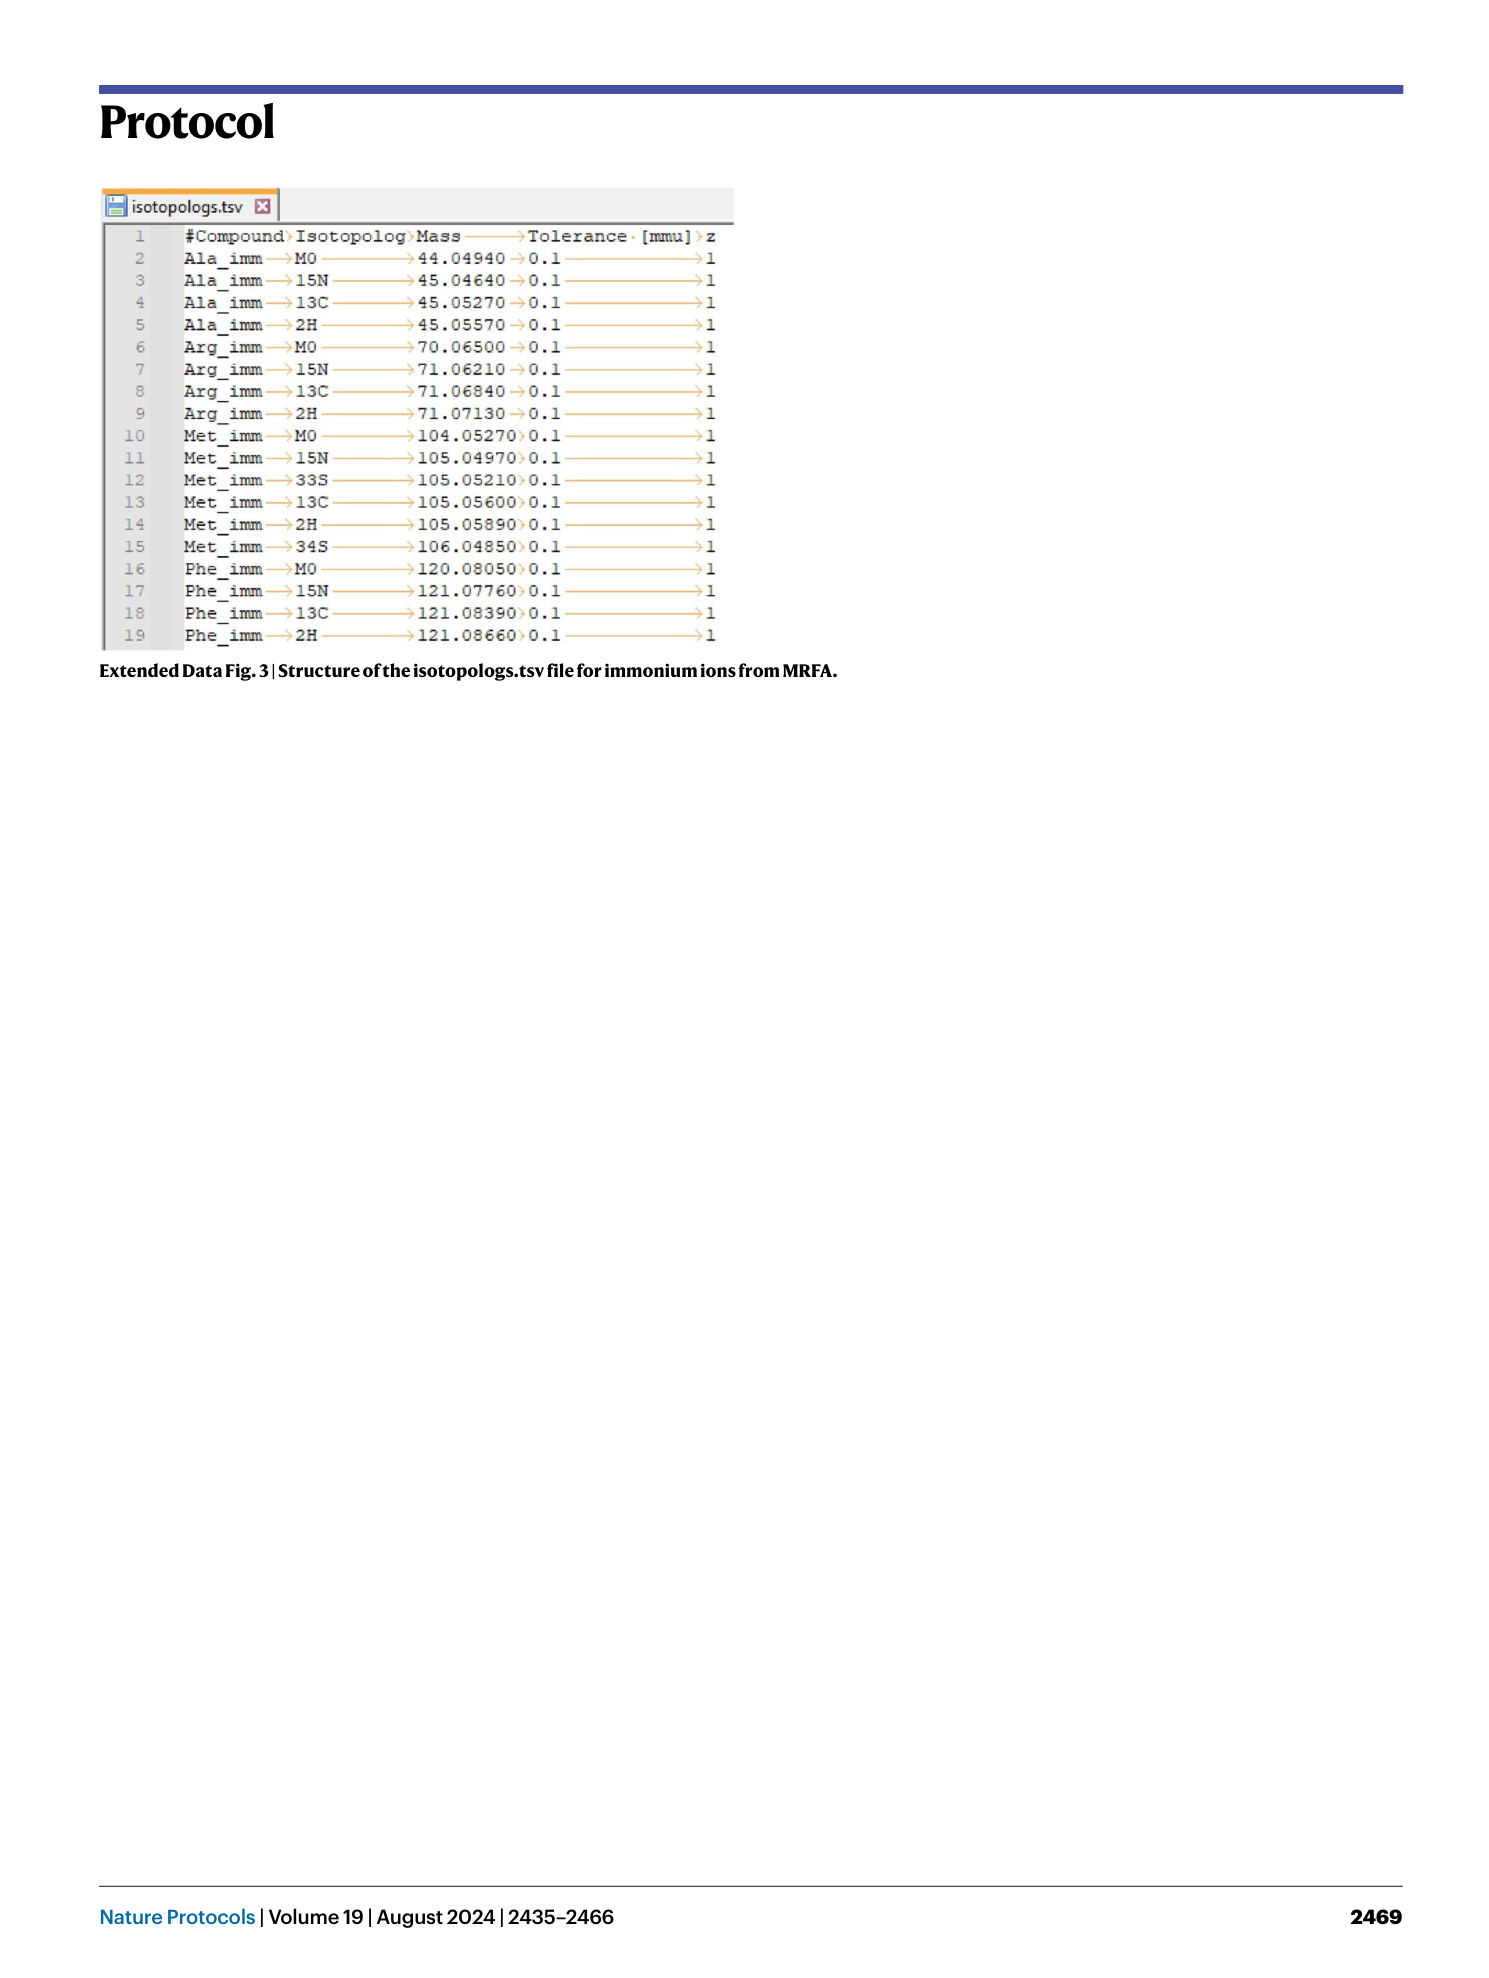
Extended Data Fig. 3
Structure of the isotopologs.tsv file for immonium ions from MRFA.
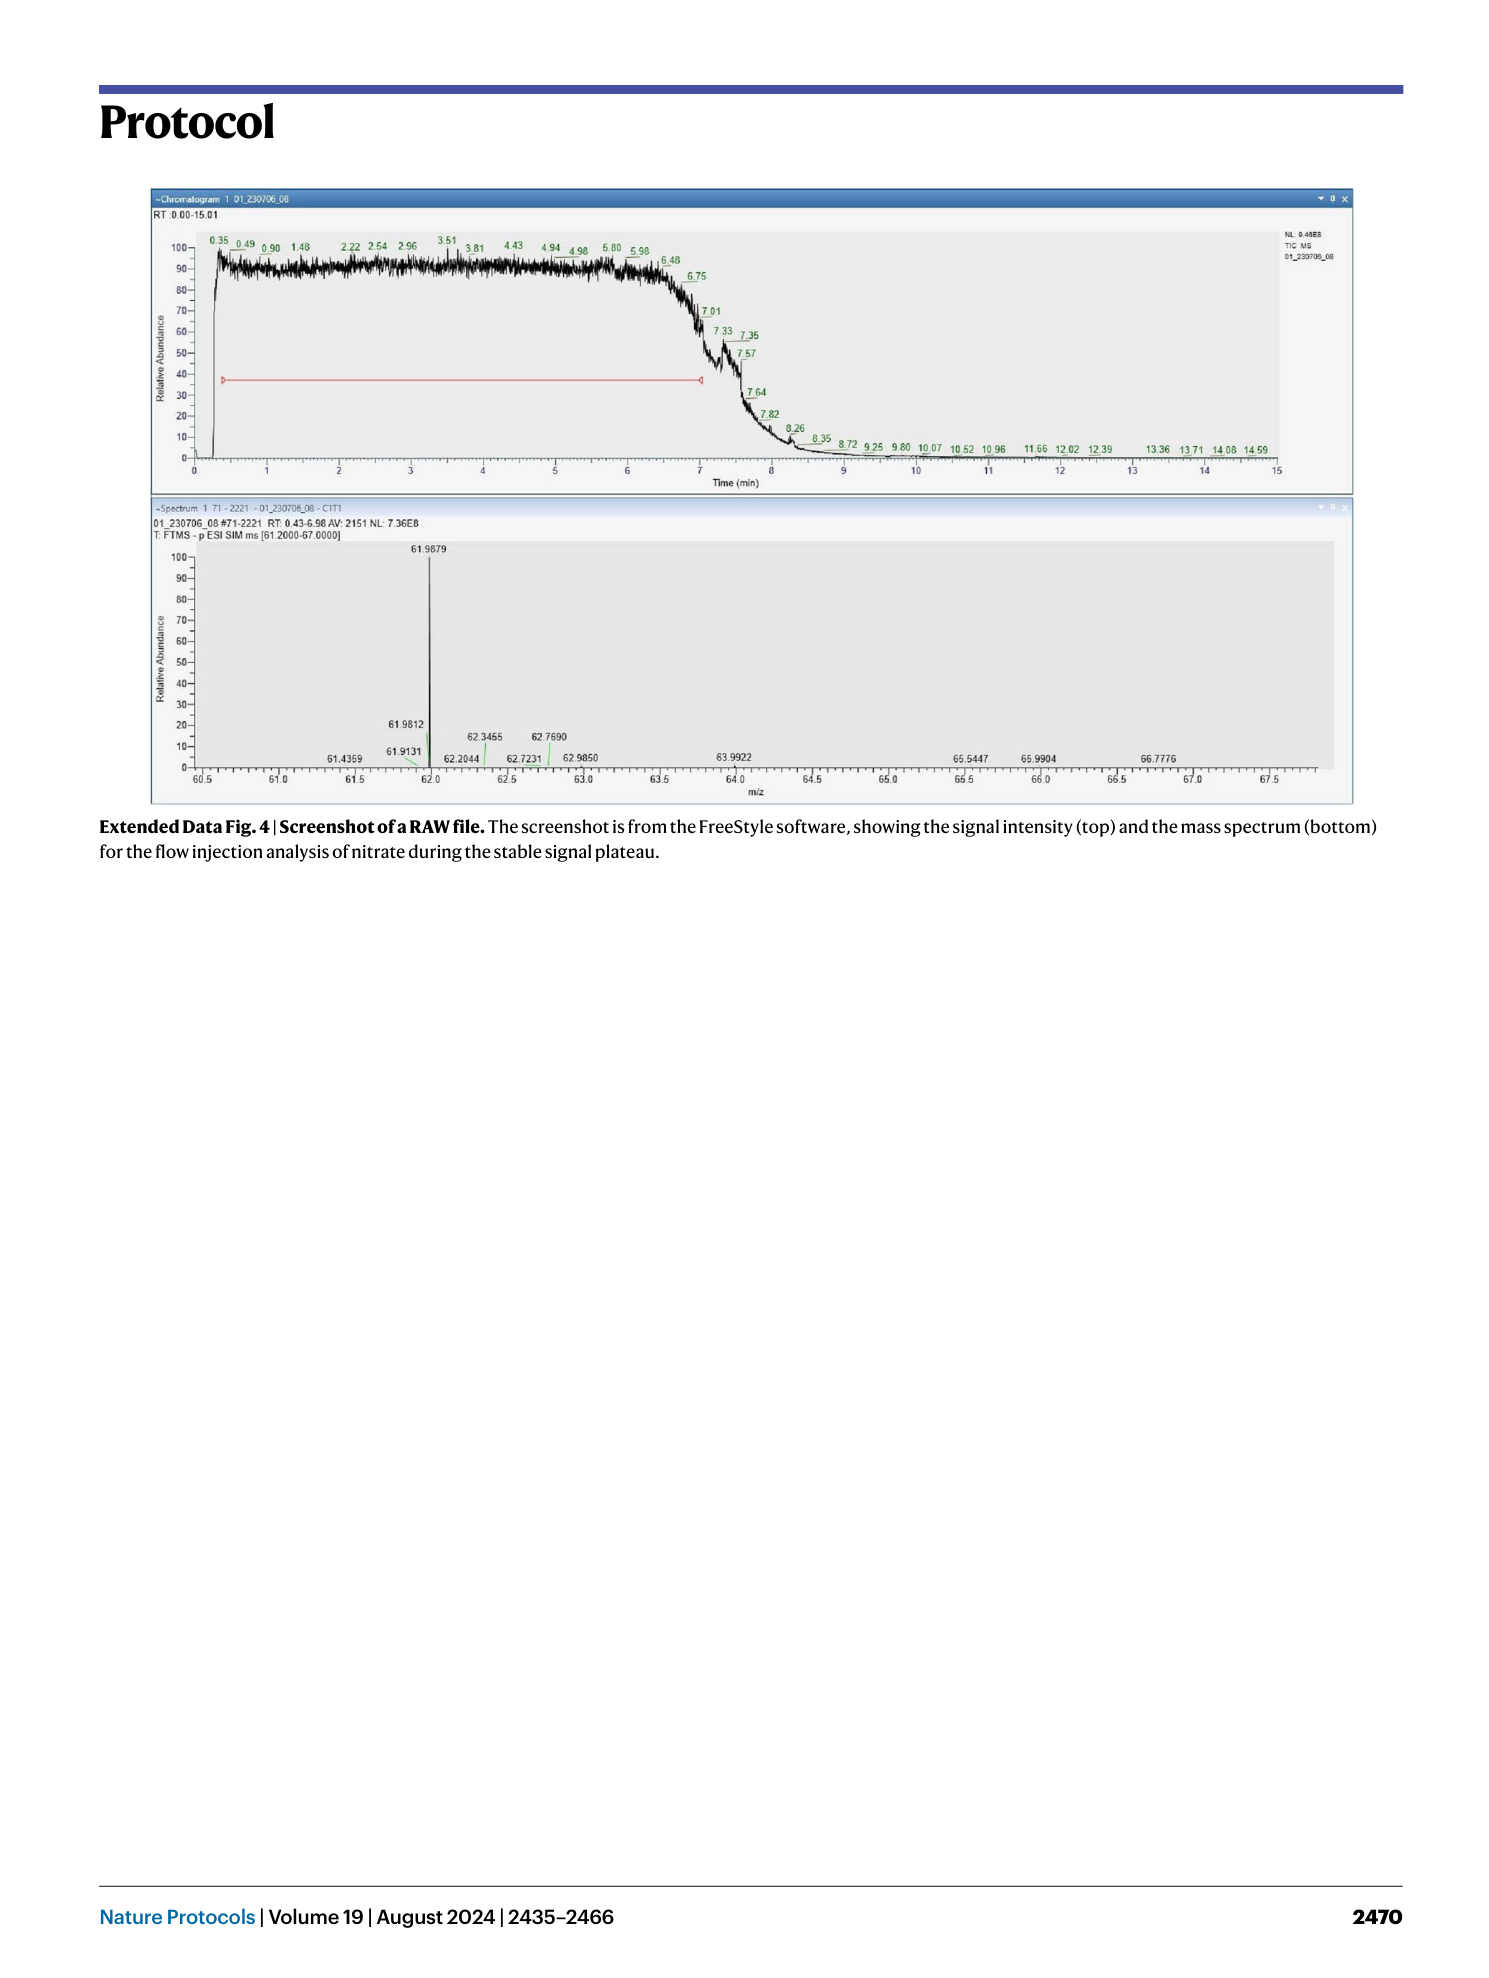
Extended Data Fig. 4 Screenshot of a RAW file.
The screenshot is from the FreeStyle software, showing the signal intensity (top) and the mass spectrum (bottom) for the flow injection analysis of nitrate during the stable signal plateau.
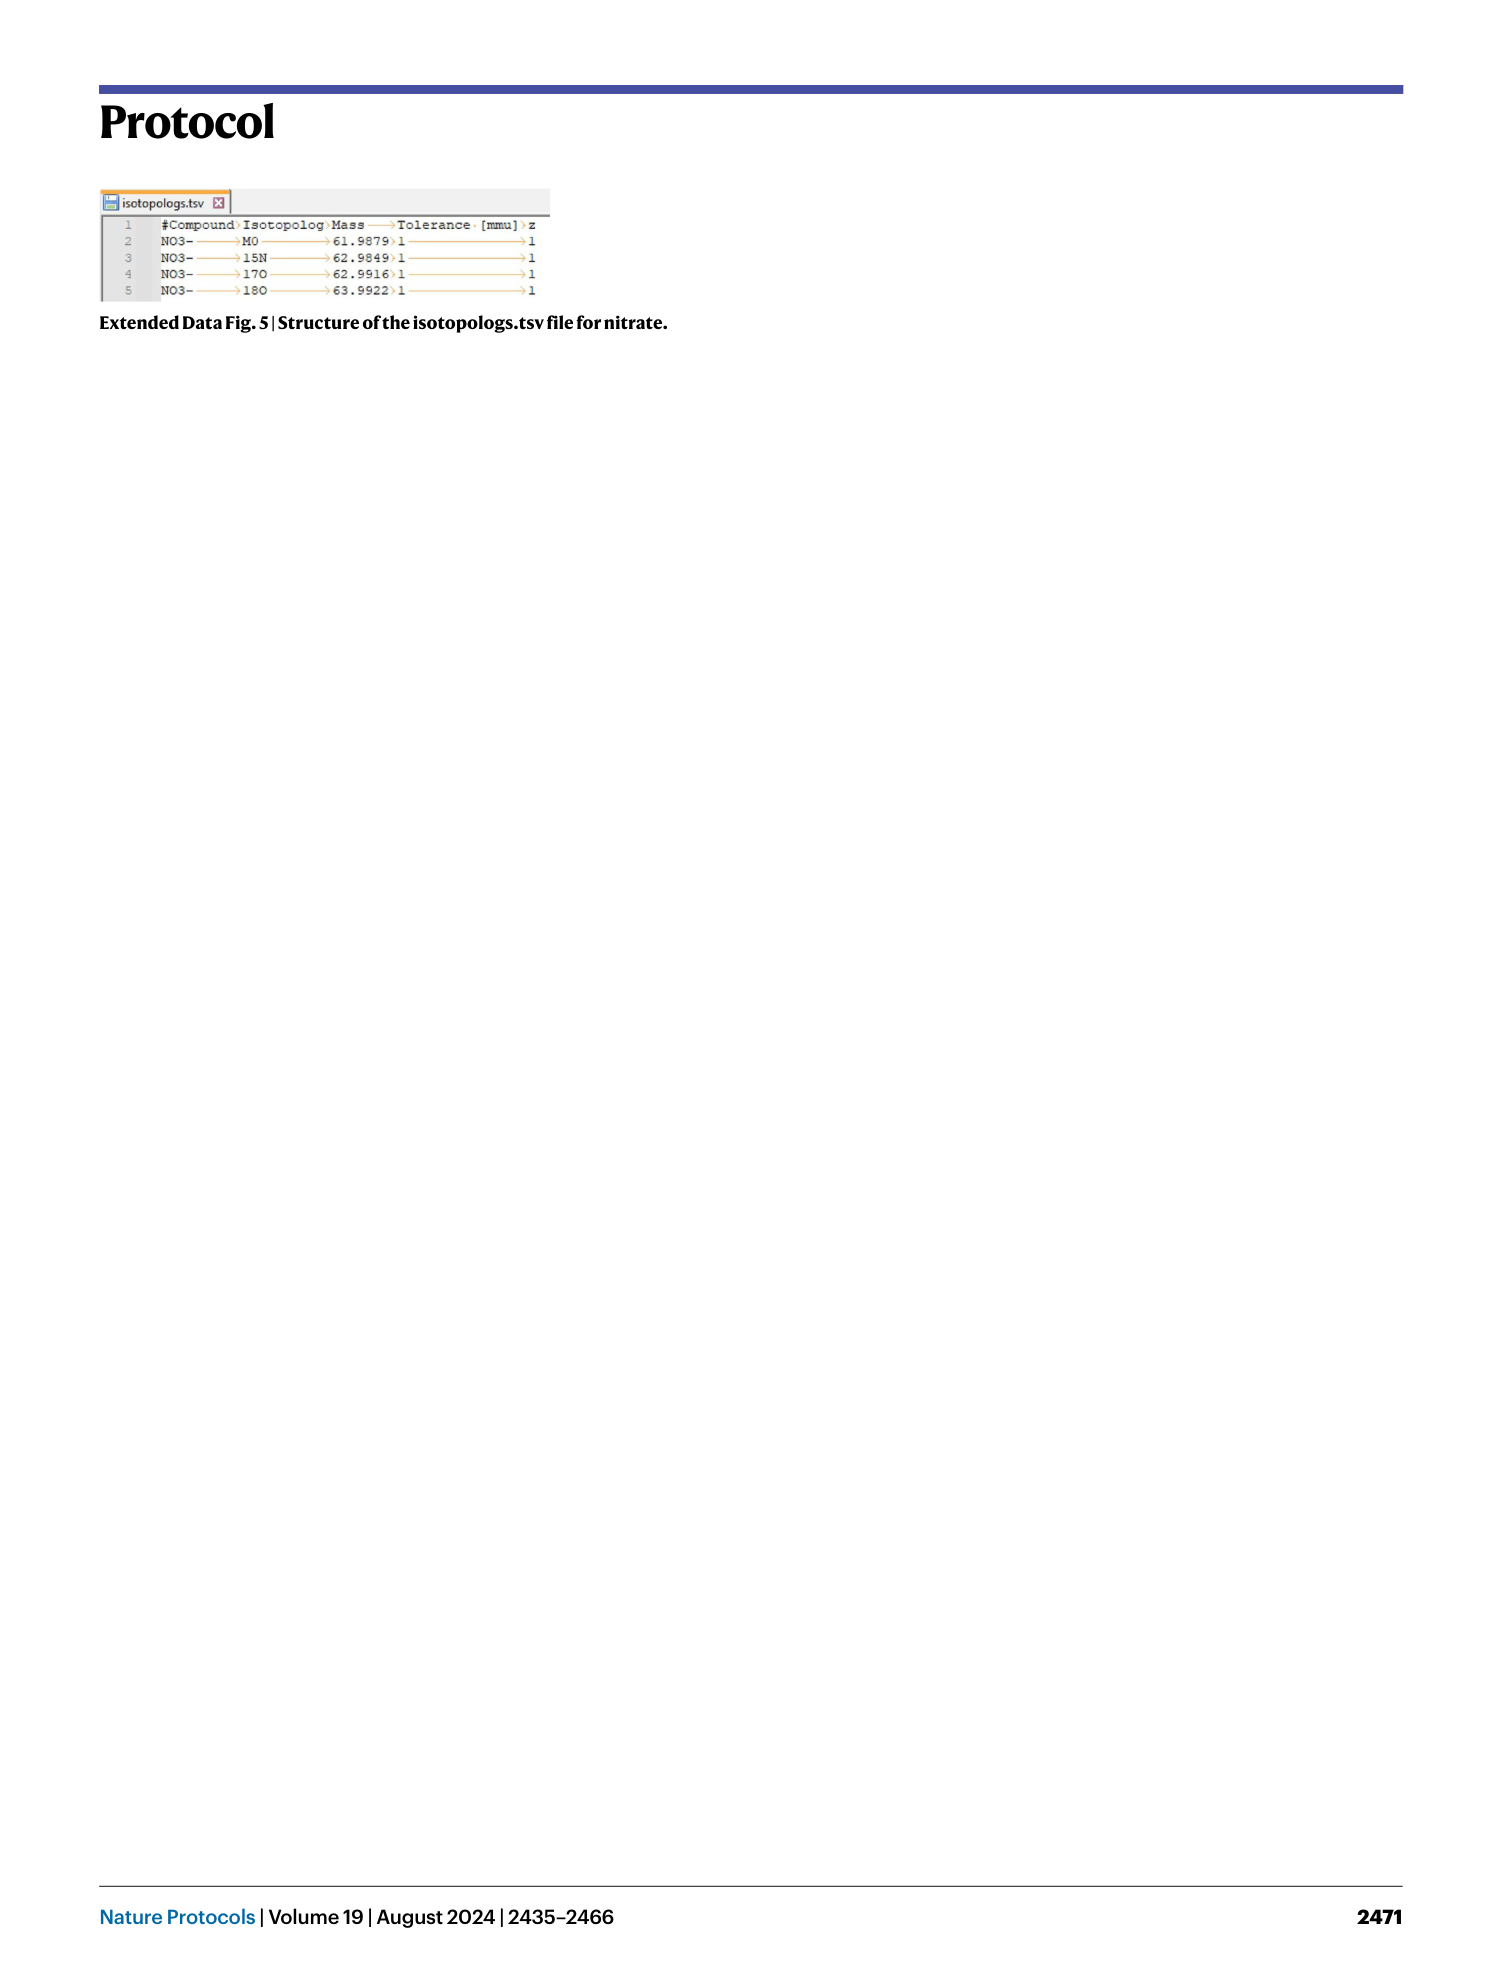
Extended Data Fig. 5
Structure of the isotopologs.tsv file for nitrate.
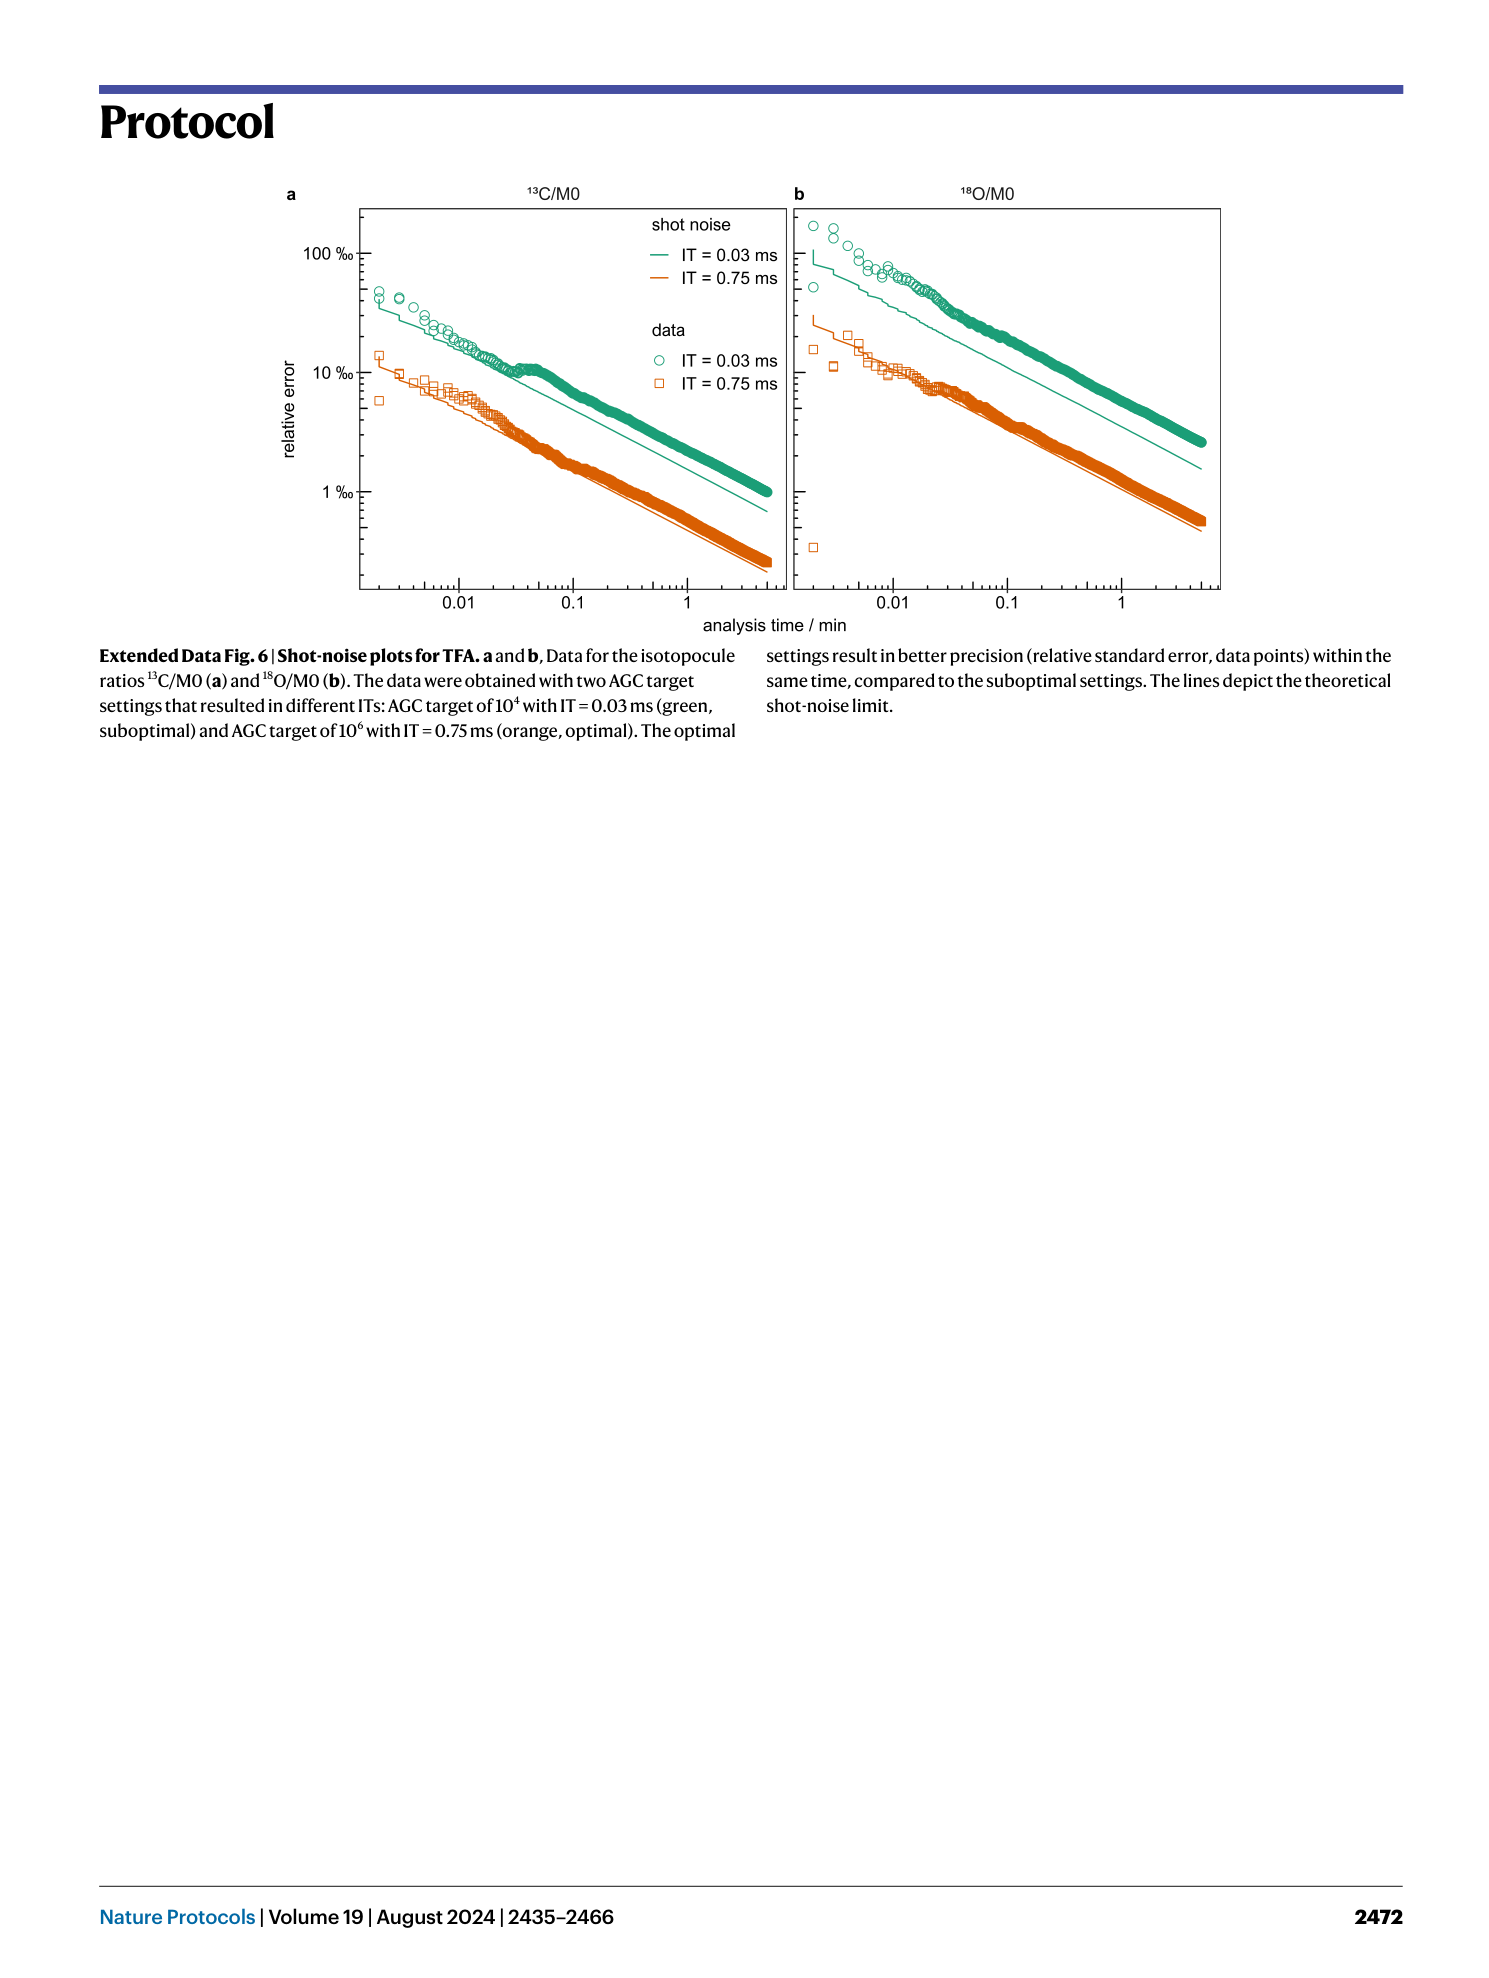
Extended Data Fig. 6 Shot-noise plots for TFA.
a and b , Data for the isotopocule ratios 13 C/M0 ( a ) and 18 O/M0 ( b ). The data were obtained with two AGC target settings that resulted in different ITs: AGC target of 10 4 with IT = 0.03 ms (green, suboptimal) and AGC target of 10 6 with IT = 0.75 ms (orange, optimal). The optimal settings result in better precision (relative standard error, data points) within the same time, compared to the suboptimal settings. The lines depict the theoretical shot-noise limit.
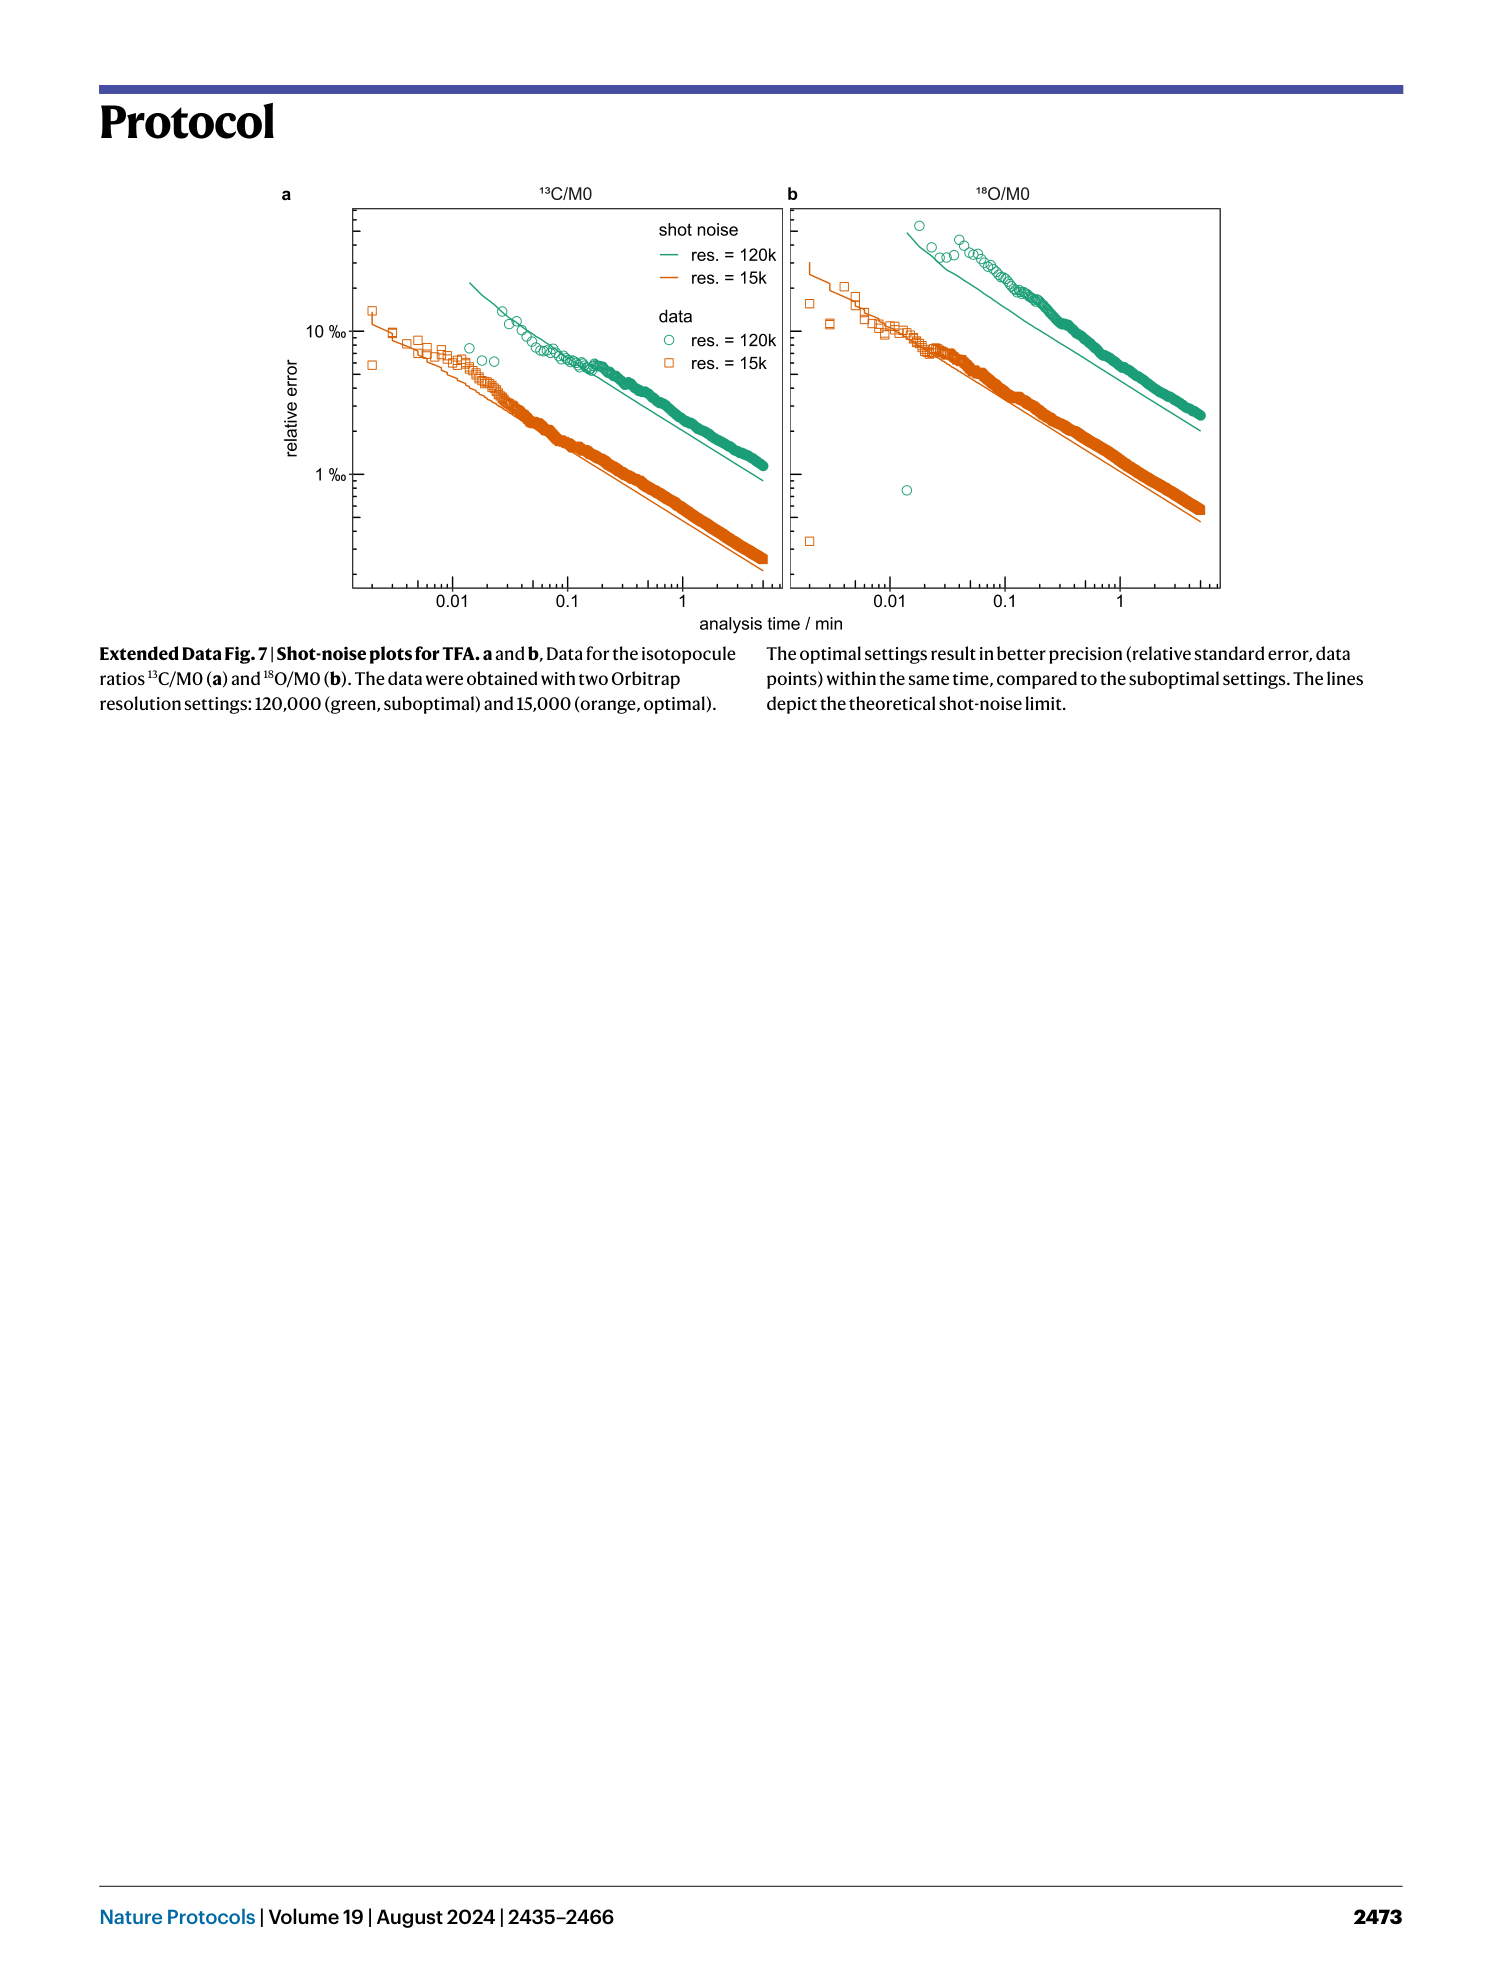
Extended Data Fig. 7 Shot-noise plots for TFA.
a and b , Data for the isotopocule ratios 13 C/M0 ( a ) and 18 O/M0 ( b ). The data were obtained with two Orbitrap resolution settings: 120,000 (green, suboptimal) and 15,000 (orange, optimal). The optimal settings result in better precision (relative standard error, data points) within the same time, compared to the suboptimal settings. The lines depict the theoretical shot-noise limit.
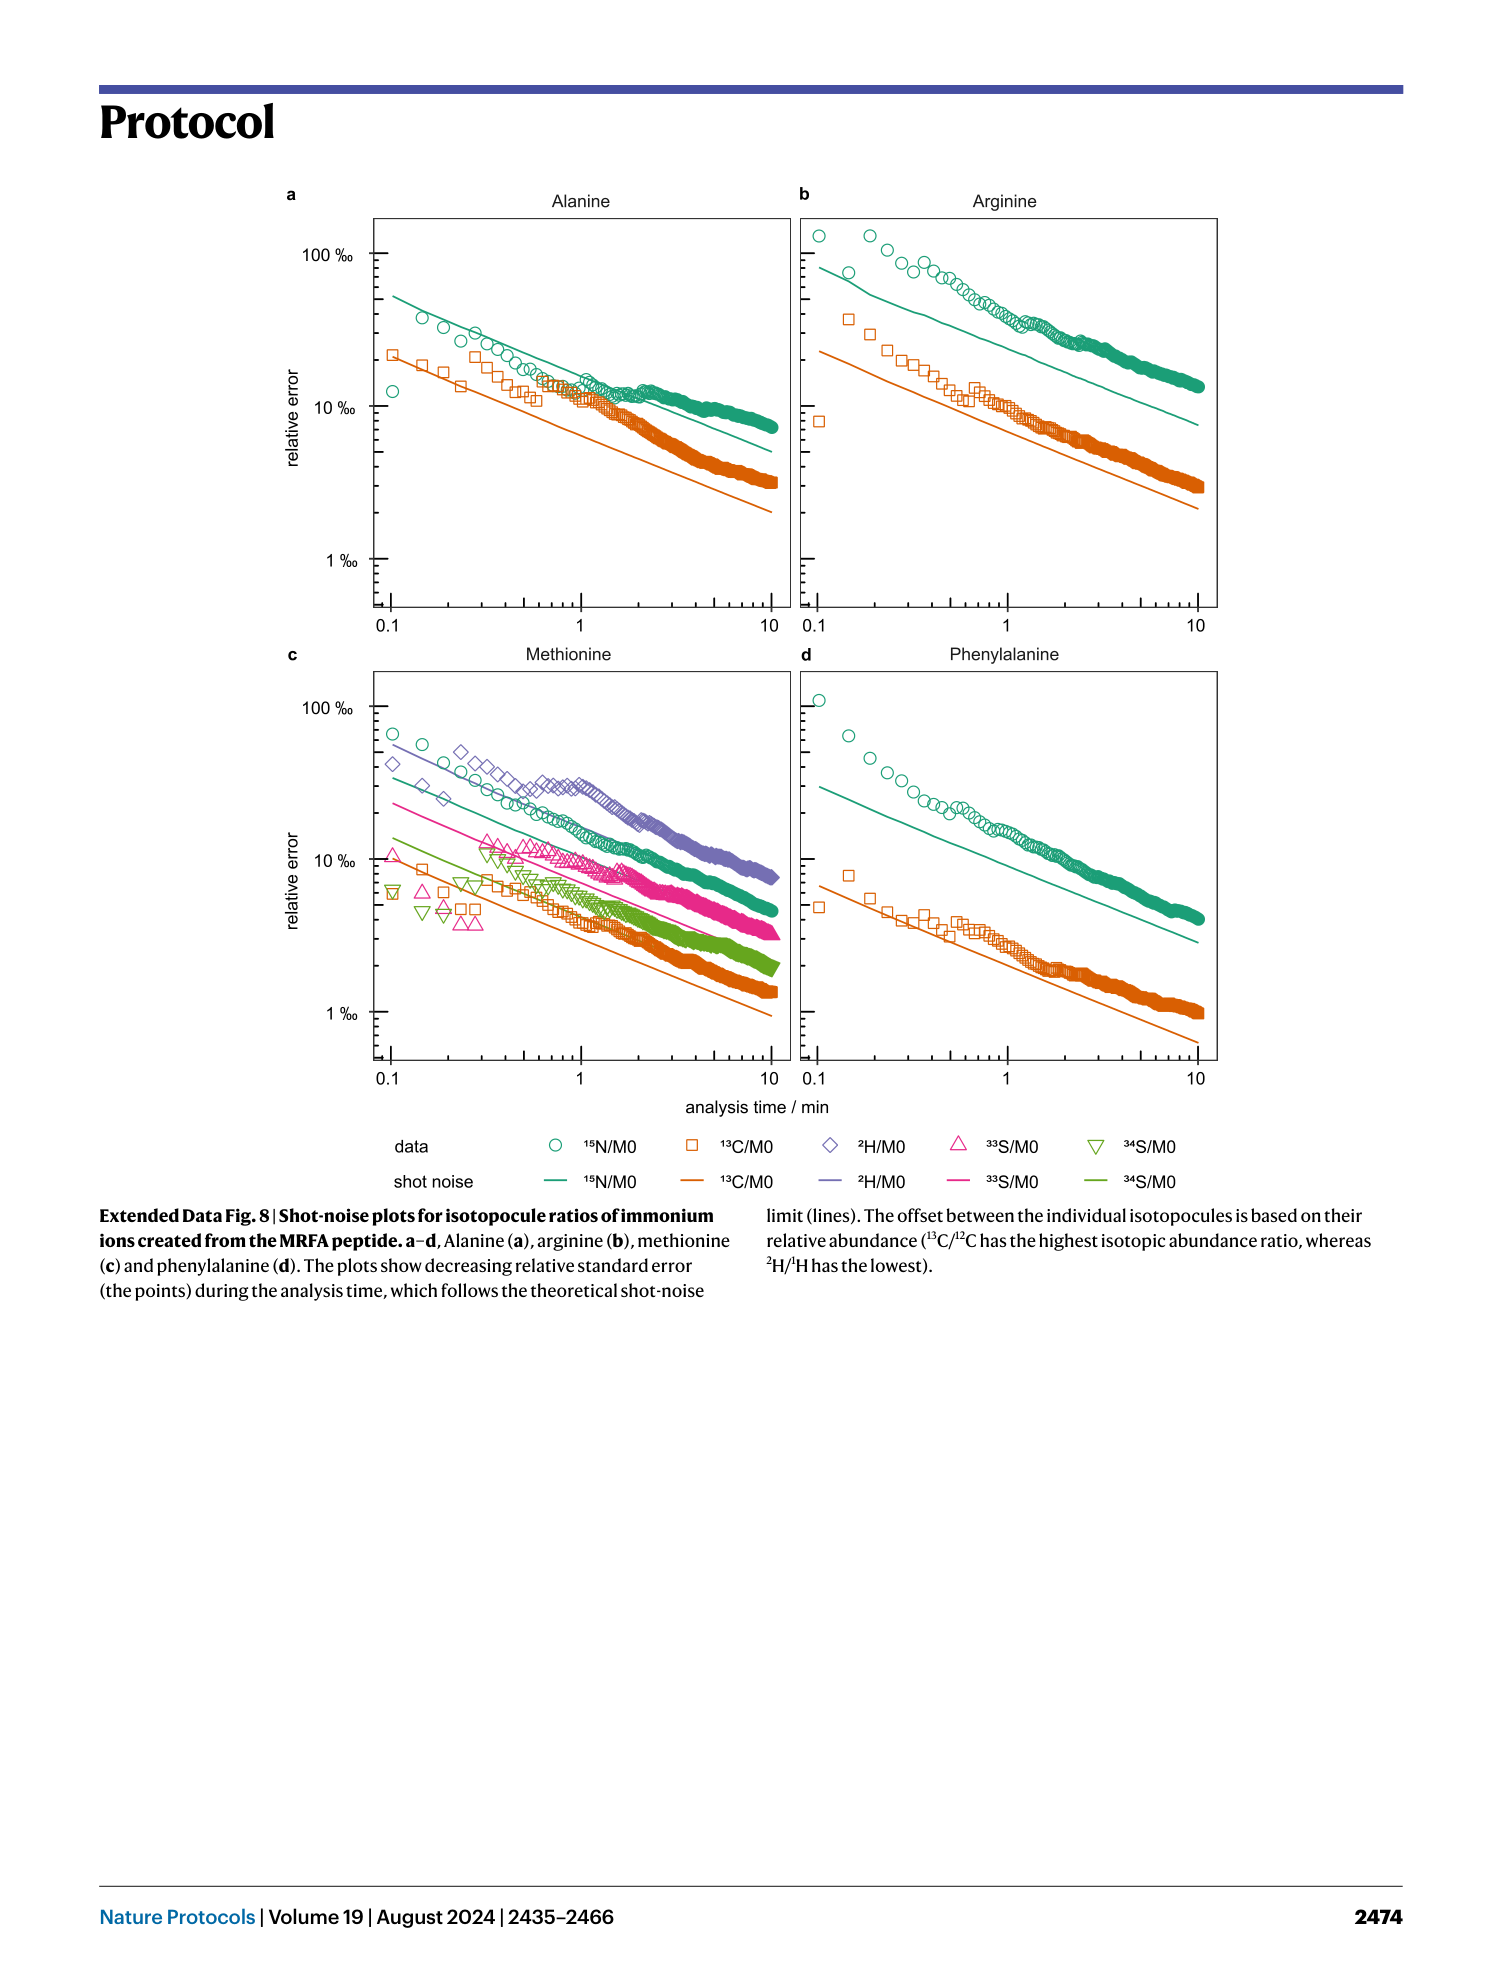
Extended Data Fig. 8 Shot-noise plots for isotopocule ratios of immonium ions created from the MRFA peptide.
a–d , Alanine ( a ), arginine ( b ), methionine ( c ) and phenylalanine ( d ). The plots show decreasing relative standard error (the points) during the analysis time, which follows the theoretical shot-noise limit (lines). The offset between the individual isotopocules is based on their relative abundance ( 13 C/ 12 C has the highest isotopic abundance ratio, whereas 2 H/ 1 H has the lowest).
Supplementary information
Supplementary Information
Supplementary Notes 1 and 2, Supplementary Tables 1–11, Supplementary Figs. 1–21 and Supplementary Data.
Reporting Summary
Supplementary Data
A spreadsheet showing the implementation of alternative ways to do the one-point calibration of δ values.
