Smart-RRBS for single-cell methylome and transcriptome analysis
Andreas Gnirke, Ronan Chaligne, Hongcang Gu, Ayush T. Raman, Xiaoxue Wang, Federico Gaiti, Arman W. Mohammad, Aleksandra Arczewska, Zachary D. Smith, Dan A. Landau, Martin J. Aryee, Alexander Meissner
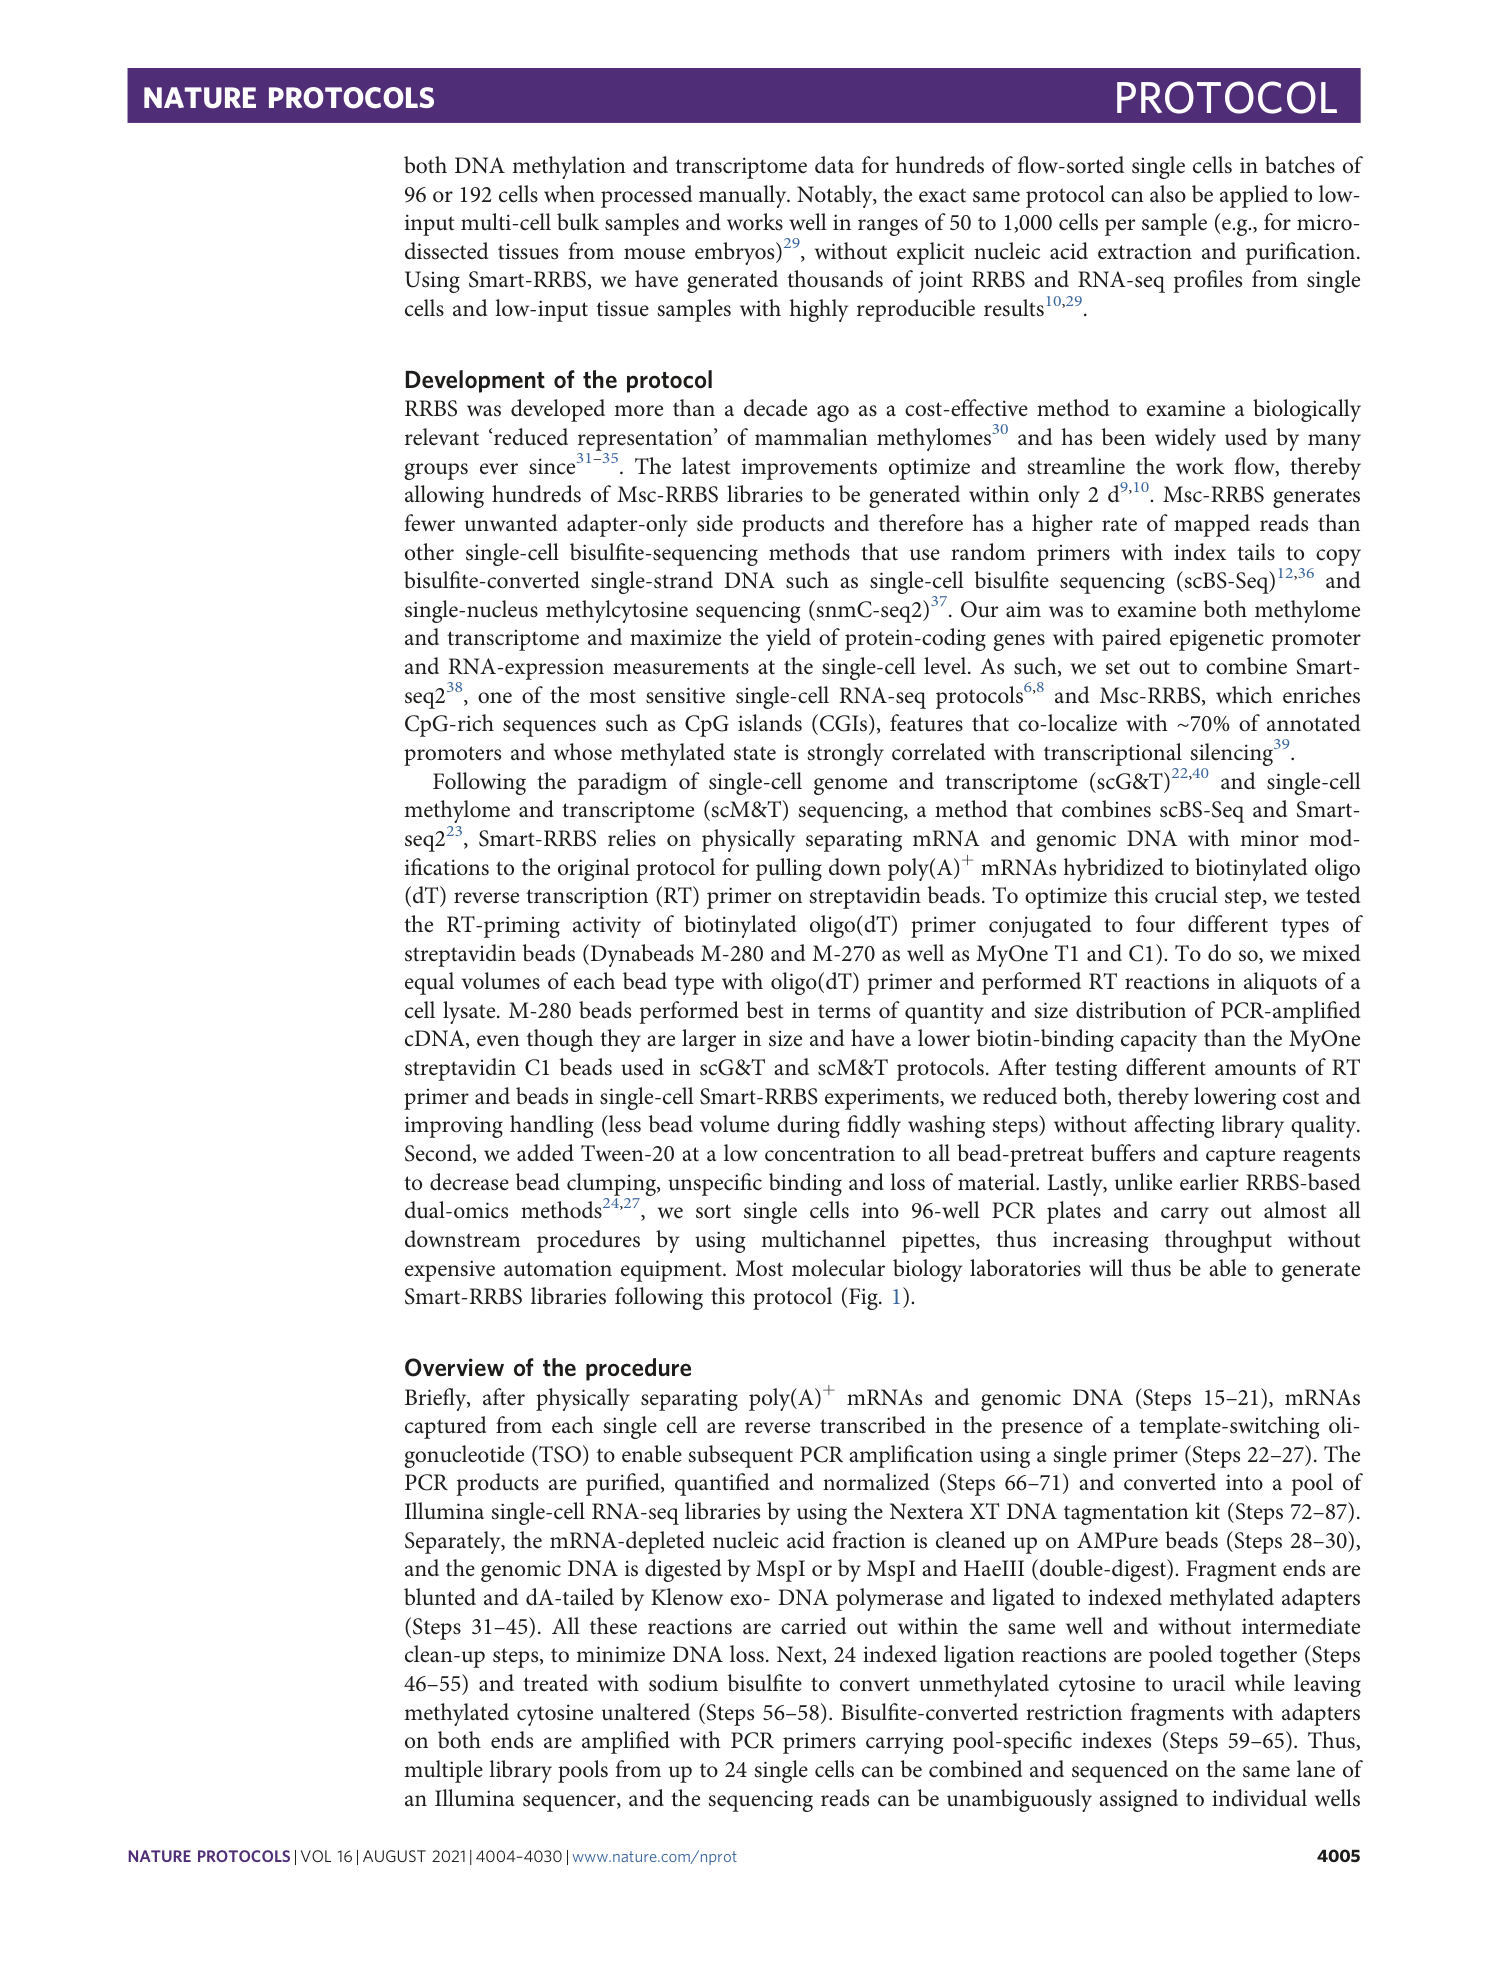

Extended
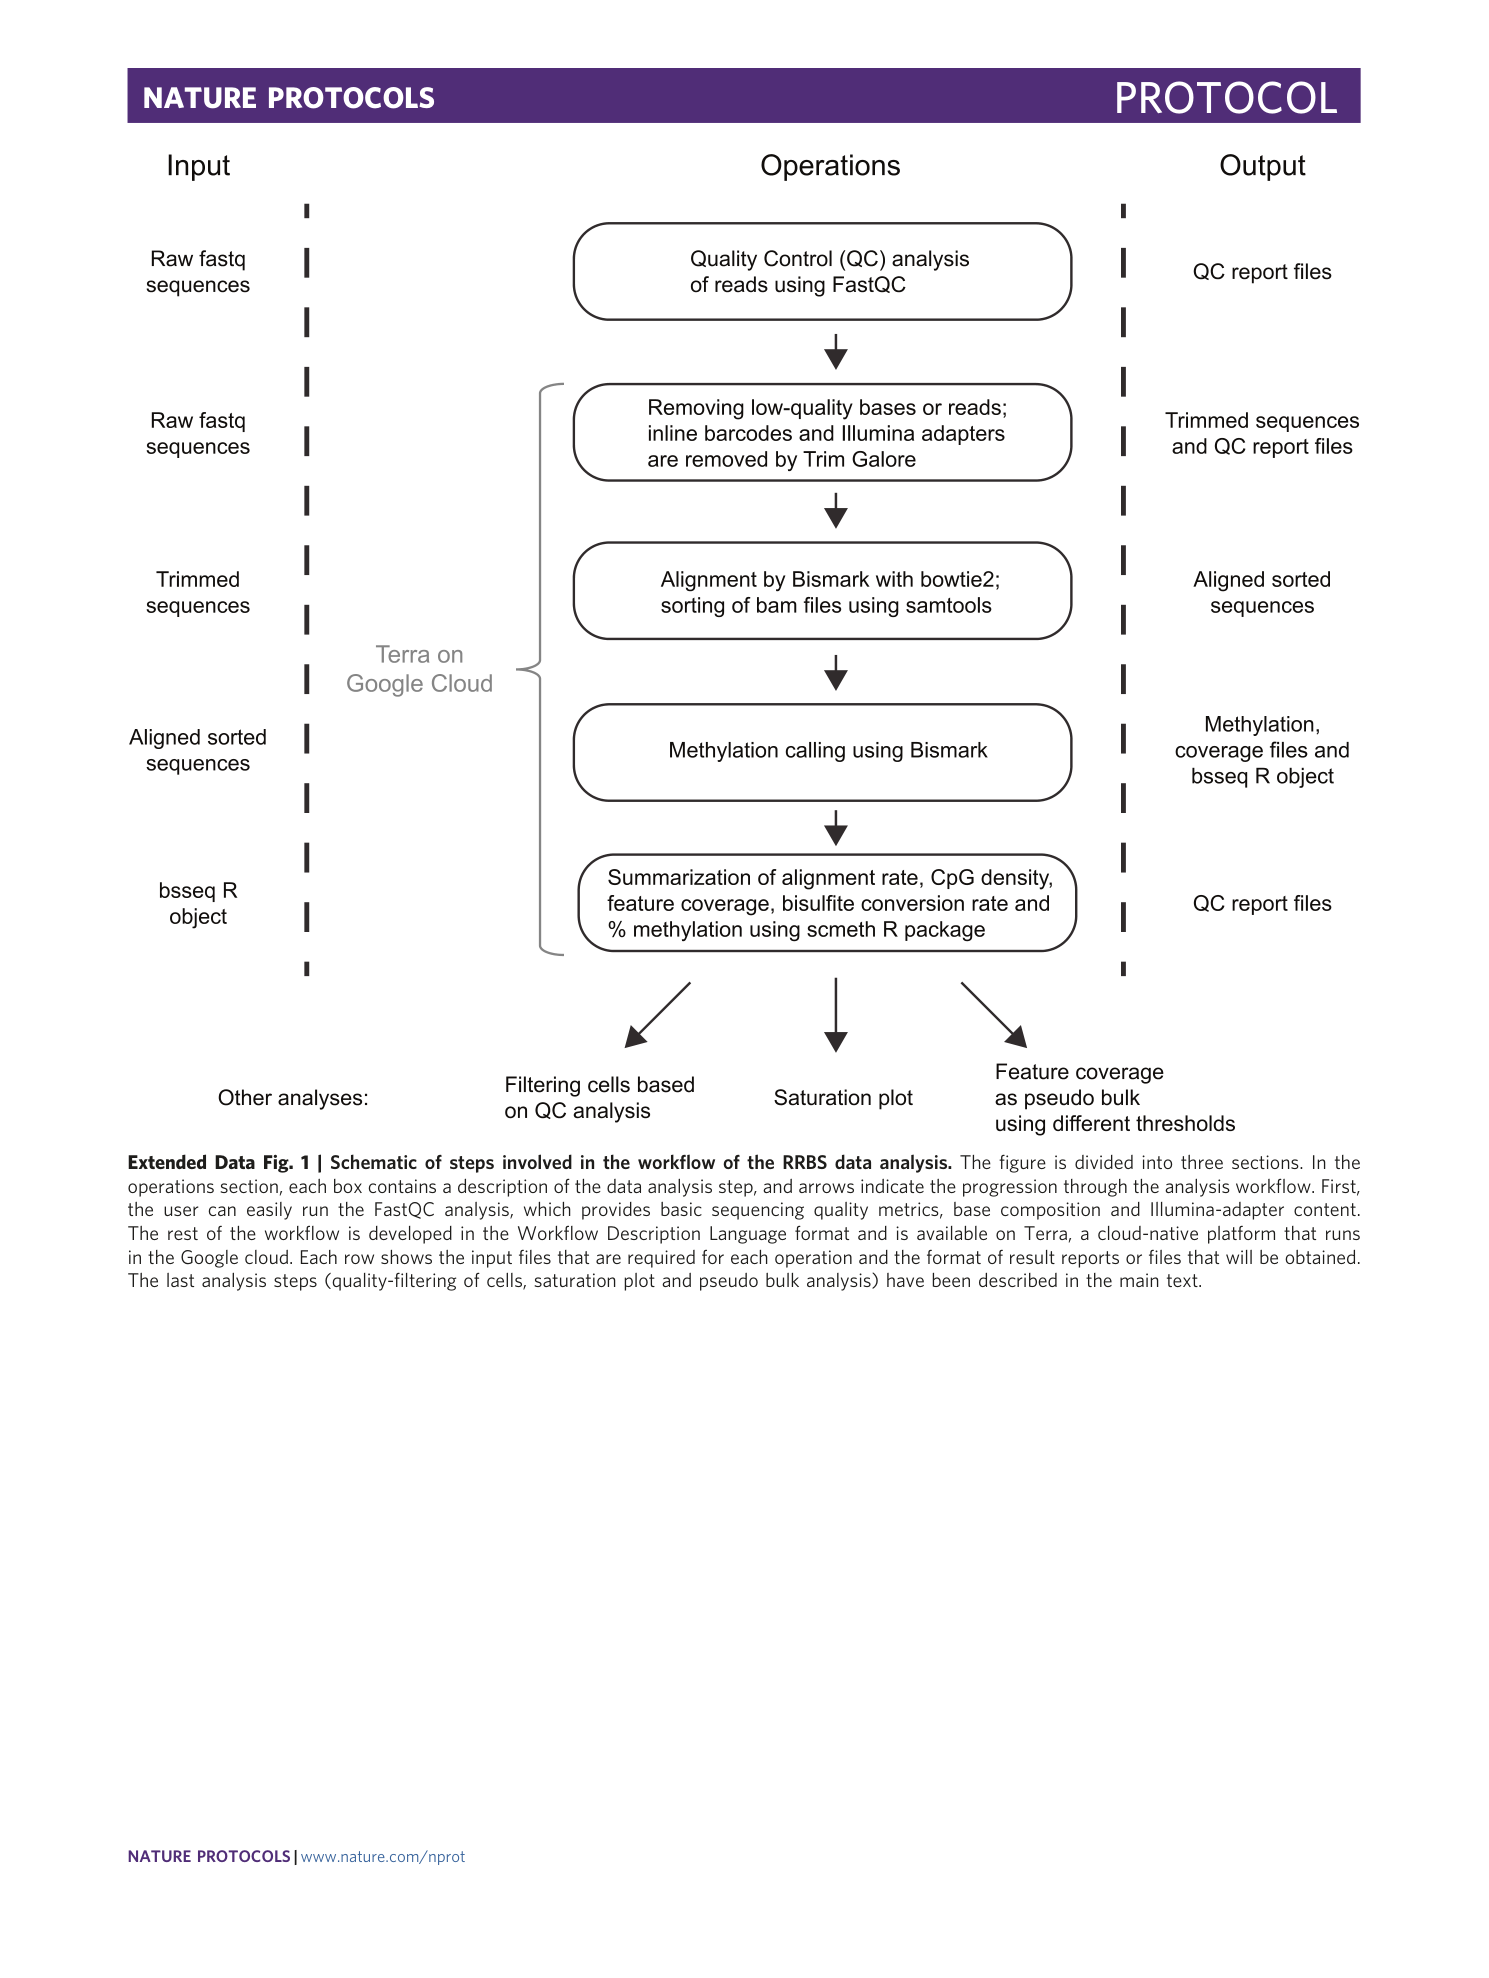
Extended Data Fig. 1 Schematic of steps involved in the workflow of the RRBS data analysis.
The figure is divided into three sections. In the operations section, each box contains a description of the data analysis step, and arrows indicate the progression through the analysis workflow. First, the user can easily run the FastQC analysis, which provides basic sequencing quality metrics, base composition and Illumina-adapter content. The rest of the workflow is developed in the Workflow Description Language format and is available on Terra, a cloud-native platform that runs in the Google cloud. Each row shows the input files that are required for each operation and the format of result reports or files that will be obtained. The last analysis steps (quality-filtering of cells, saturation plot and pseudo bulk analysis) have been described in the main text.
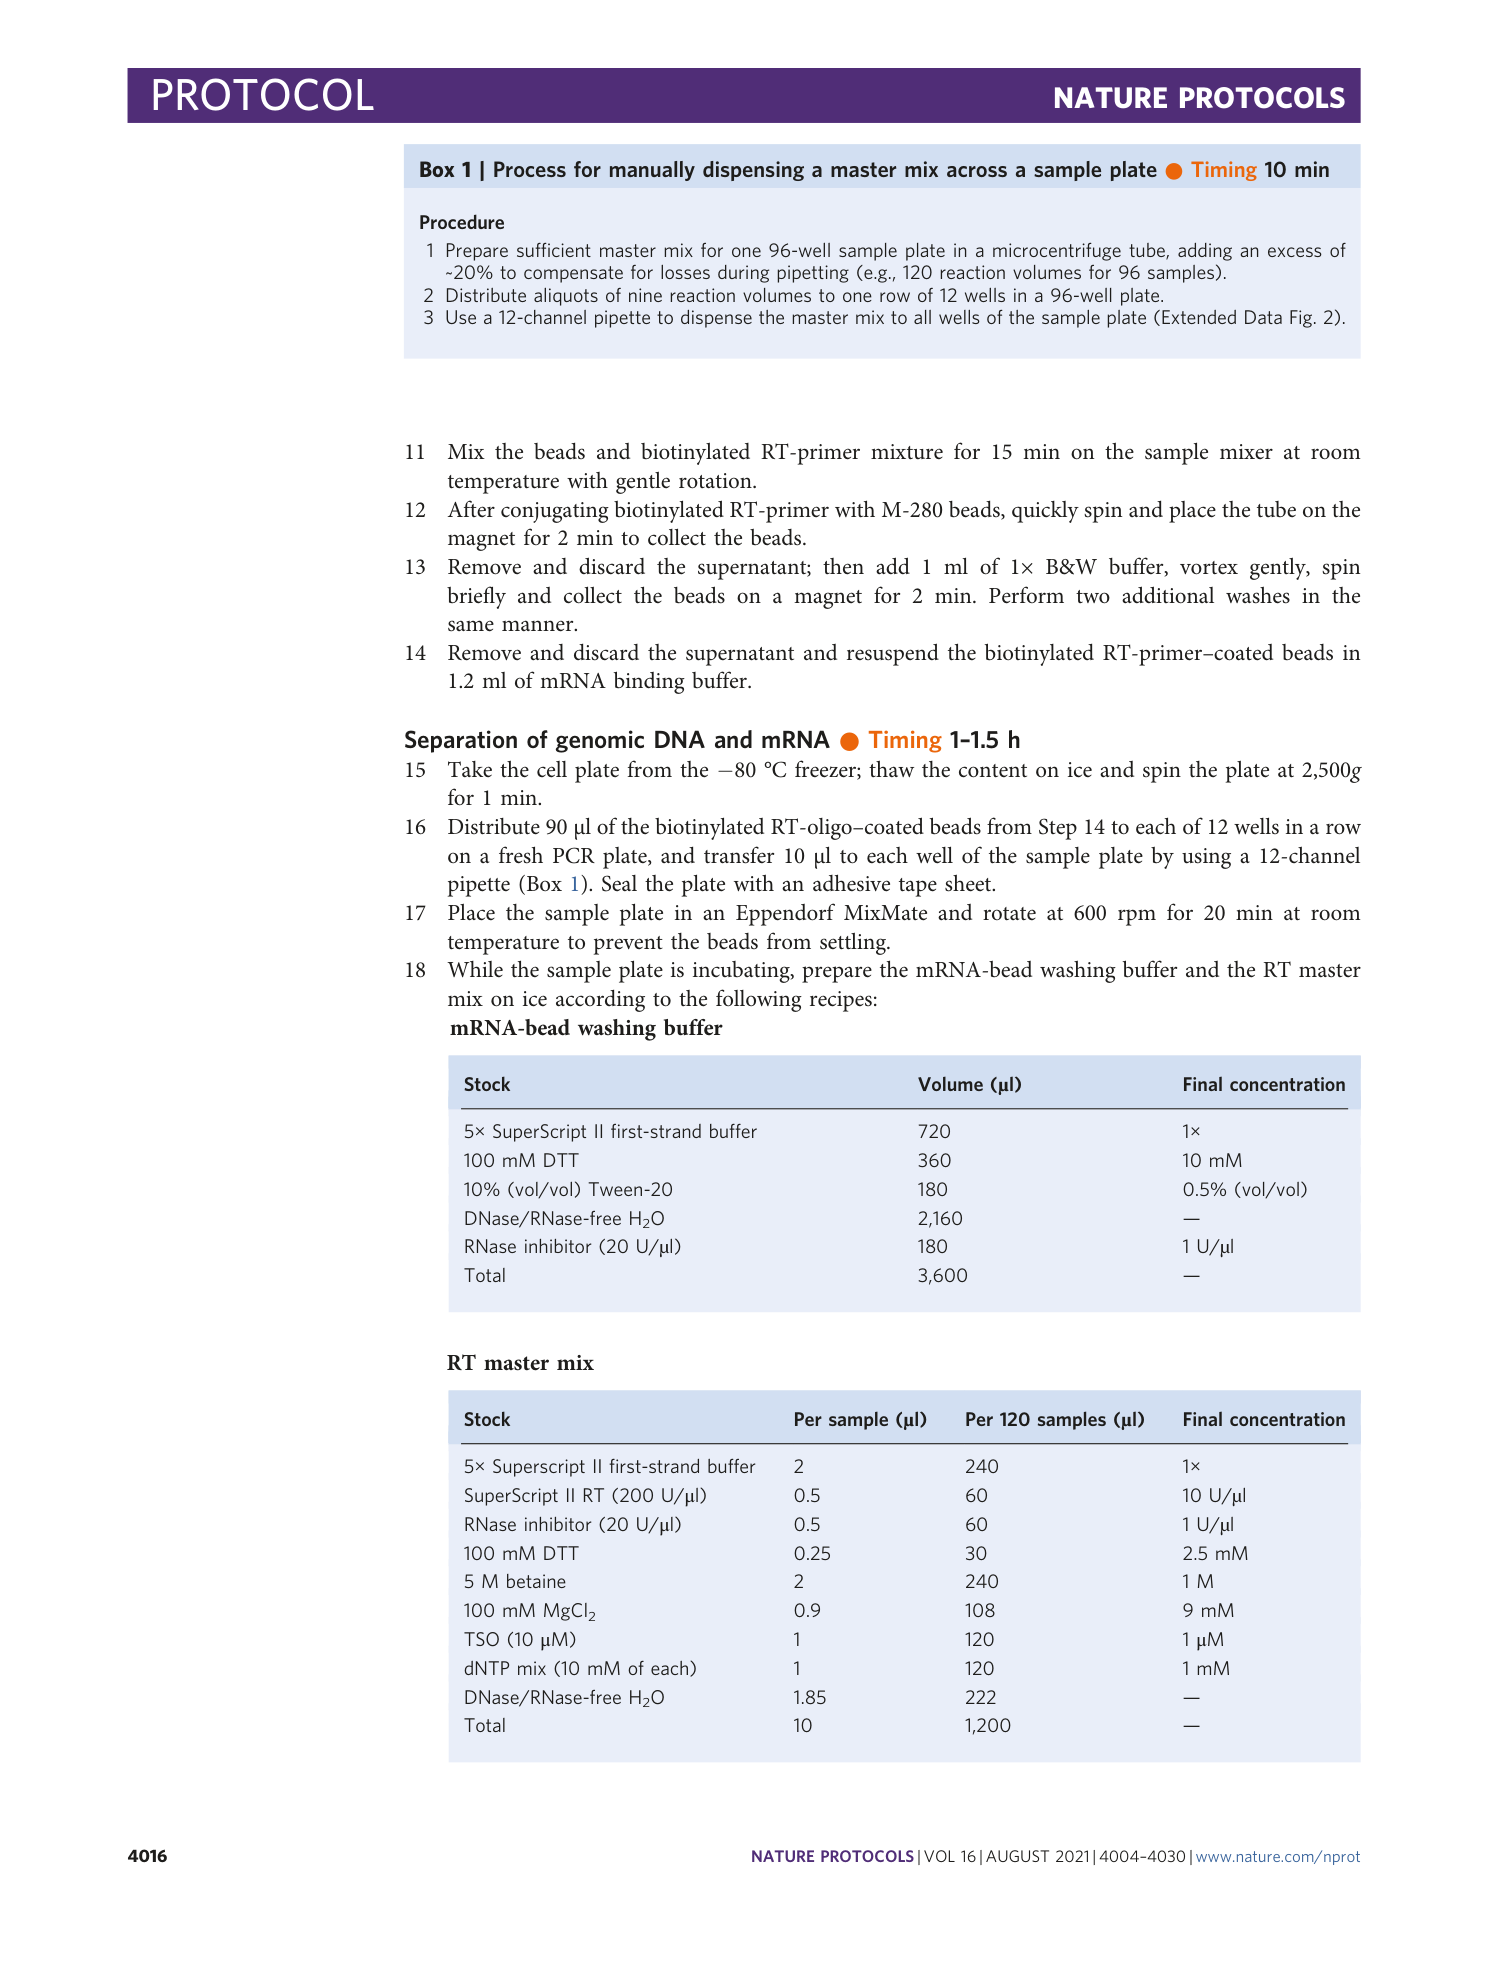
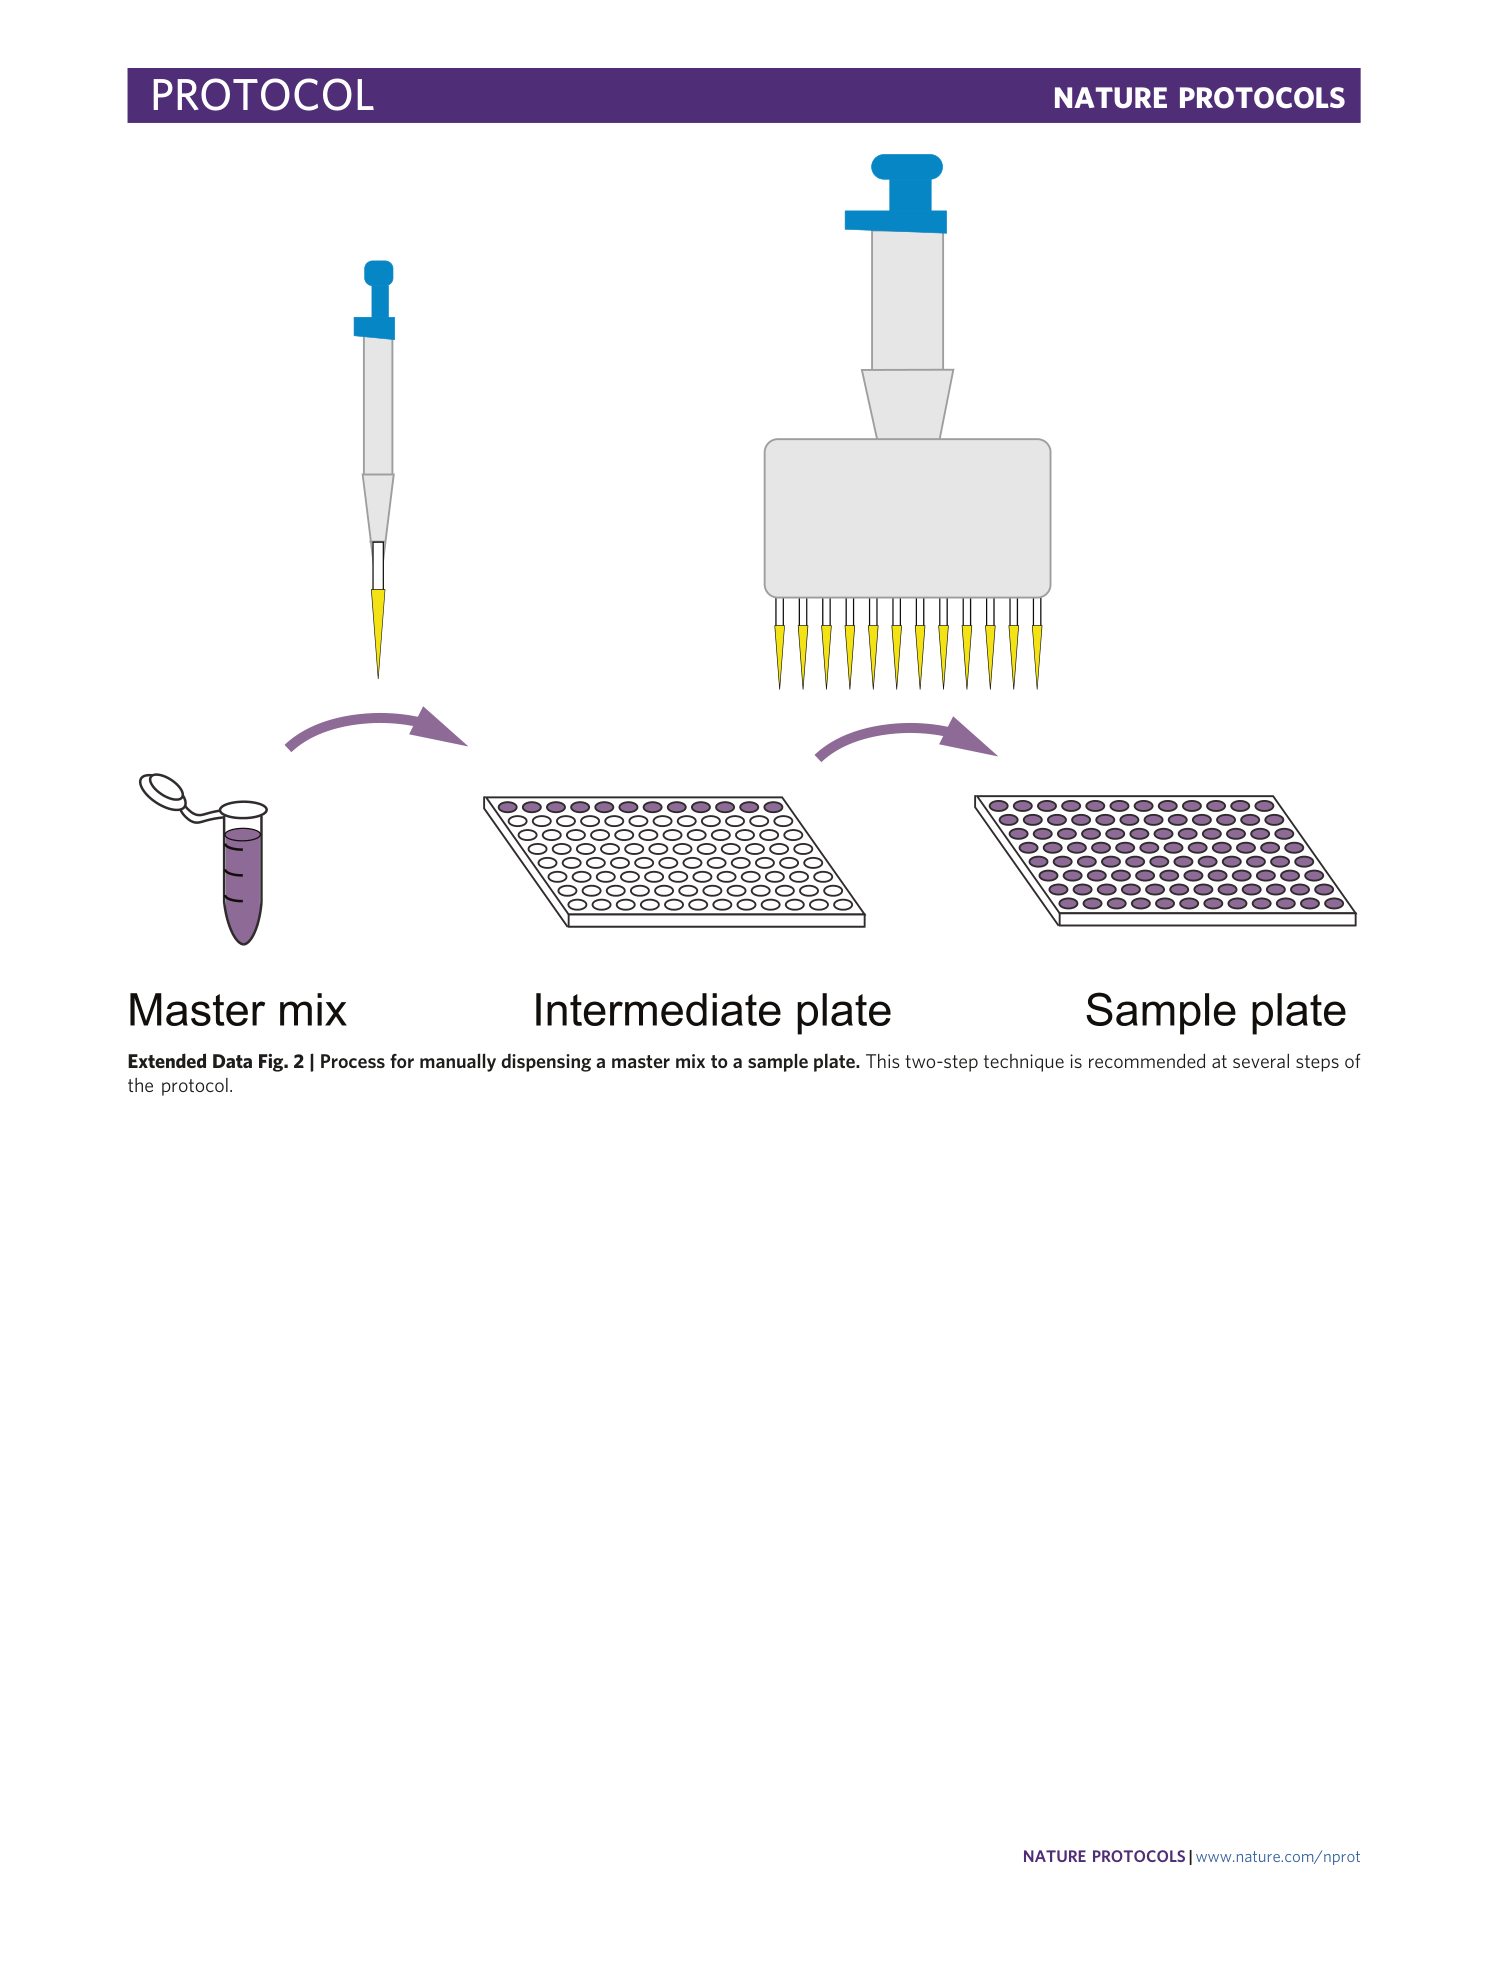
Extended Data Fig. 2 Process for manually dispensing a master mix to a sample plate.
This two-step technique is recommended at several steps of the protocol.
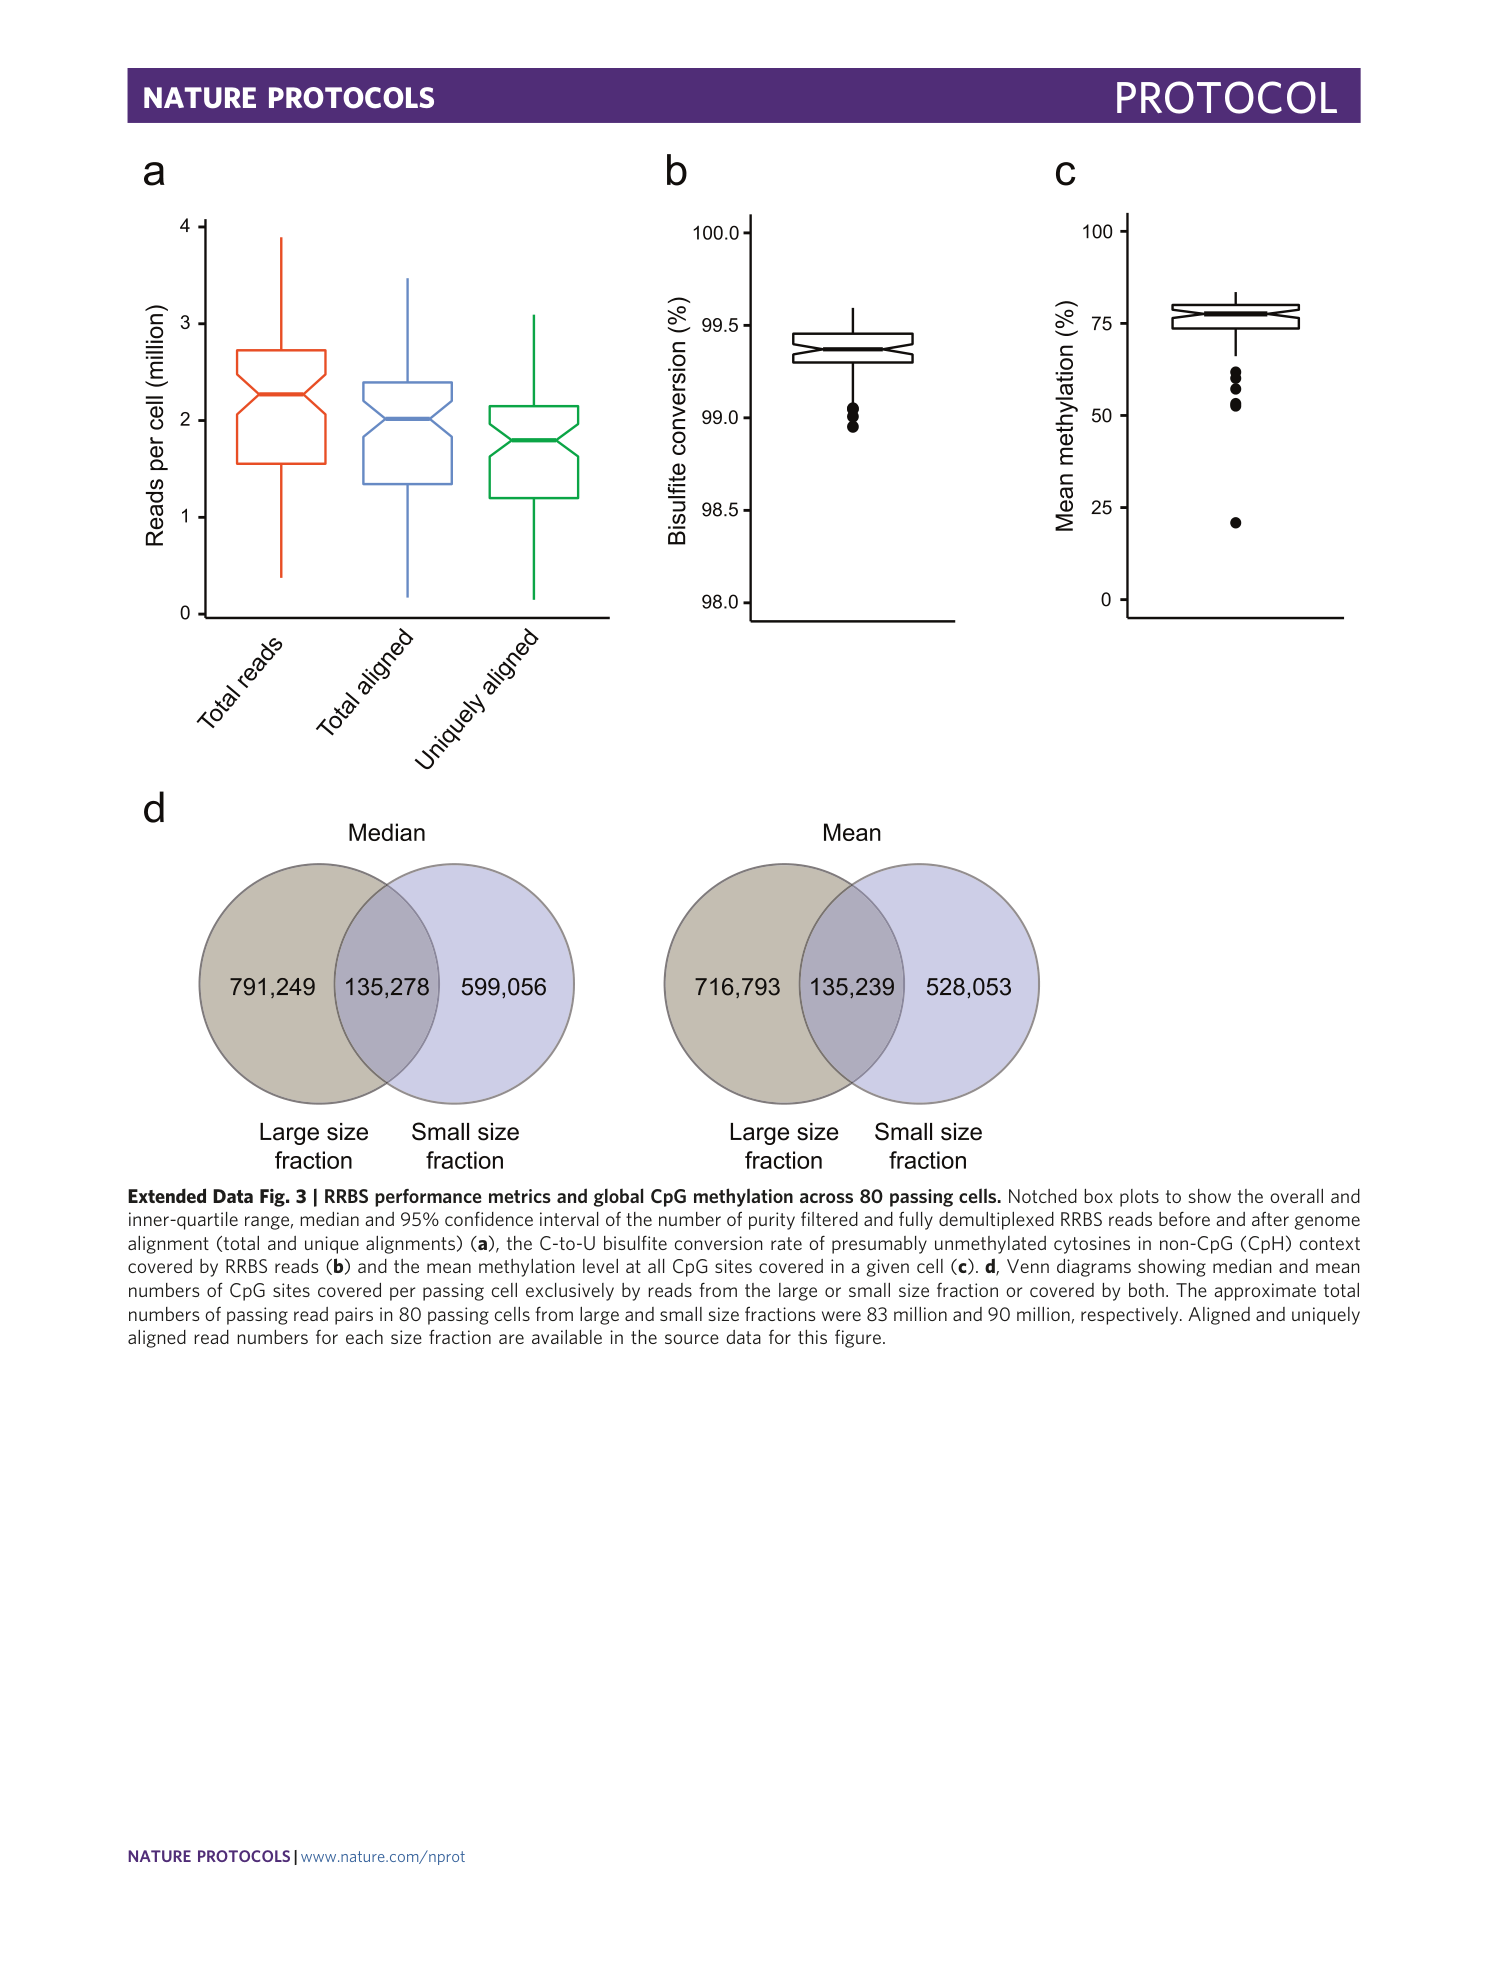
Extended Data Fig. 3 RRBS performance metrics and global CpG methylation across 80 passing cells.
Notched box plots to show the overall and inner-quartile range, median and 95% confidence interval of the number of purity filtered and fully demultiplexed RRBS reads before and after genome alignment (total and unique alignments) ( a ), the C-to-U bisulfite conversion rate of presumably unmethylated cytosines in non-CpG (CpH) context covered by RRBS reads ( b ) and the mean methylation level at all CpG sites covered in a given cell ( c ). d , Venn diagrams showing median and mean numbers of CpG sites covered per passing cell exclusively by reads from the large or small size fraction or covered by both. The approximate total numbers of passing read pairs in 80 passing cells from large and small size fractions were 83 million and 90 million, respectively. Aligned and uniquely aligned read numbers for each size fraction are available in the source data for this figure.
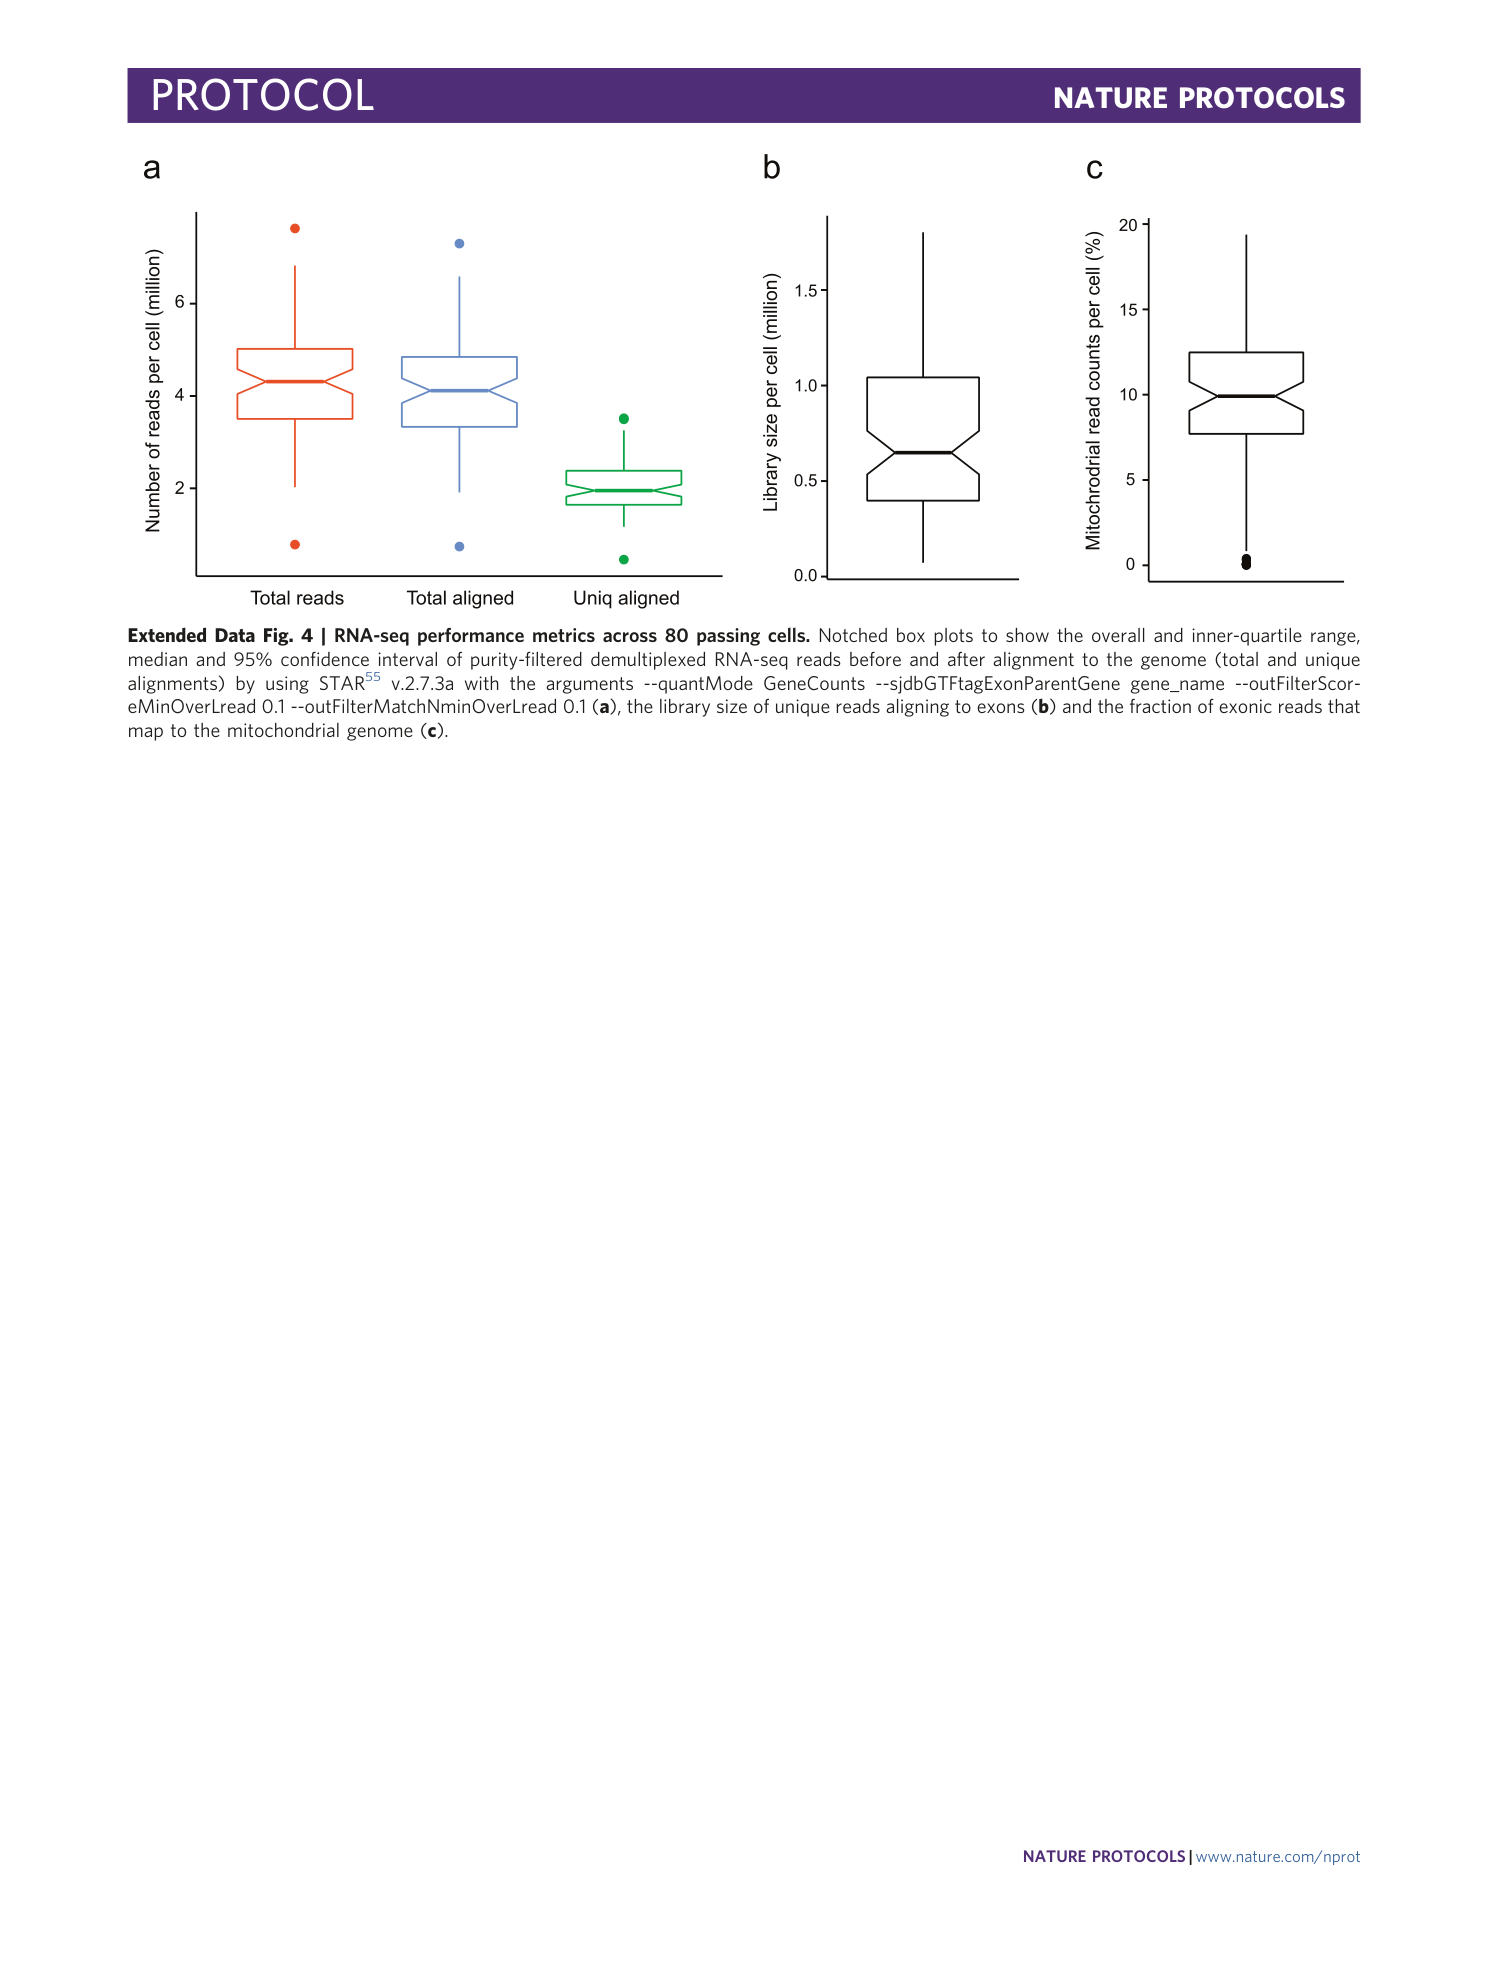
Extended Data Fig. 4 RNA-seq performance metrics across 80 passing cells.
Notched box plots to show the overall and inner-quartile range, median and 95% confidence interval of purity-filtered demultiplexed RNA-seq reads before and after alignment to the genome (total and unique alignments) by using STAR 55 v.2.7.3a with the arguments --quantMode GeneCounts --sjdbGTFtagExonParentGene gene_name --outFilterScoreMinOverLread 0.1 --outFilterMatchNminOverLread 0.1 ( a ), the library size of unique reads aligning to exons ( b ) and the fraction of exonic reads that map to the mitochondrial genome ( c ).
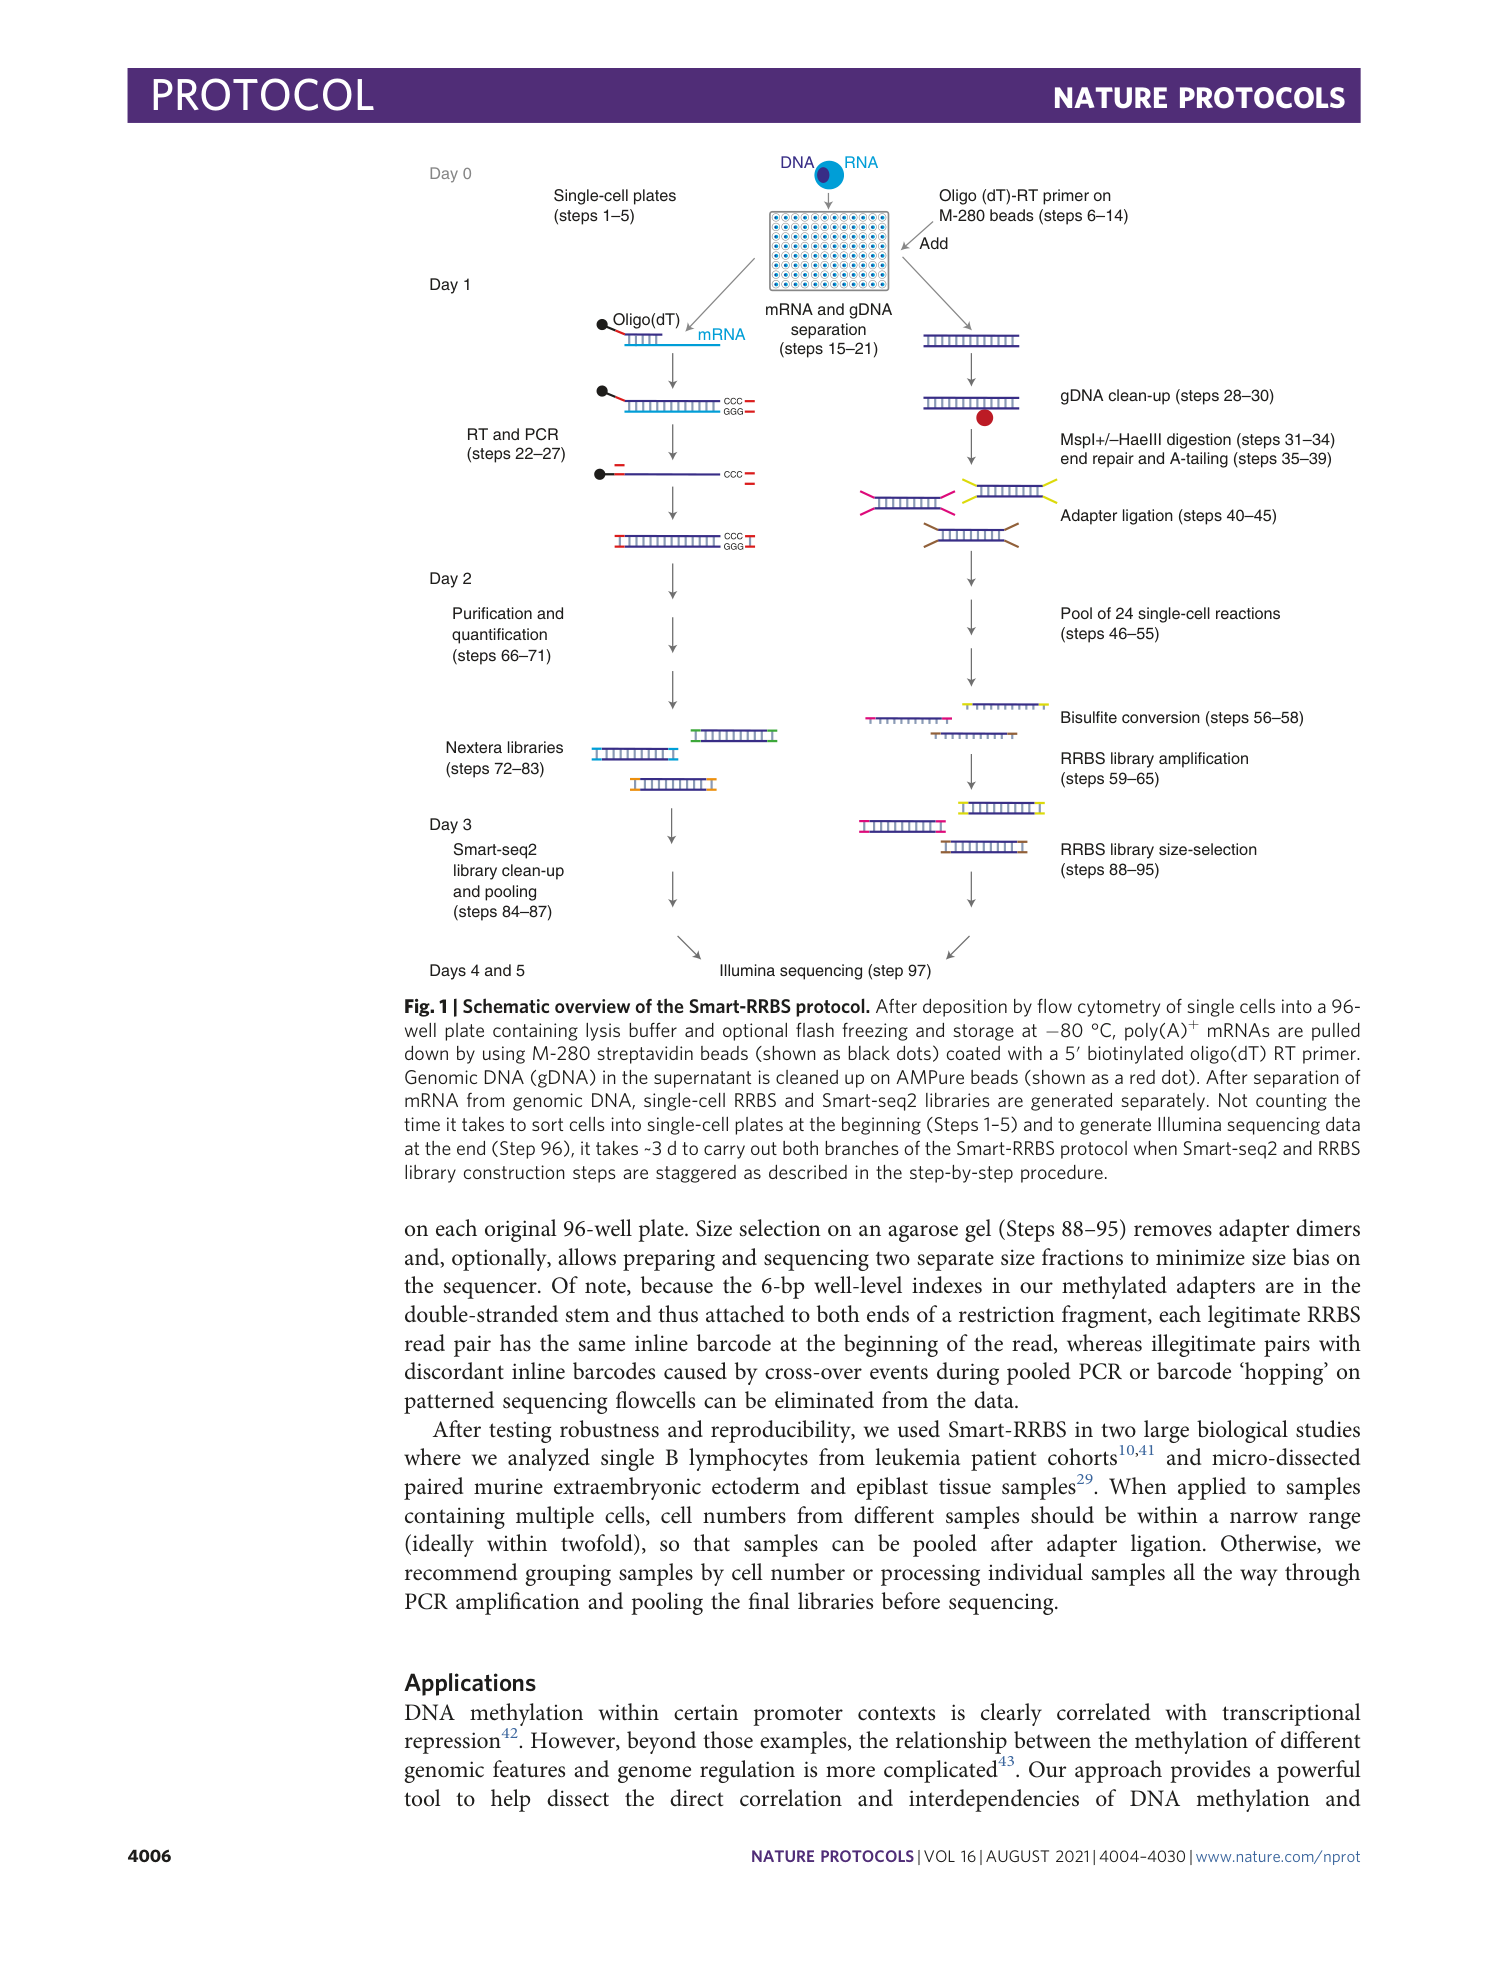
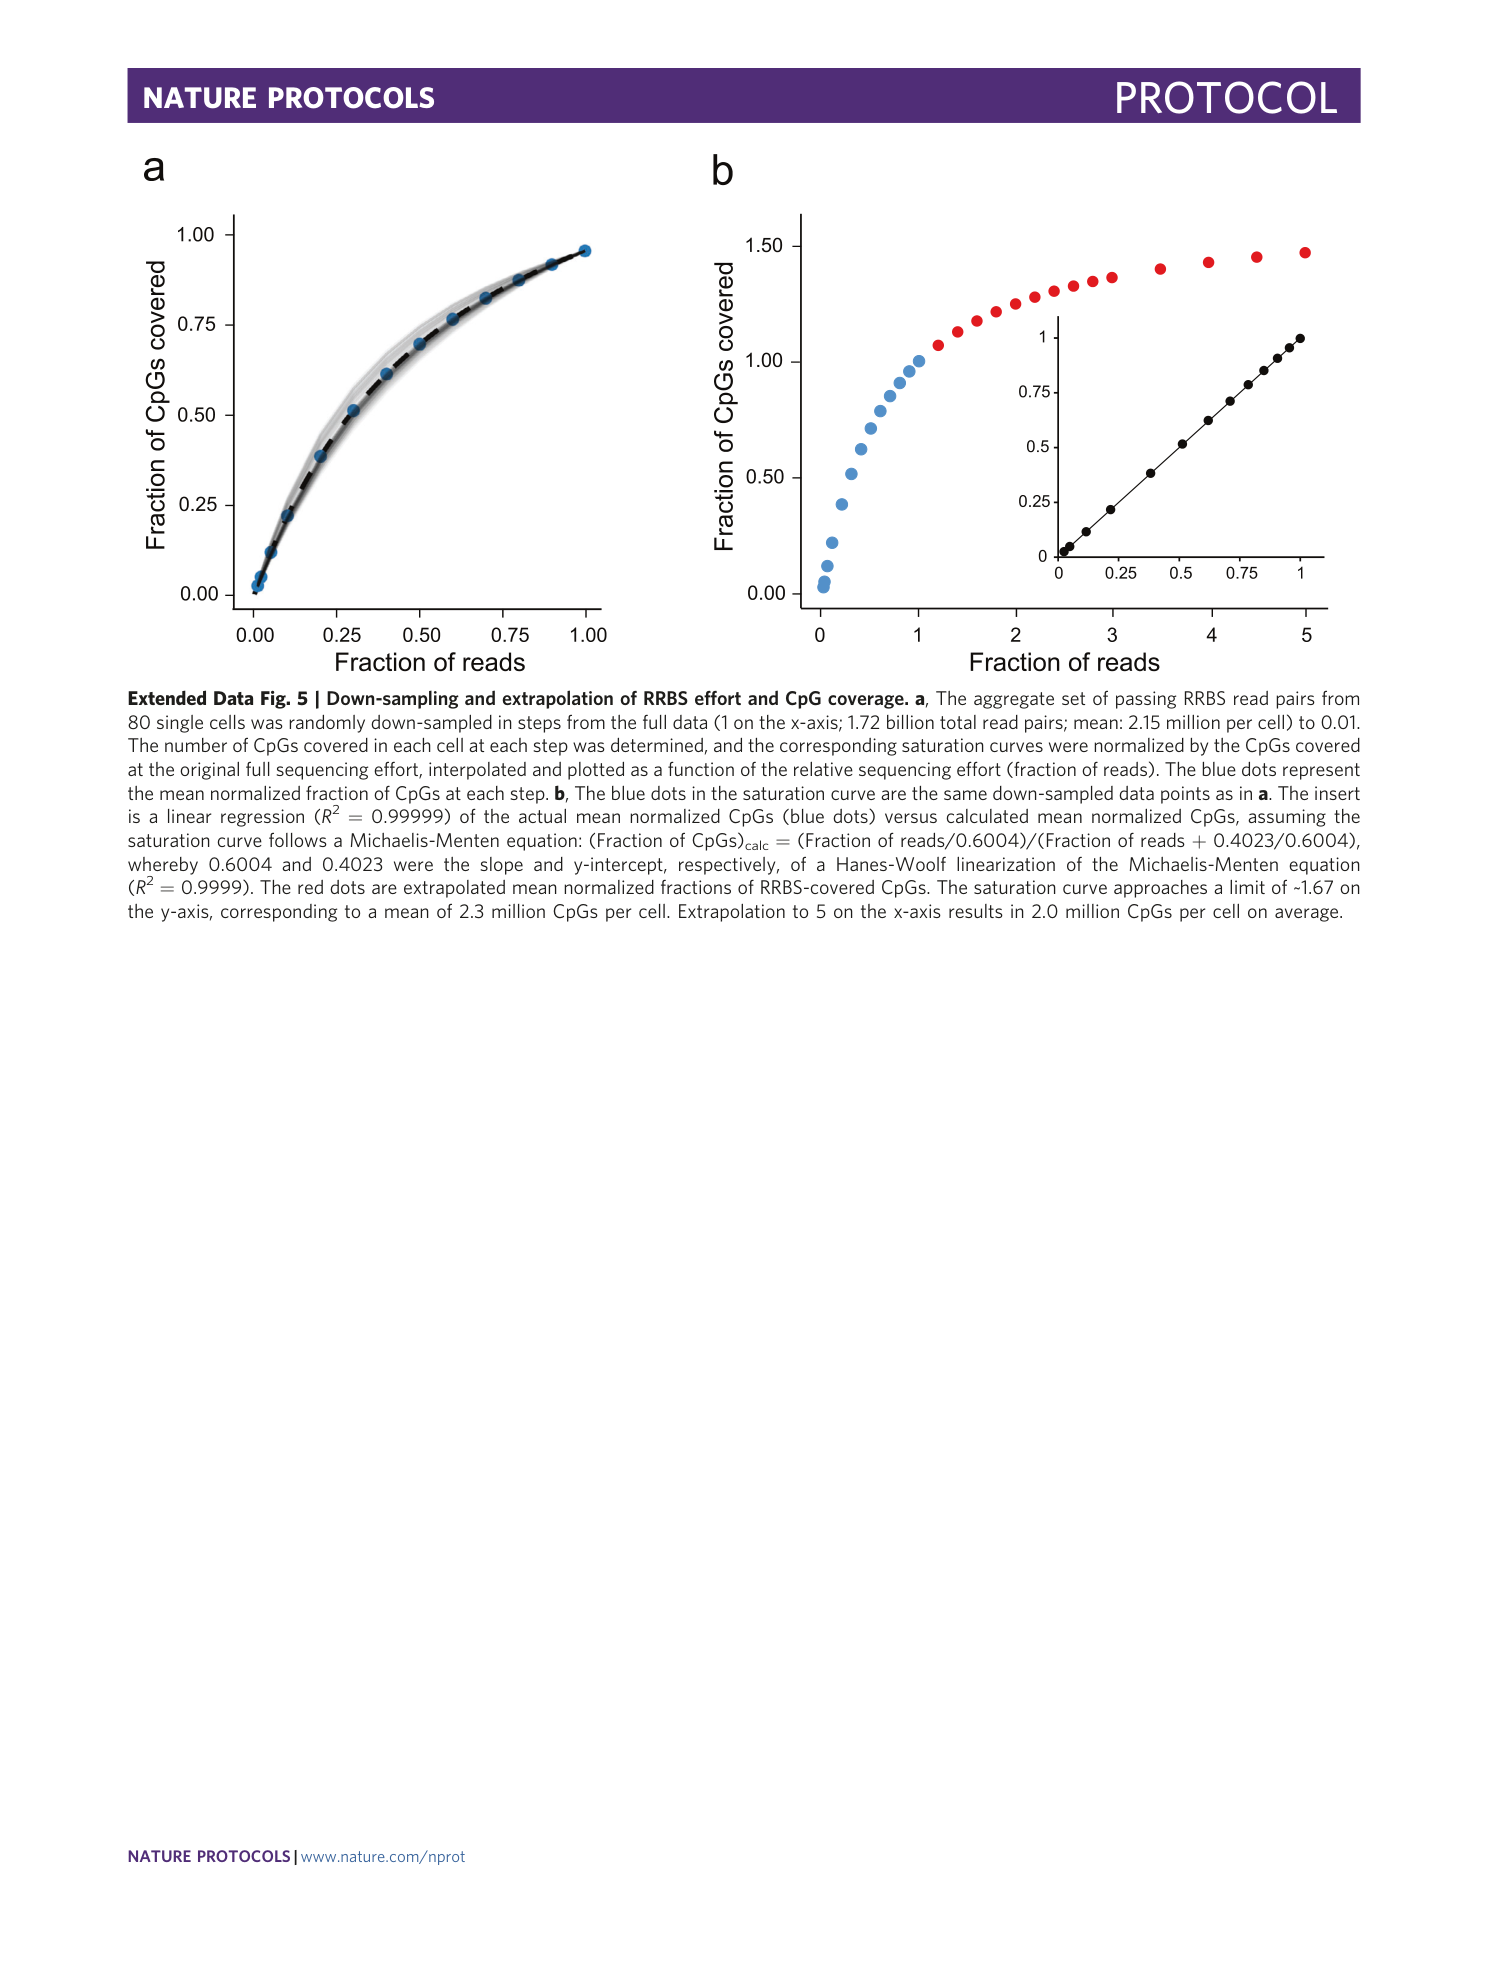
Extended Data Fig. 5 Down-sampling and extrapolation of RRBS effort and CpG coverage.
a , The aggregate set of passing RRBS read pairs from 80 single cells was randomly down-sampled in steps from the full data (1 on the x-axis; 1.72 billion total read pairs; mean: 2.15 million per cell) to 0.01. The number of CpGs covered in each cell at each step was determined, and the corresponding saturation curves were normalized by the CpGs covered at the original full sequencing effort, interpolated and plotted as a function of the relative sequencing effort (fraction of reads). The blue dots represent the mean normalized fraction of CpGs at each step. b , The blue dots in the saturation curve are the same down-sampled data points as in a . The insert is a linear regression ( R 2 = 0.99999) of the actual mean normalized CpGs (blue dots) versus calculated mean normalized CpGs, assuming the saturation curve follows a Michaelis-Menten equation: (Fraction of CpGs) calc = (Fraction of reads/0.6004)/(Fraction of reads + 0.4023/0.6004), whereby 0.6004 and 0.4023 were the slope and y-intercept, respectively, of a Hanes-Woolf linearization of the Michaelis-Menten equation ( R 2 = 0.9999). The red dots are extrapolated mean normalized fractions of RRBS-covered CpGs. The saturation curve approaches a limit of ~1.67 on the y-axis, corresponding to a mean of 2.3 million CpGs per cell. Extrapolation to 5 on the x-axis results in 2.0 million CpGs per cell on average.
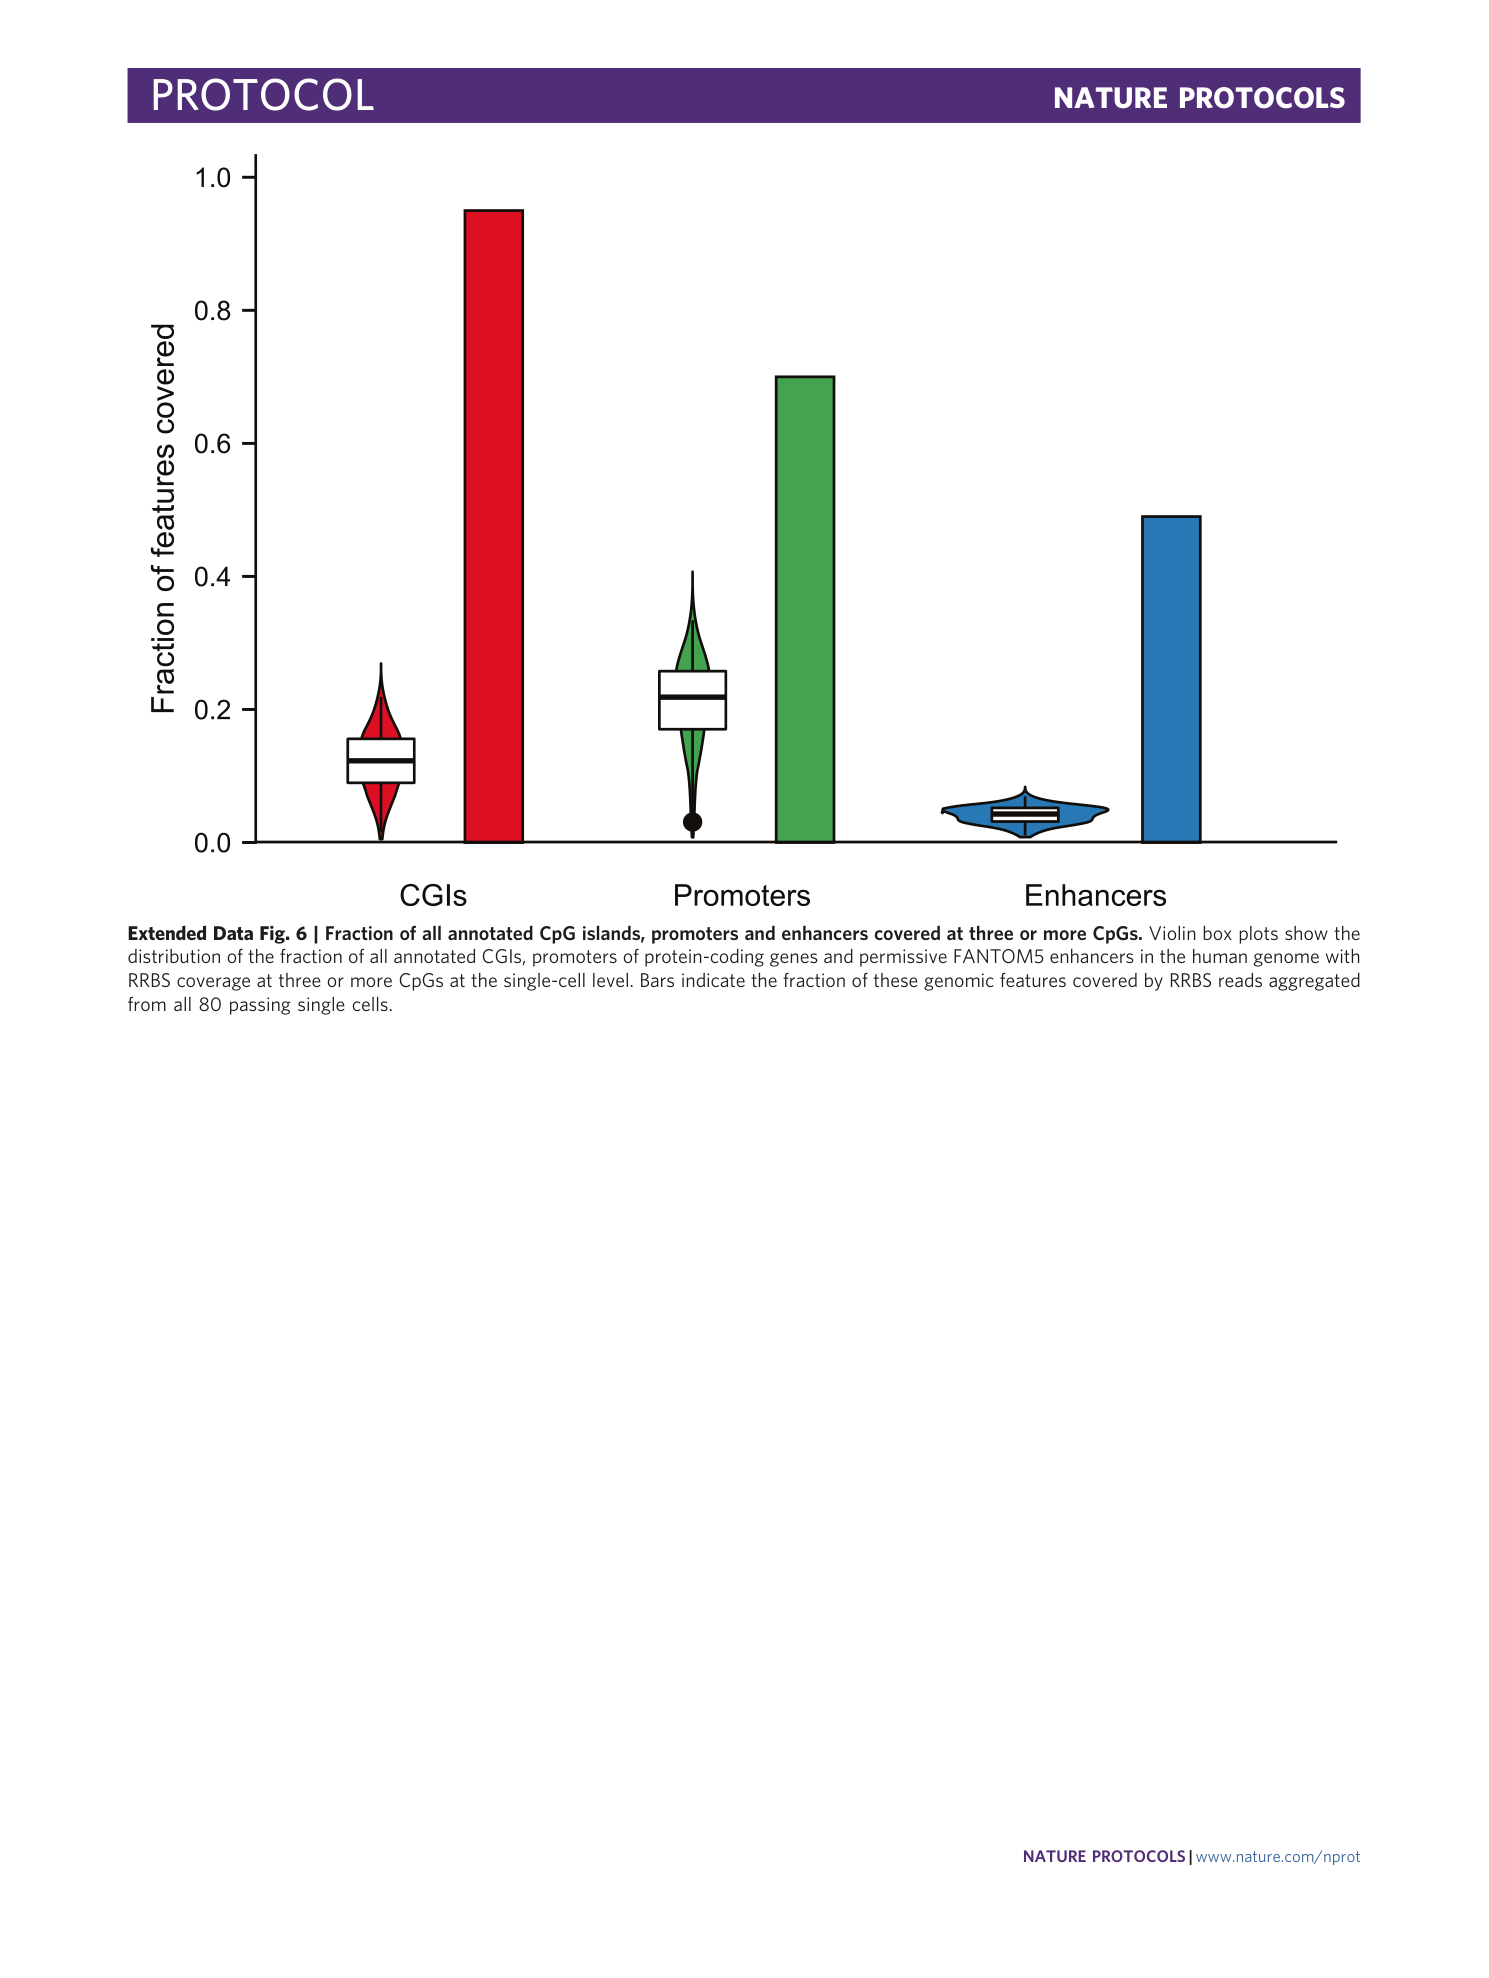
Extended Data Fig. 6 Fraction of all annotated CpG islands, promoters and enhancers covered at three or more CpGs.
Violin box plots show the distribution of the fraction of all annotated CGIs, promoters of protein-coding genes and permissive FANTOM5 enhancers in the human genome with RRBS coverage at three or more CpGs at the single-cell level. Bars indicate the fraction of these genomic features covered by RRBS reads aggregated from all 80 passing single cells.
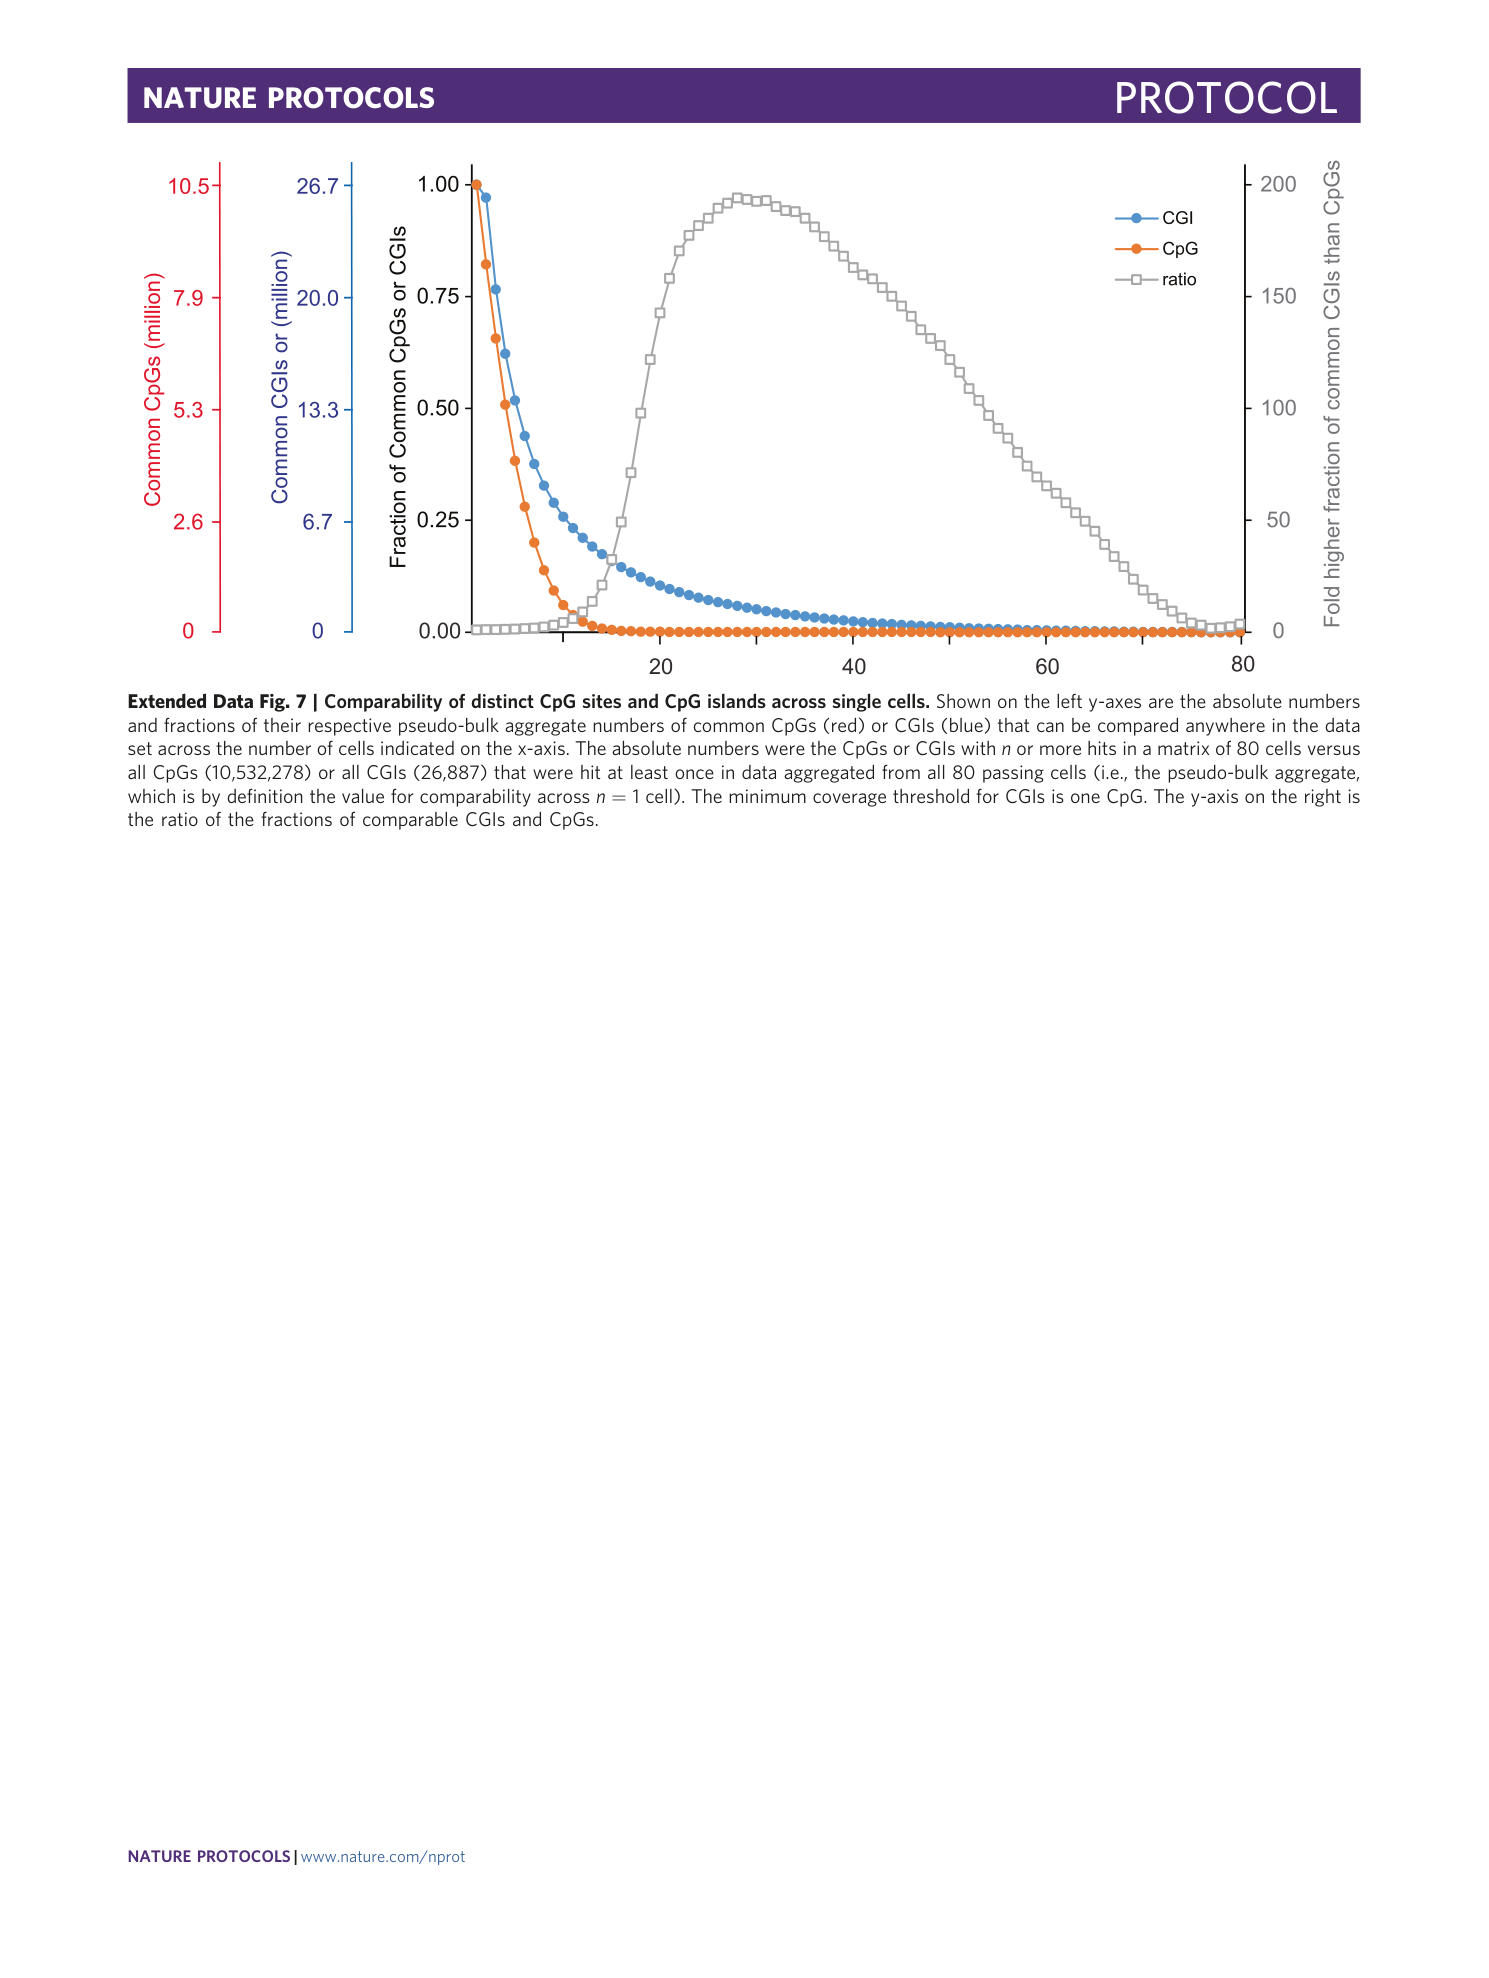
Extended Data Fig. 7 Comparability of distinct CpG sites and CpG islands across single cells.
Shown on the left y-axes are the absolute numbers and fractions of their respective pseudo-bulk aggregate numbers of common CpGs (red) or CGIs (blue) that can be compared anywhere in the data set across the number of cells indicated on the x-axis. The absolute numbers were the CpGs or CGIs with n or more hits in a matrix of 80 cells versus all CpGs (10,532,278) or all CGIs (26,887) that were hit at least once in data aggregated from all 80 passing cells (i.e., the pseudo-bulk aggregate, which is by definition the value for comparability across n = 1 cell). The minimum coverage threshold for CGIs is one CpG. The y-axis on the right is the ratio of the fractions of comparable CGIs and CpGs.
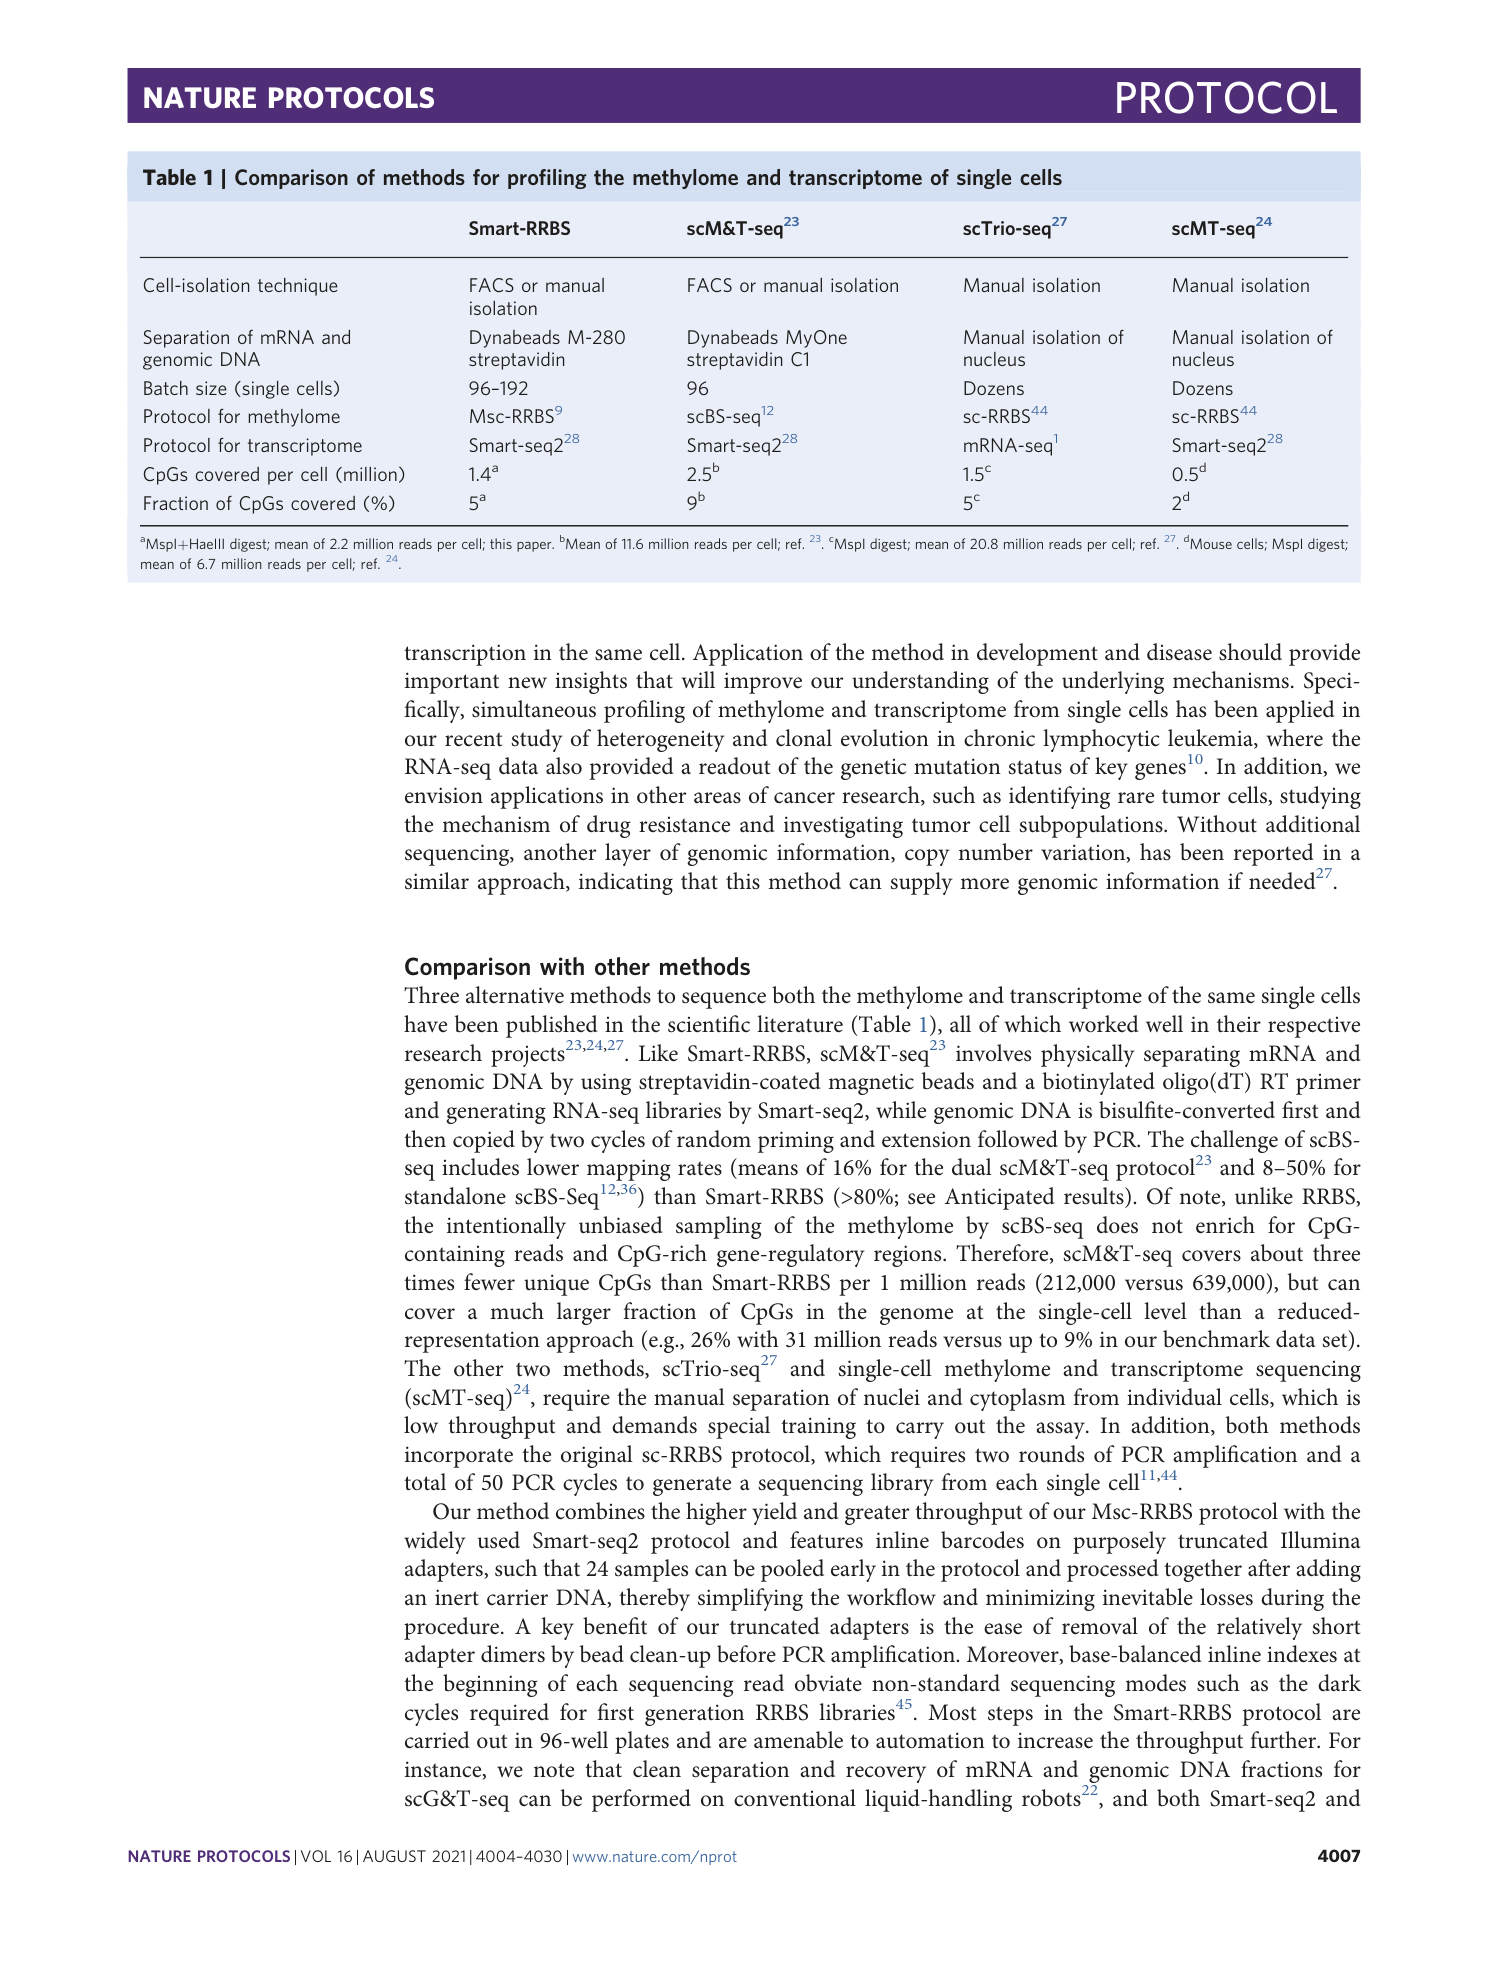
Extended Data Fig. 8 Genes with the highest RNA expression levels in 80 passing cells.
Tick marks on the horizontal lines denote TPM calculated for each single cell. Genes are ordered top to bottom by the Mean TPM value (blue circles) across 80 single cells. The eleven most highly expressed genes are mitochondrial (MT) genes.
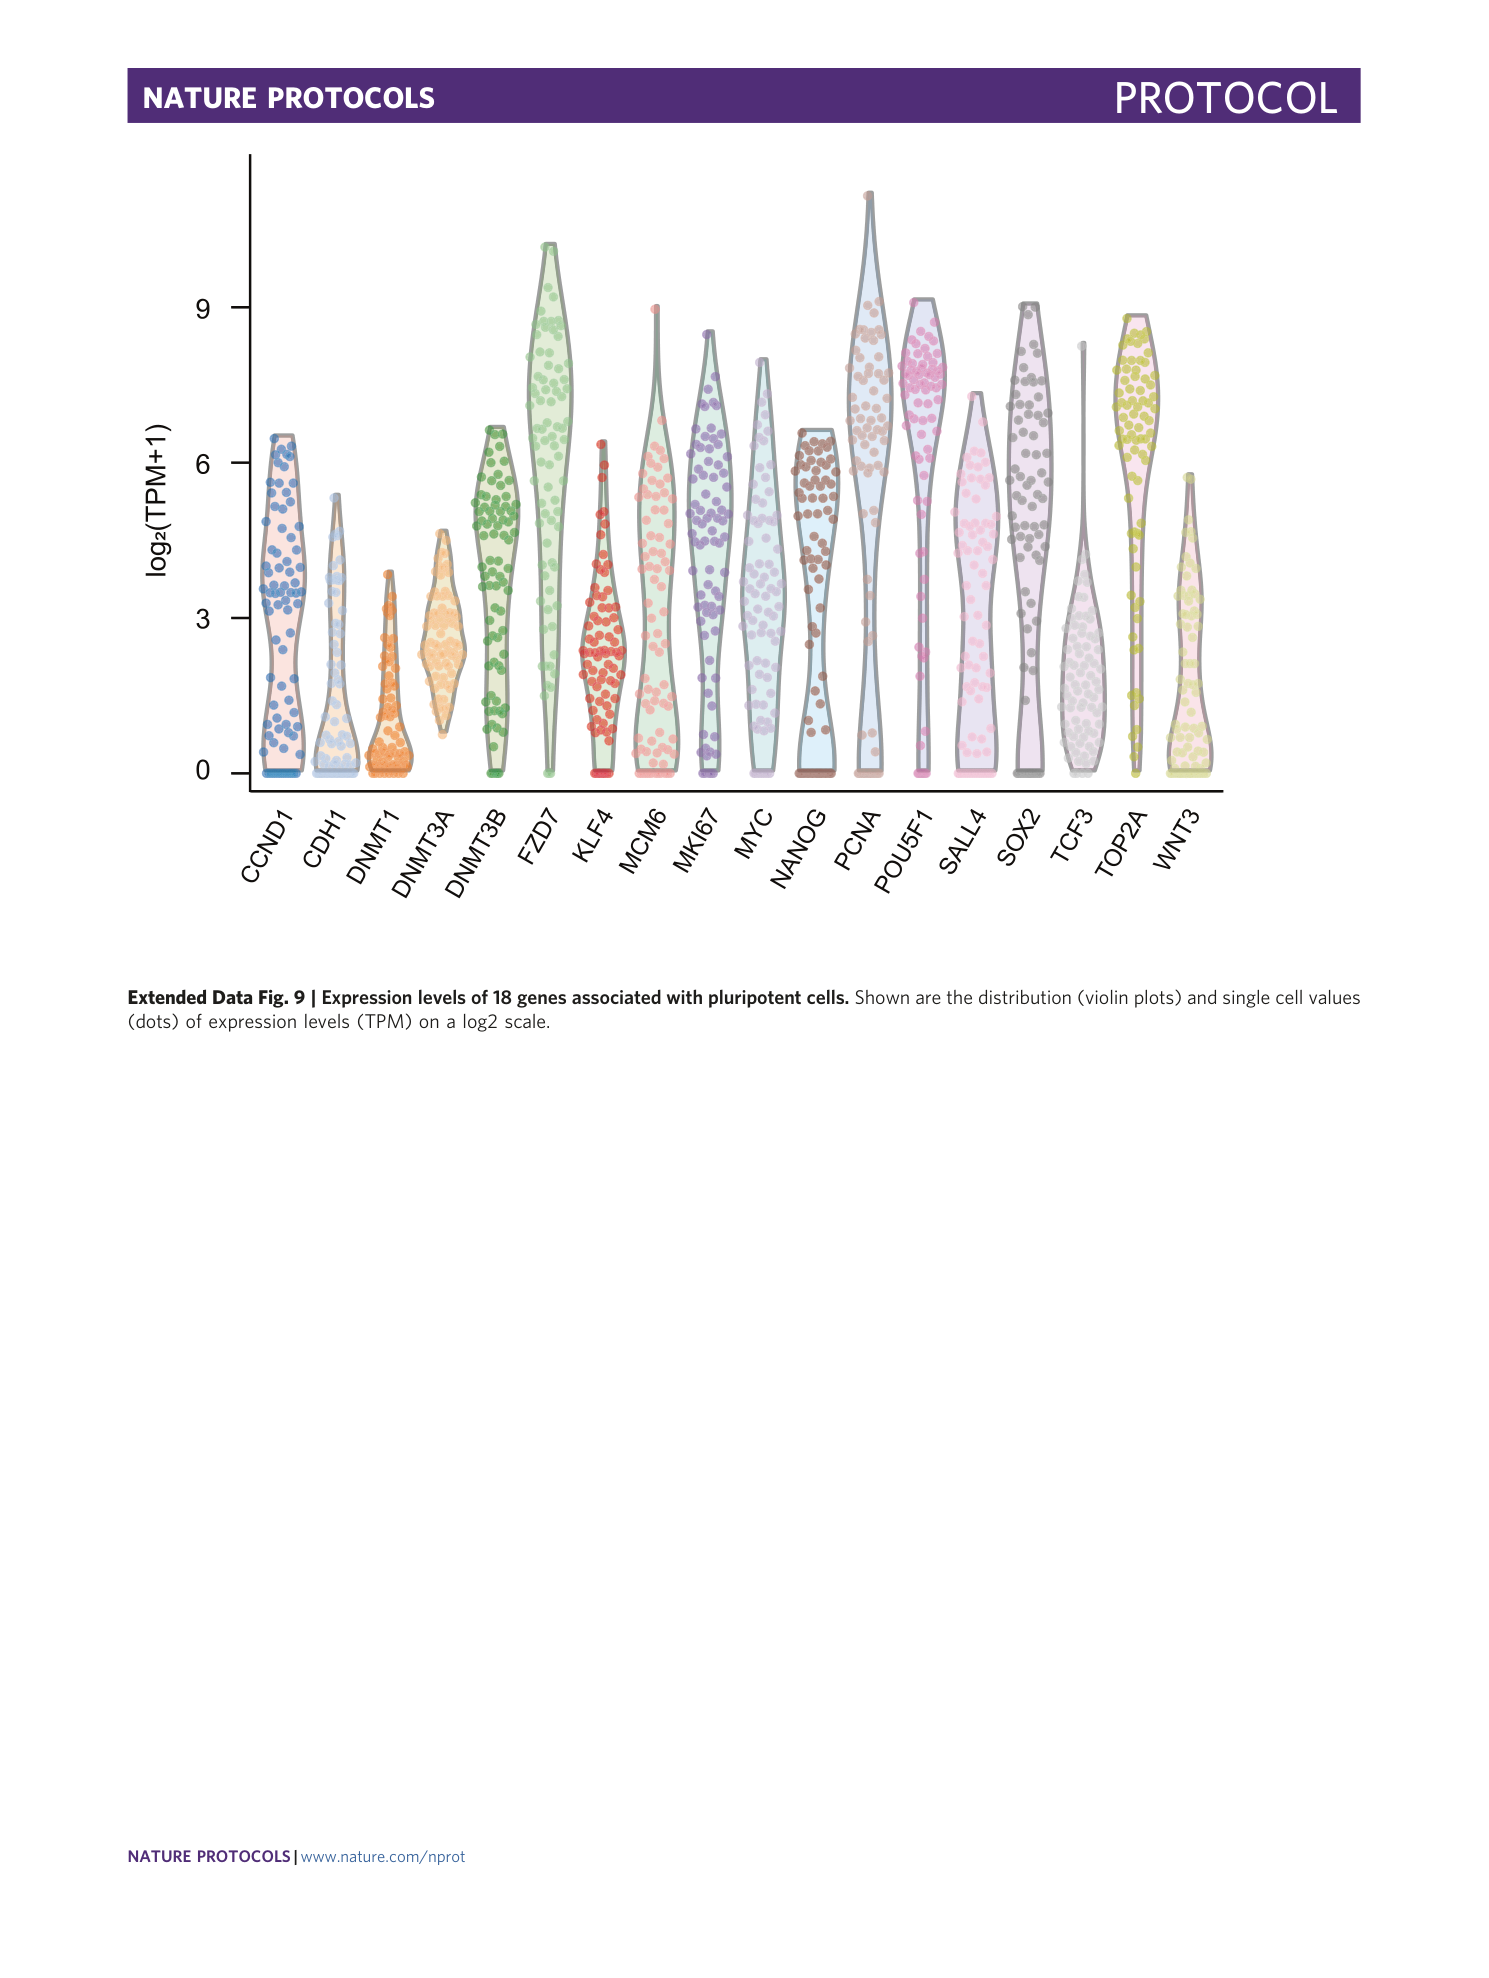
Extended Data Fig. 9 Expression levels of 18 genes associated with pluripotent cells.
Shown are the distribution (violin plots) and single cell values (dots) of expression levels (TPM) on a log2 scale.
Supplementary information
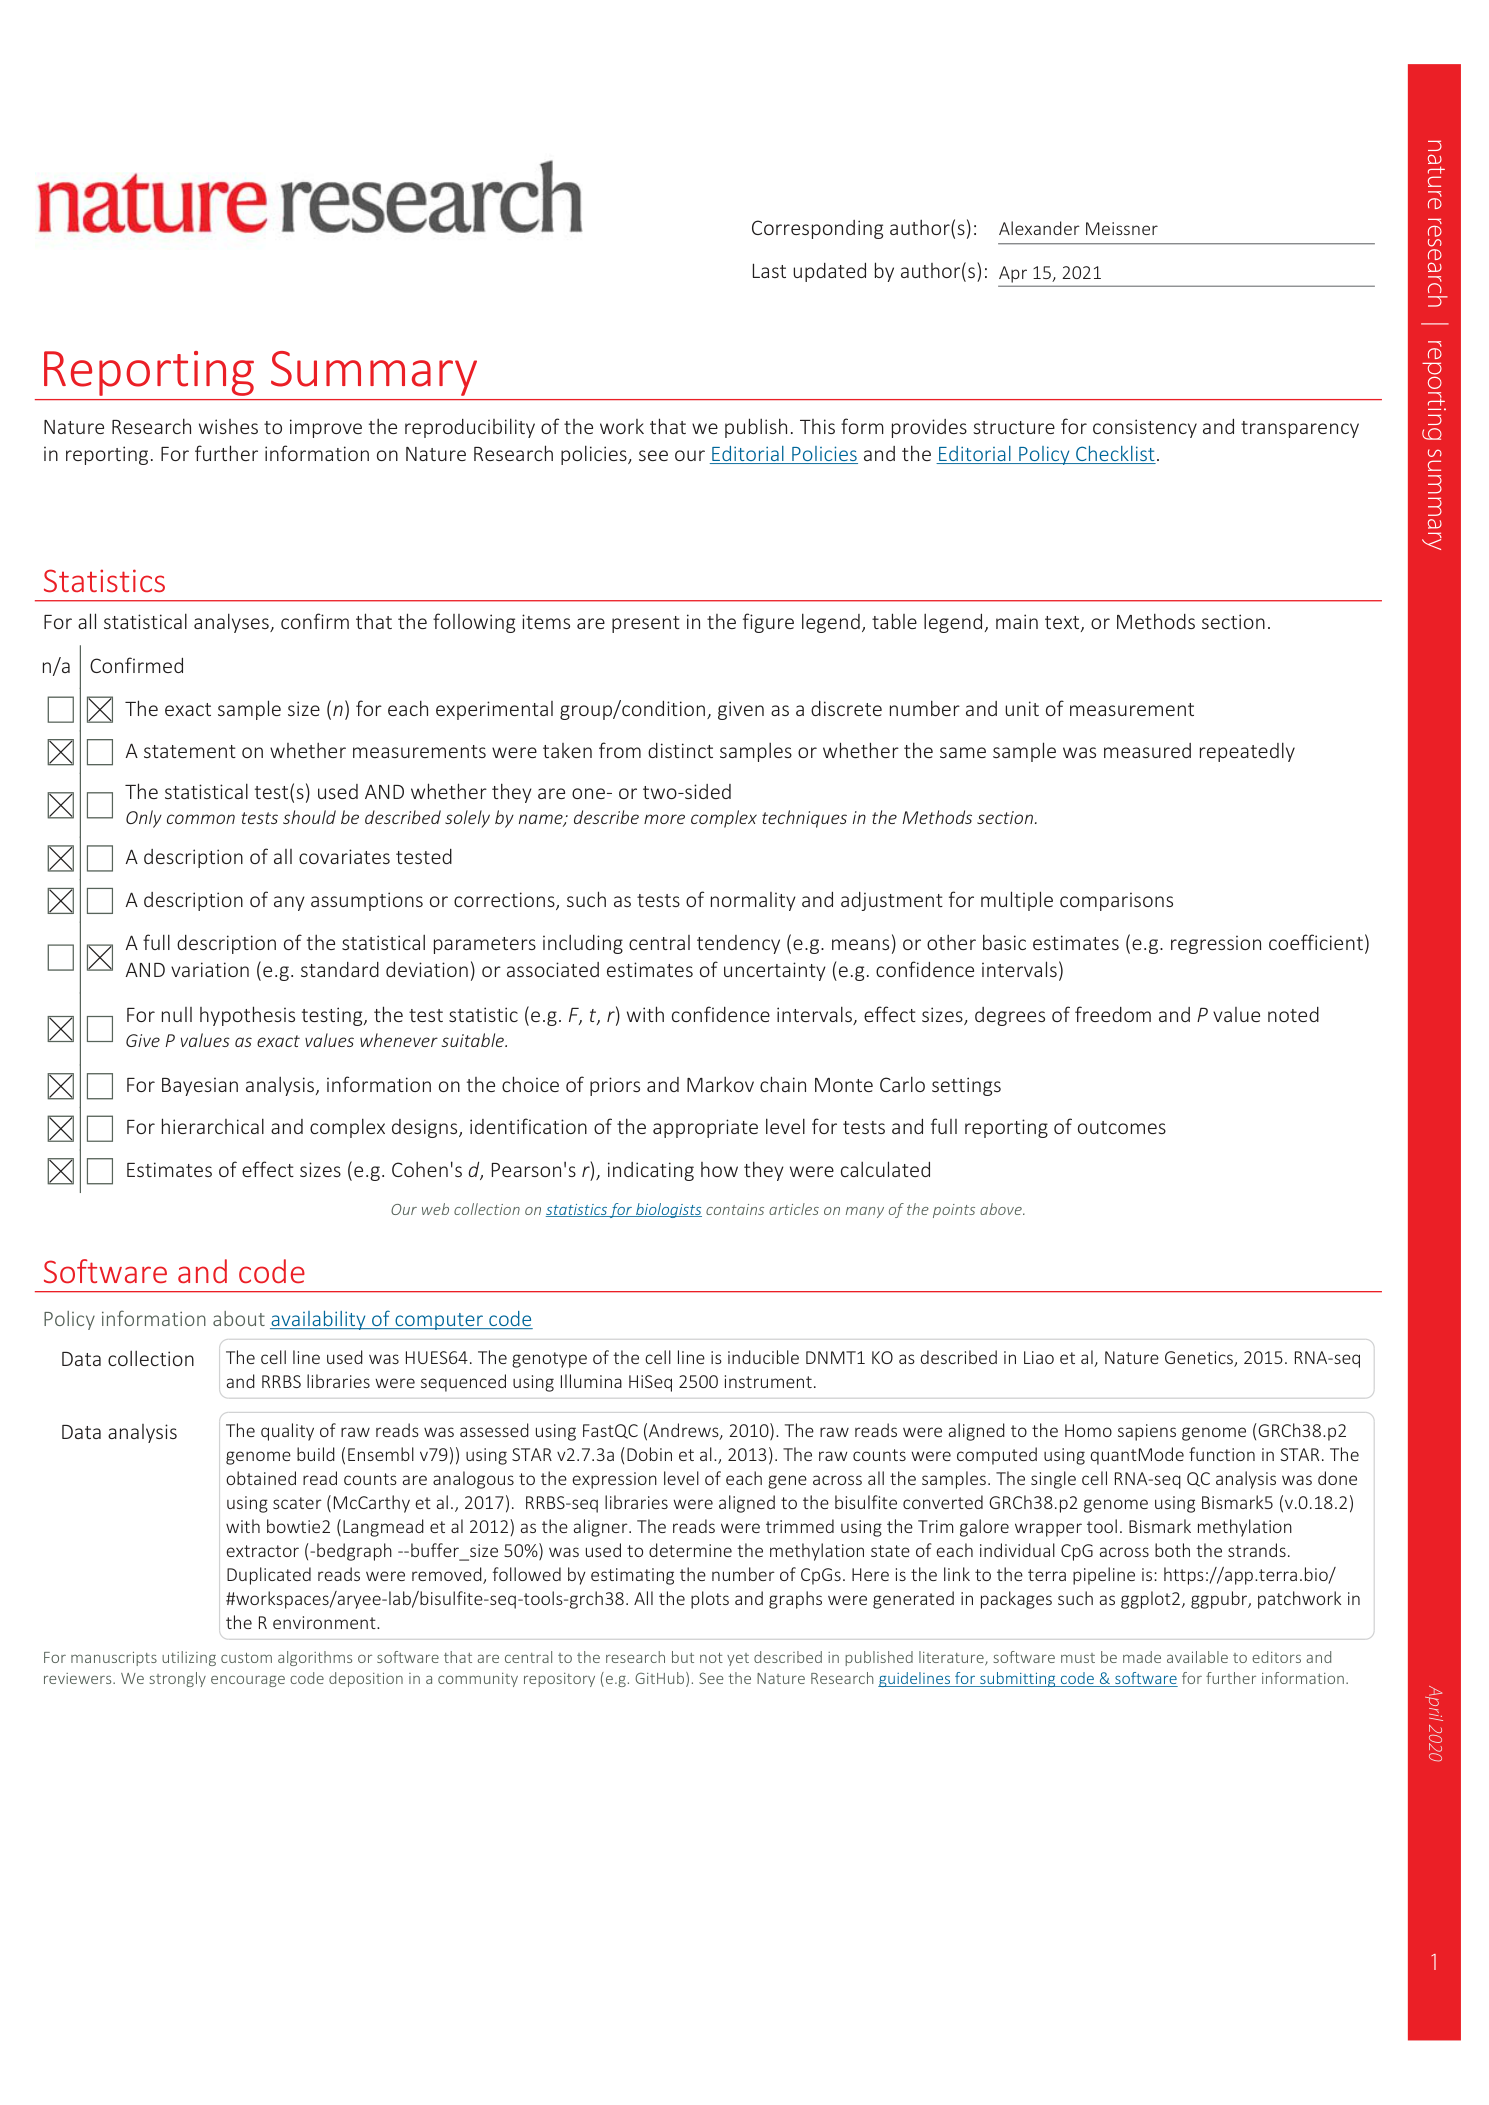
Reporting Summary
Supplementary Data 1
RRBS adapter oligonucleotides
Supplementary Data 2
UDI and single i7 index RRBS PCR primers
