Scalable tissue labeling and clearing of intact human organs
Hongcheng Mai, Zhouyi Rong, Shan Zhao, Ruiyao Cai, Hanno Steinke, Ingo Bechmann, Ali Ertürk


Extended
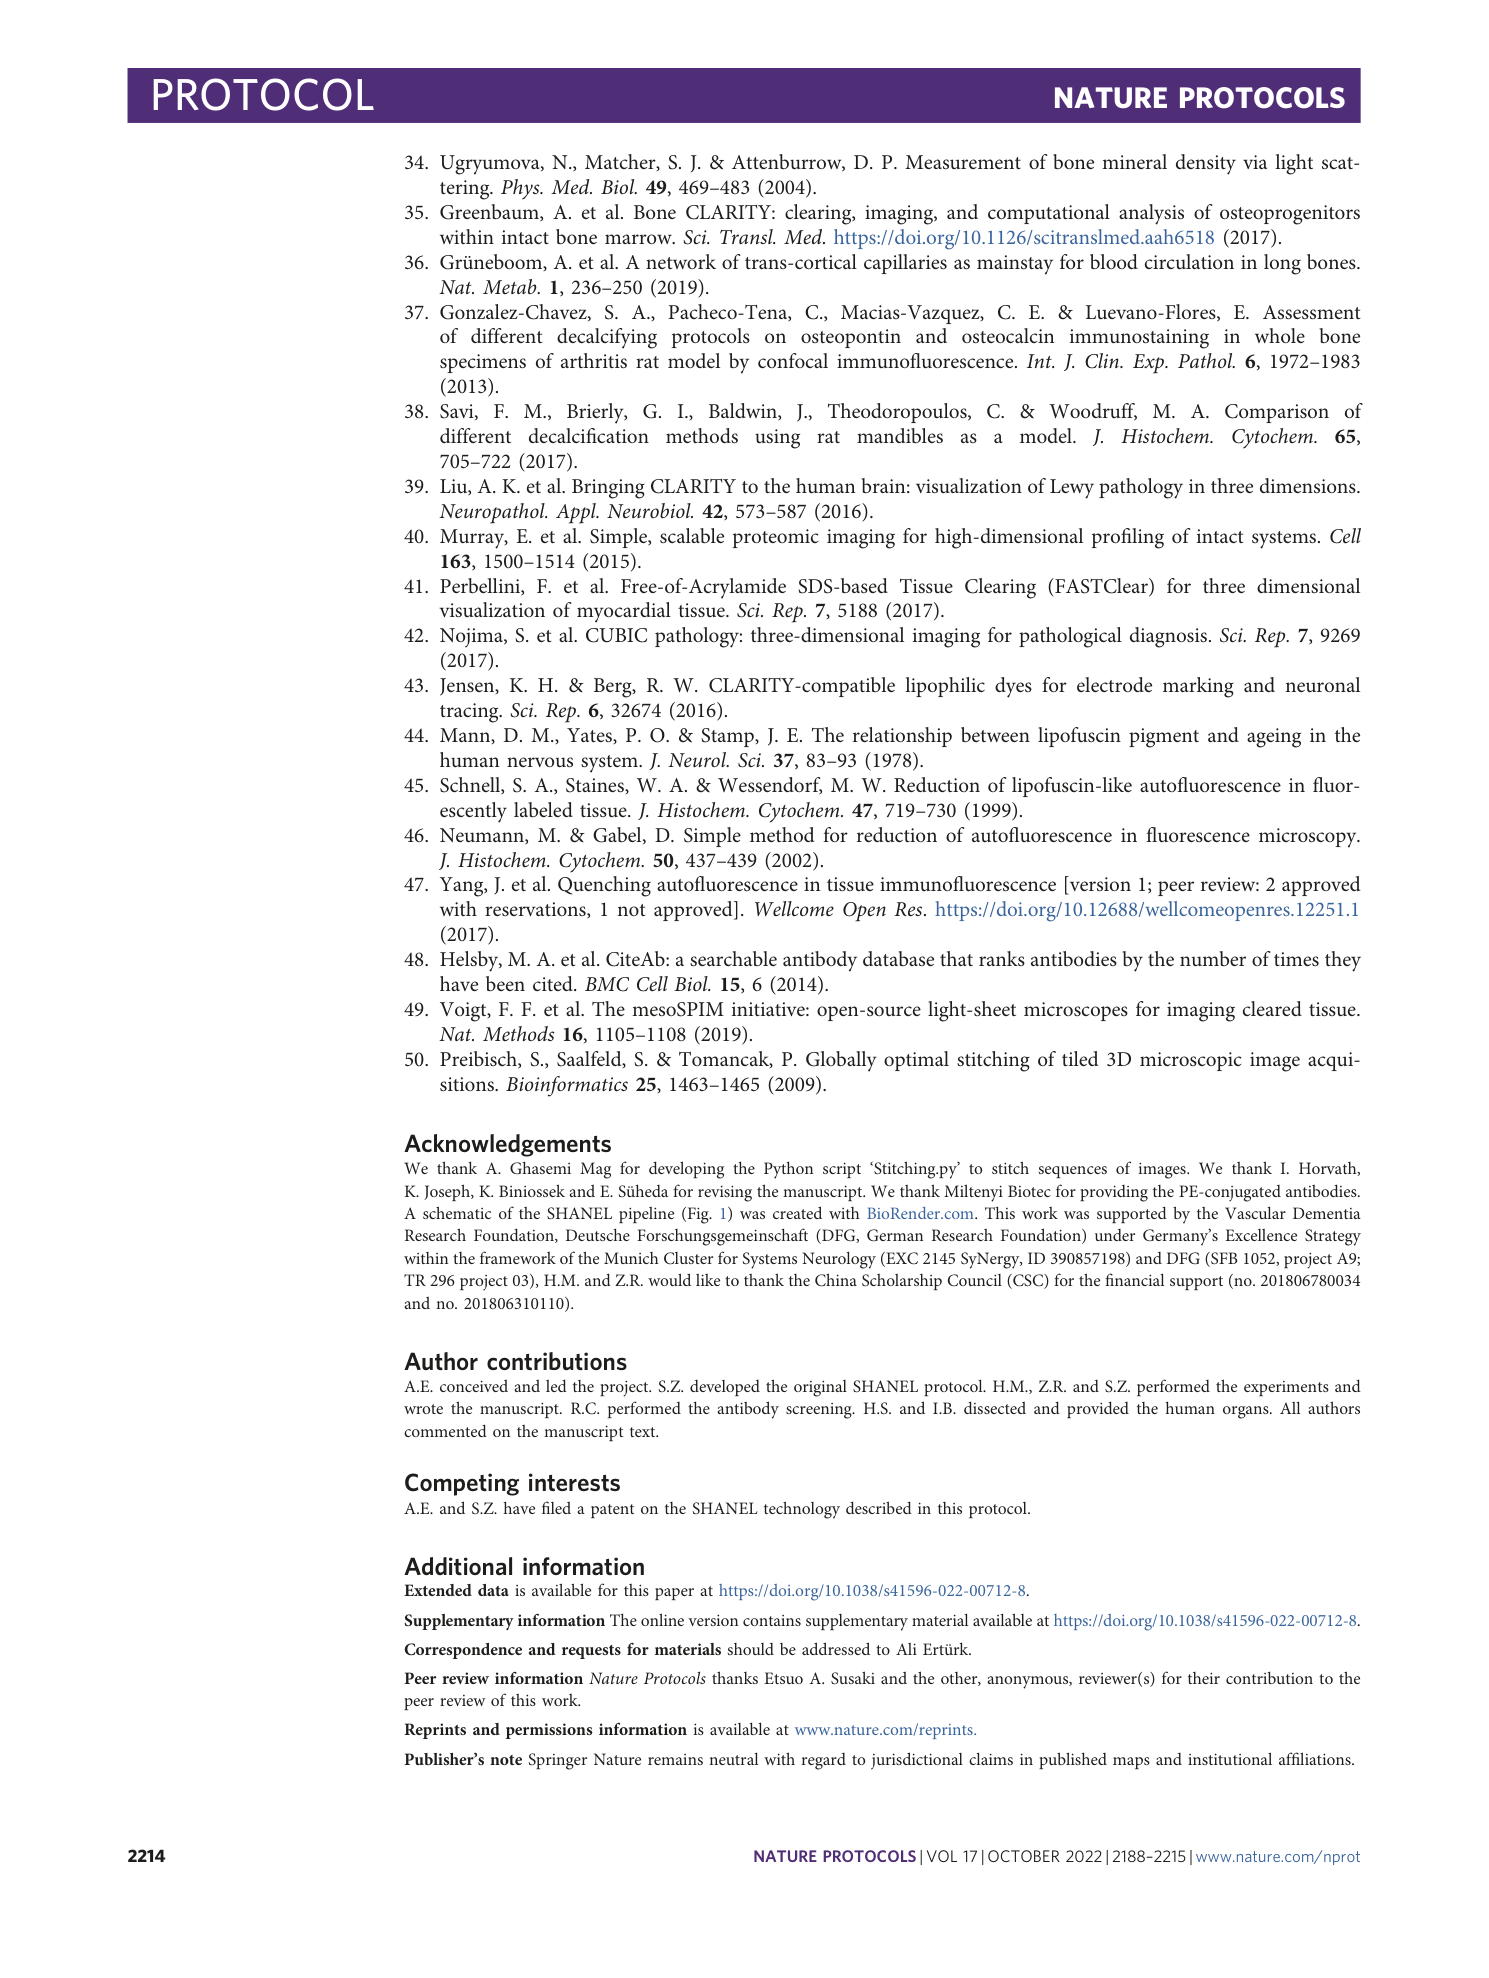
Extended Data Fig. 1 Human brain clearing by perfusion system.
a , The dissection of human brain with CL and CR (left and right carotids, respectively), VL and VR (left and right vertebral arteries, respectively). b , The human brain after dissection and fixation. c , The setup to clear a human brain by perfusion system under the fume hood. The human brain was put in a glass container and connected with input and output tubing controlled by a peristaltic pump. There are four channels controlling the four connecting tubes as indicated in c (i). Two output tubes are connected to the carotid arteries as shown in c (ii), and two output tubes are connected to the vertebral arteries as shown in c (iii). The input tubes are protected with gauze to avoid solid impurities entering and blocking the tubing (see c (iv)). c (v) shows the decolorization effects of CHAPS/NMDEA that manifest as the blooming of dark-green color from the organ. d , The glass container was sealed with several layers of plastic wrap to prevent evaporation of the running solutions, especially EtOH, DCM and MeOH. e , Photo of human brain after SHANEL pretreatment and before clearing. Remaining blood in the vessels ( b ) was decolorized.
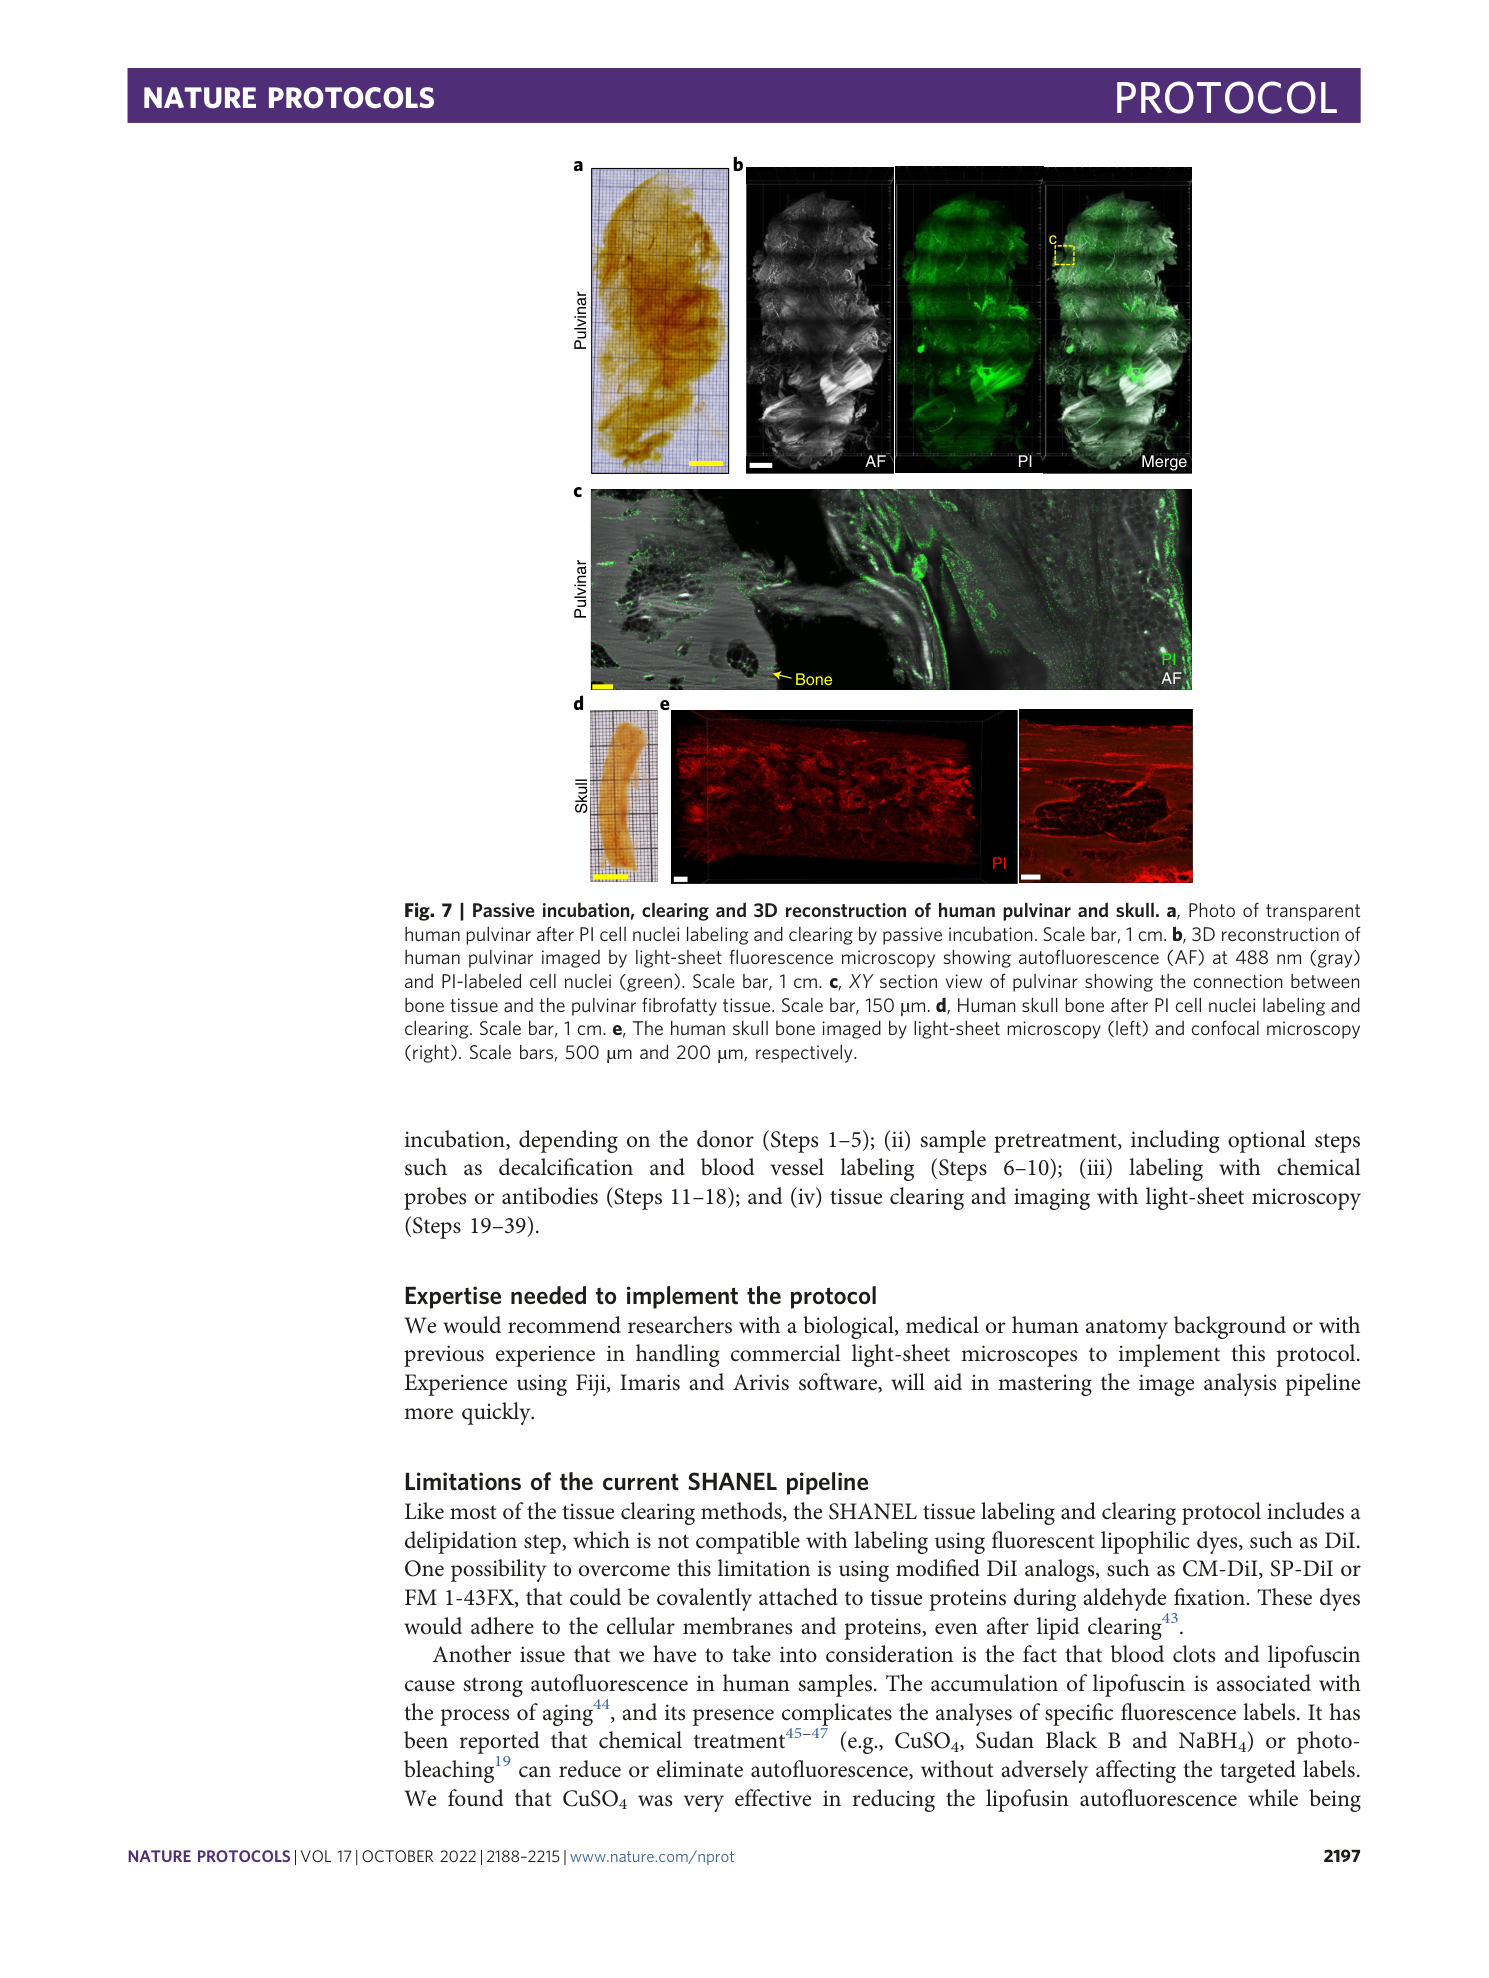
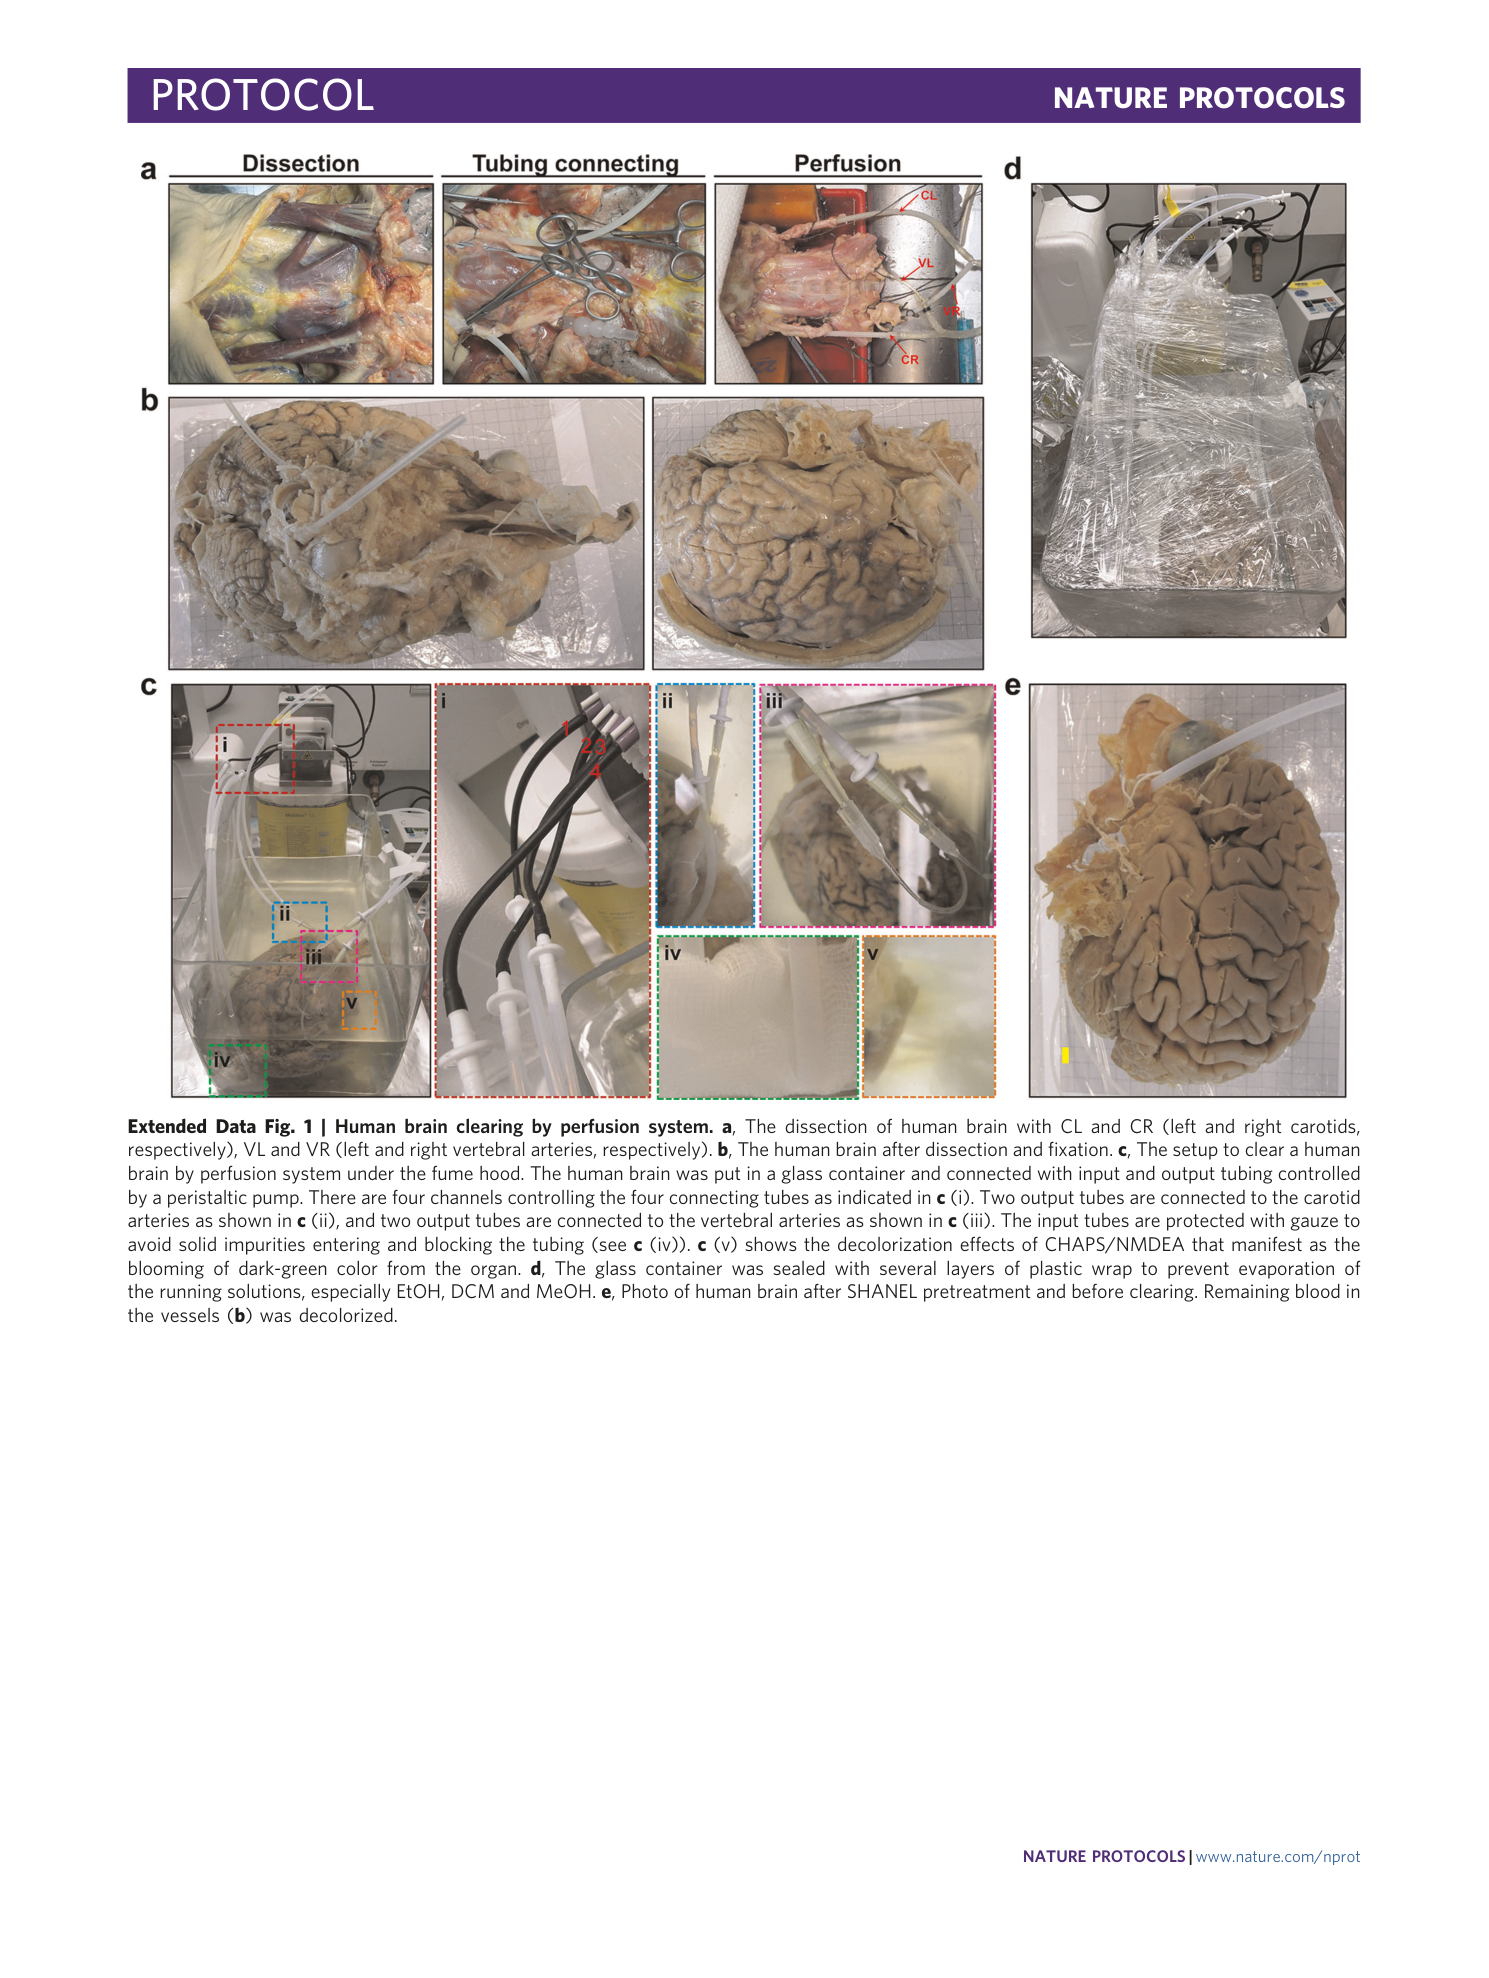
Extended Data Fig. 2 Passively stained conjugated antibody in centimeter-size human kidney and lung tissue.
a , b , Collagen IV, catalase and cytokeratin 19 antibody staining (green) in human kidney ( a ) and lung ( b ). Top panel in a and b shows immunofluorescent staining images obtained by confocal microscopy to verify antibody compatibility with SHANEL. Bottom panel shows 3D reconstruction of tissue with antibody labeling in Imaris. Scale bars, 20 µm and 500 µm, respectively.
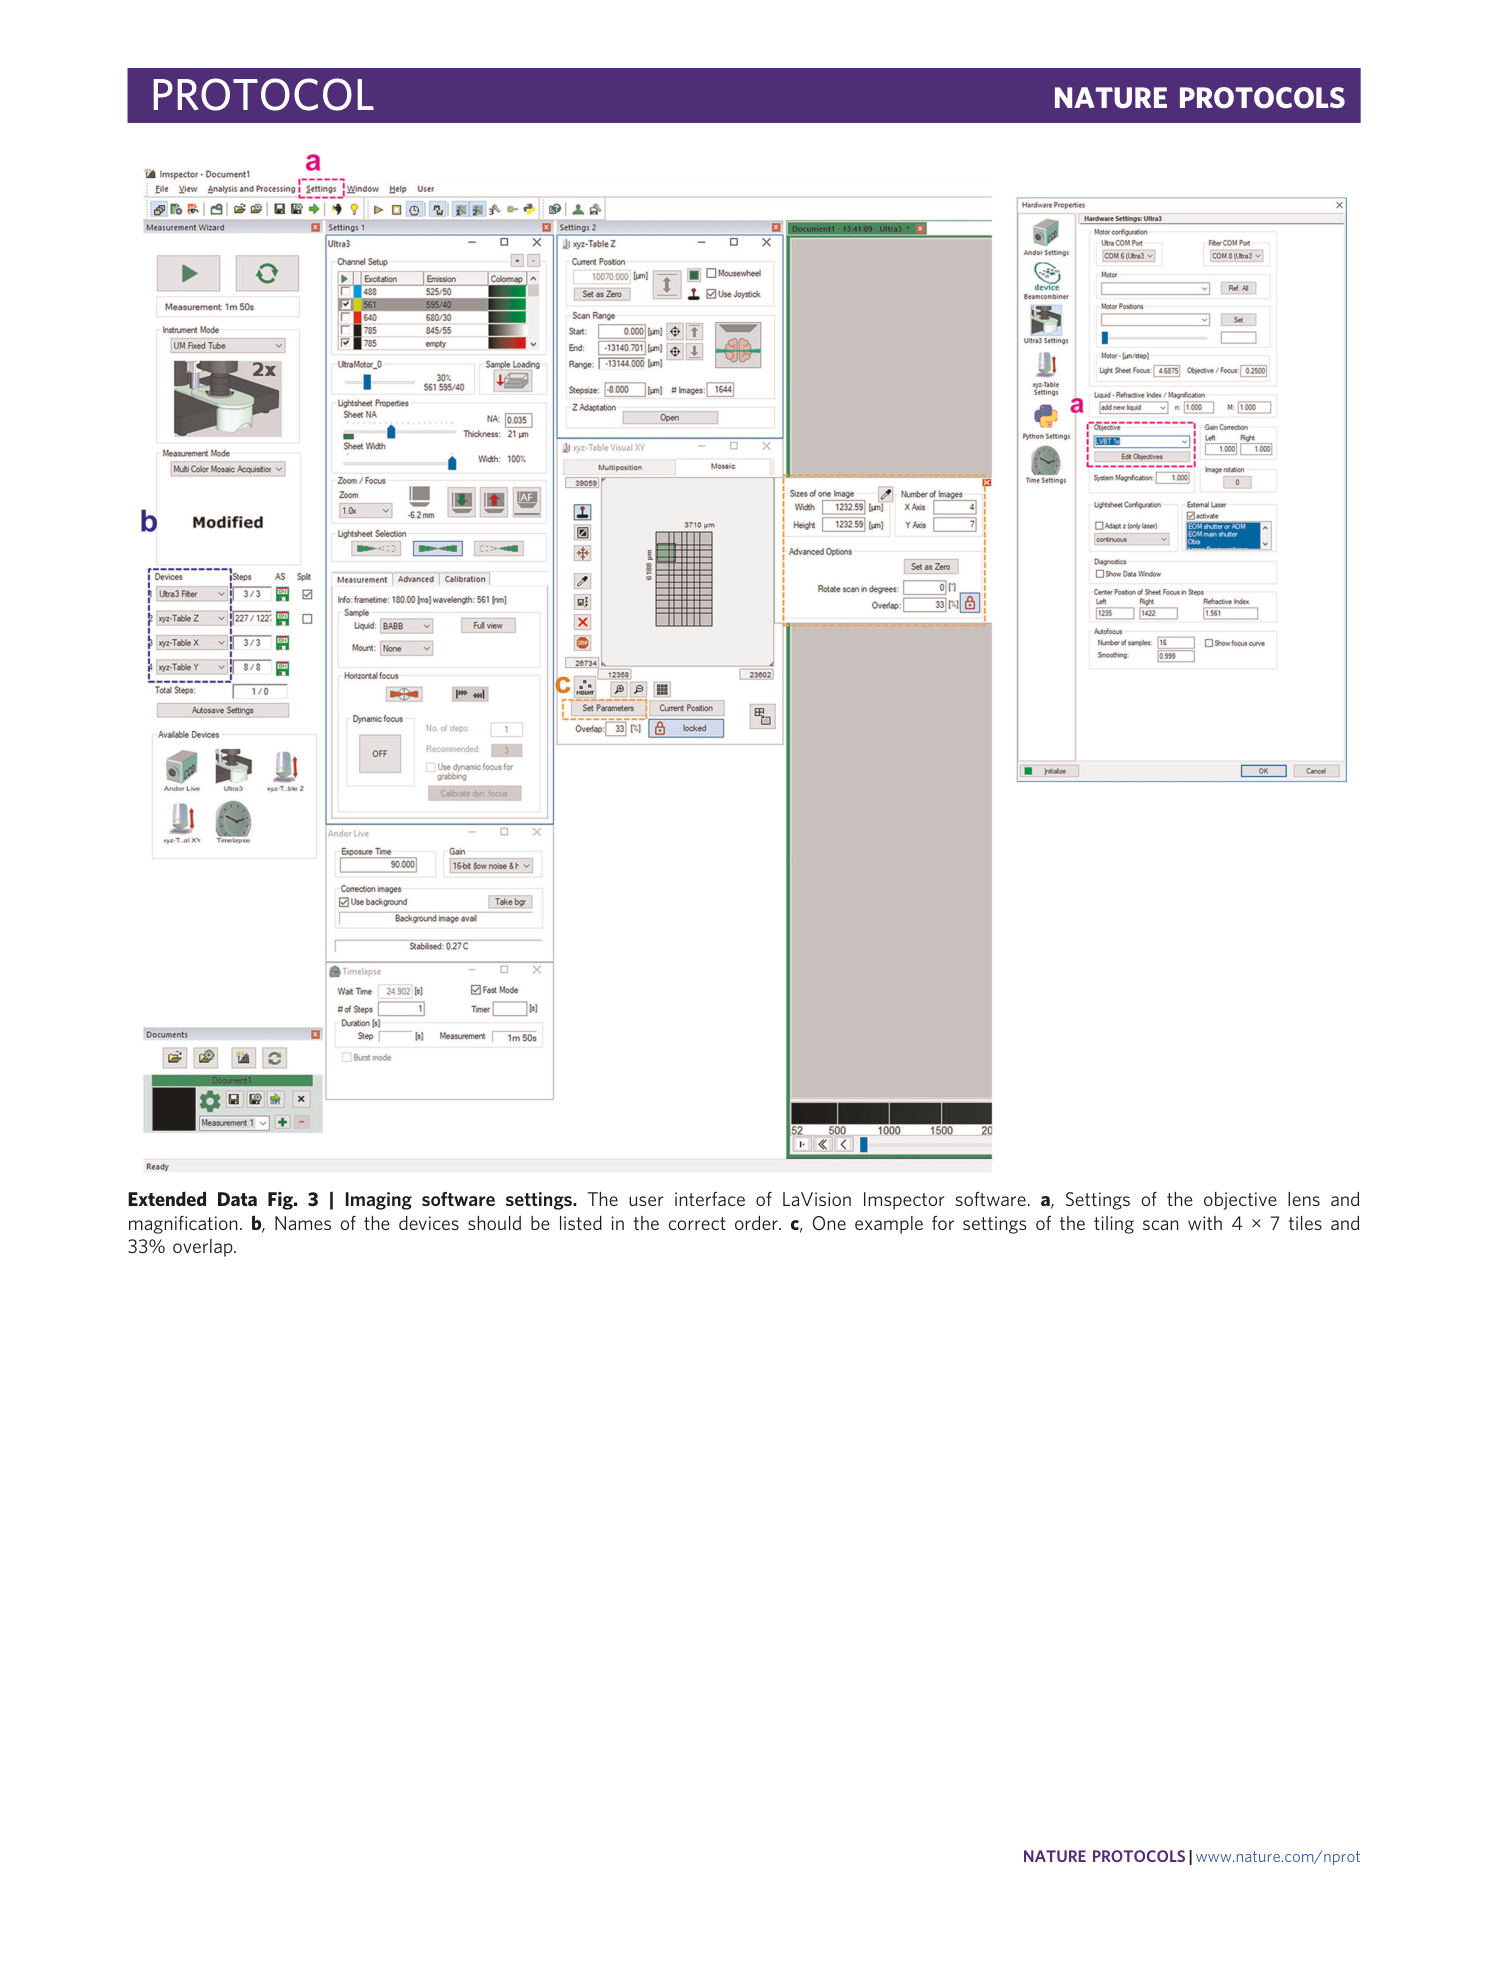
Extended Data Fig. 3 Imaging software settings.
The user interface of LaVision Imspector software. a , Settings of the objective lens and magnification. b , Names of the devices should be listed in the correct order. c , One example for settings of the tiling scan with 4 × 7 tiles and 33% overlap.
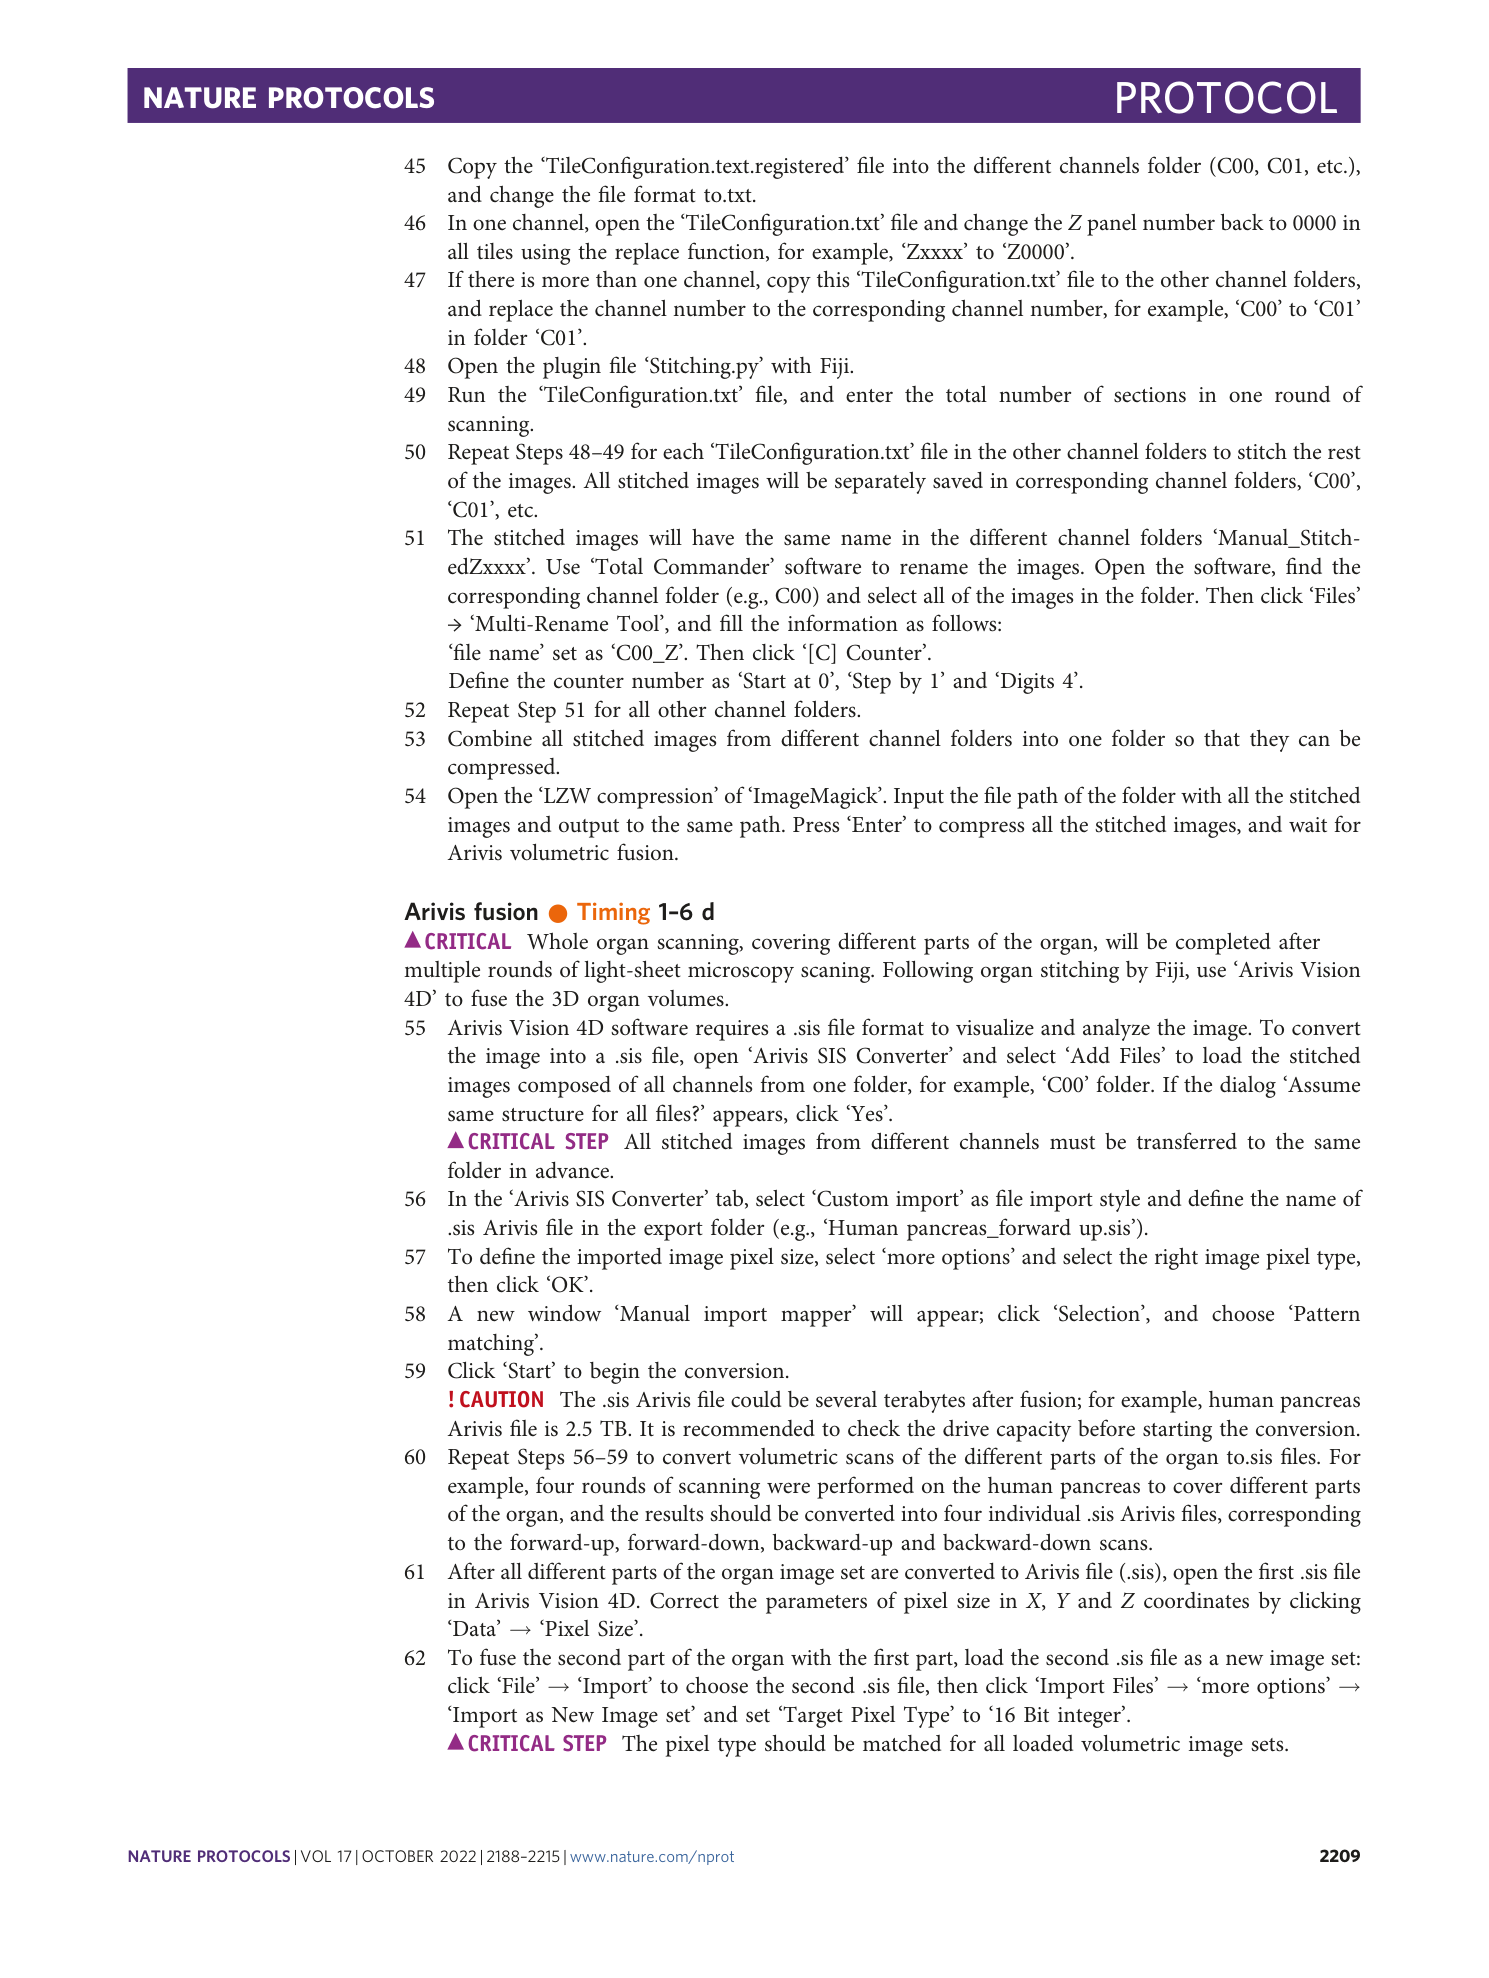
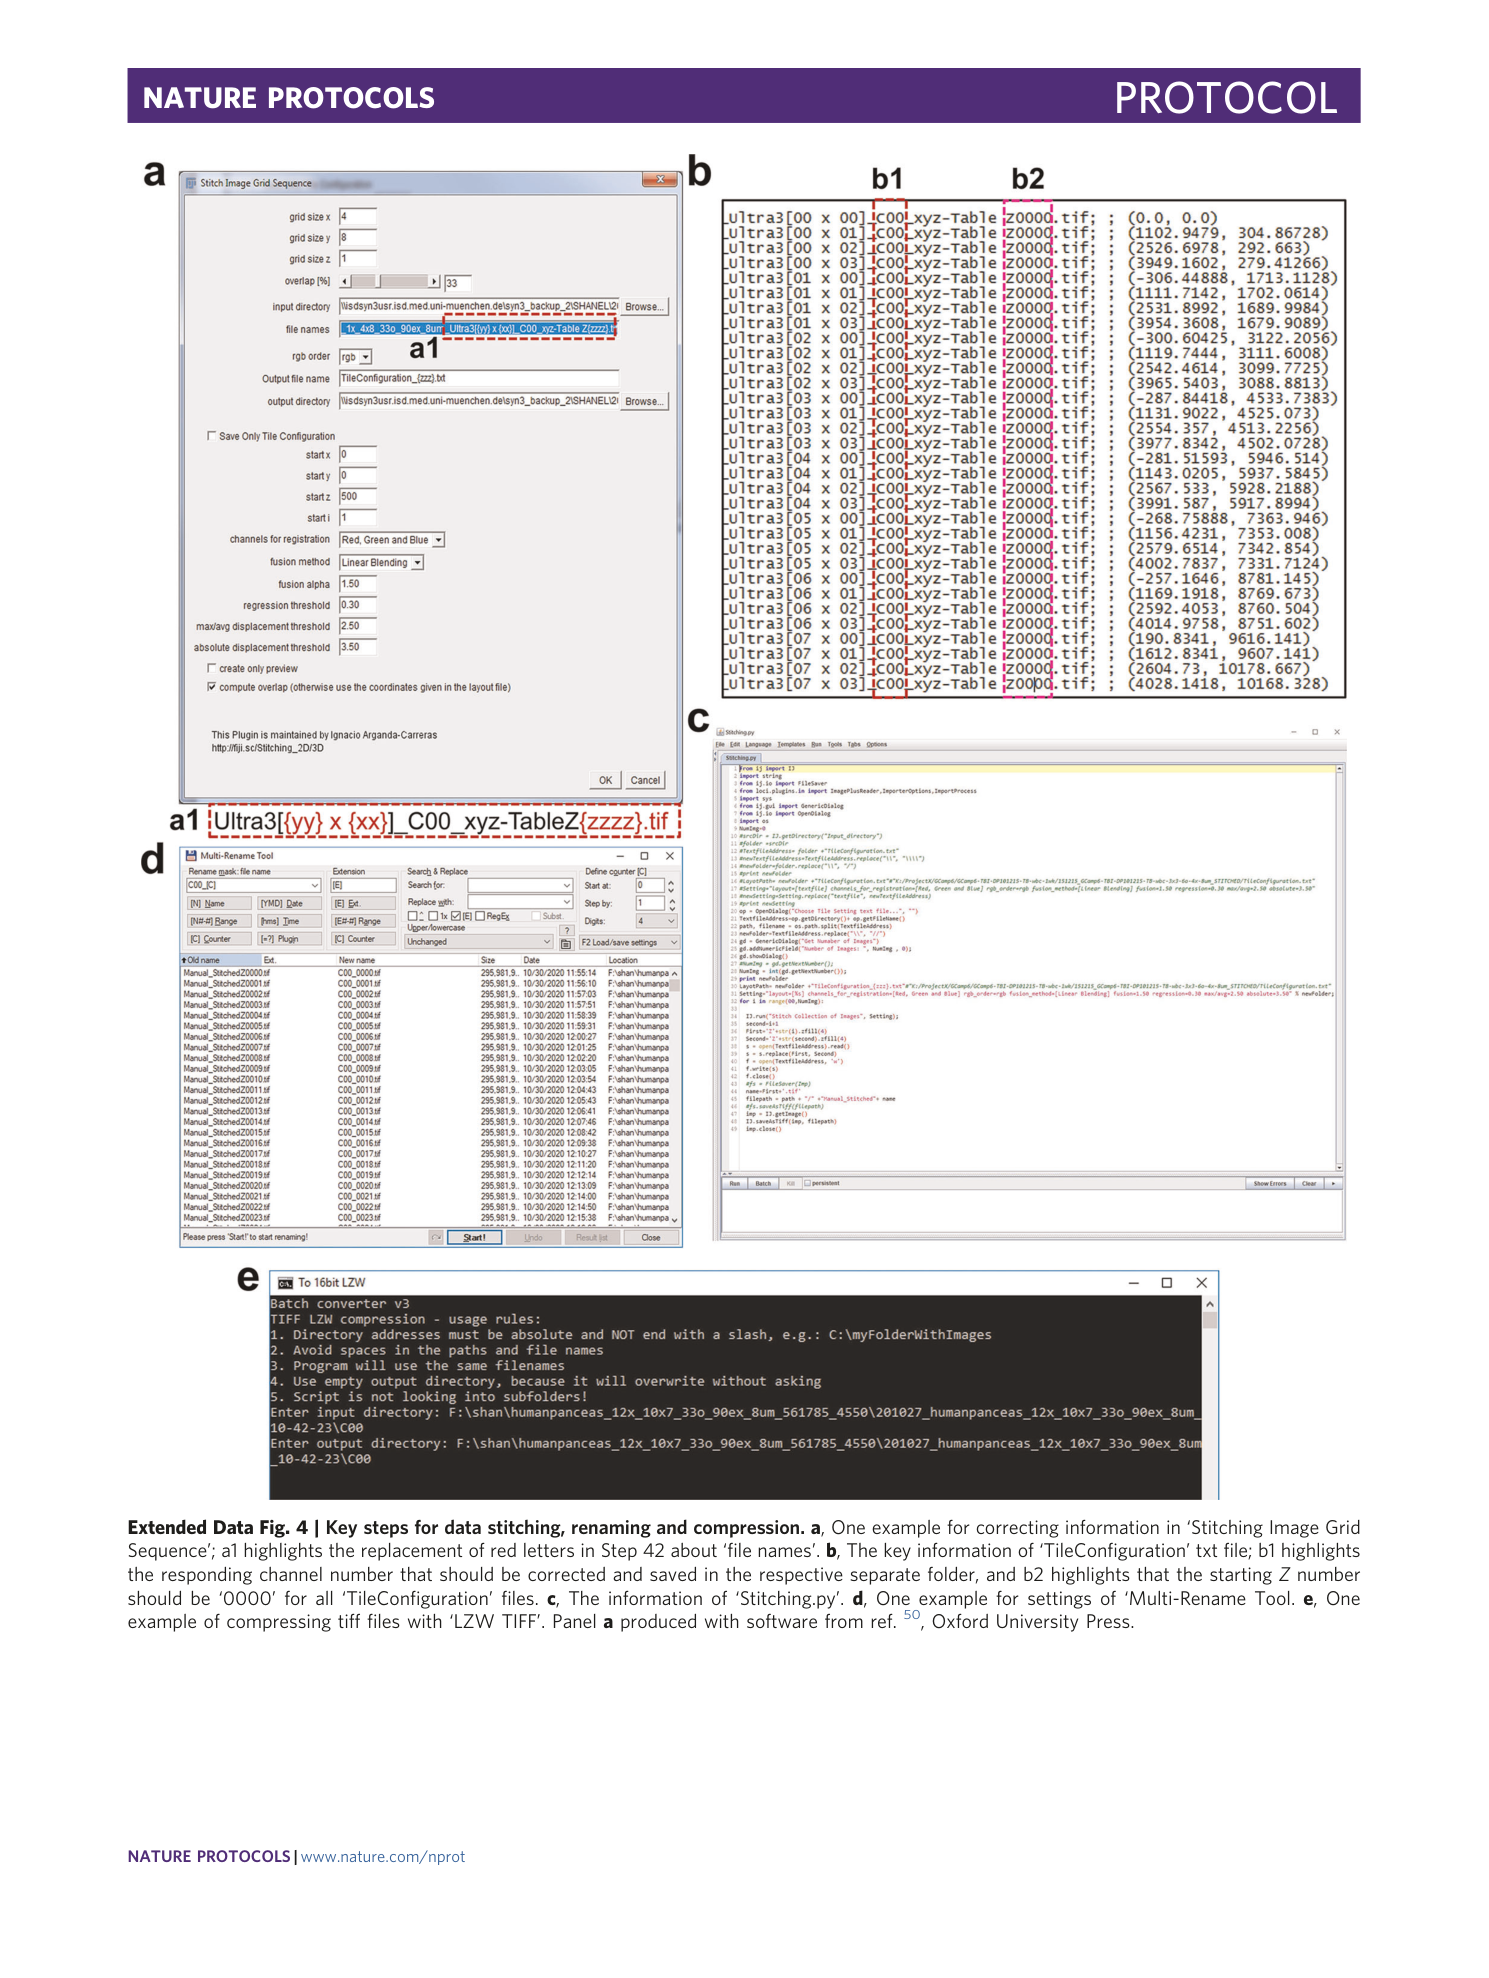
Extended Data Fig. 4 Key steps for data stitching, renaming and compression.
a , One example for correcting information in ‘Stitching Image Grid Sequence’; a1 highlights the replacement of red letters in Step 42 about ‘file names’. b , The key information of ‘TileConfiguration’ txt file; b1 highlights the responding channel number that should be corrected and saved in the respective separate folder, and b2 highlights that the starting Z number should be ‘0000’ for all ‘TileConfiguration’ files. c , The information of ‘Stitching.py’. d , One example for settings of ‘Multi-Rename Tool. e , One example of compressing tiff files with ‘LZW TIFF’. Panel a produced with software from ref. 50 , Oxford University Press.
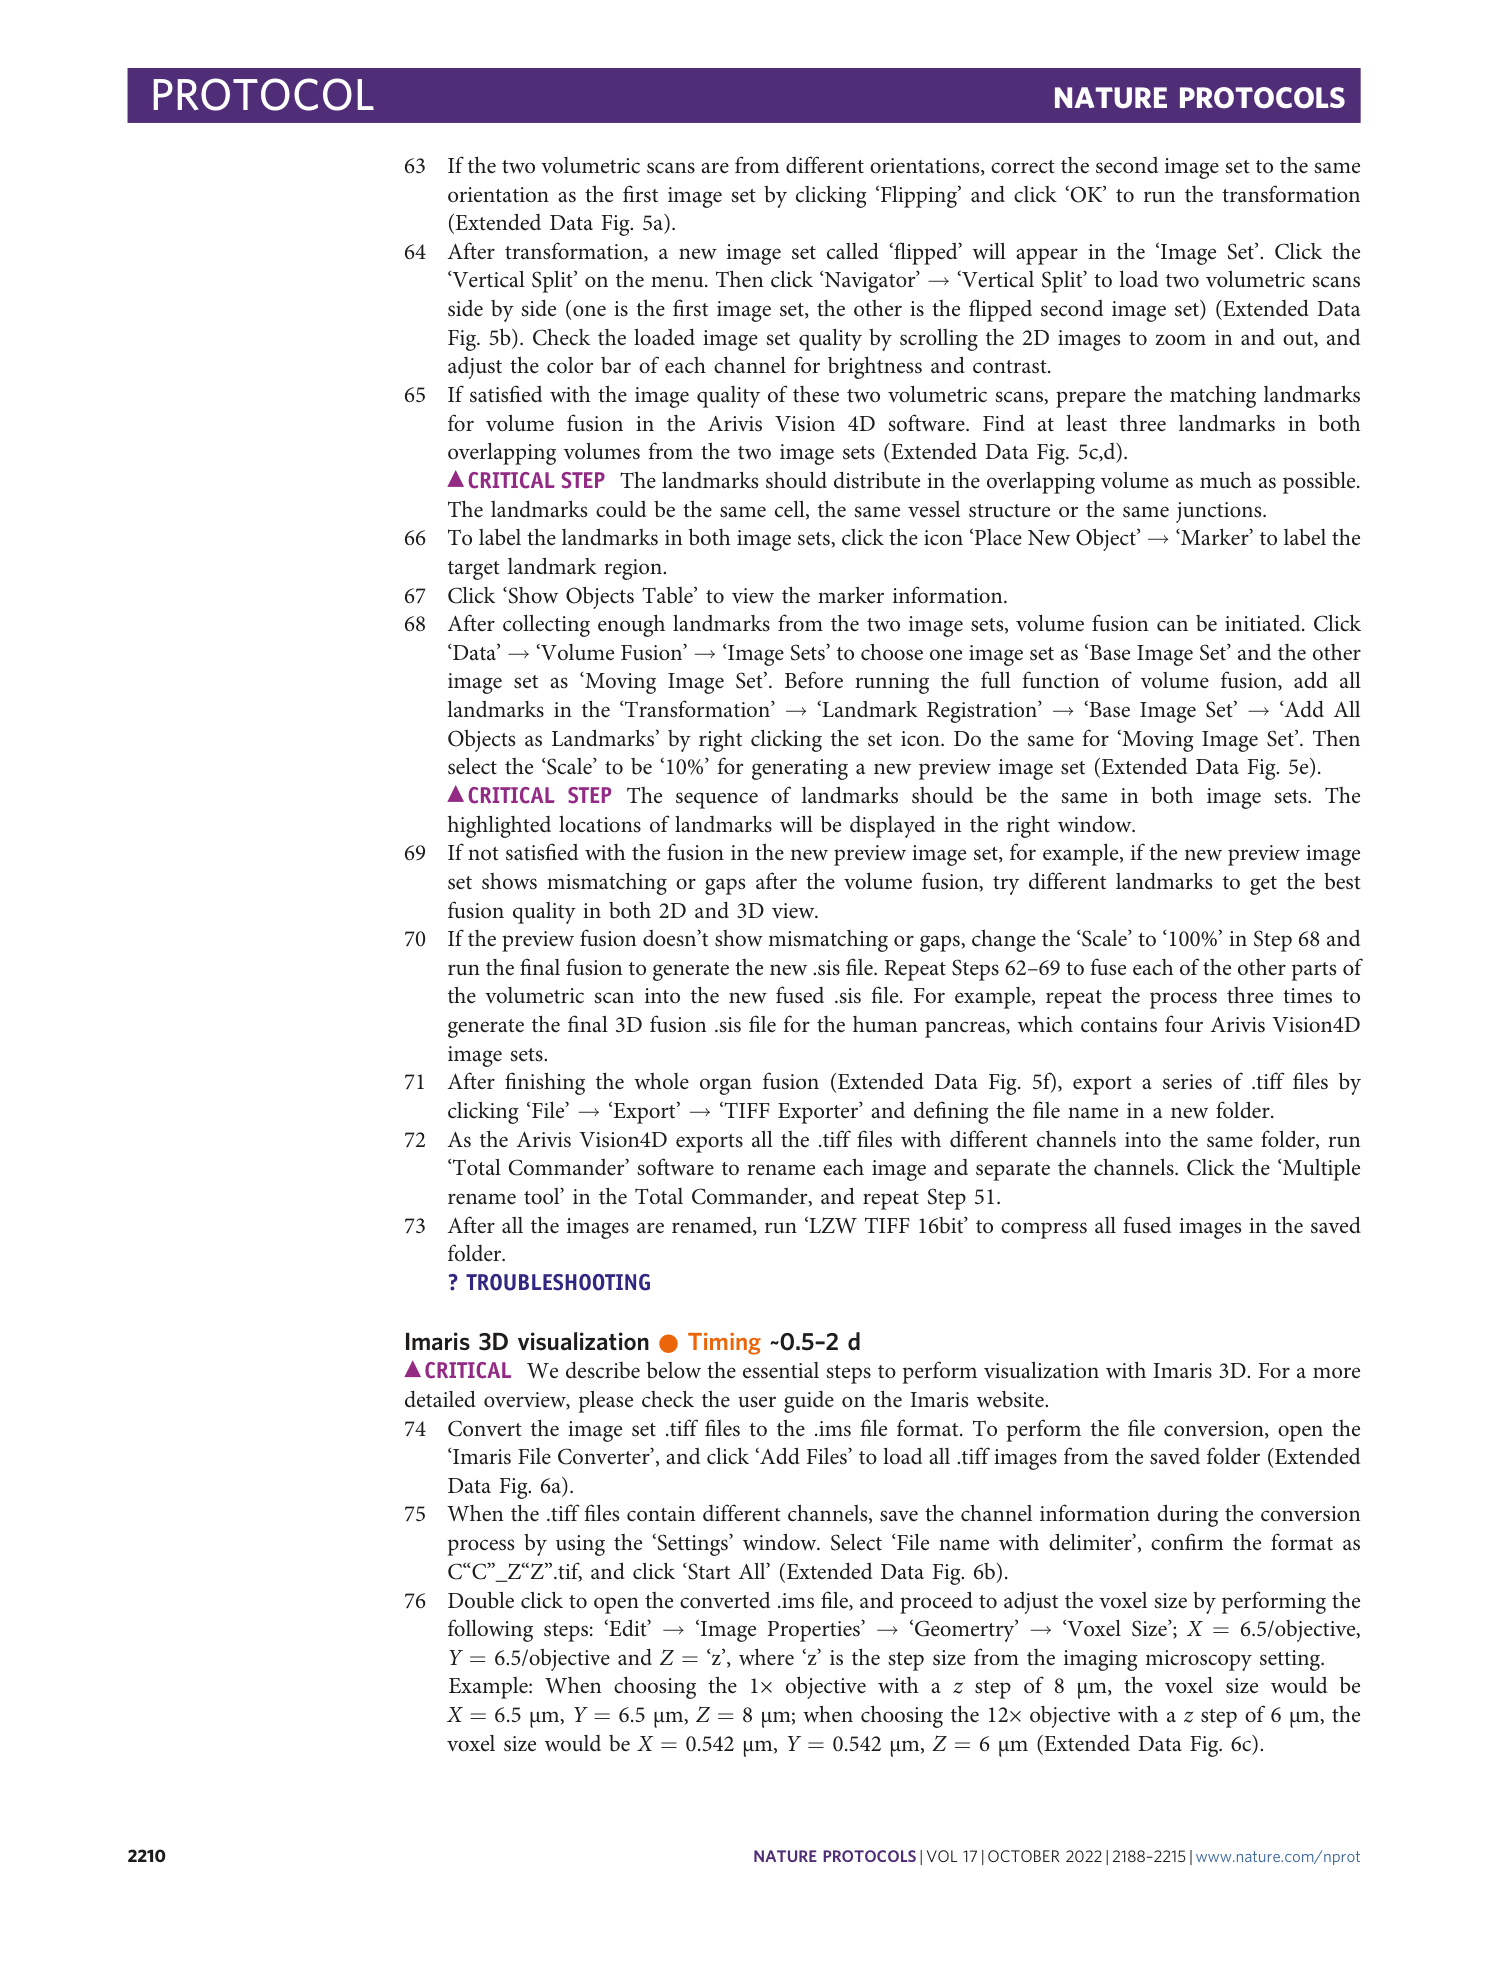
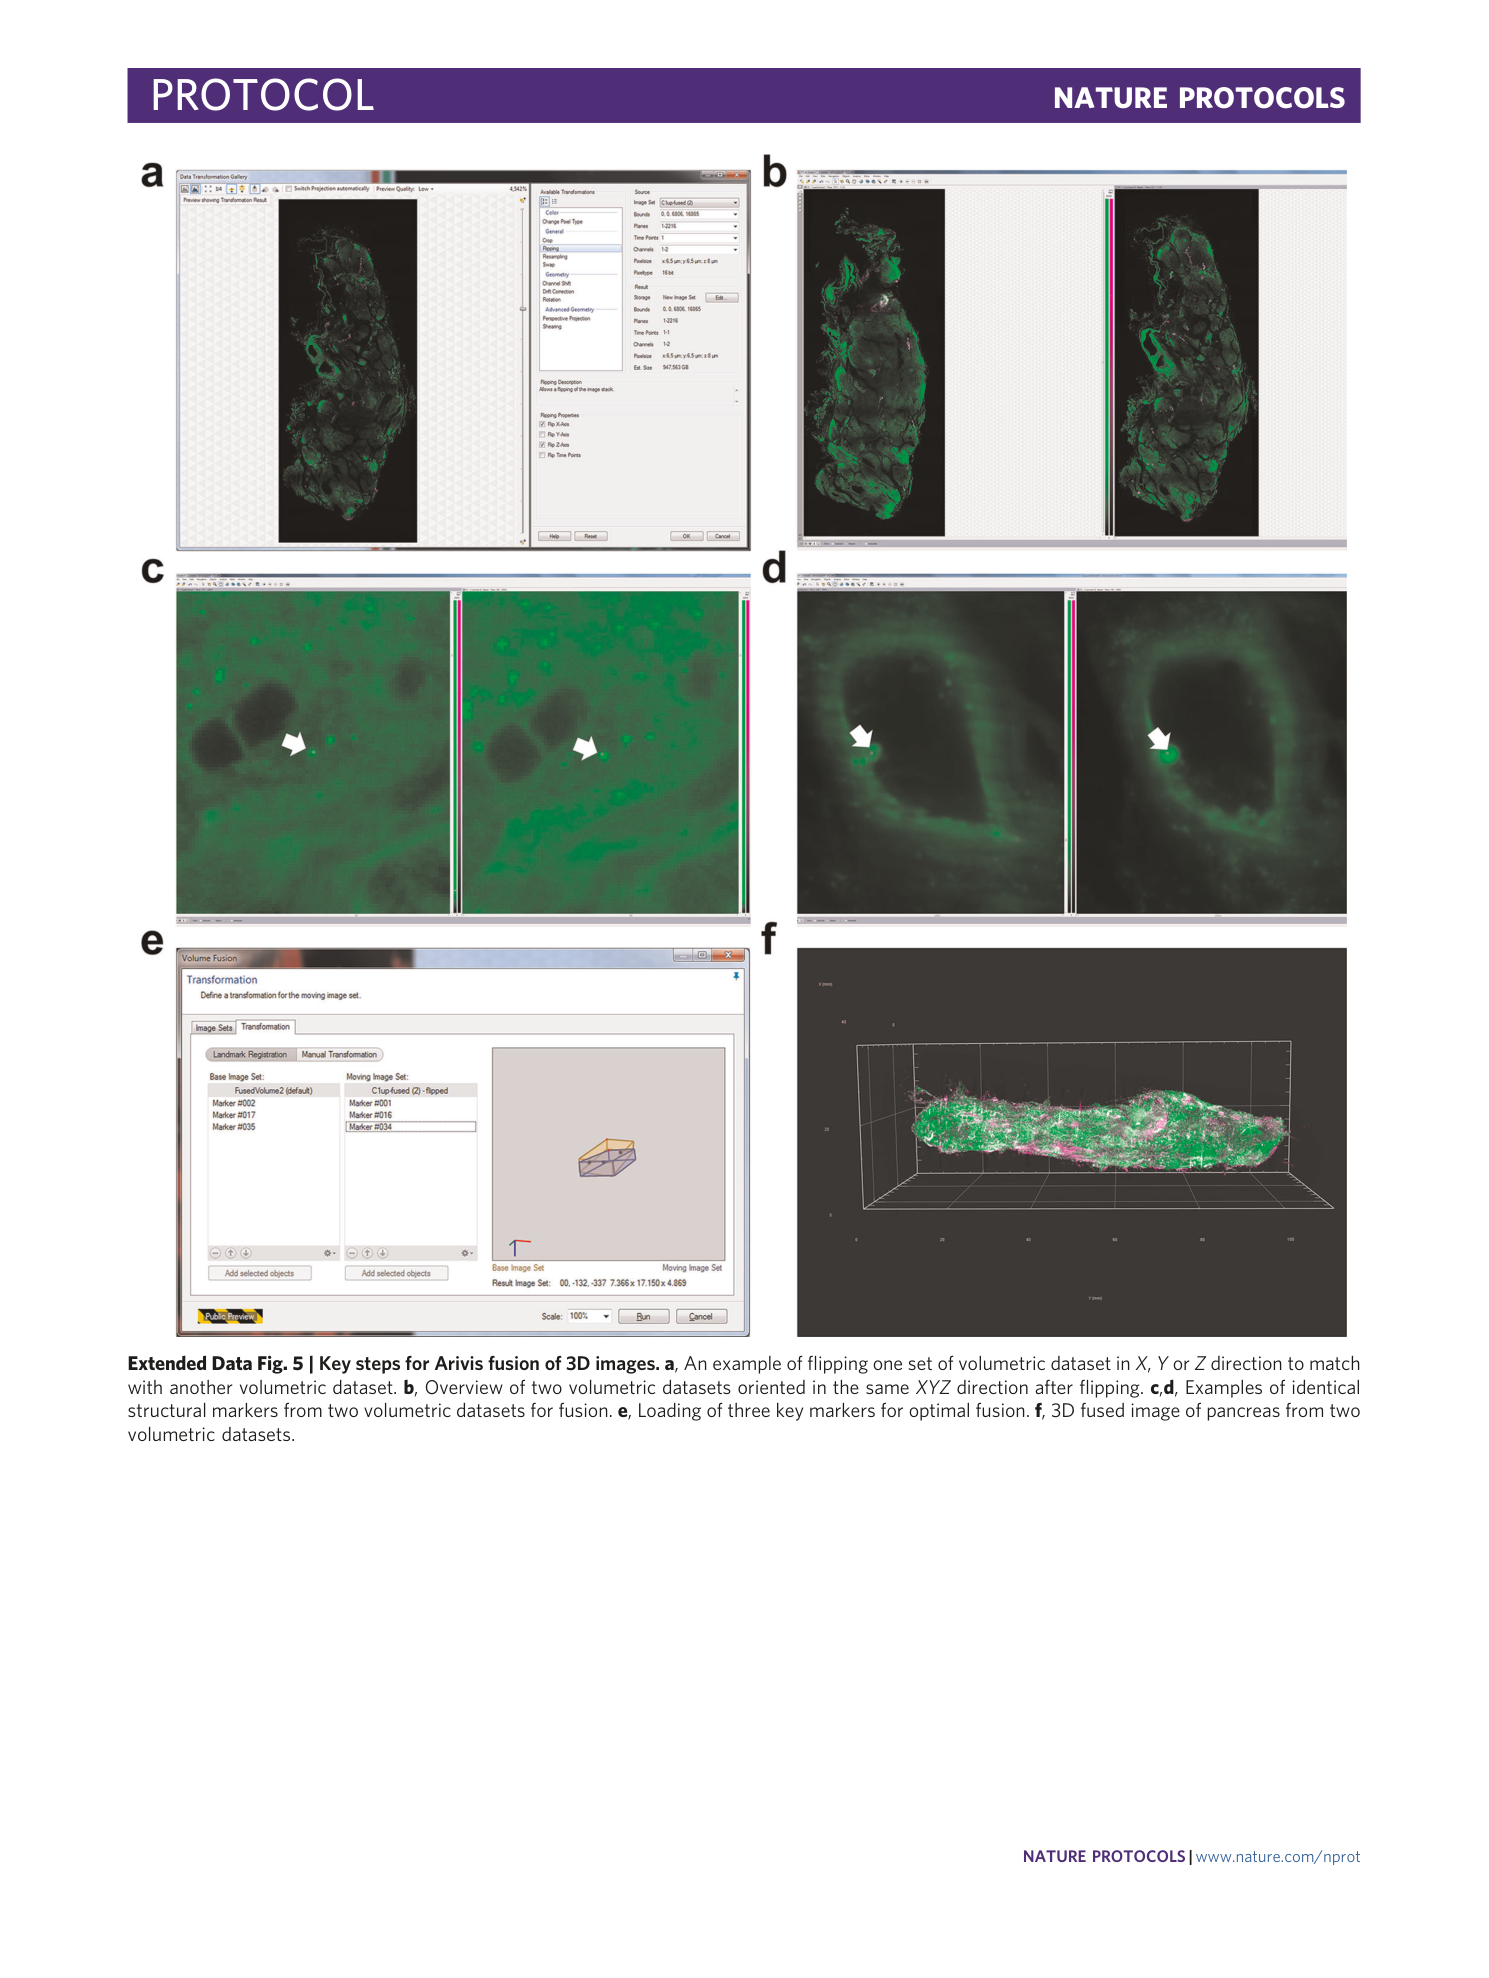
Extended Data Fig. 5 Key steps for Arivis fusion of 3D images.
a , An example of flipping one set of volumetric dataset in X , Y or Z direction to match with another volumetric dataset. b , Overview of two volumetric datasets oriented in the same XYZ direction after flipping. c , d , Examples of identical structural markers from two volumetric datasets for fusion. e , Loading of three key markers for optimal fusion. f , 3D fused image of pancreas from two volumetric datasets.
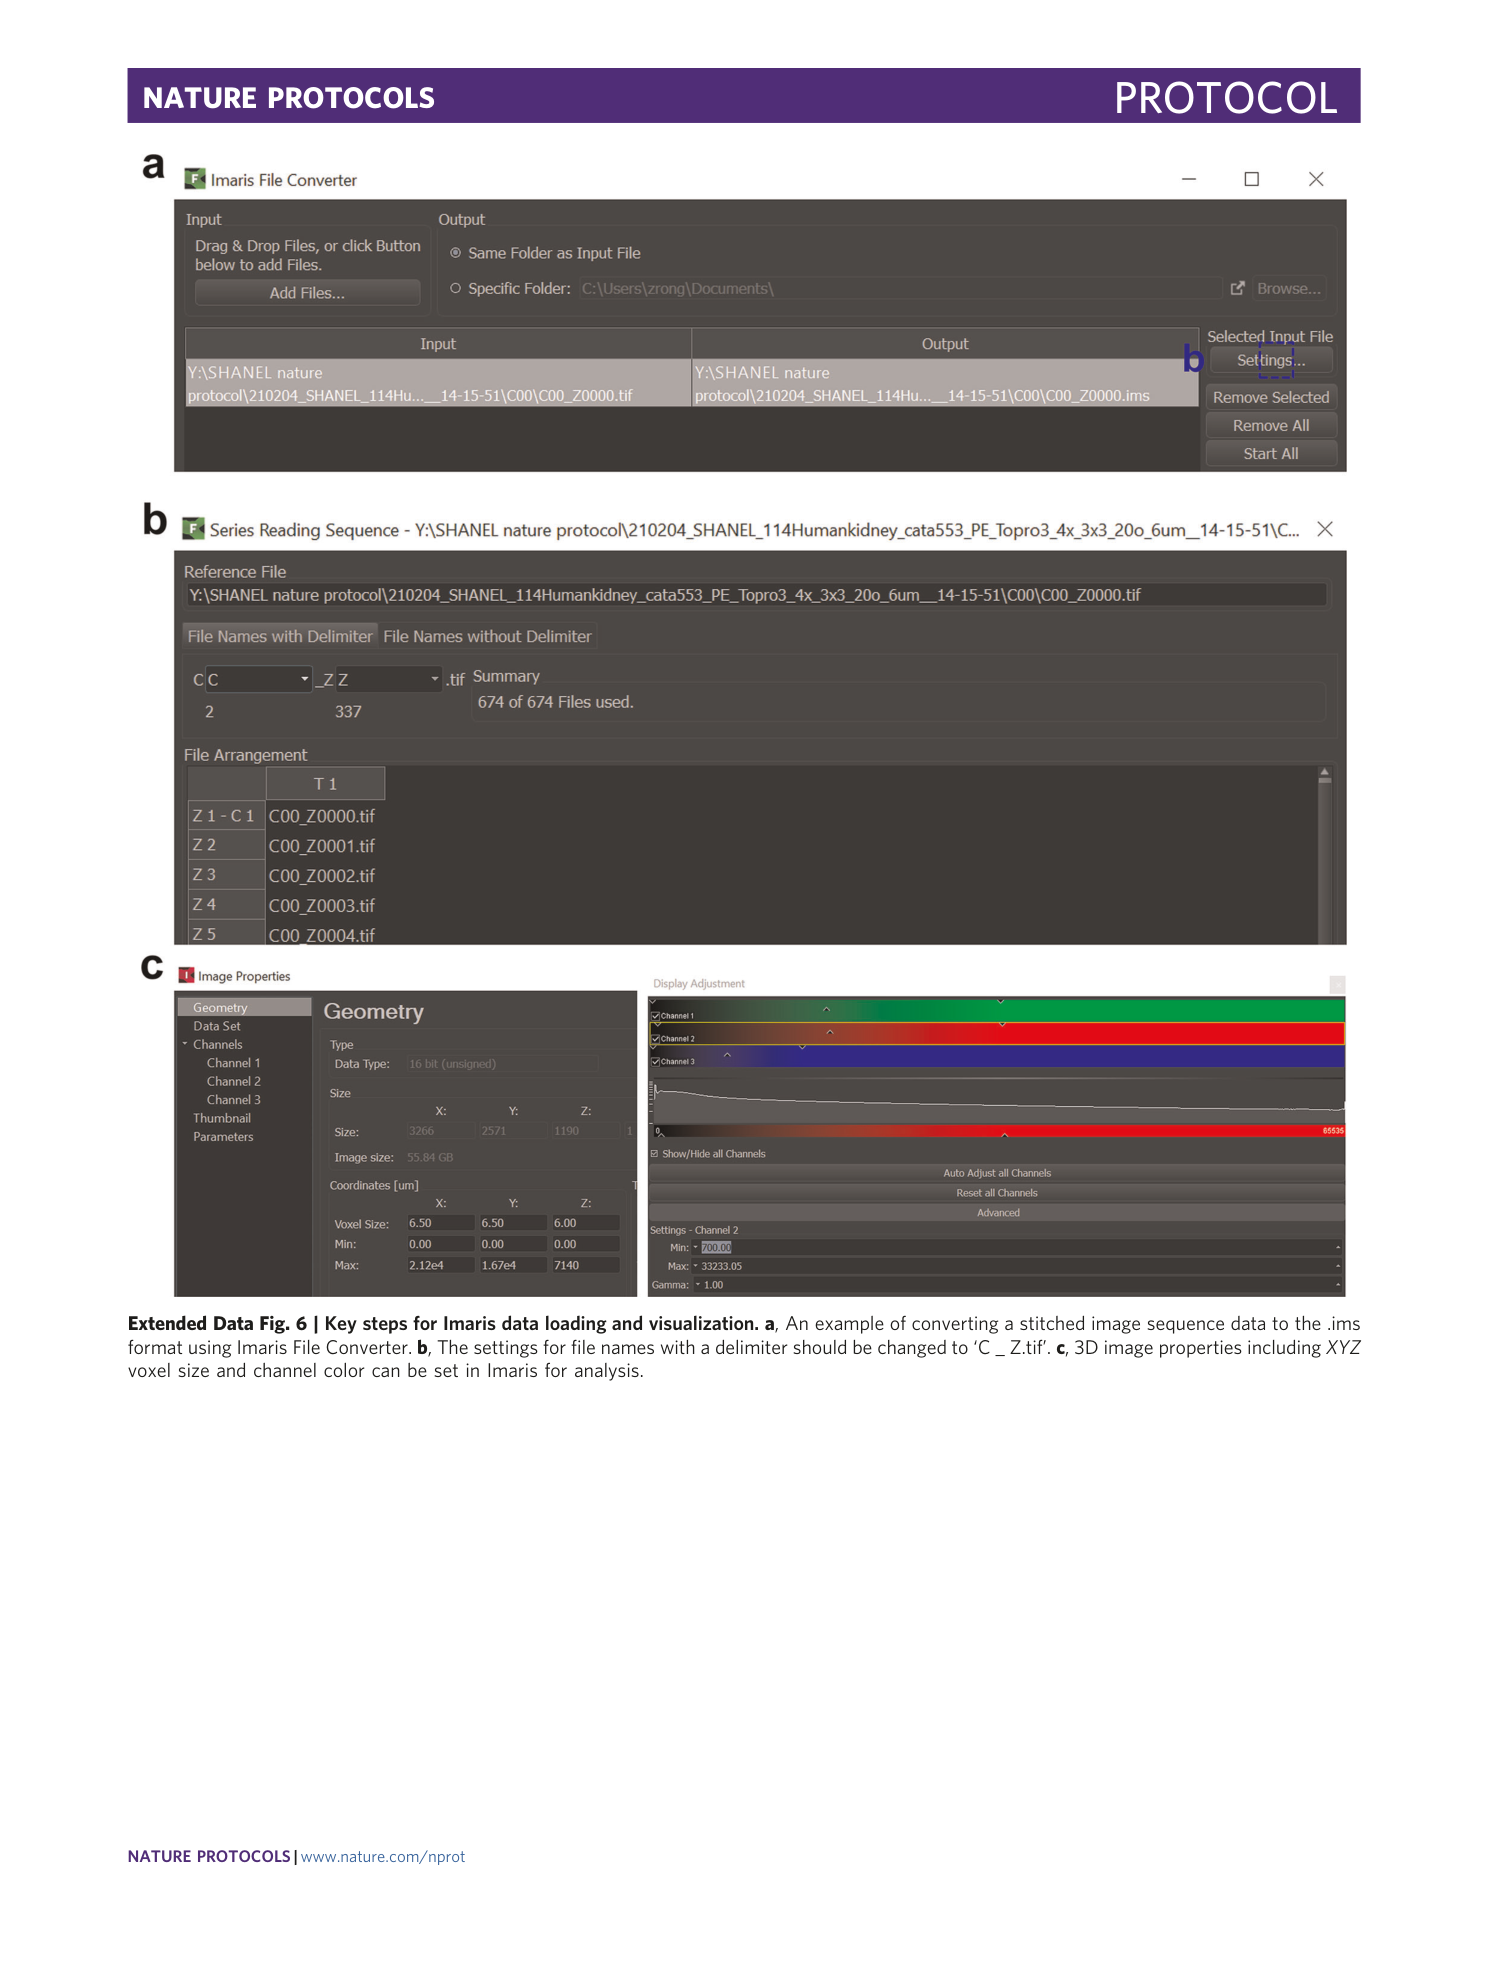
Extended Data Fig. 6 Key steps for Imaris data loading and visualization.
a , An example of converting a stitched image sequence data to the .ims format using Imaris File Converter. b , The settings for file names with a delimiter should be changed to ‘C _ Z.tif’. c , 3D image properties including XYZ voxel size and channel color can be set in Imaris for analysis.
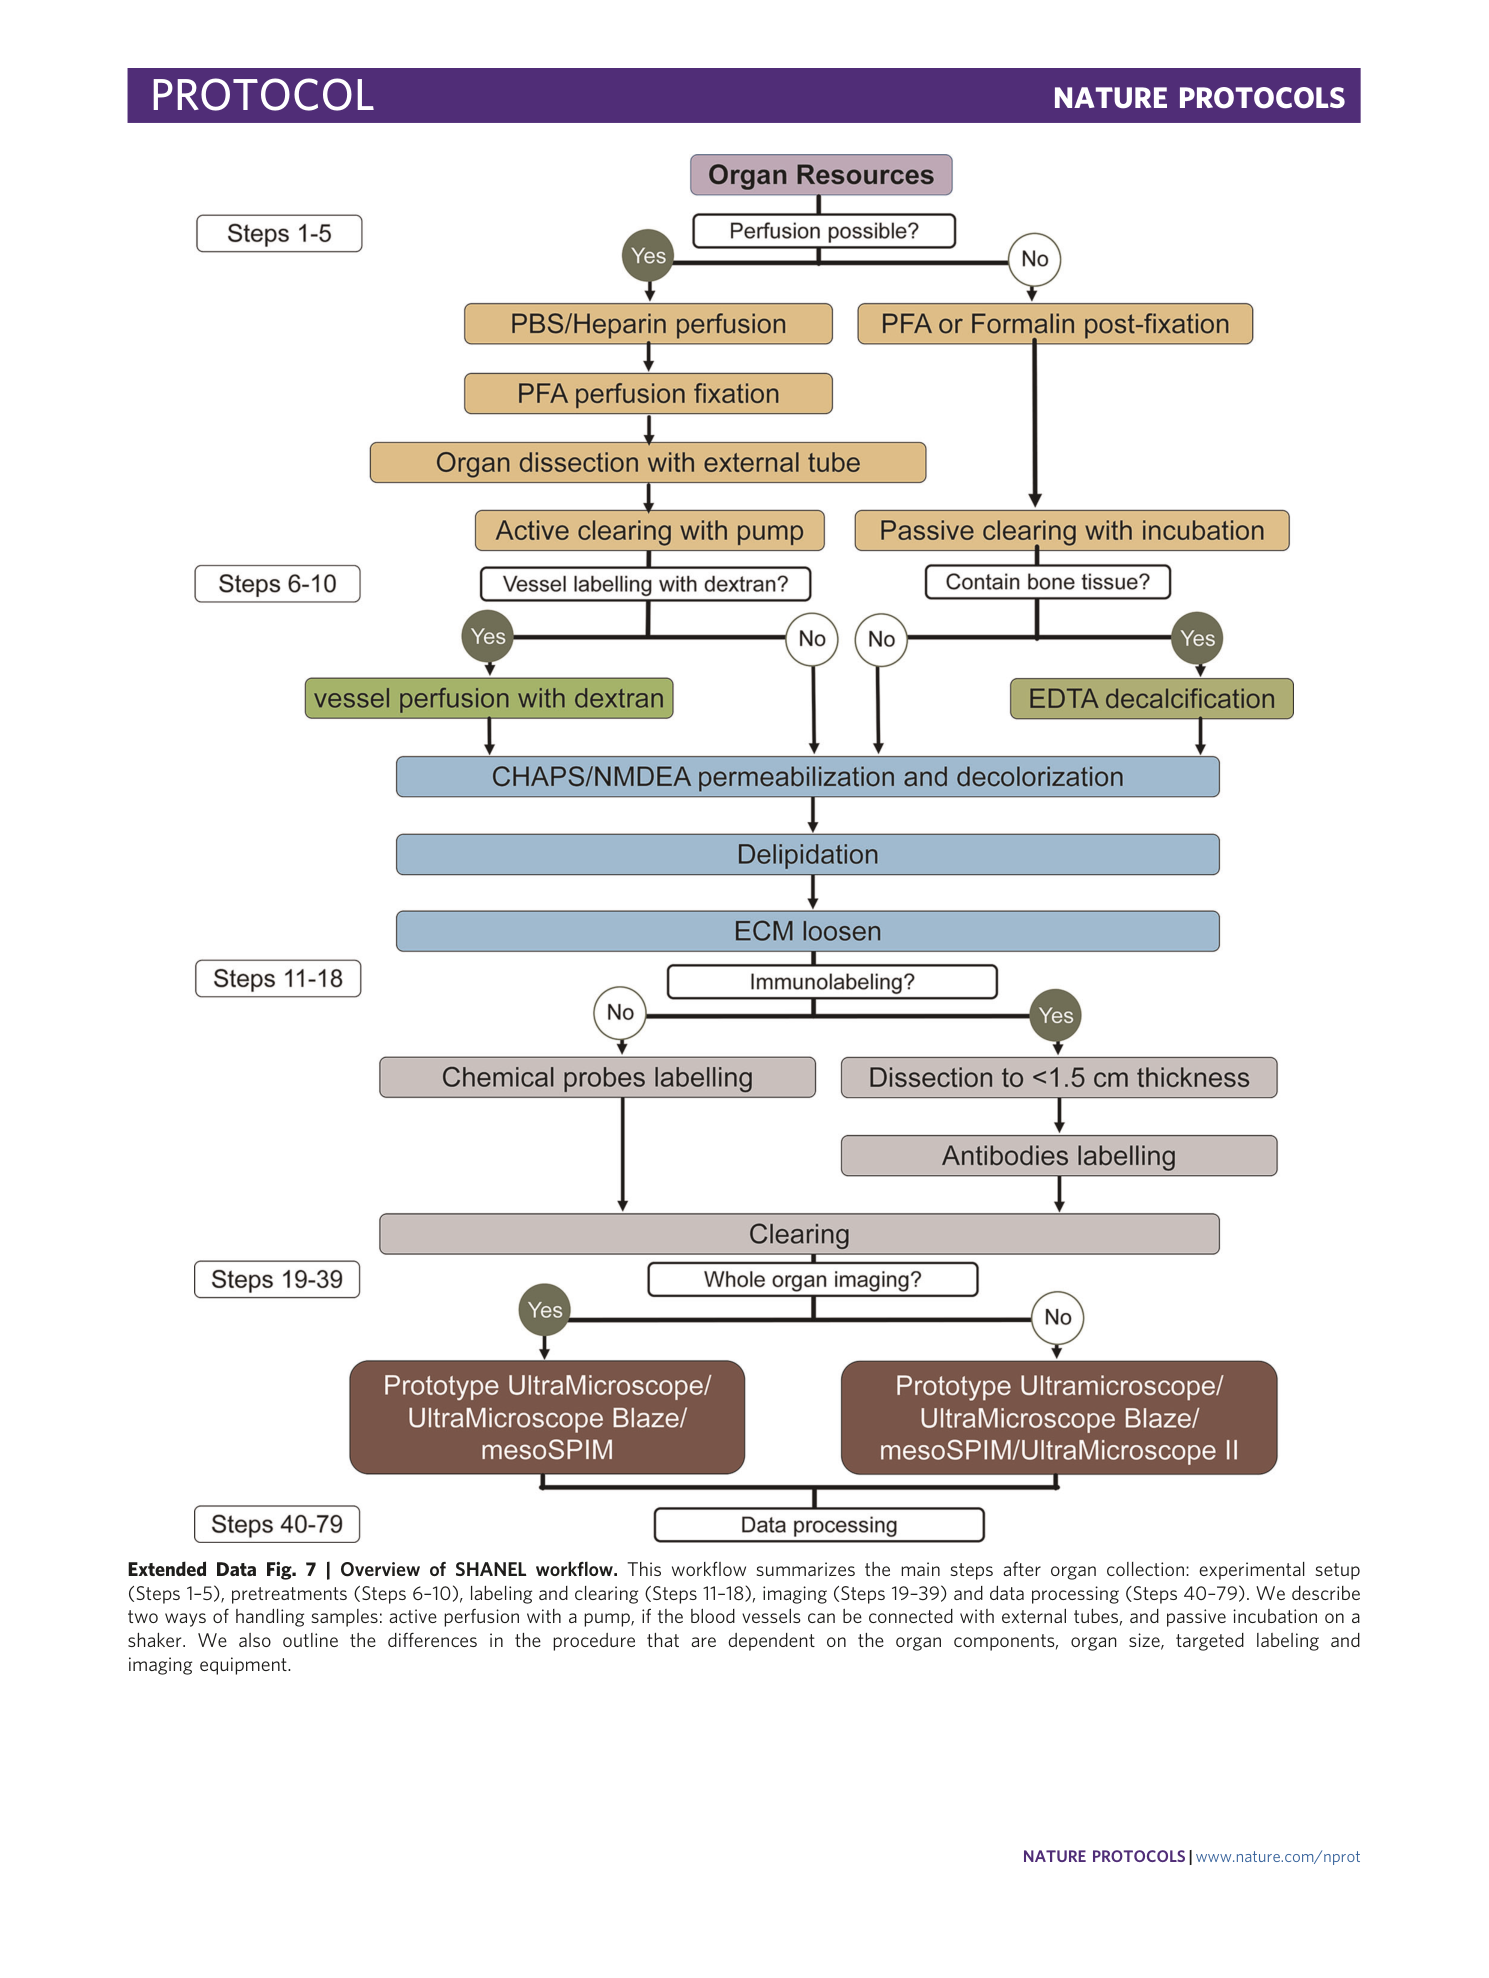
Extended Data Fig. 7 Overview of SHANEL workflow.
This workflow summarizes the main steps after organ collection: experimental setup (Steps 1–5), pretreatments (Steps 6–10), labeling and clearing (Steps 11–18), imaging (Steps 19–39) and data processing (Steps 40–79). We describe two ways of handling samples: active perfusion with a pump, if the blood vessels can be connected with external tubes, and passive incubation on a shaker. We also outline the differences in the procedure that are dependent on the organ components, organ size, targeted labeling and imaging equipment.
Supplementary information
Supplementary Information
Supplementary Table 1.
Supplementary Video 1
Change position of tubing to prevent breakage during active pumping.
Supplementary Video 2
Use a syringe to remove bubbles in the cleared sample.
Supplementary Video 3
Set the start point and end point in the Z direction during the light-sheet microscope imaging.
Supplementary Video 4
Human organs with vessel labeling.
