Large-scale preparation of fluorescence multiplex host cell reactivation (FM-HCR) reporters
C. G. Piett, T. J. Pecen, D. J. Laverty, Z. D. Nagel


Extended
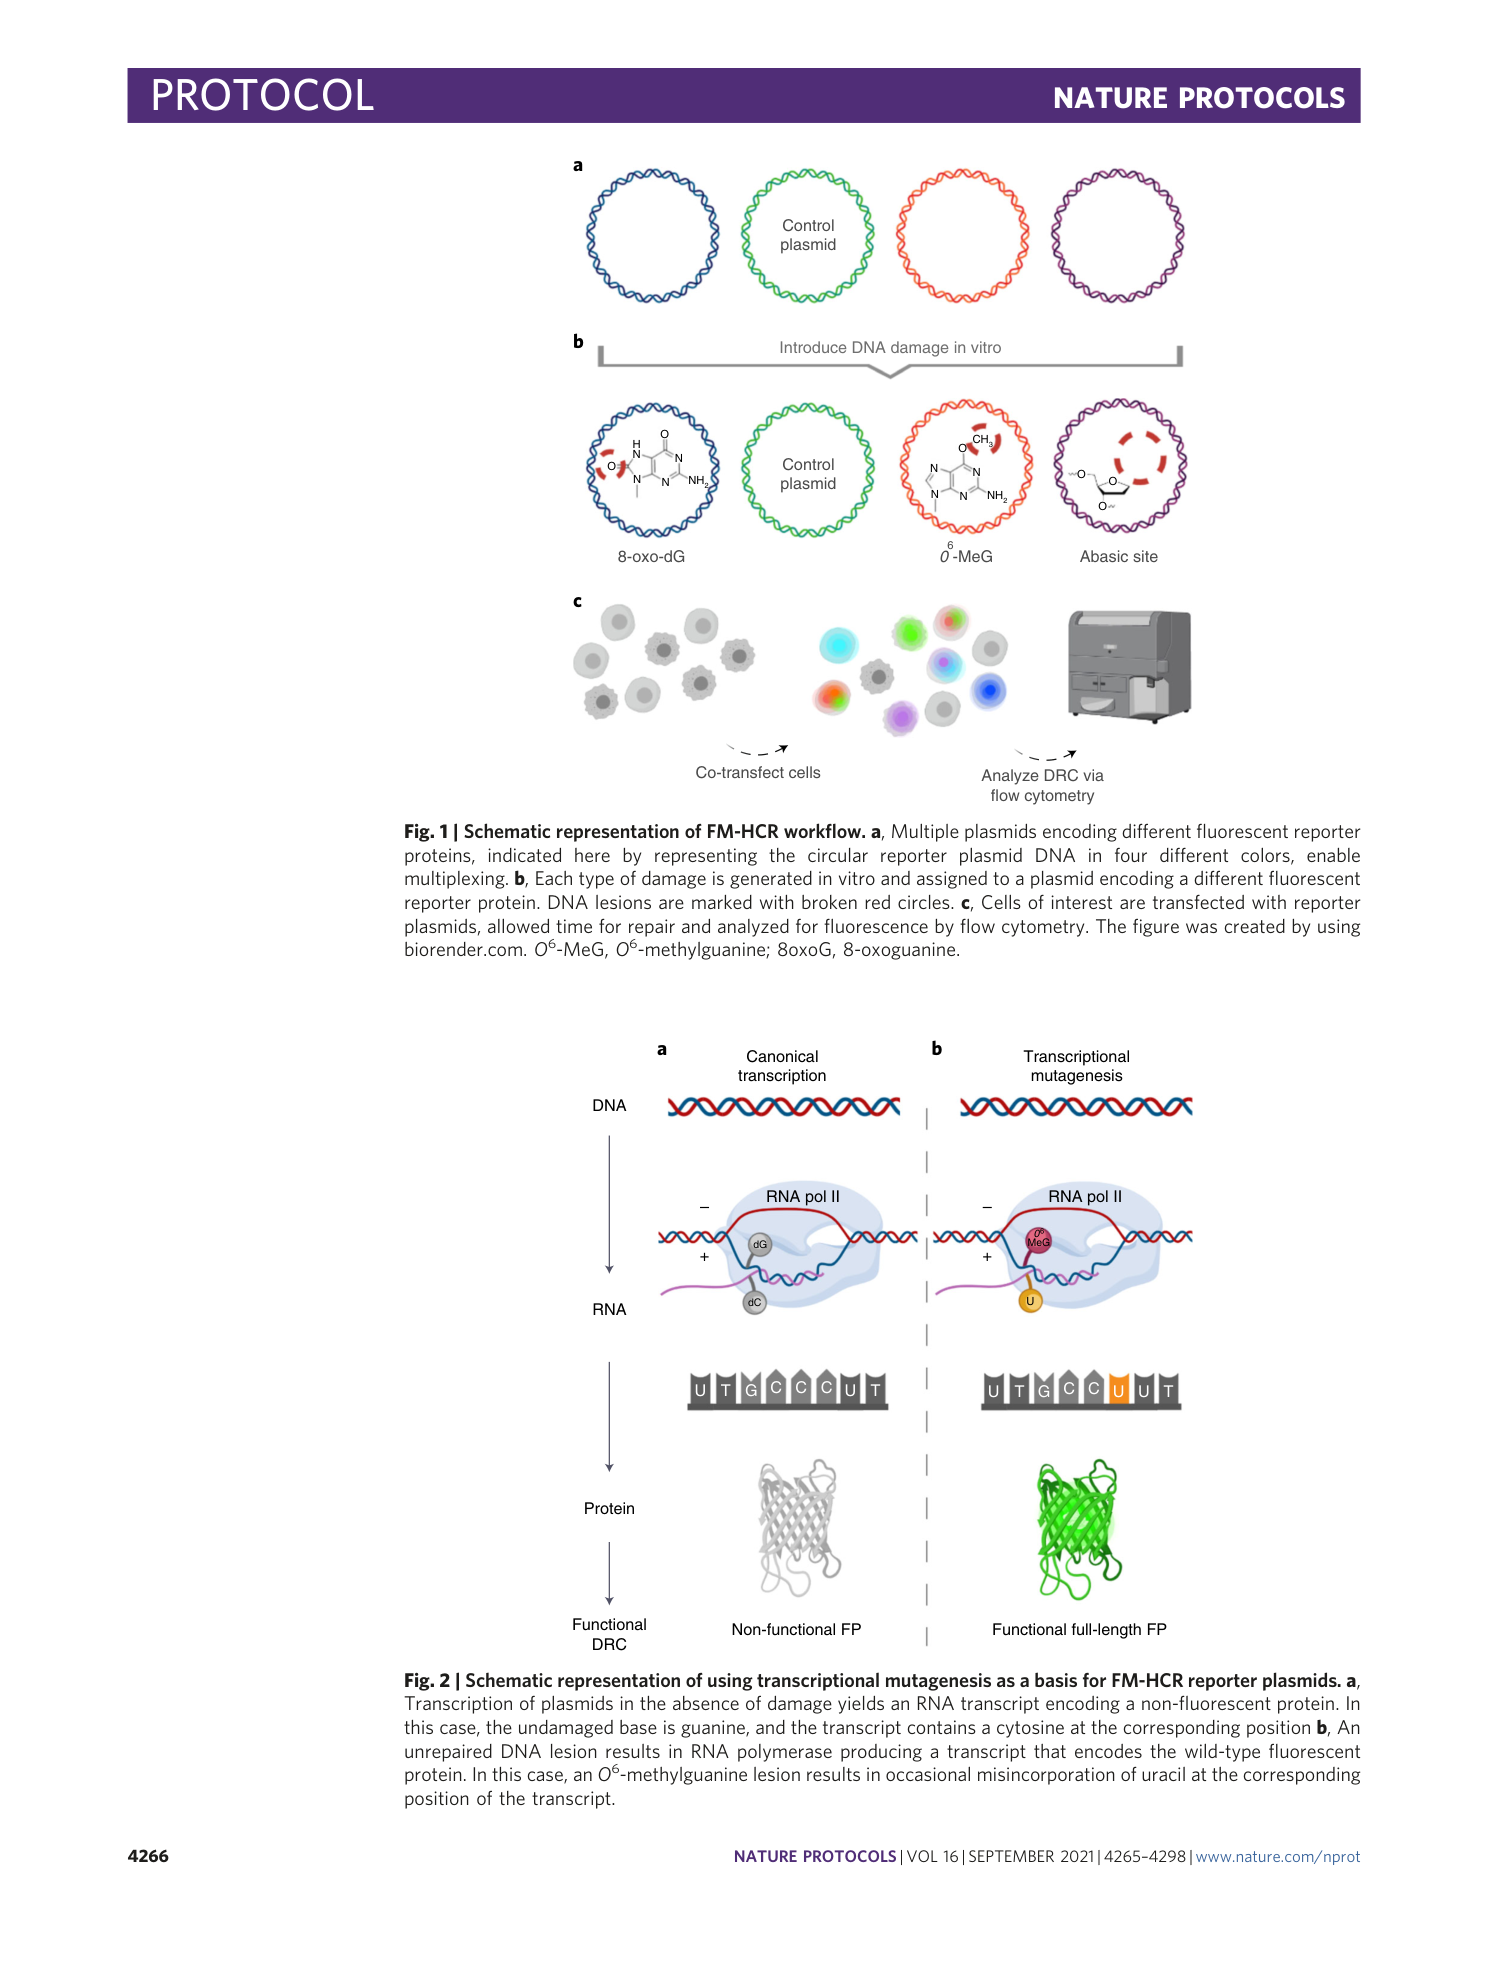
Extended Data Fig. 1 Gel electrophoretic analysis and flow cytometric validation of GFP_Hx, mPlum_A-8oxoG and mOrange_8oxoG-C reporter plasmids.
a , Analytical digest and flow cytometric validation of GFP_Hx plasmid. Lane 1: NEB 1-kb MW ladder; lane 2: pMax_GFP_C289T ccDNA; lane 3: HIA overnight extension reaction for GFP_Hx; lane 4: pMax_GFP_C289T ccDNA; lane 5: pMax_GFP_C289T after a 45-min ApaLI digestion at 37 °C, which cleaves two restriction sites, resulting in two linear DNA fragments; lane 6: GFP_Hx ccDNA after T5 Exo and PEG purification steps; and lane 7: GFP_Hx after a 45-min ApaLI digestion at 37 °C, in which the Hx lesion blocks ApaLI cleavage of one restriction site, leaving a single linearized fragment. At right: flow cytometric quantitation of percent reporter expression and normalized relative reporter expression in WT HAP cells compared to MPG −/− HAP cells. b , Analytical digestion and flow cytometric validation of mPlum_A-8oxoG plasmid. Lane 1: HIA overnight extension reaction for mPlum_A-8oxoG; lane 2: pMax_mPlum ccDNA; lane 3: pMax_mPlum after a 45-min Fpg endonuclease digestion at 37 °C; lane 4: mPlum_A-8oxoG after T5 Exo and PEG purification steps; lane 5: mPlum_A-8oxoG after a 45-min Fpg endonuclease digestion at 37 °C, resulting in plasmid nicking and upward mobility shift. At right: flow cytometric quantitation of percent reporter expression and normalized relative reporter expression in WT HAP cells compared to MUTYH −/− HAP cells. c , Analytical digestion and flow cytometric validation of mOrange_8oxoG-C plasmid. Lane 1: NEB 1-kb MW ladder; lane 2: pMax_mOrange_A215C ssDNA; lane 3: pMax_mOrange_A215C ocDNA; lane 4: pMax_mOrange_A215C ccDNA; lane 5: pMax_mOrange_A215C after a 45-min Fpg endonuclease digestion at 37 °C; lane 6: mOrange_8oxoG-C ccDNA; and lane 7: mOrange_8oxoG-C after a 45-min Fpg endonuclease digestion at 37 °C, which introduces a nick at the 8oxoG lesion, resulting in upward mobility shift. At right: flow cytometric quantitation of percent reporter expression and normalized relative reporter expression in WT MEF cells compared to OGG1 −/− MEF cells. Error bars represent s.e.m. from three to four biological replicates; differences of statistical significance (*, P < 0.05; ***, P < 0.005; ****, P < 0.0001) were determined by unpaired two-tailed t test.
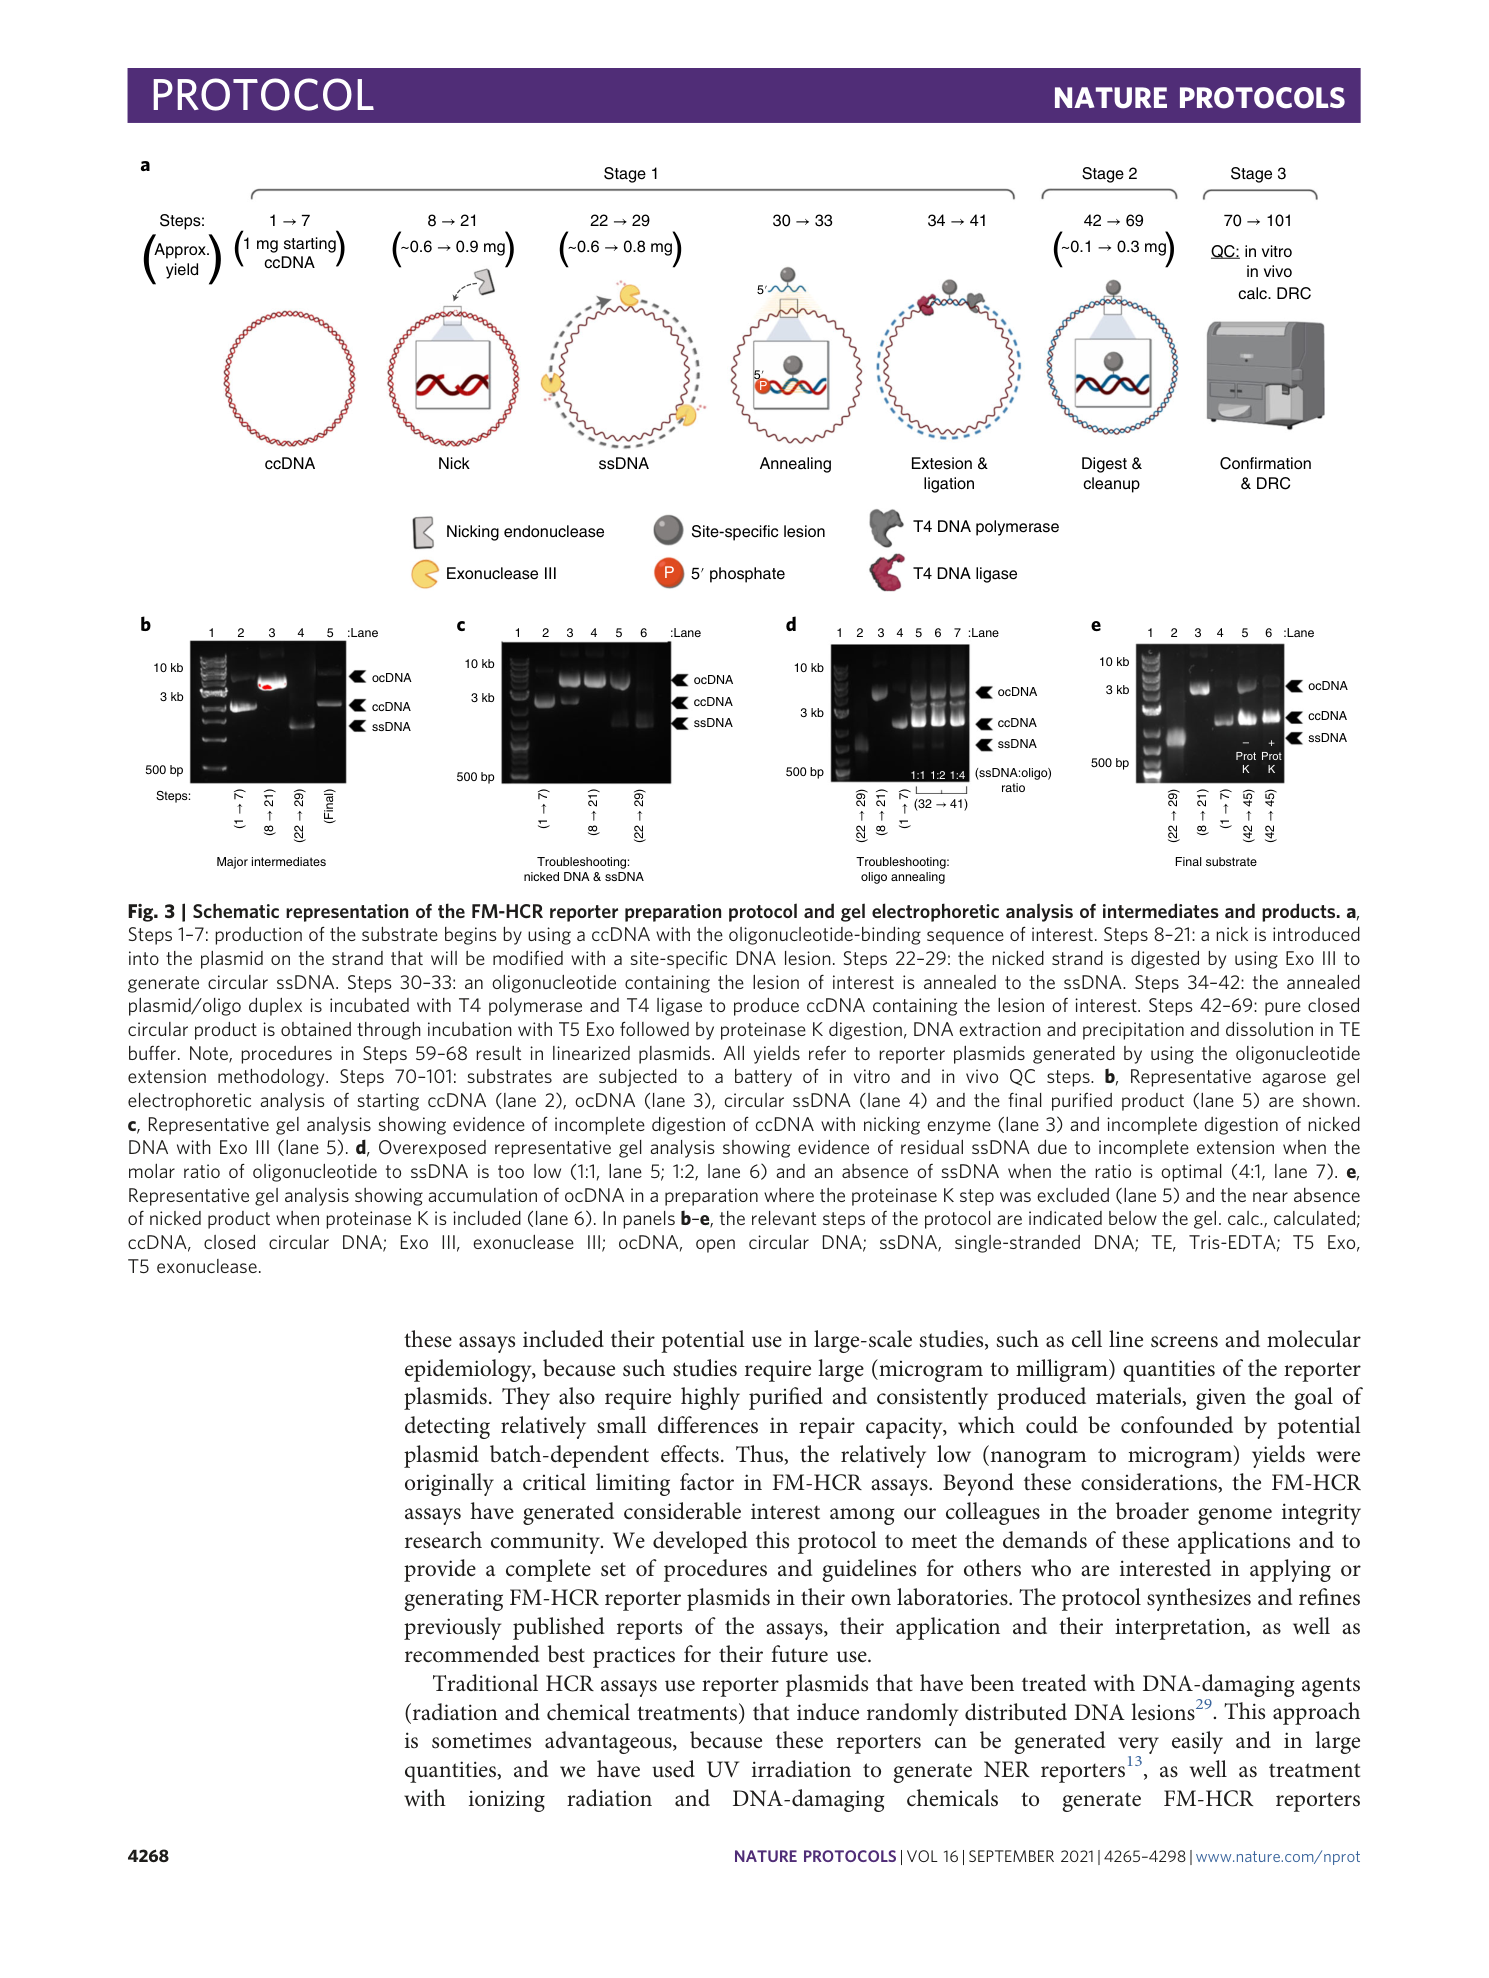
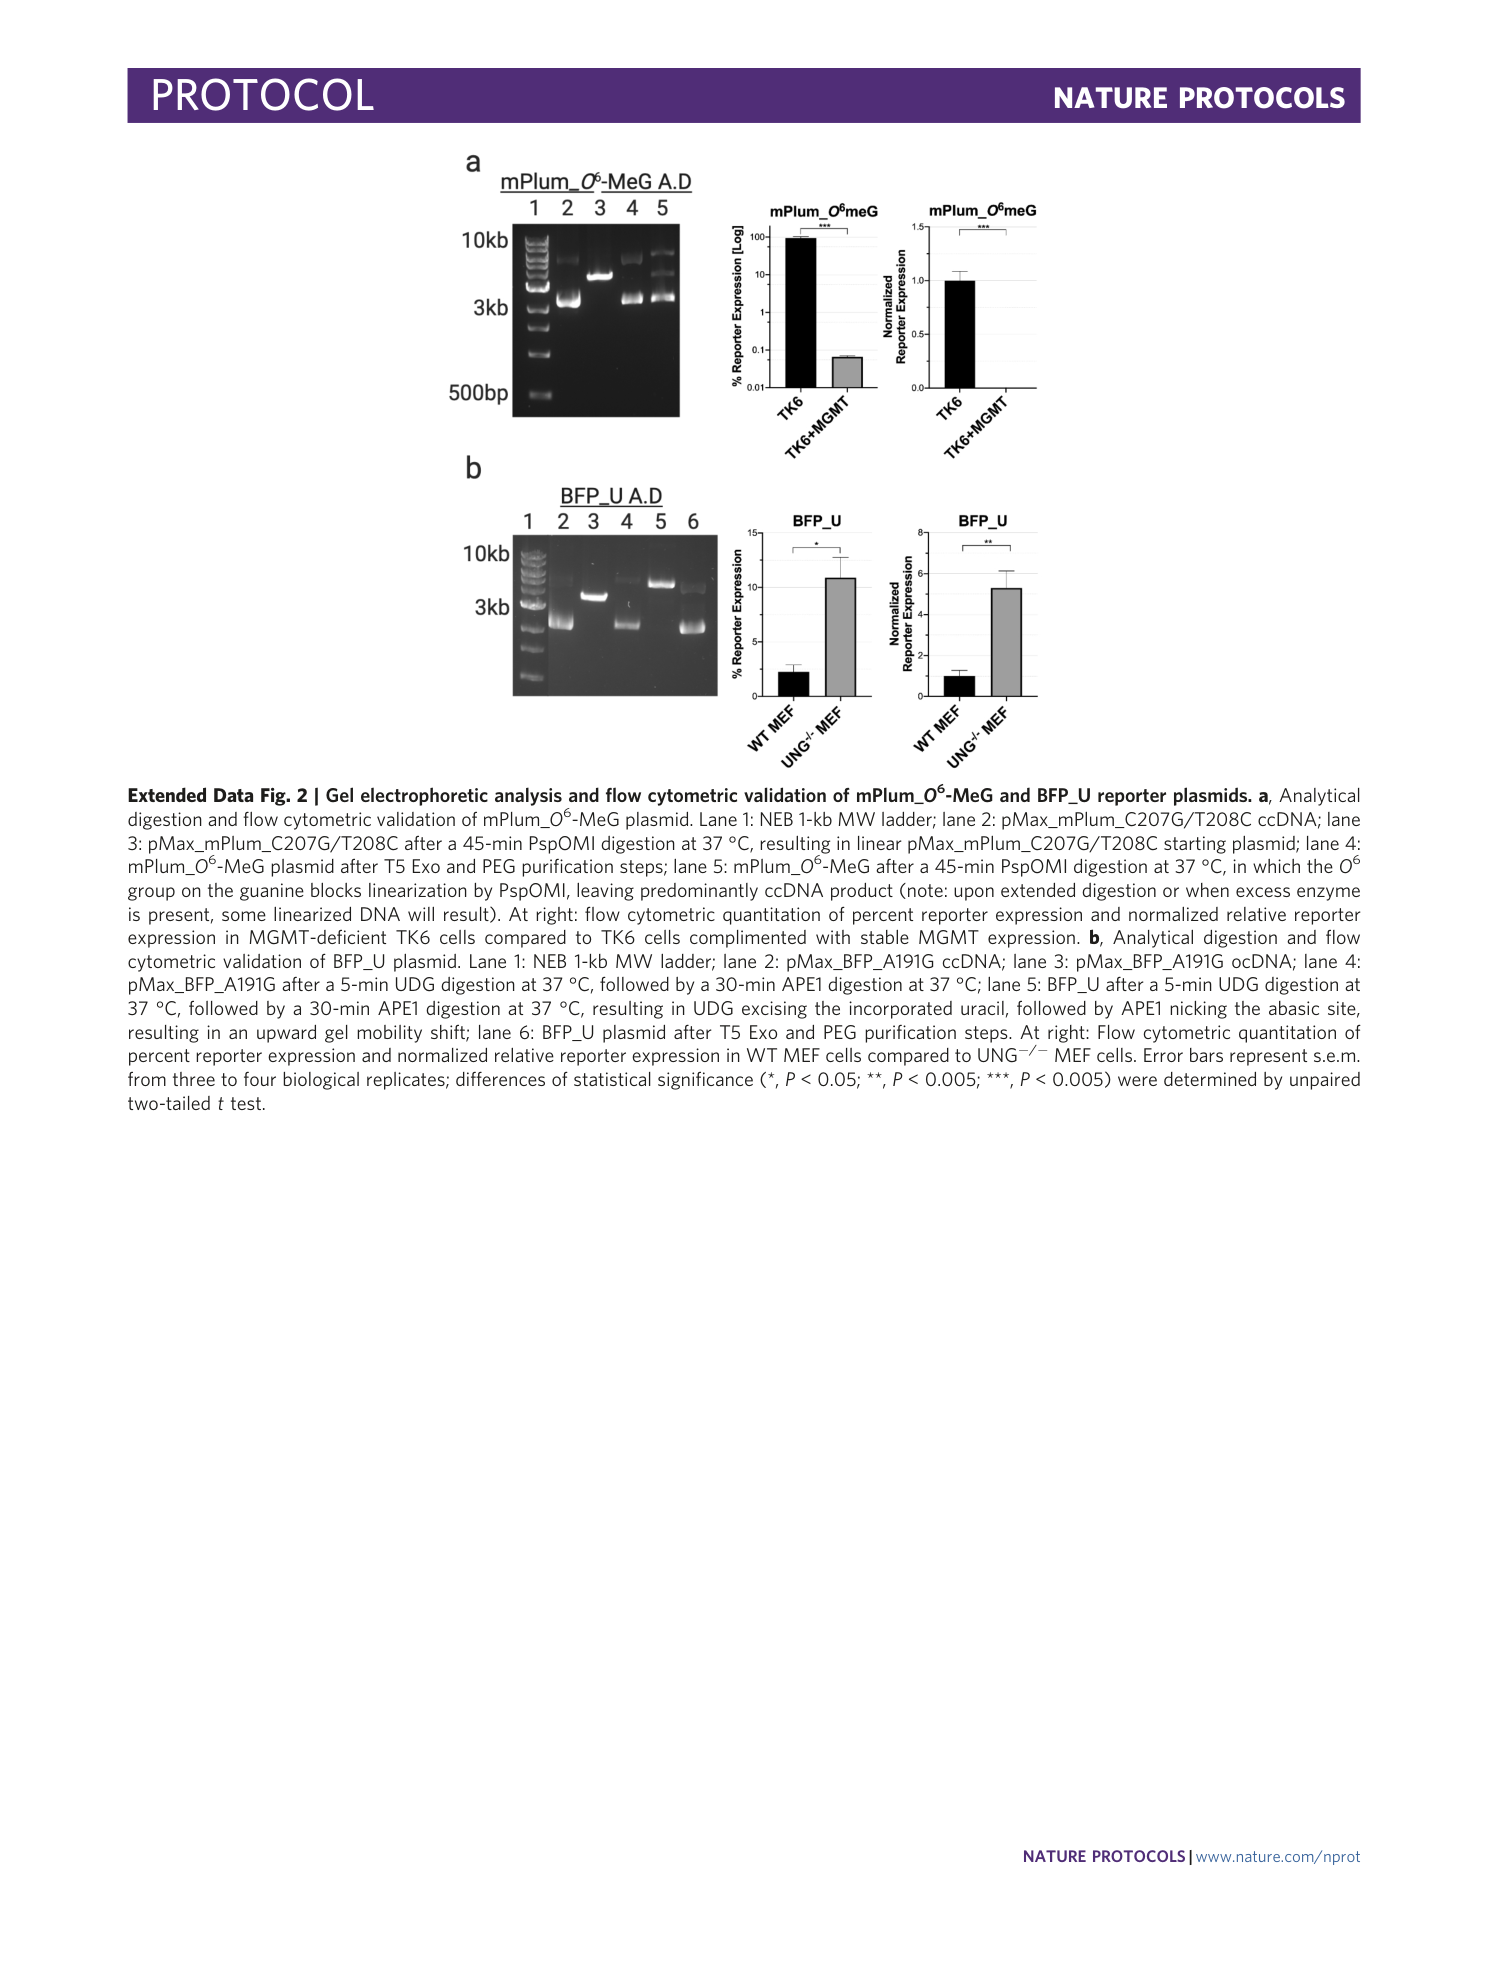
Extended Data Fig. 2 Gel electrophoretic analysis and flow cytometric validation of mPlum_ O 6 -MeG and BFP_U reporter plasmids.
a , Analytical digestion and flow cytometric validation of mPlum_ O 6 -MeG plasmid. Lane 1: NEB 1-kb MW ladder; lane 2: pMax_mPlum_C207G/T208C ccDNA; lane 3: pMax_mPlum_C207G/T208C after a 45-min PspOMI digestion at 37 °C, resulting in linear pMax_mPlum_C207G/T208C starting plasmid; lane 4: mPlum_ O 6 -MeG plasmid after T5 Exo and PEG purification steps; lane 5: mPlum_ O 6 -MeG after a 45-min PspOMI digestion at 37 °C, in which the O 6 group on the guanine blocks linearization by PspOMI, leaving predominantly ccDNA product (note: upon extended digestion or when excess enzyme is present, some linearized DNA will result). At right: flow cytometric quantitation of percent reporter expression and normalized relative reporter expression in MGMT-deficient TK6 cells compared to TK6 cells complimented with stable MGMT expression. b , Analytical digestion and flow cytometric validation of BFP_U plasmid. Lane 1: NEB 1-kb MW ladder; lane 2: pMax_BFP_A191G ccDNA; lane 3: pMax_BFP_A191G ocDNA; lane 4: pMax_BFP_A191G after a 5-min UDG digestion at 37 °C, followed by a 30-min APE1 digestion at 37 °C; lane 5: BFP_U after a 5-min UDG digestion at 37 °C, followed by a 30-min APE1 digestion at 37 °C, resulting in UDG excising the incorporated uracil, followed by APE1 nicking the abasic site, resulting in an upward gel mobility shift; lane 6: BFP_U plasmid after T5 Exo and PEG purification steps. At right: Flow cytometric quantitation of percent reporter expression and normalized relative reporter expression in WT MEF cells compared to UNG −/− MEF cells. Error bars represent s.e.m. from three to four biological replicates; differences of statistical significance (*, P < 0.05; **, P < 0.005; ***, P < 0.005) were determined by unpaired two-tailed t test.
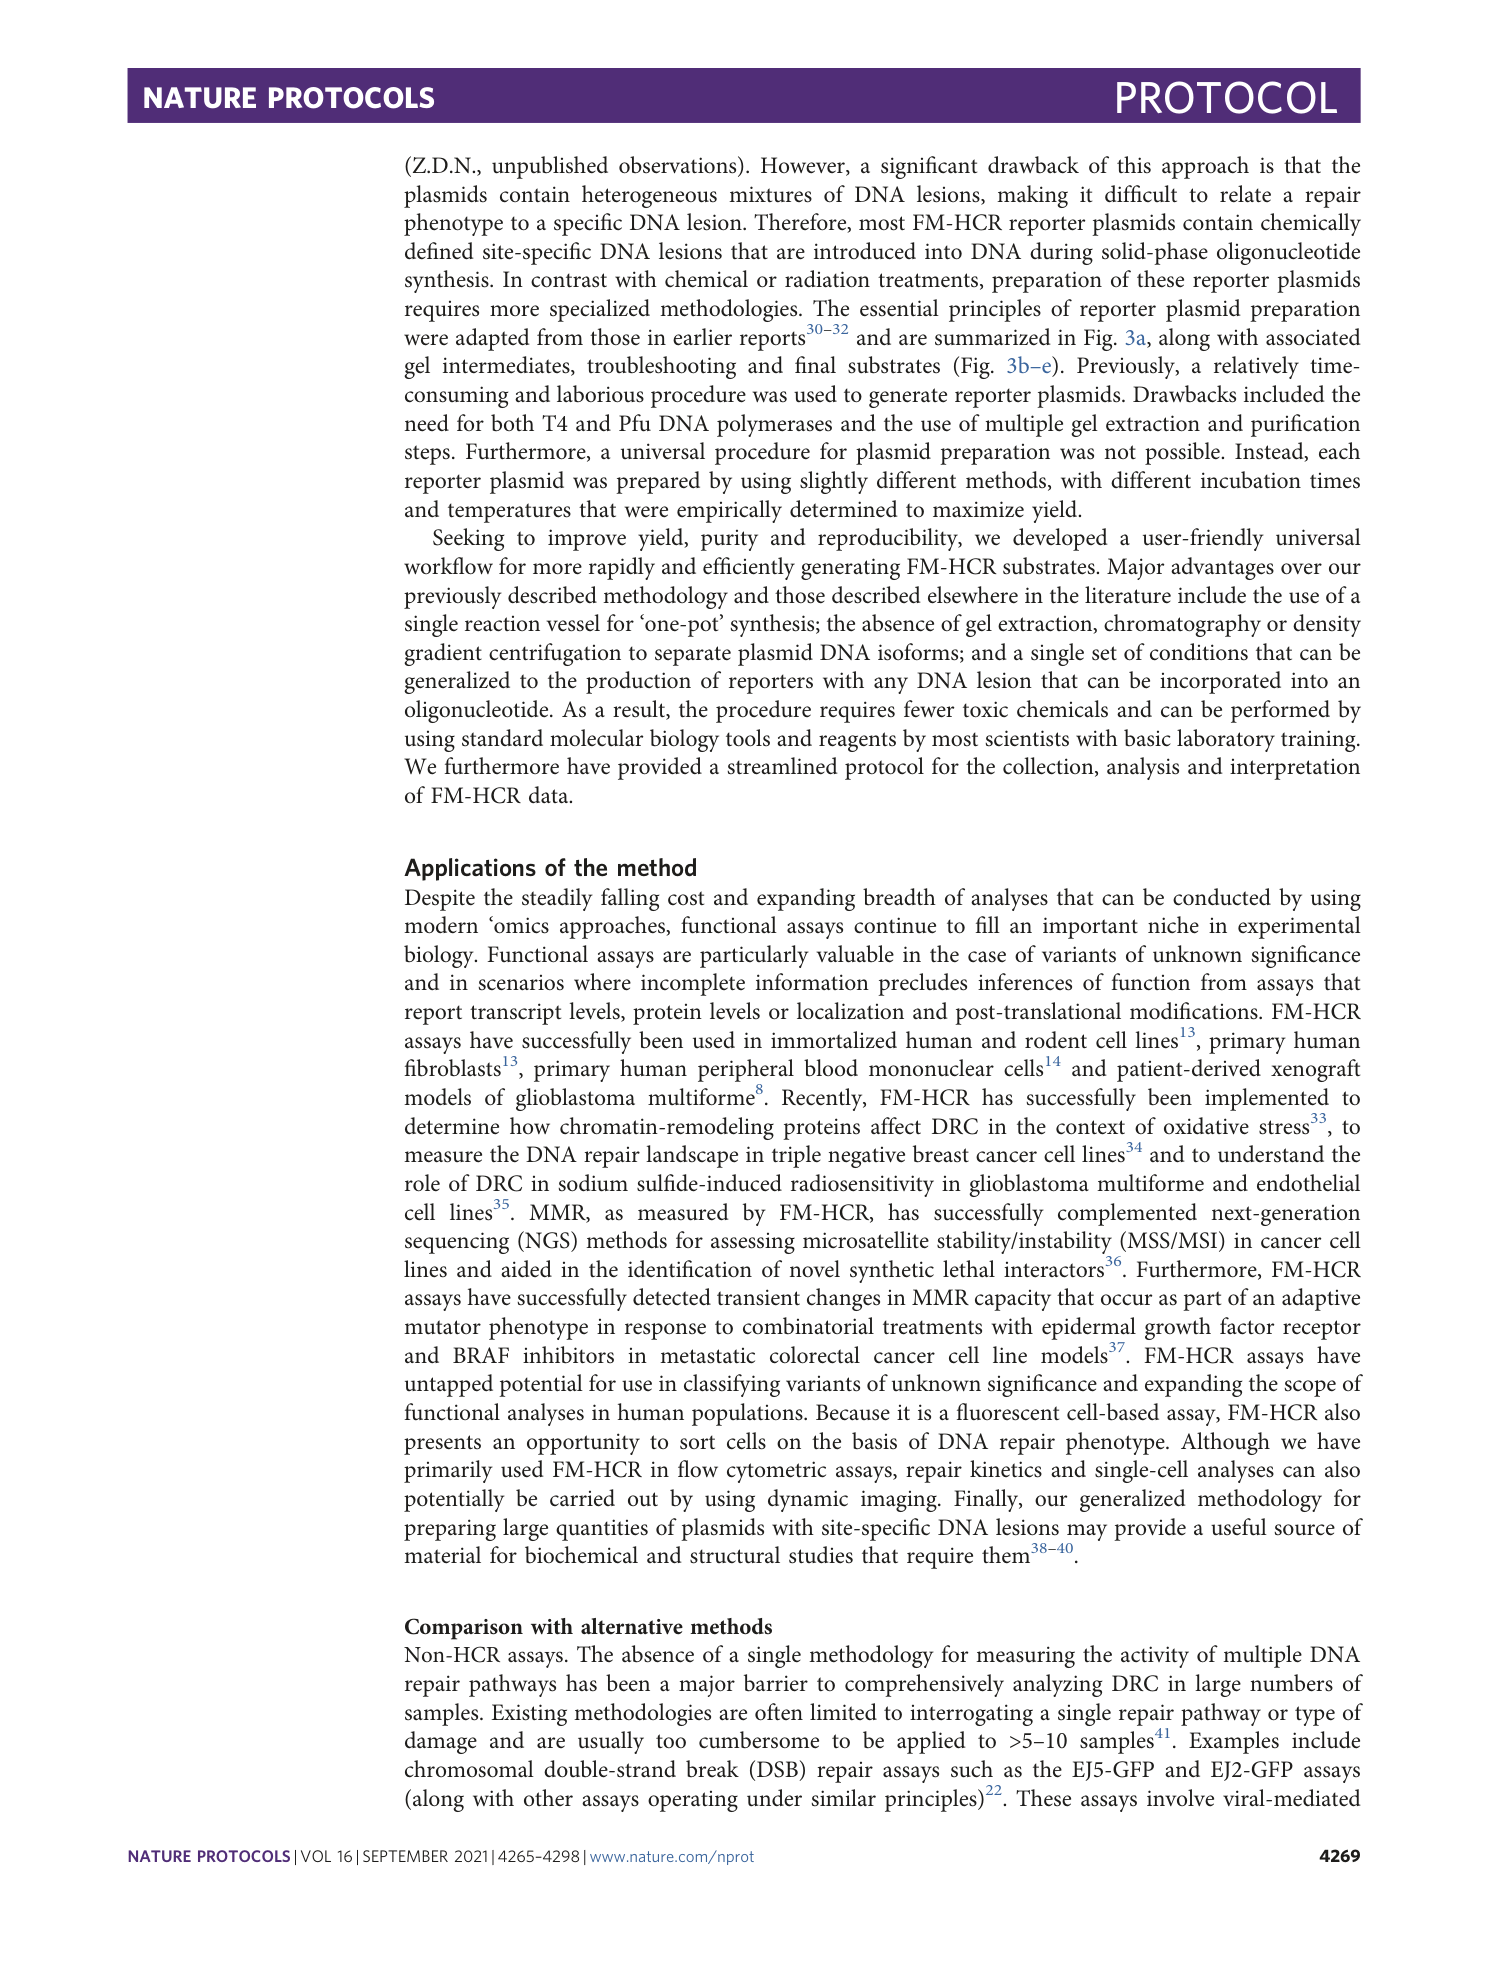
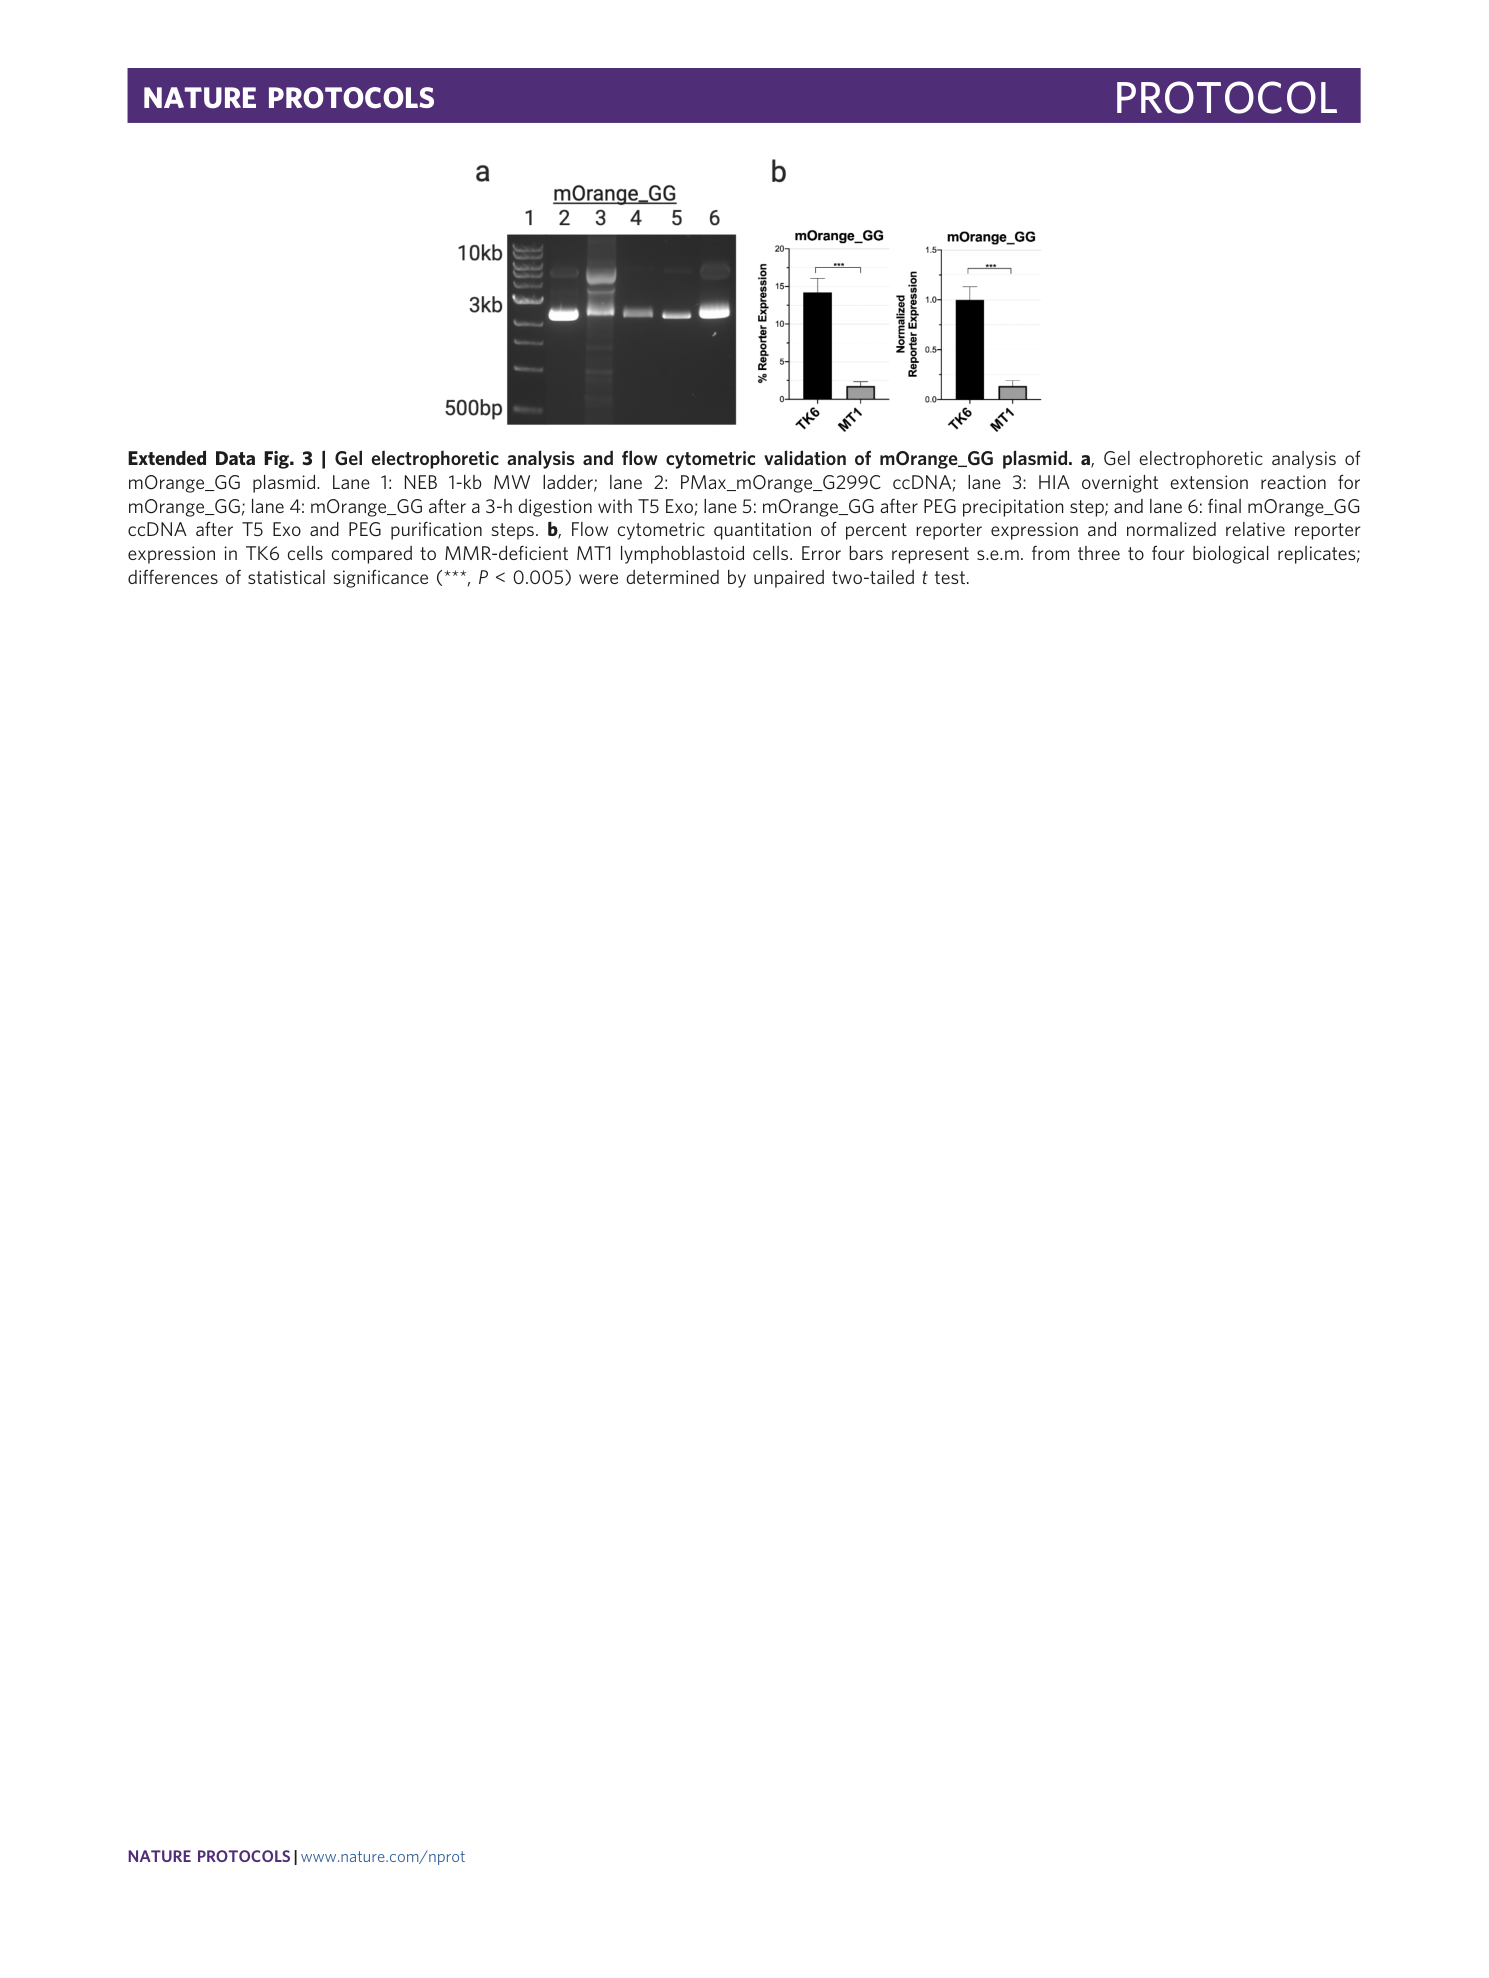
Extended Data Fig. 3 Gel electrophoretic analysis and flow cytometric validation of mOrange_GG plasmid.
a , Gel electrophoretic analysis of mOrange_GG plasmid. Lane 1: NEB 1-kb MW ladder; lane 2: PMax_mOrange_G299C ccDNA; lane 3: HIA overnight extension reaction for mOrange_GG; lane 4: mOrange_GG after a 3-h digestion with T5 Exo; lane 5: mOrange_GG after PEG precipitation step; and lane 6: final mOrange_GG ccDNA after T5 Exo and PEG purification steps. b , Flow cytometric quantitation of percent reporter expression and normalized relative reporter expression in TK6 cells compared to MMR-deficient MT1 lymphoblastoid cells. Error bars represent s.e.m. from three to four biological replicates; differences of statistical significance (***, P < 0.005) were determined by unpaired two-tailed t test.
