Metabolic labeling of secreted matrix to investigate cell–material interactions in tissue engineering and mechanobiology
Claudia Loebel, Aya M. Saleh, Kathryn R. Jacobson, Ryan Daniels, Robert L. Mauck, Sarah Calve, Jason A. Burdick
Extended
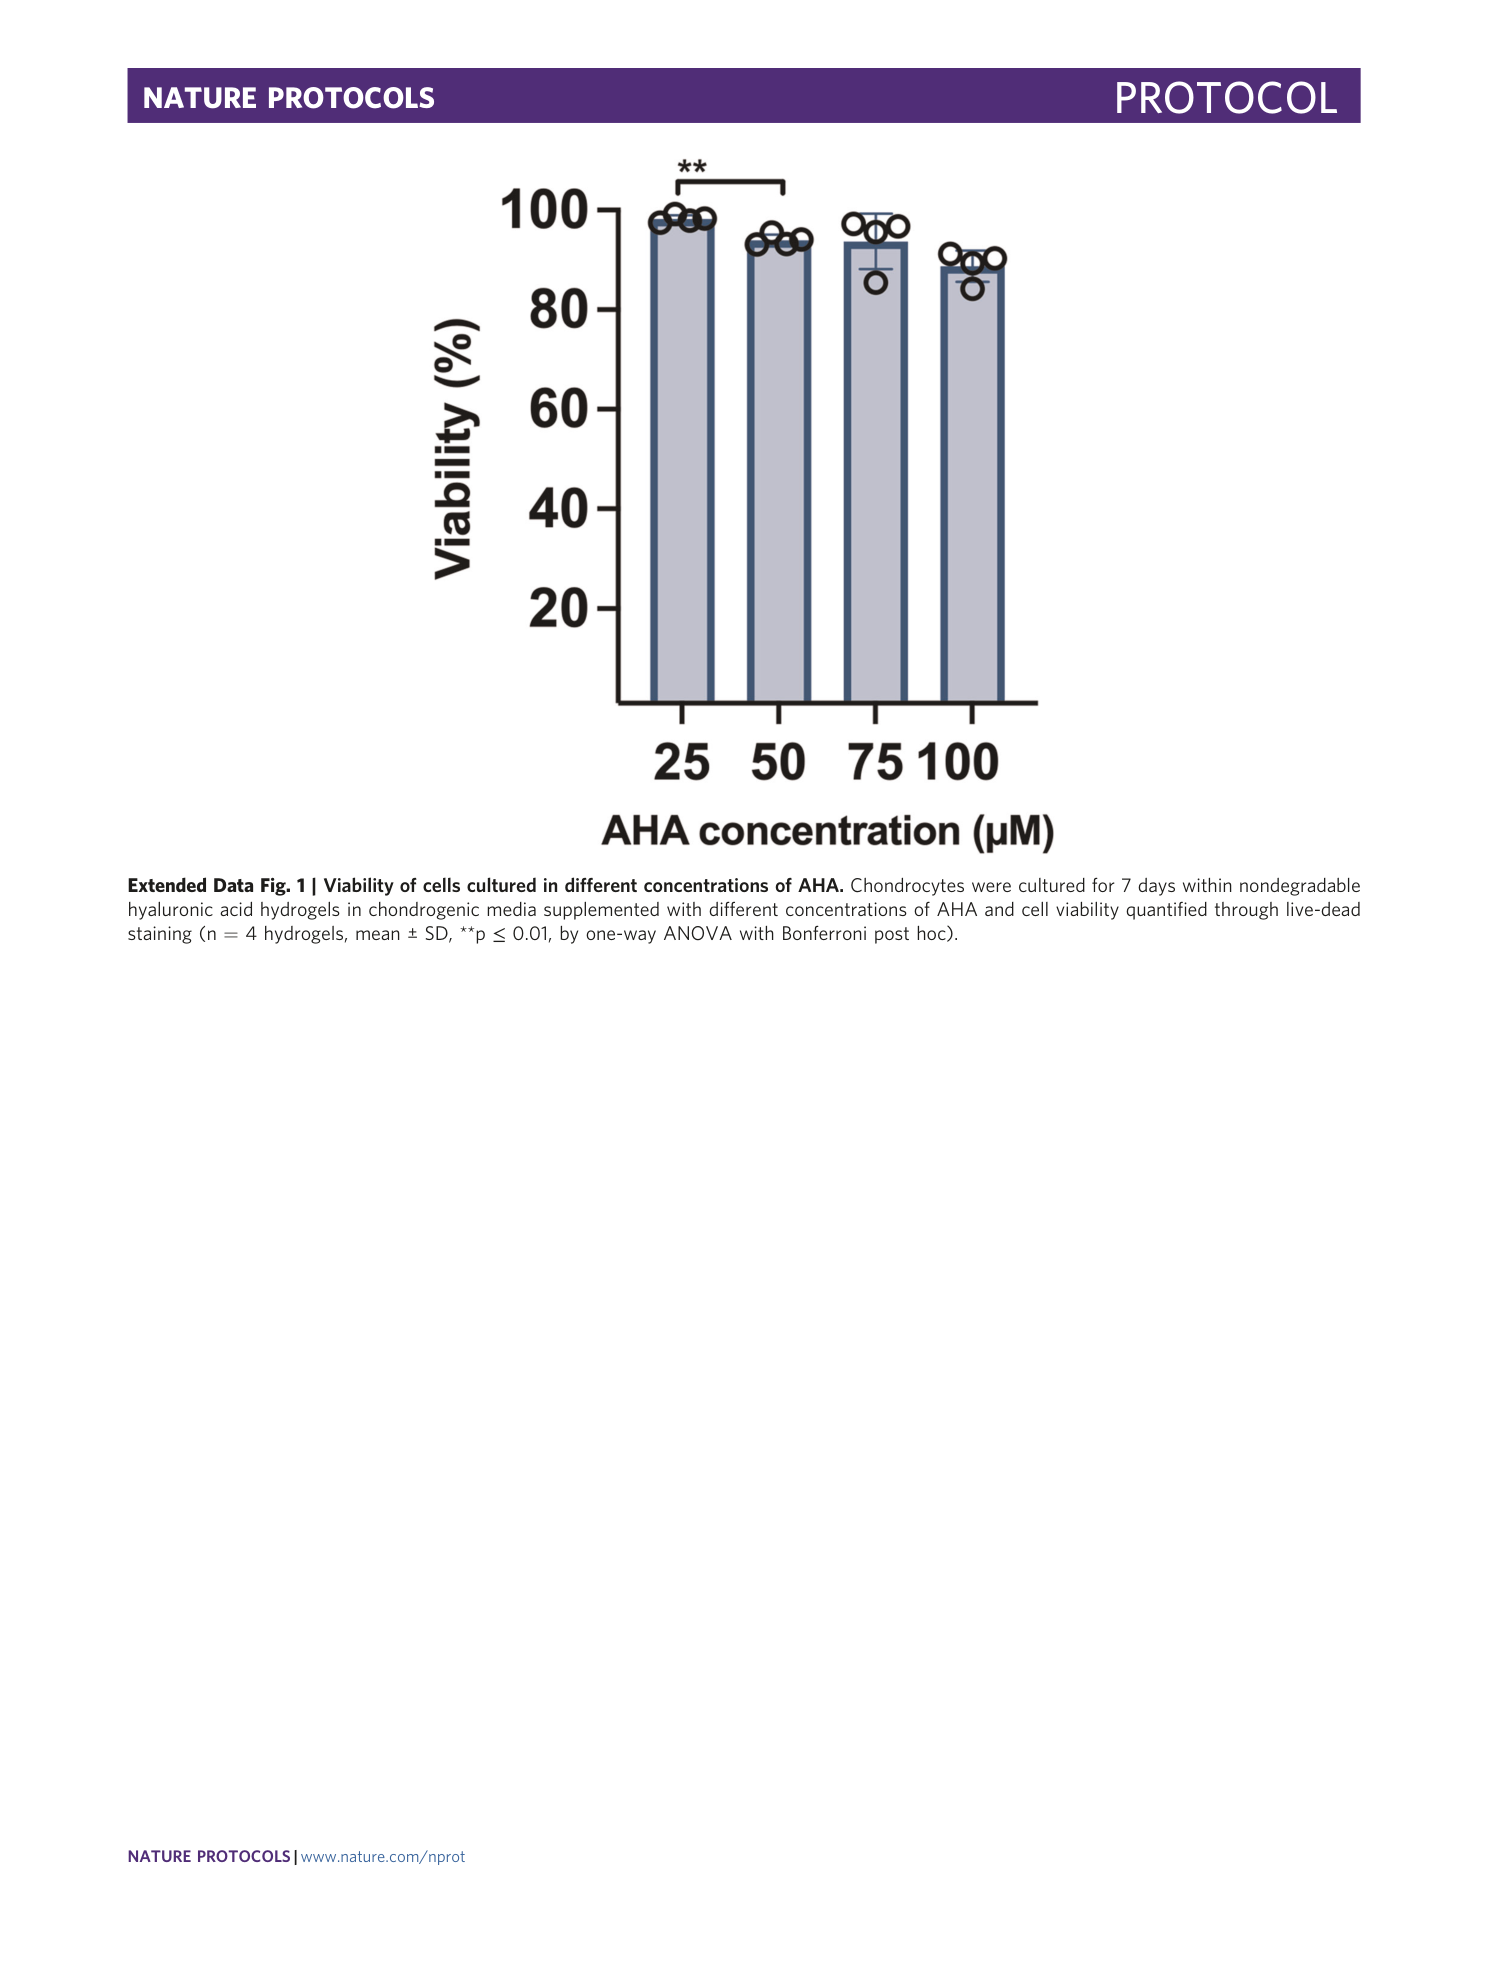
Extended Data Fig. 1 Viability of cells cultured in different concentrations of AHA.
Chondrocytes were cultured for 7 days within nondegradable hyaluronic acid hydrogels in chondrogenic media supplemented with different concentrations of AHA and cell viability quantified through live-dead staining (n = 4 hydrogels, mean ± SD, **p ≤ 0.01, by one-way ANOVA with Bonferroni post hoc).
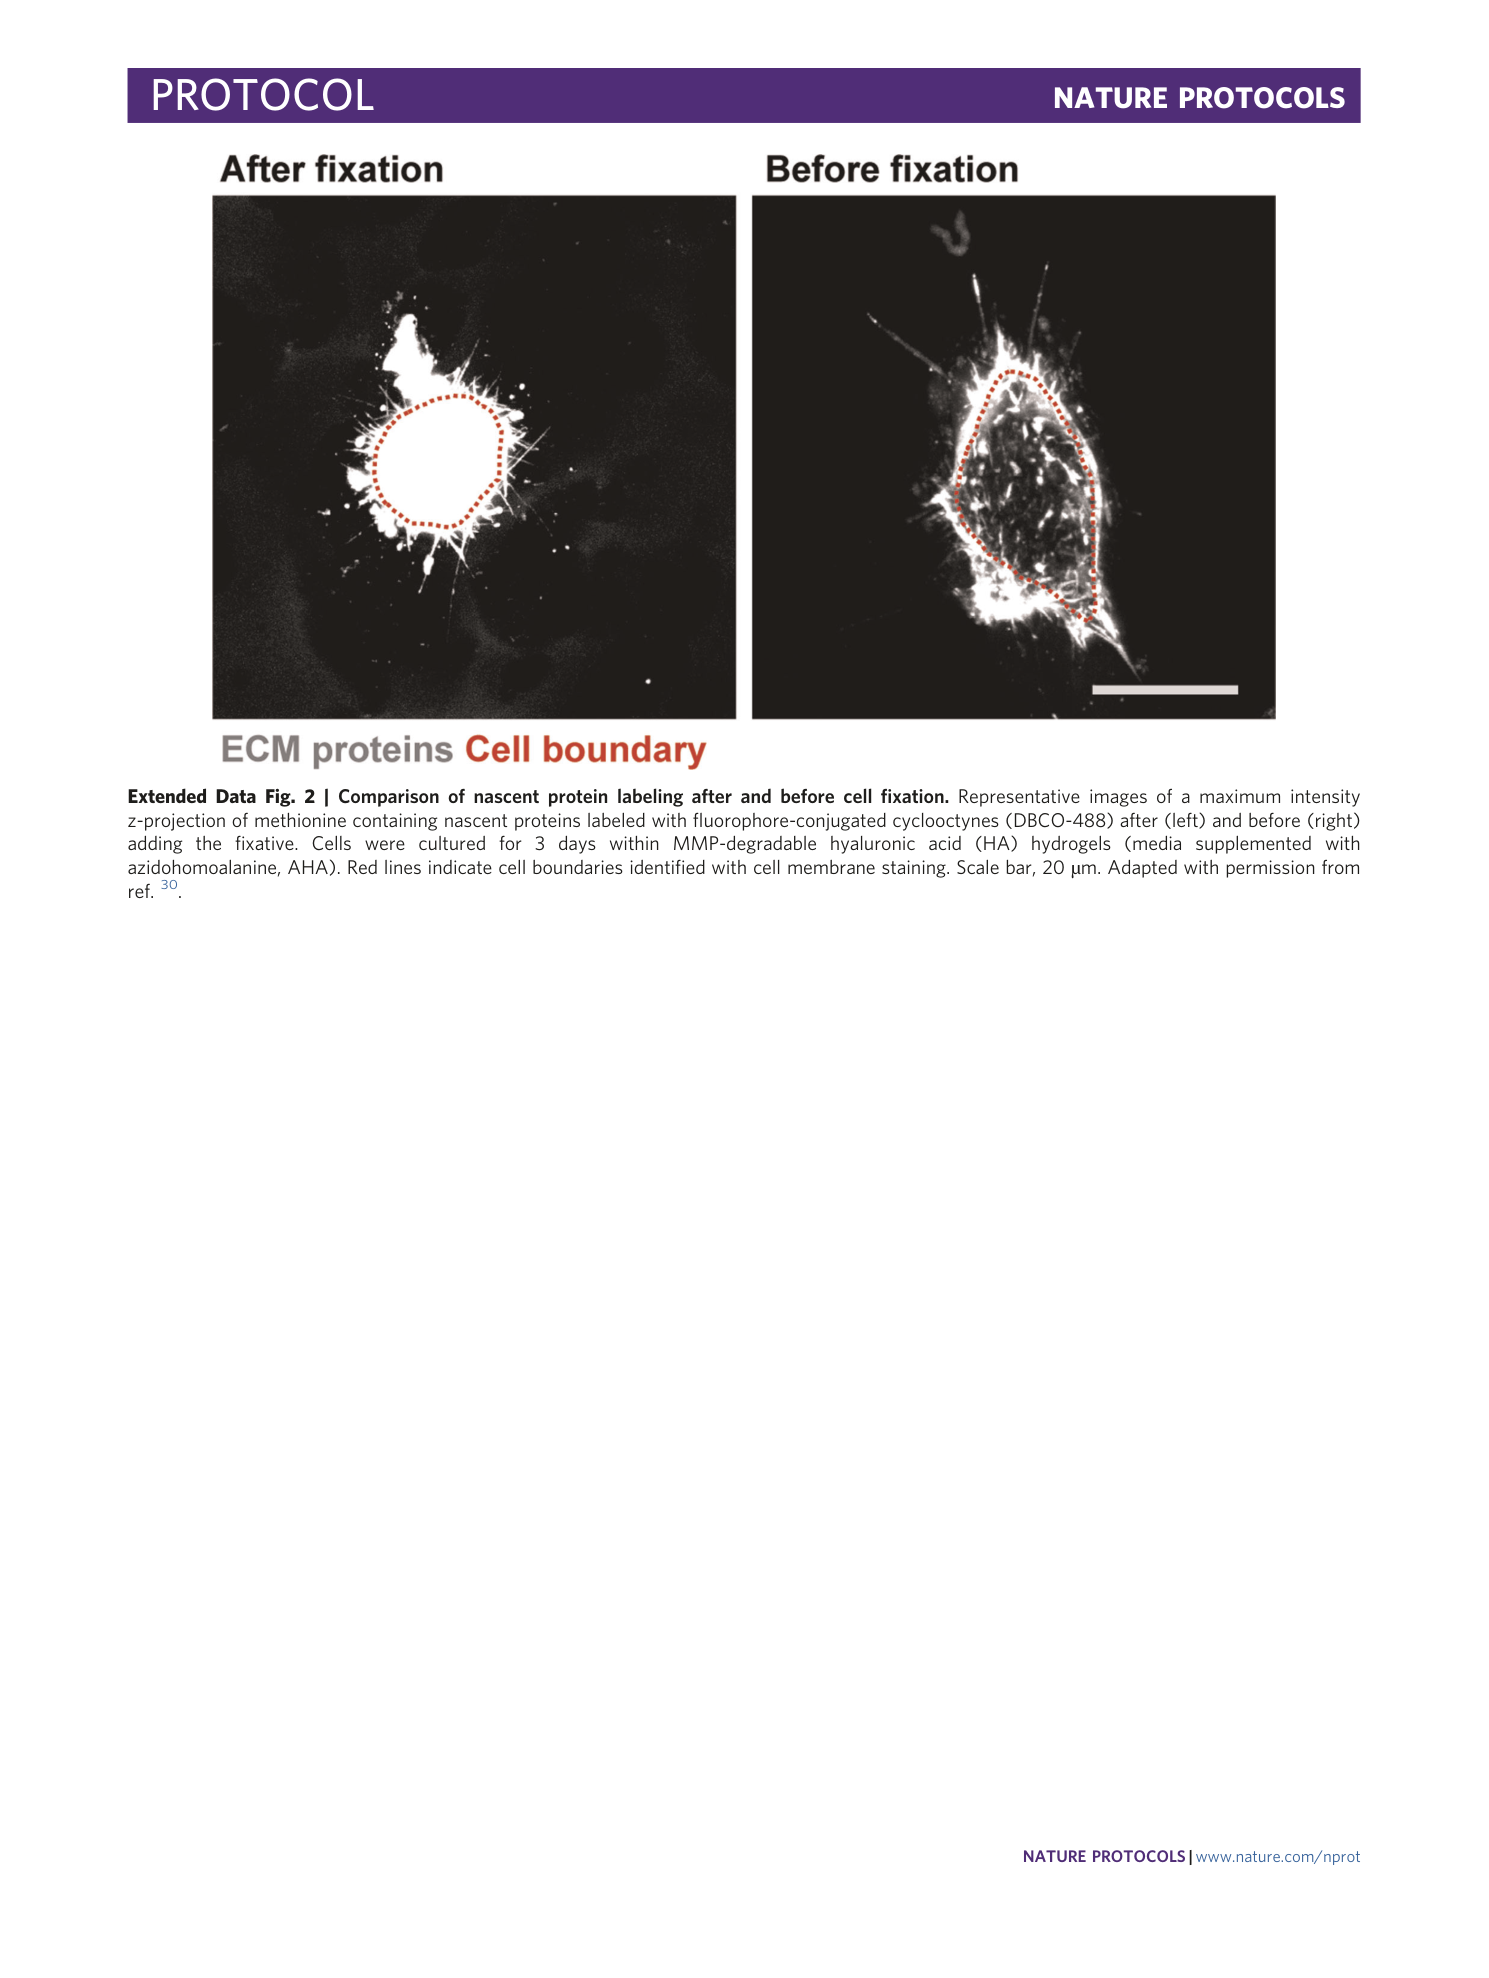
Extended Data Fig. 2 Comparison of nascent protein labeling after and before cell fixation.
Representative images of a maximum intensity z-projection of methionine containing nascent proteins labeled with fluorophore-conjugated cyclooctynes (DBCO-488) after (left) and before (right) adding the fixative. Cells were cultured for 3 days within MMP-degradable hyaluronic acid (HA) hydrogels (media supplemented with azidohomoalanine, AHA). Red lines indicate cell boundaries identified with cell membrane staining. Scale bar, 20 µm. Adapted with permission from ref. 30 .
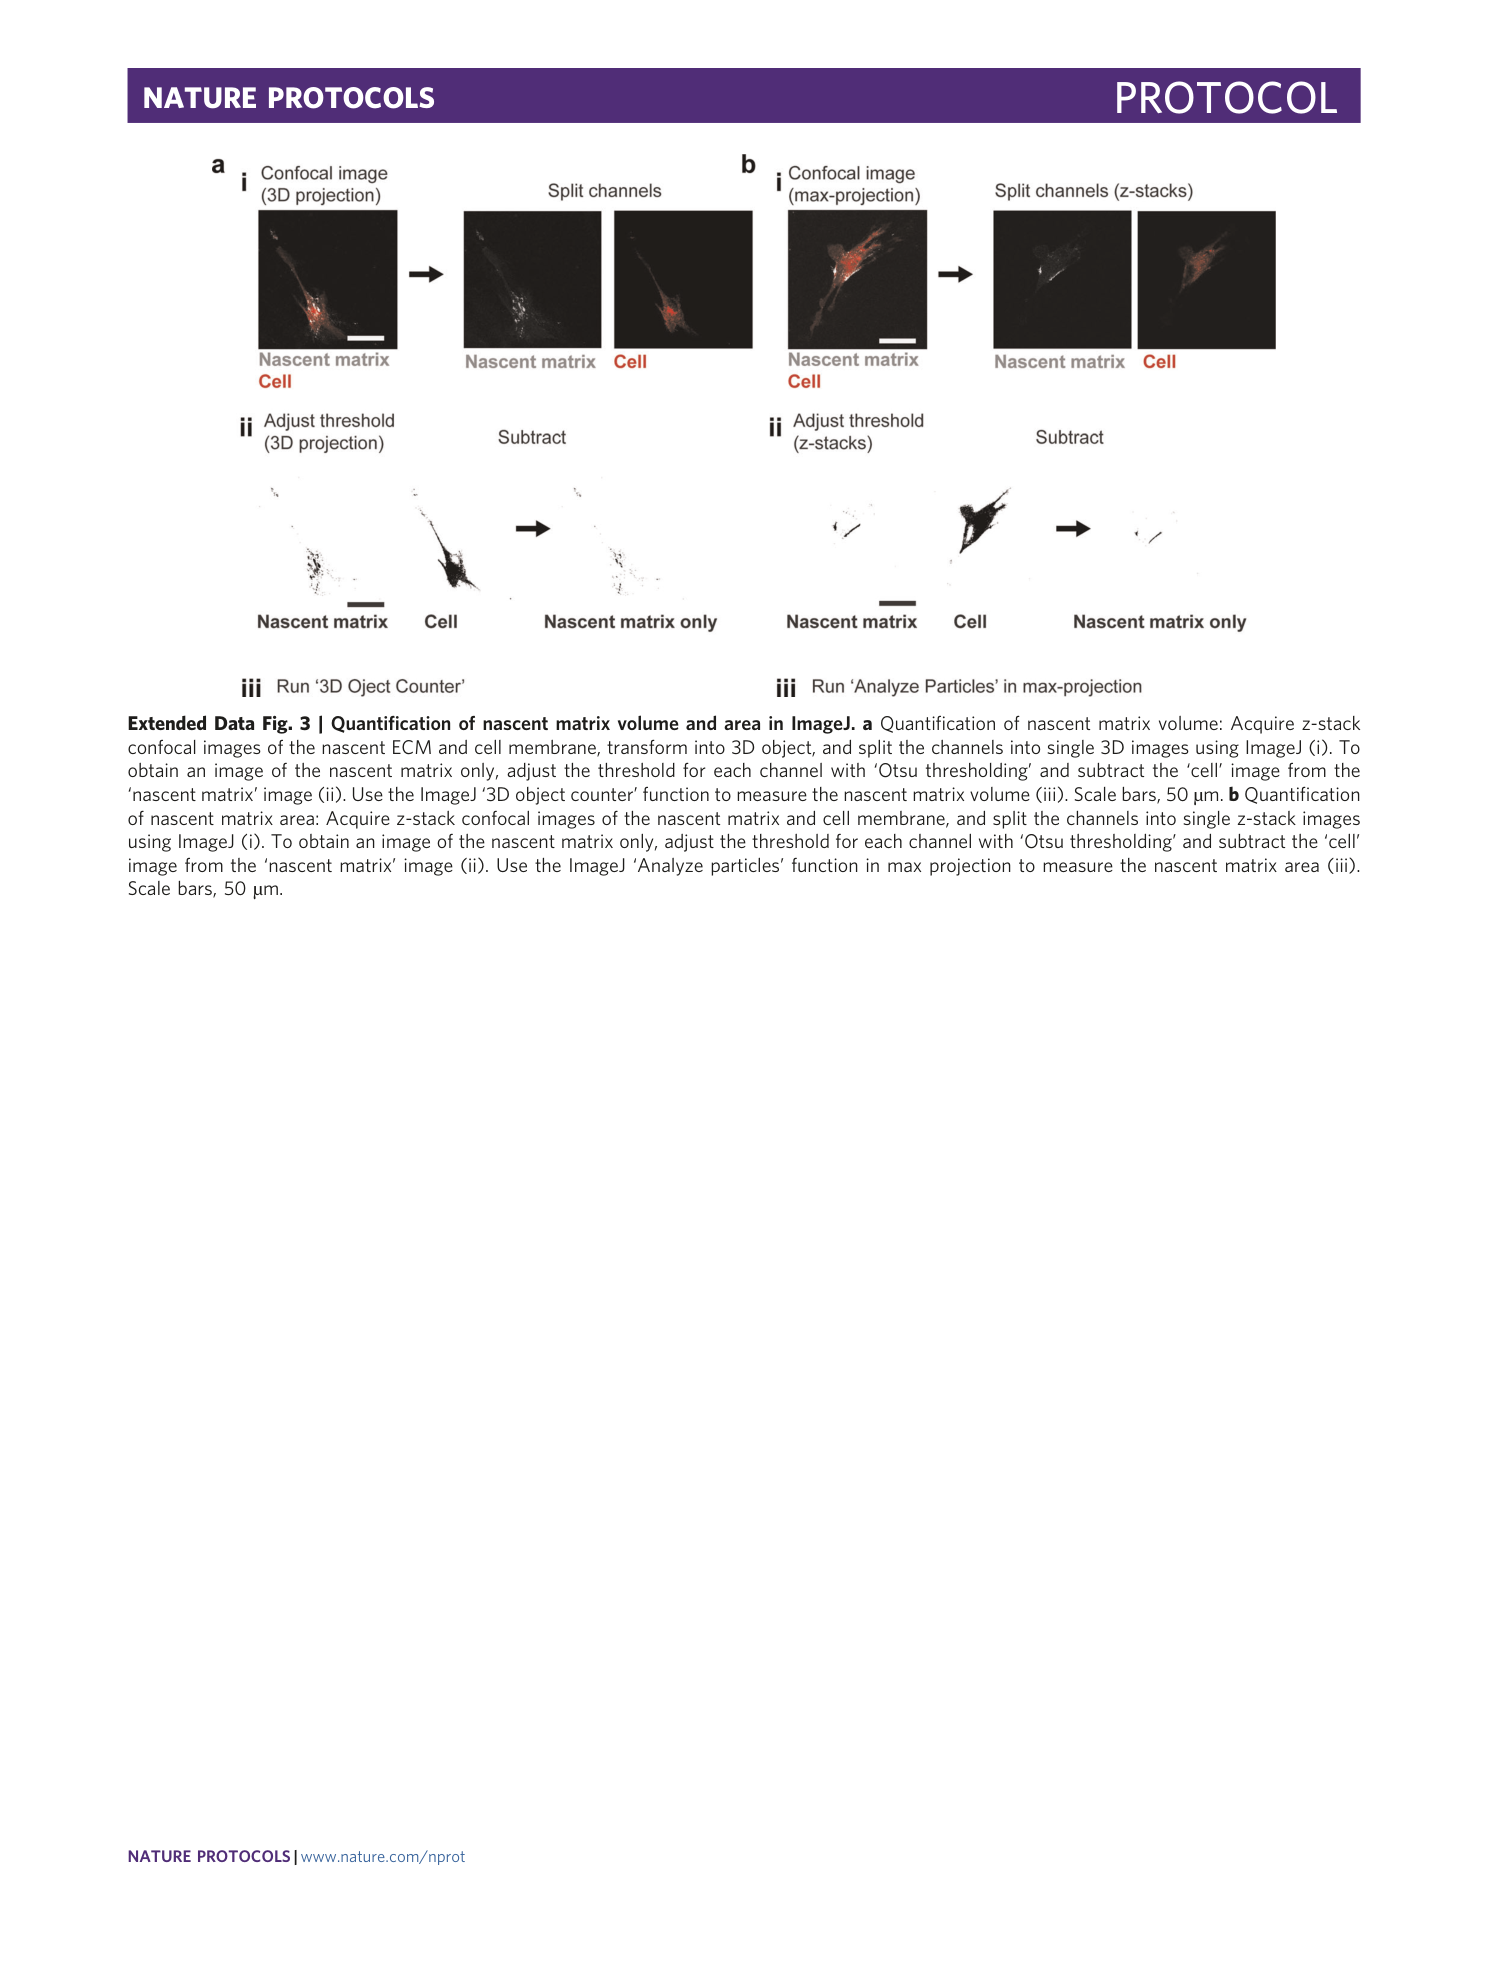
Extended Data Fig. 3 Quantification of nascent matrix volume and area in ImageJ.
a Quantification of nascent matrix volume: Acquire z-stack confocal images of the nascent ECM and cell membrane, transform into 3D object, and split the channels into single 3D images using ImageJ (i). To obtain an image of the nascent matrix only, adjust the threshold for each channel with ‘Otsu thresholding’ and subtract the ‘cell’ image from the ‘nascent matrix’ image (ii). Use the ImageJ ‘3D object counter’ function to measure the nascent matrix volume (iii). Scale bars, 50 µm. b Quantification of nascent matrix area: Acquire z-stack confocal images of the nascent matrix and cell membrane, and split the channels into single z-stack images using ImageJ (i). To obtain an image of the nascent matrix only, adjust the threshold for each channel with ‘Otsu thresholding’ and subtract the ‘cell’ image from the ‘nascent matrix’ image (ii). Use the ImageJ ‘Analyze particles’ function in max projection to measure the nascent matrix area (iii). Scale bars, 50 µm.
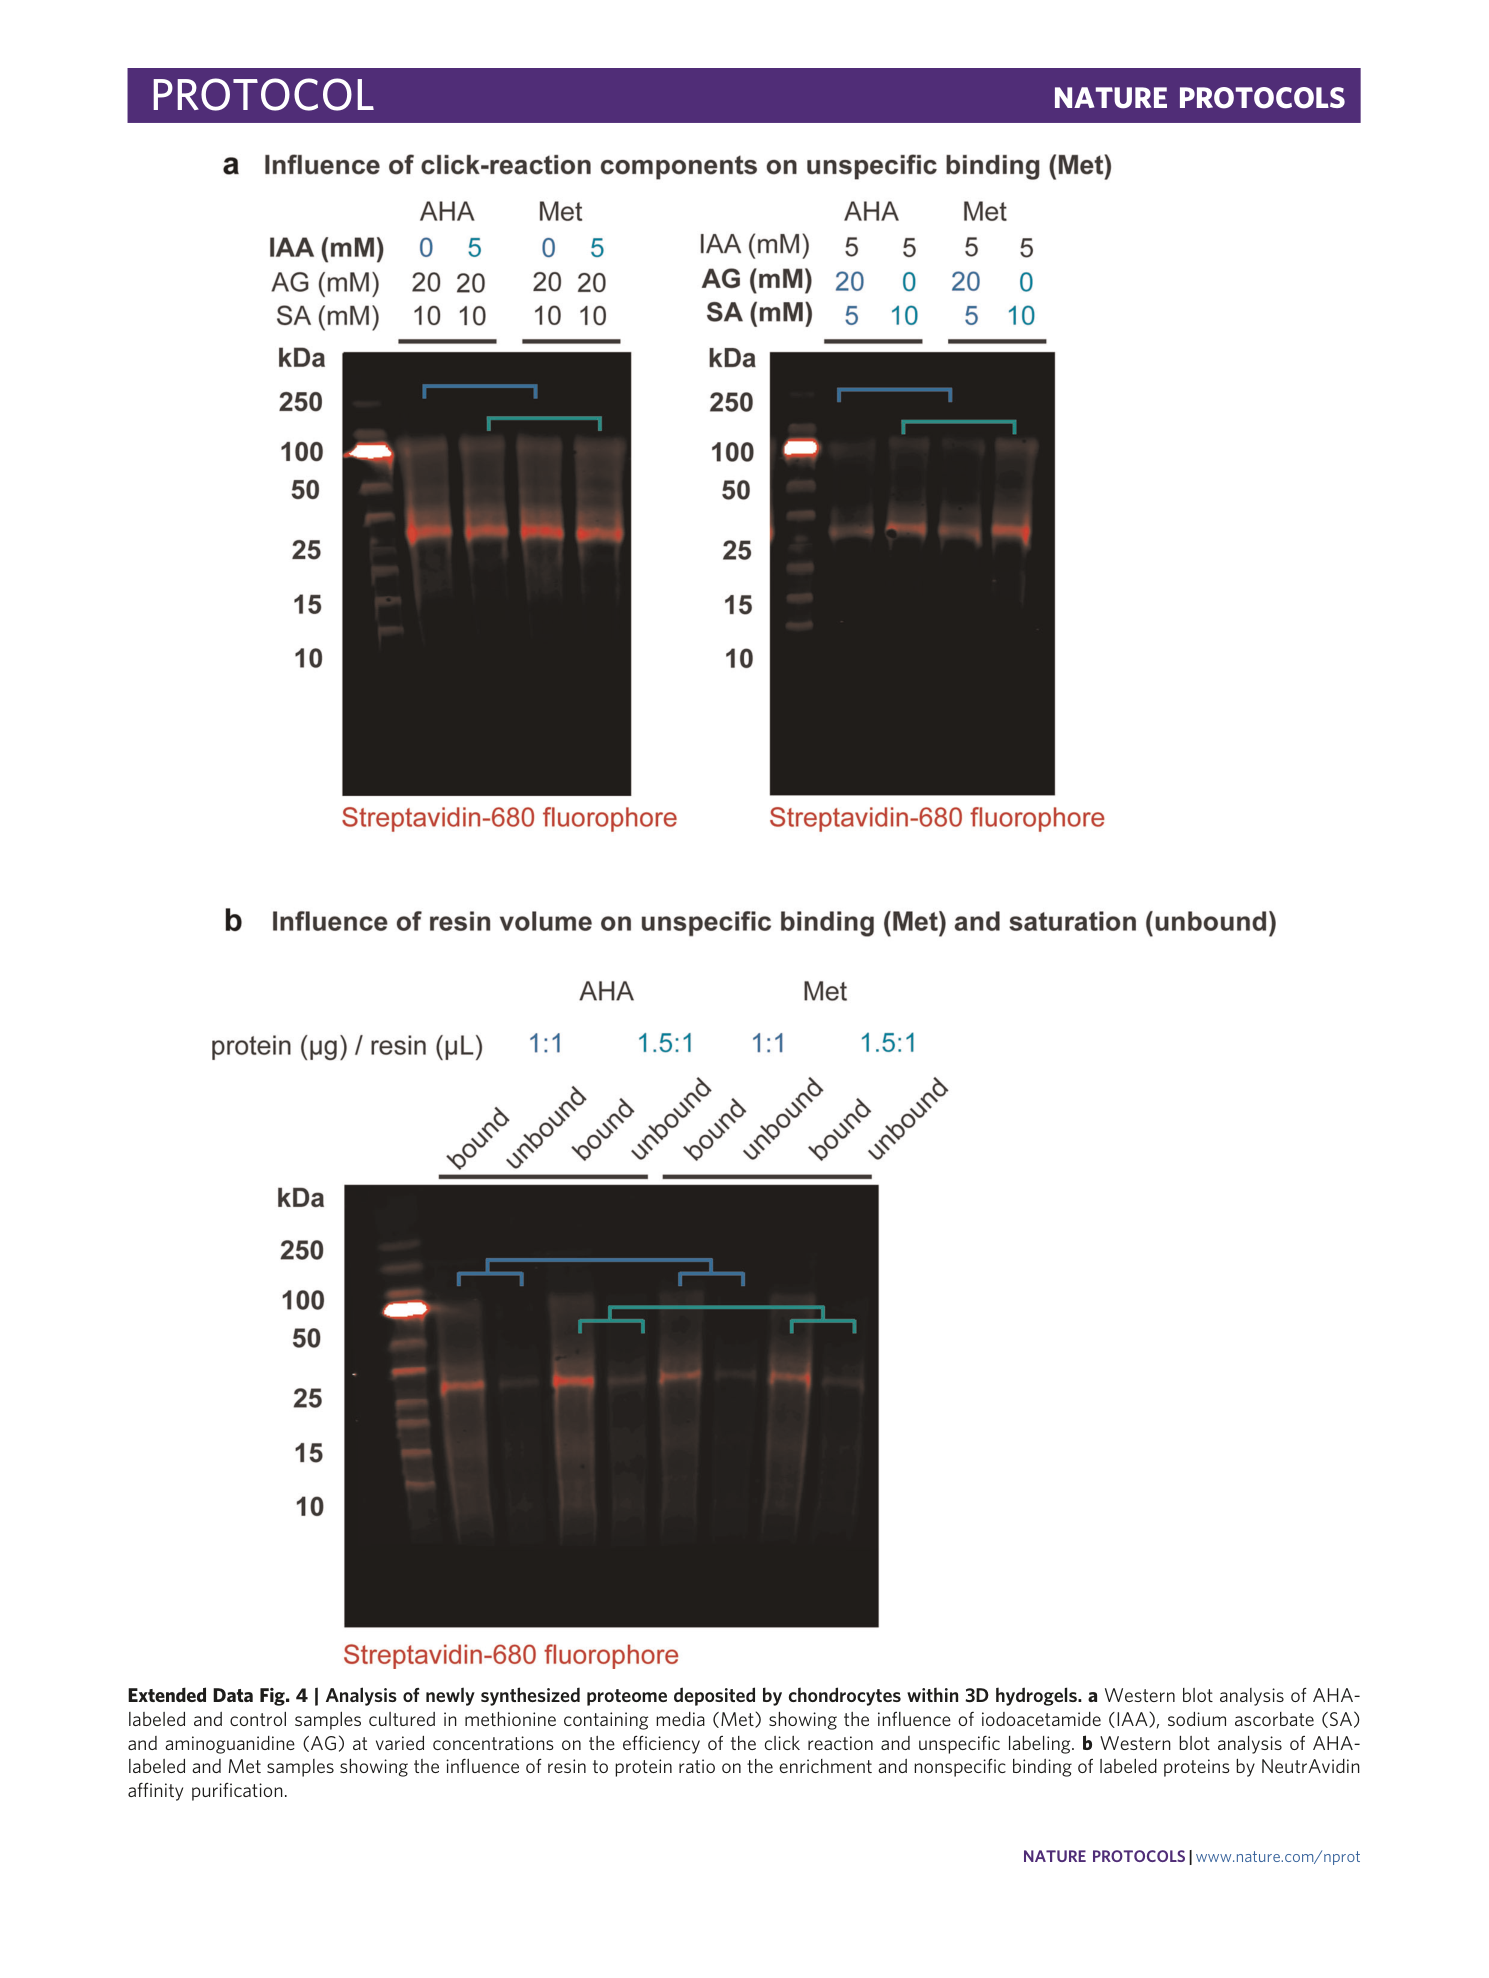
Extended Data Fig. 4 Analysis of newly synthesized proteome deposited by chondrocytes within 3D hydrogels.
a Western blot analysis of AHA-labeled and control samples cultured in methionine containing media (Met) showing the influence of iodoacetamide (IAA), sodium ascorbate (SA) and aminoguanidine (AG) at varied concentrations on the efficiency of the click reaction and unspecific labeling. b Western blot analysis of AHA-labeled and Met samples showing the influence of resin to protein ratio on the enrichment and nonspecific binding of labeled proteins by NeutrAvidin affinity purification.
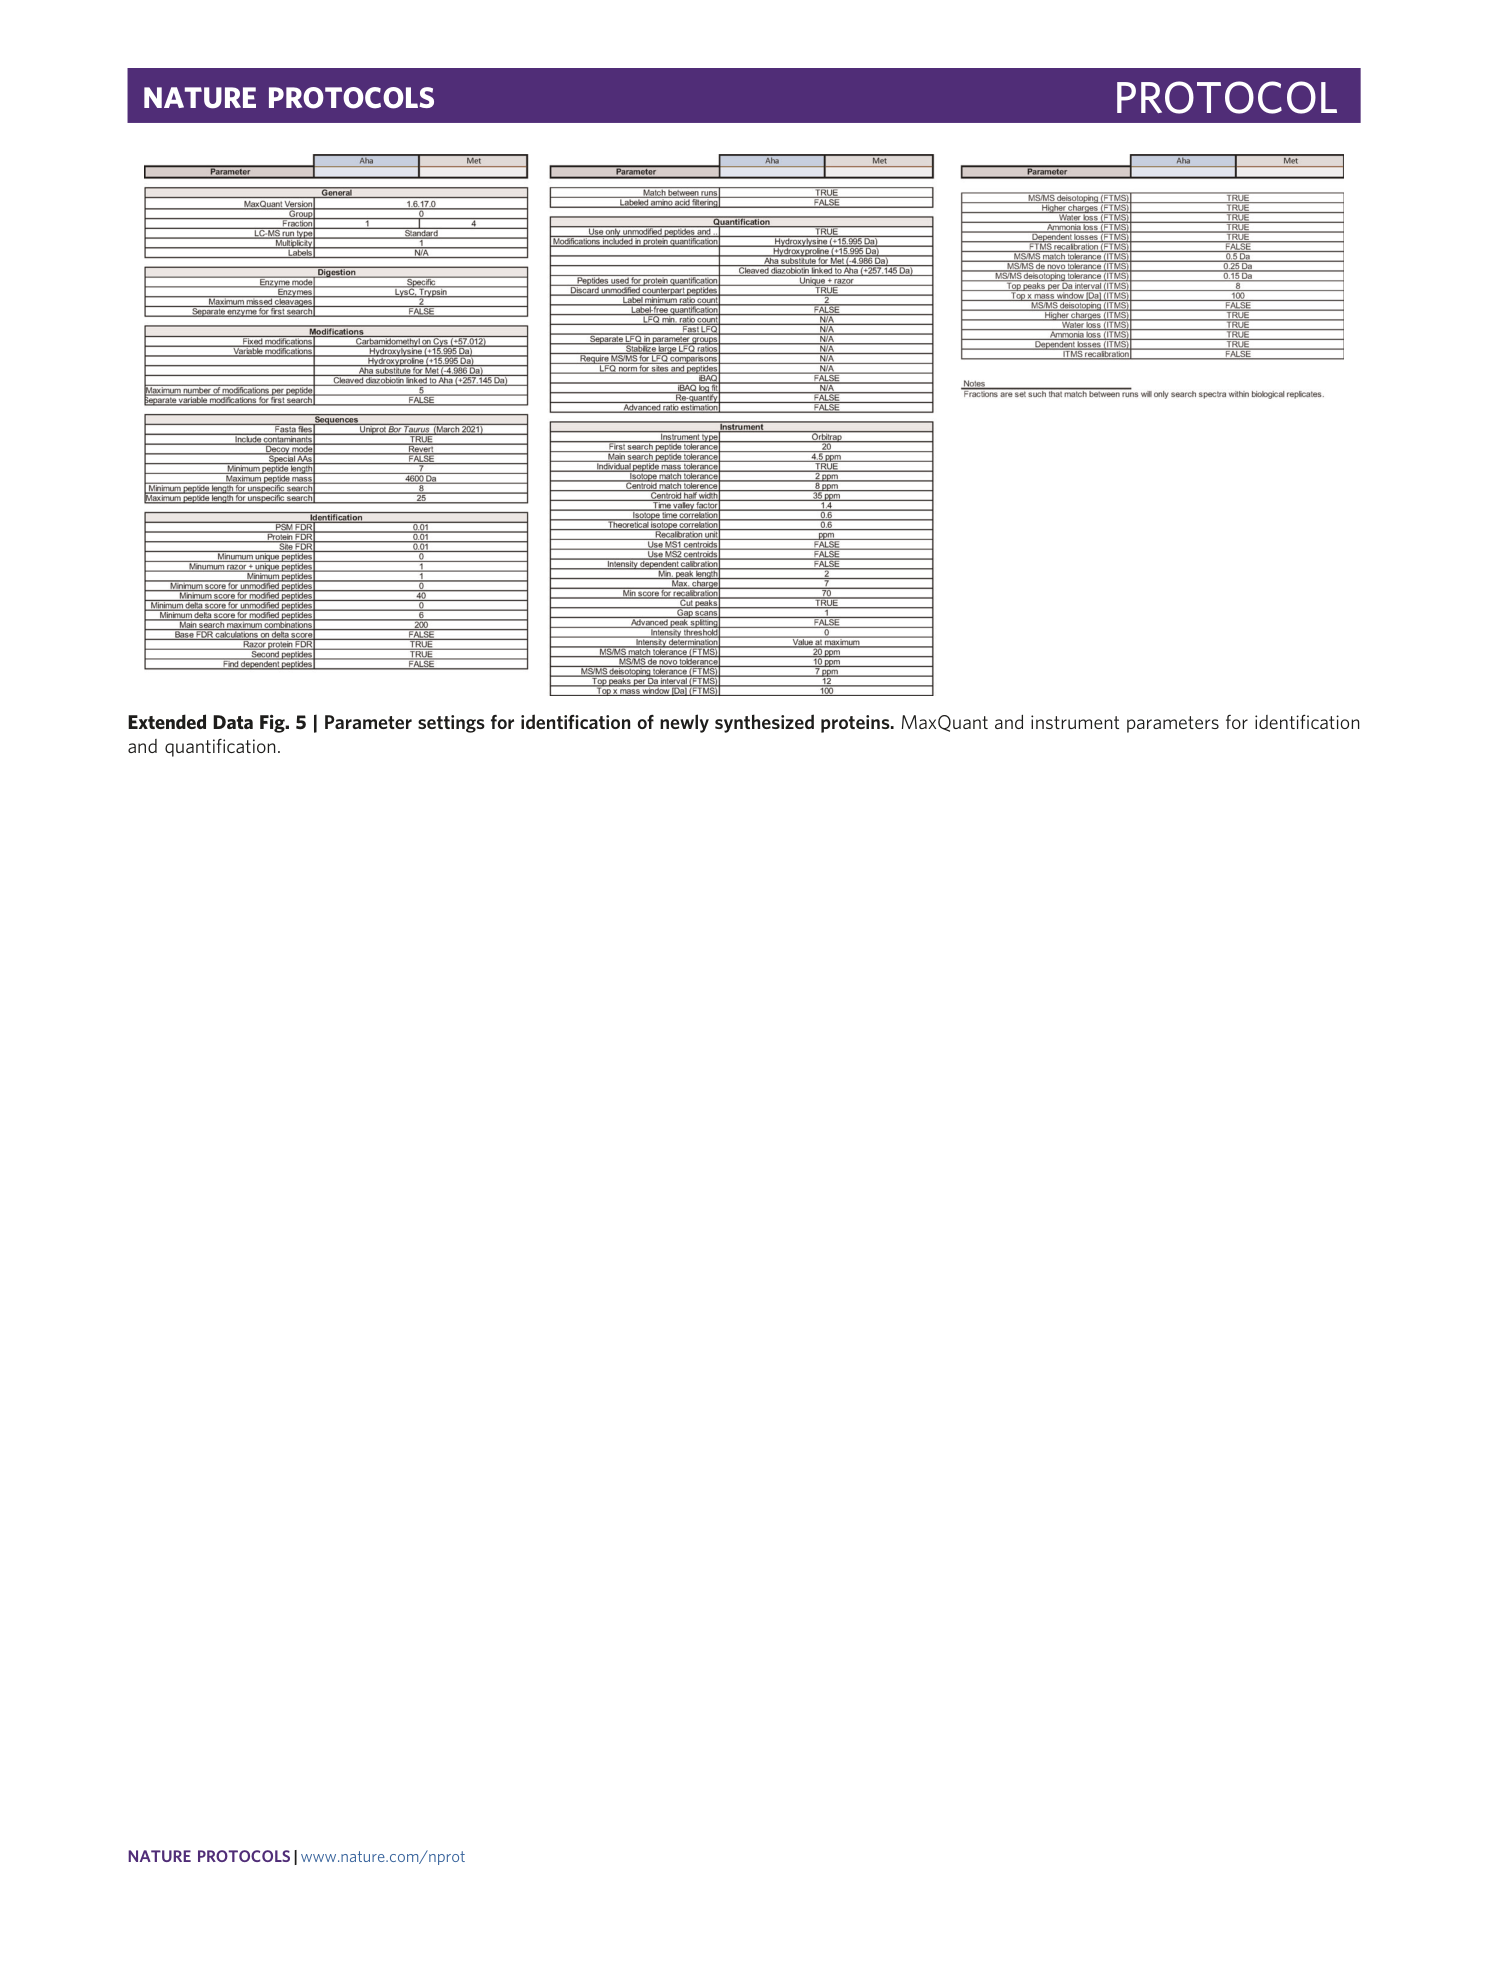
Extended Data Fig. 5 Parameter settings for identification of newly synthesized proteins.
MaxQuant and instrument parameters for identification and quantification.
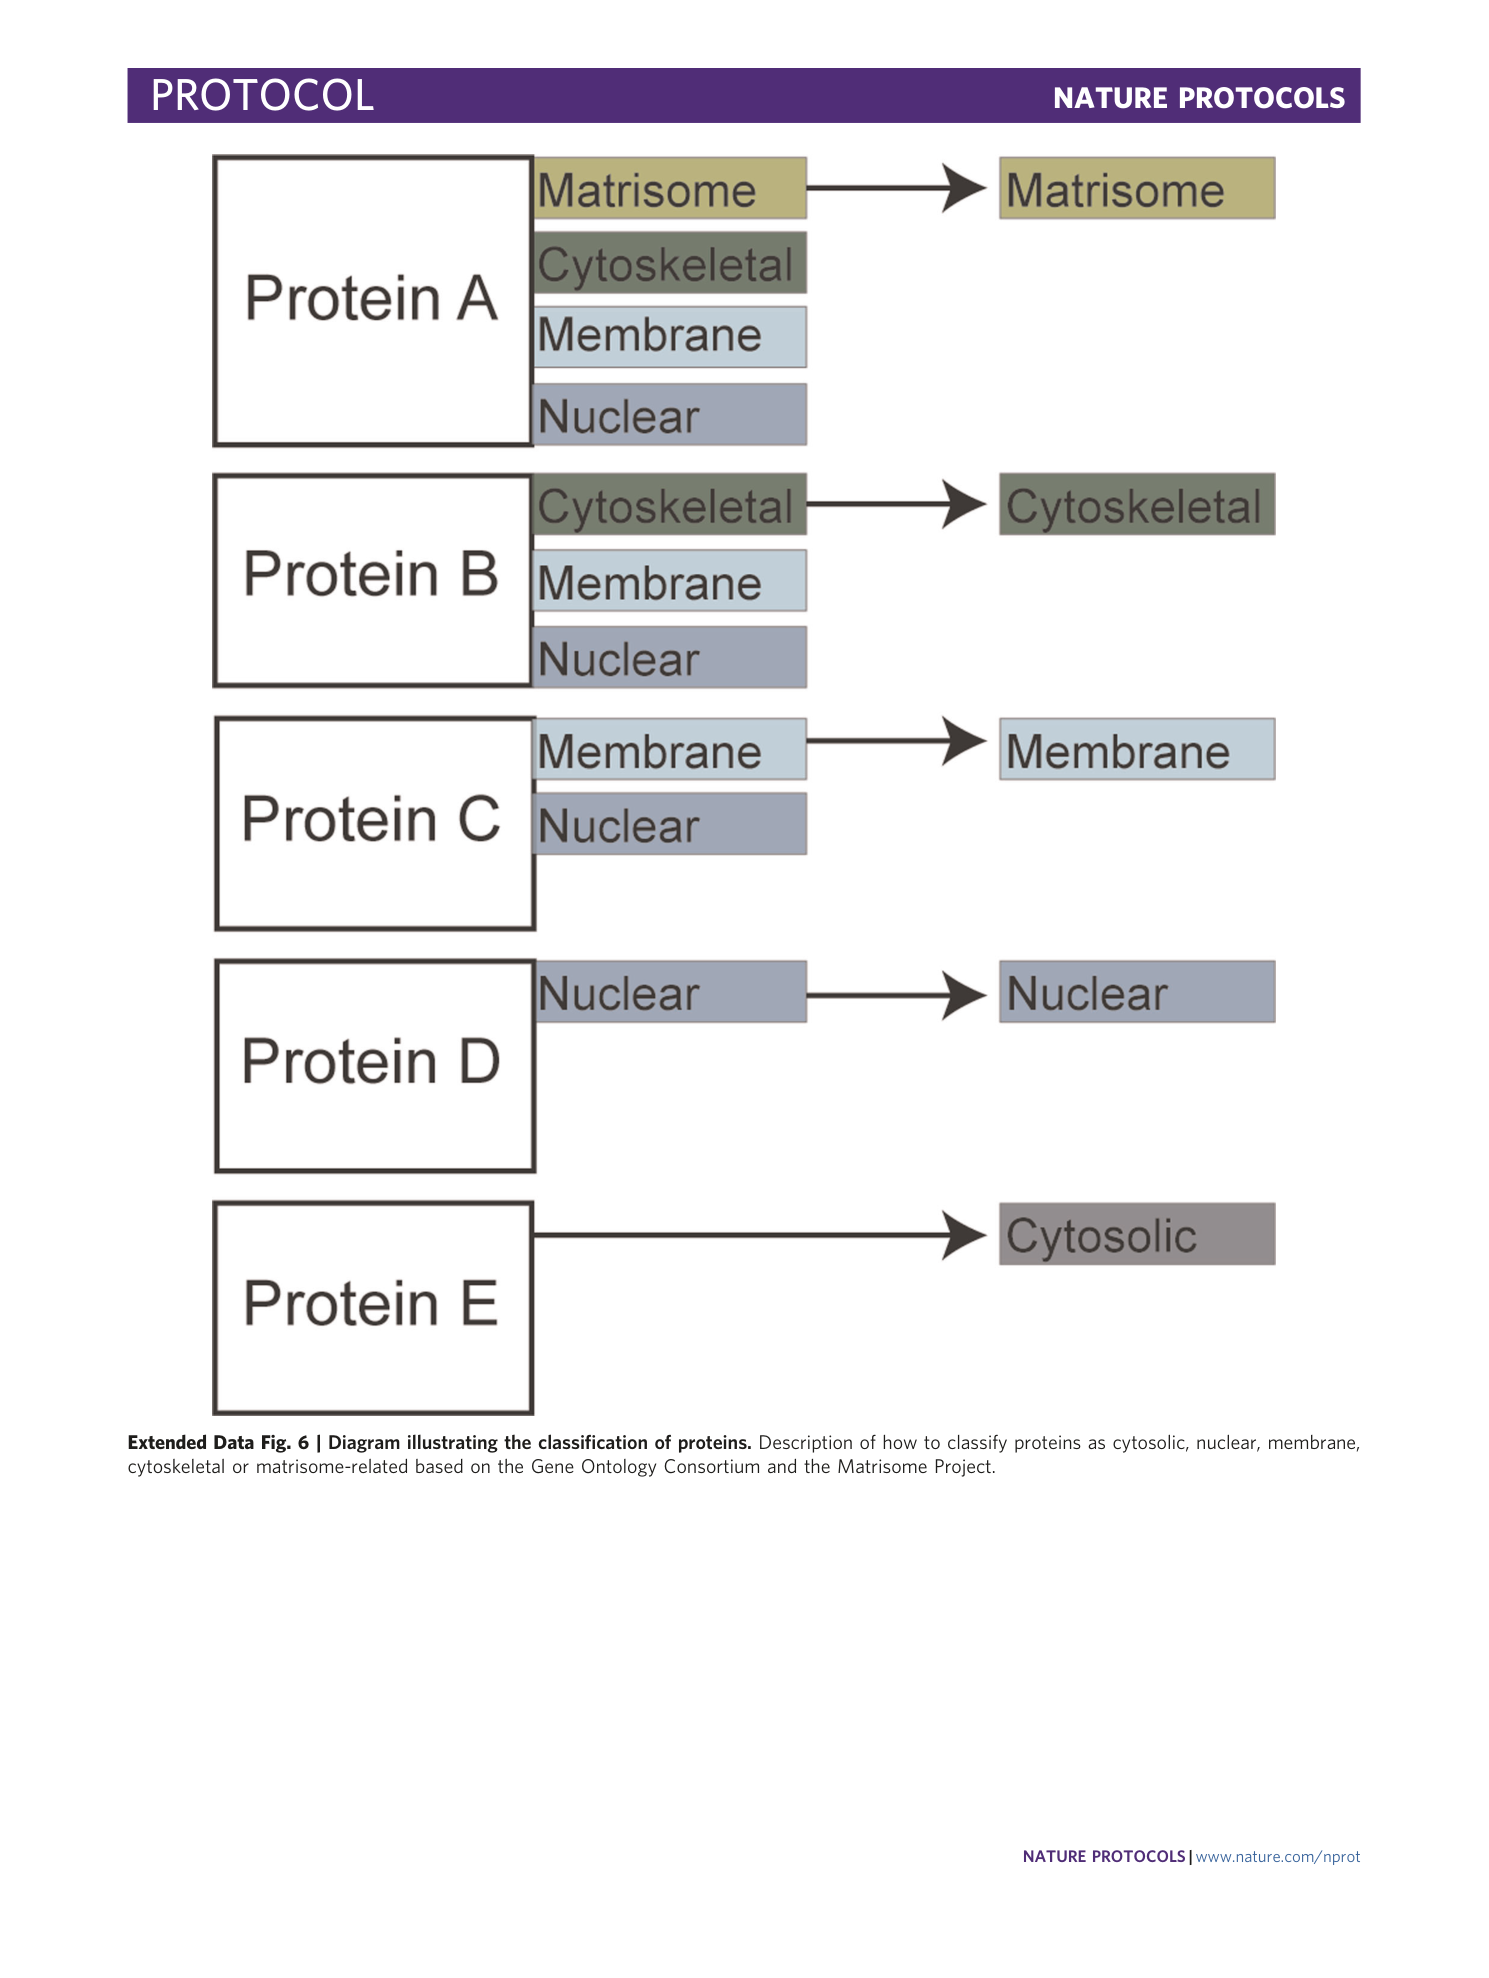
Extended Data Fig. 6 Diagram illustrating the classification of proteins.
Description of how to classify proteins as cytosolic, nuclear, membrane, cytoskeletal or matrisome-related based on the Gene Ontology Consortium and the Matrisome Project.
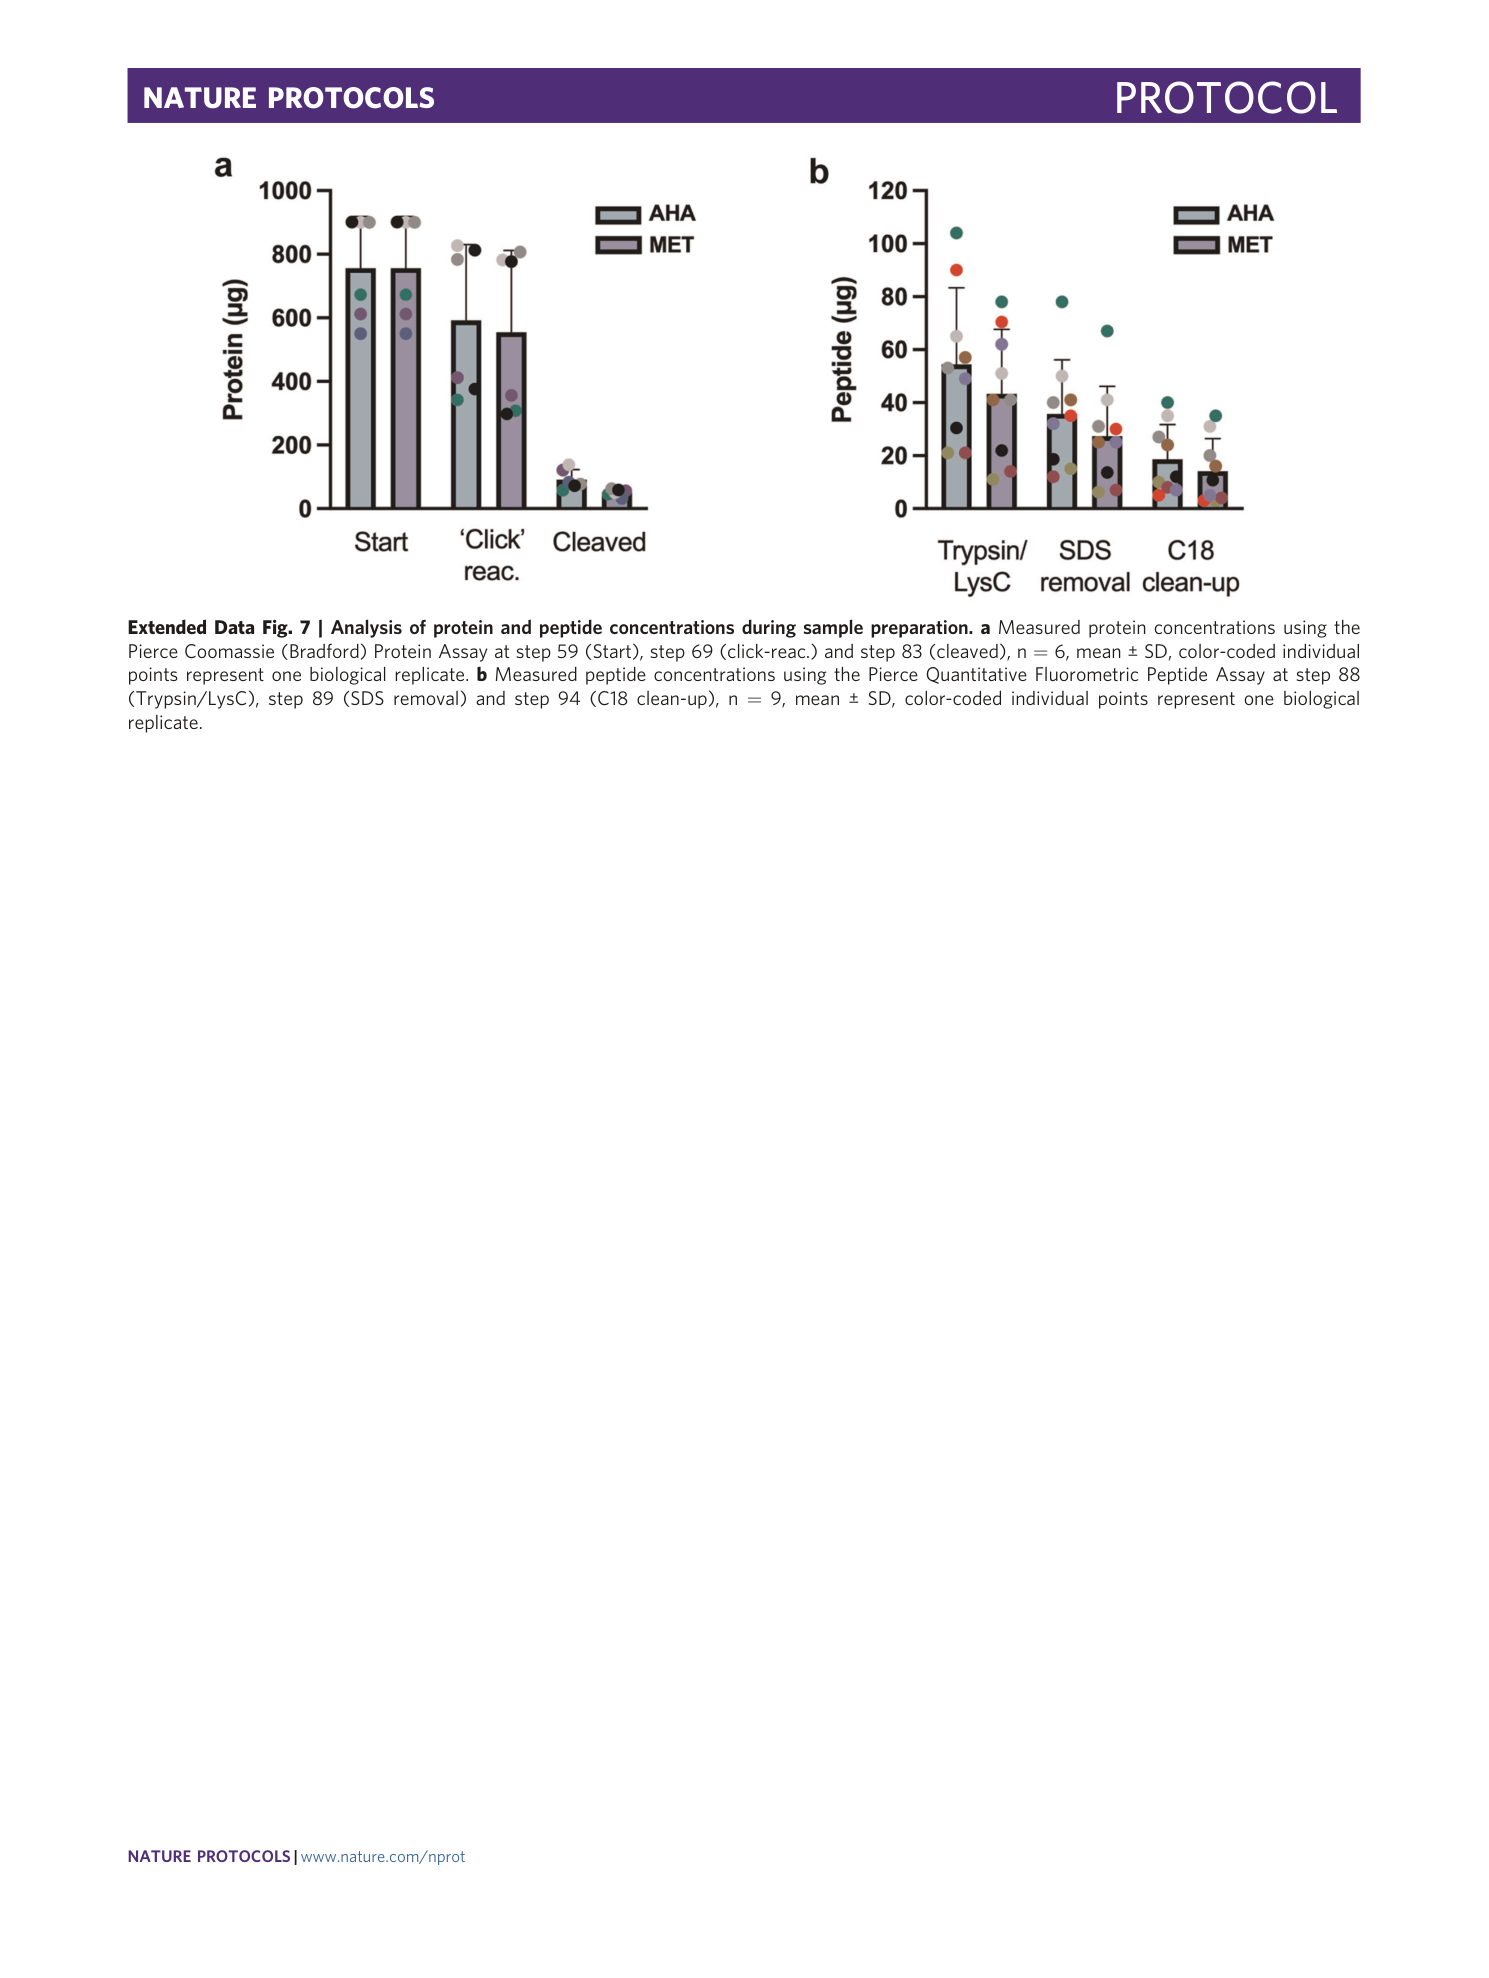
Extended Data Fig. 7 Analysis of protein and peptide concentrations during sample preparation.
a Measured protein concentrations using the Pierce Coomassie (Bradford) Protein Assay at step 59 (Start), step 69 (click-reac.) and step 83 (cleaved), n = 6, mean ± SD, color-coded individual points represent one biological replicate. b Measured peptide concentrations using the Pierce Quantitative Fluorometric Peptide Assay at step 88 (Trypsin/LysC), step 89 (SDS removal) and step 94 (C18 clean-up), n = 9, mean ± SD, color-coded individual points represent one biological replicate.
Supplementary information
Supplementary Information
Supplementary Method: LC-MS/MS analysis.
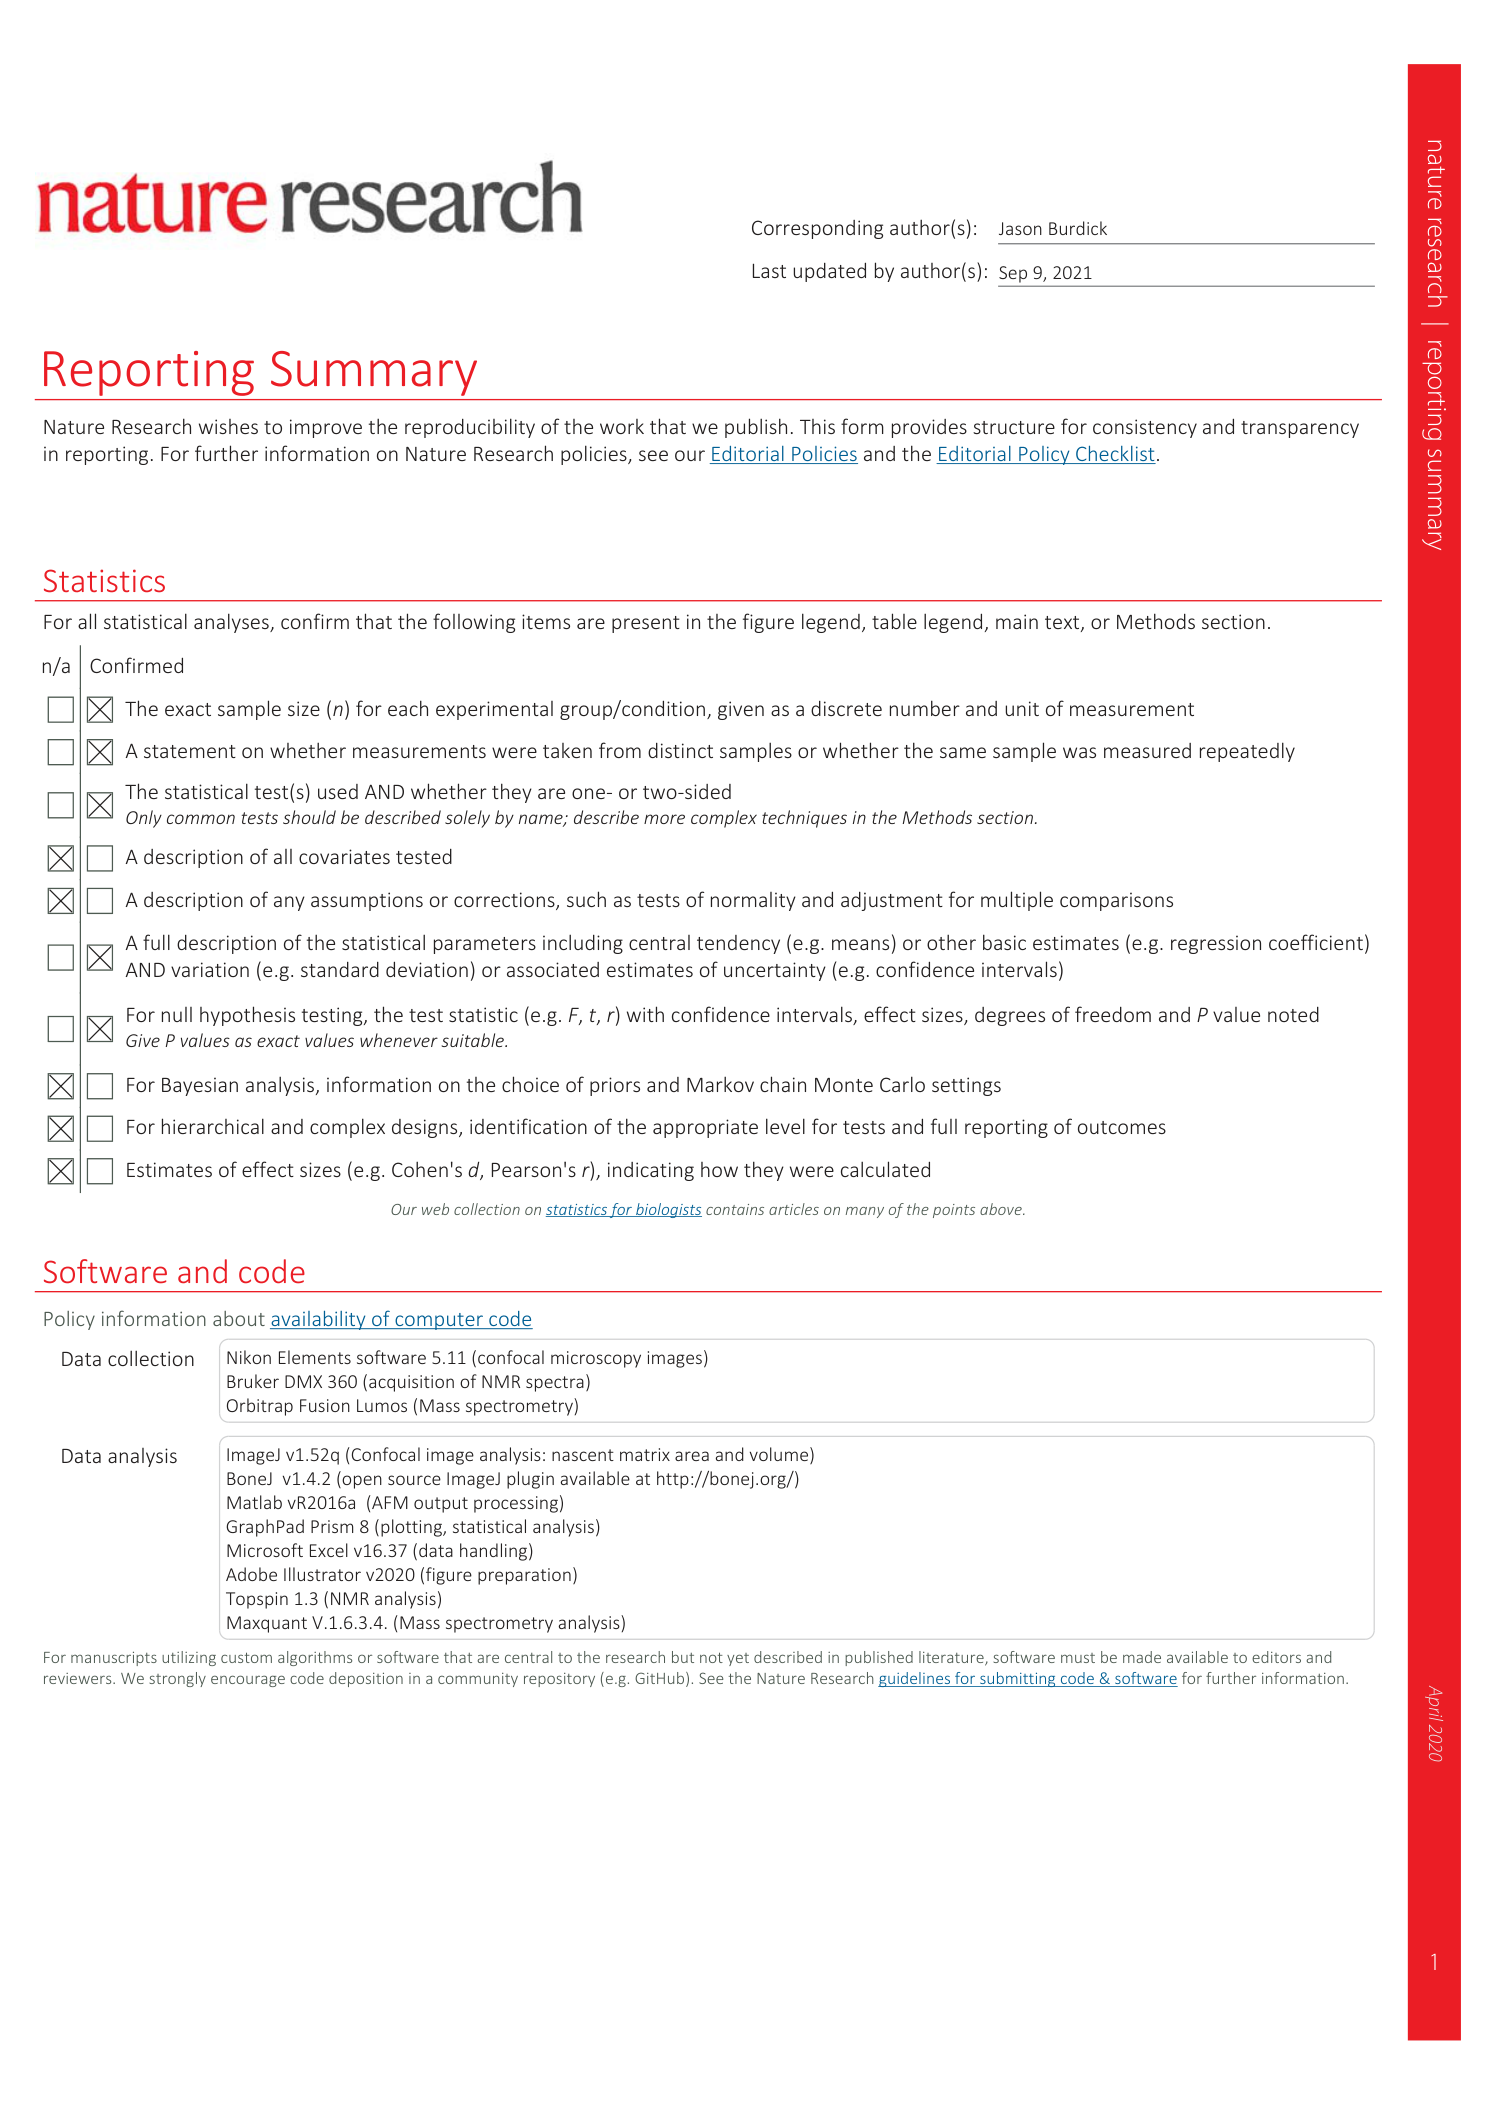
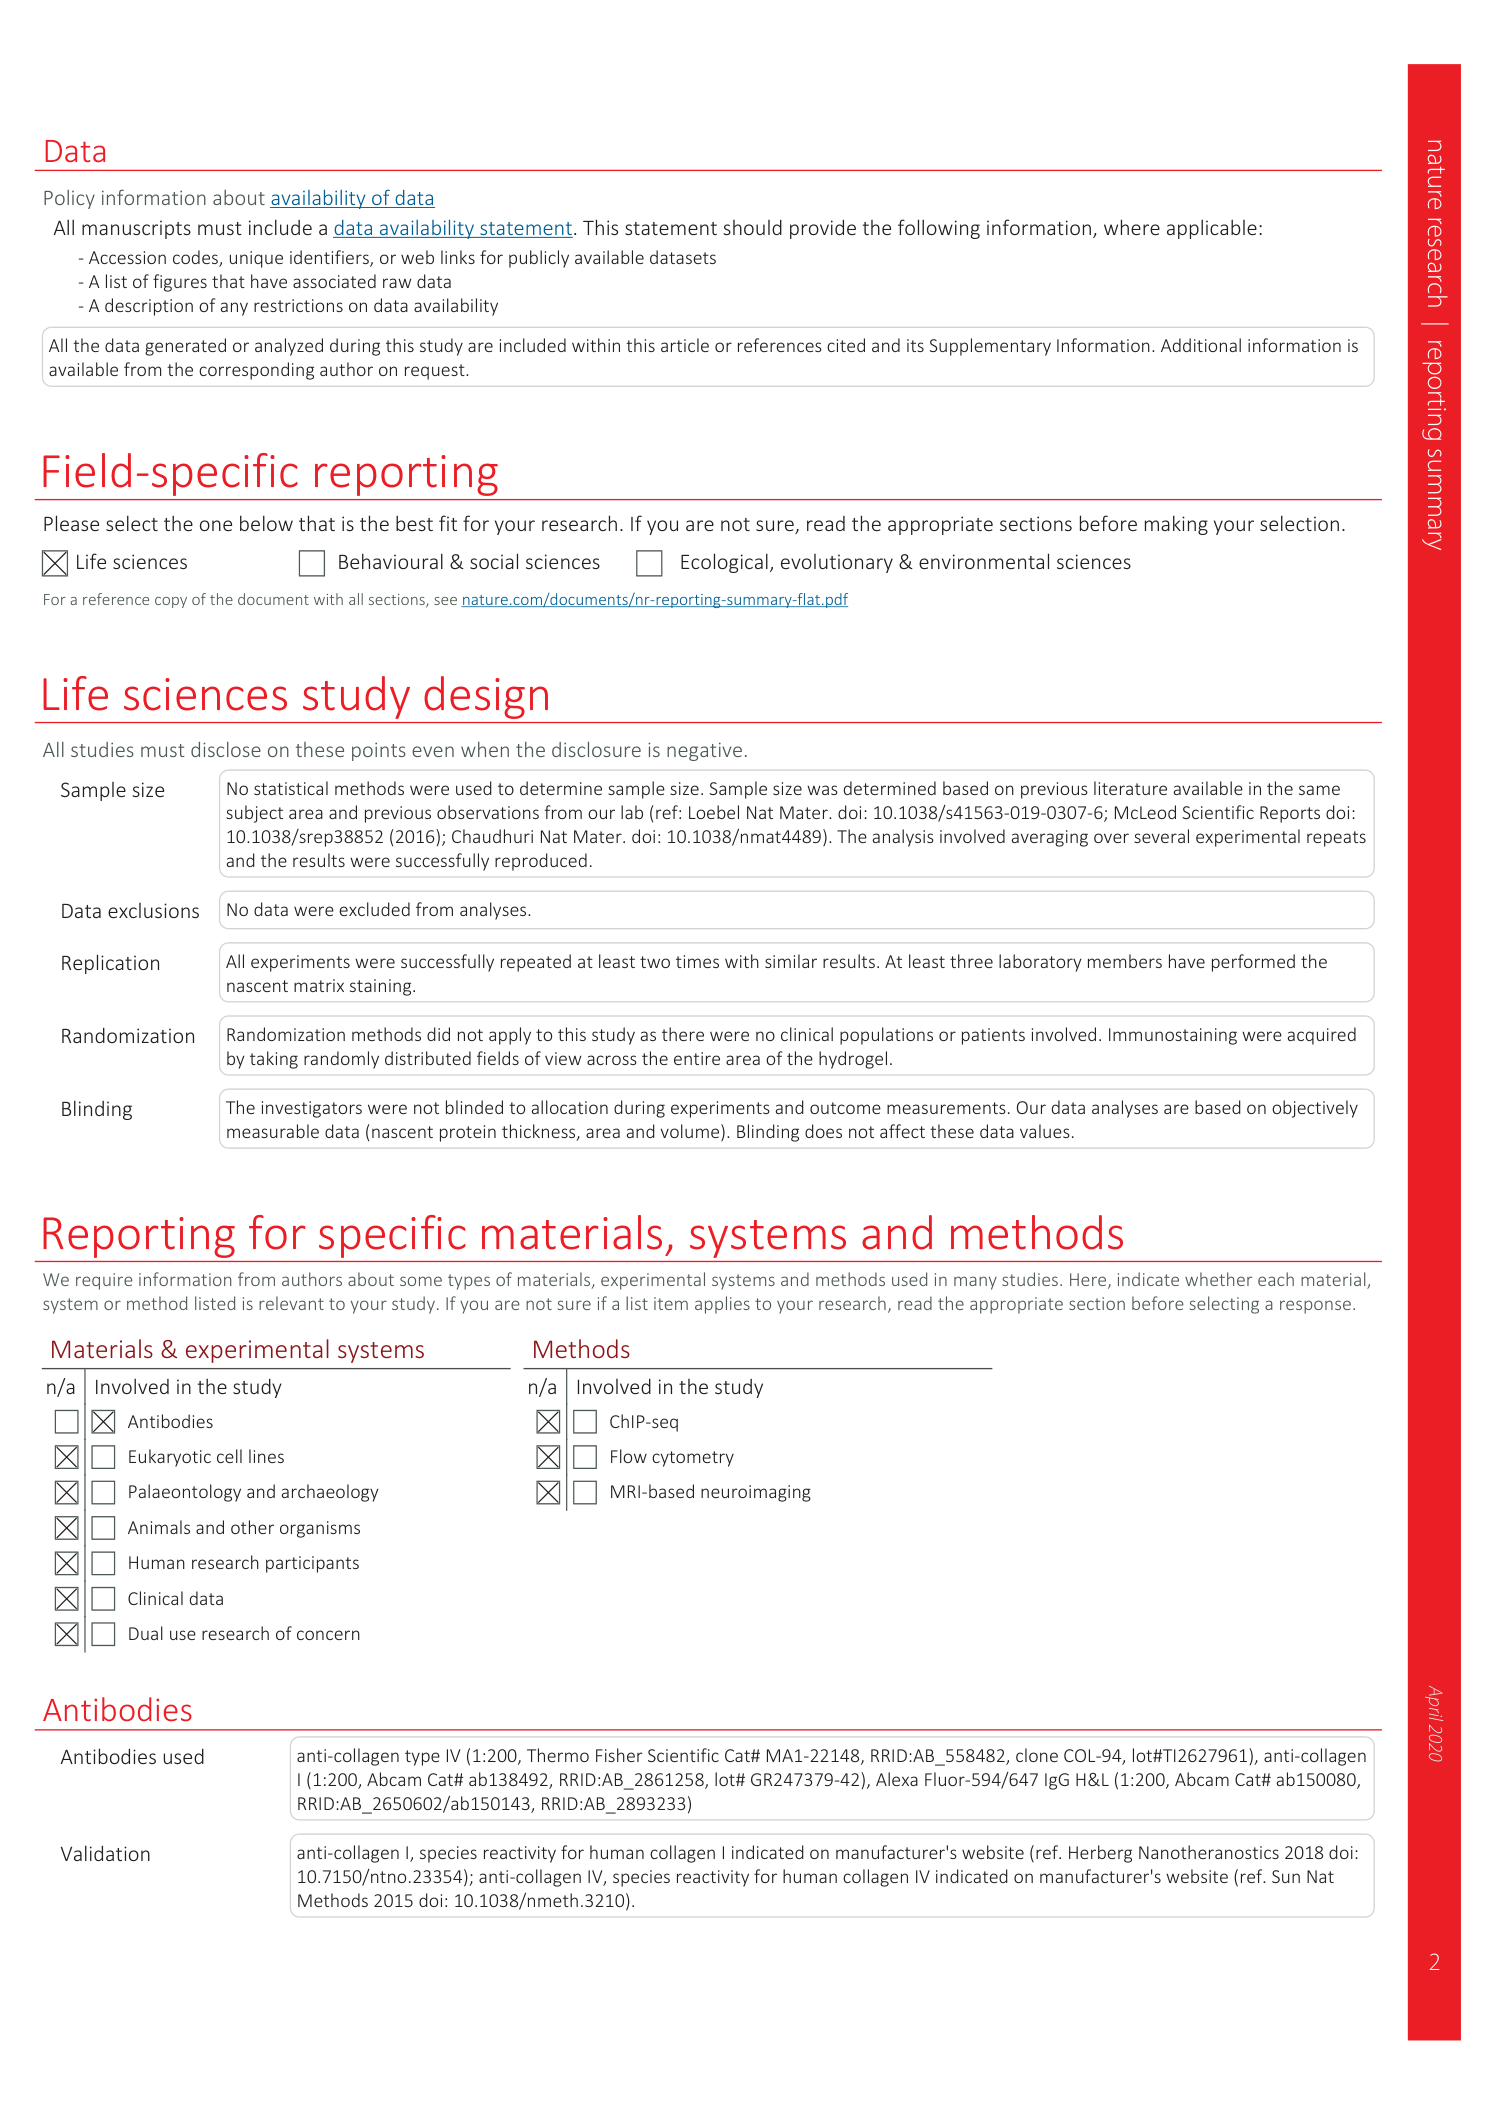
Reporting Summary
Supplementary Table 1
Identification and analysis of newly synthesized proteins. proteinGroups (the Original ‘proteinGroups’ data generated by MaxQuant), Filtered Proteins (Filtered protein IDs and intensities used for downstream data analysis) and Data Analyses (ECM proteins identified with fold change calculations and annotations).
