Using ConSurf to Detect Functionally Important Regions in RNA
Maya Rubin, Maya Rubin, Nir Ben-Tal, Nir Ben-Tal
Abstract
The ConSurf web server (https://consurf.tau.ac.il/) for using evolutionary data to detect functional regions is useful for analyzing proteins. The analysis is based on the premise that functional regions, which may for example facilitate ligand binding and catalysis, often evolve slowly. The analysis requires finding enough effective, i.e., non-redundant, sufficiently remote homologs. Indeed, the ConSurf pipeline, which is based on state-of-the-art protein sequence databases and analysis tools, is highly valuable for protein analysis. ConSurf also allows evolutionary analysis of RNA, but the analysis often fails due to insufficient data, particularly the inability of the current pipeline to detect enough effective RNA homologs. This is because the RNA search tools and databases offered are not as good as those used for protein analysis. Fortunately, ConSurf also allows importing external collections of homologs in the form of a multiple sequence alignment (MSA). Leveraging this, here we describe various protocols for constructing MSAs for successful ConSurf analysis of RNA queries. We report the level of success of these protocols on an exemplary set comprising a dozen RNA molecules of diverse structure and function. © 2021 The Authors. Current Protocols published by Wiley Periodicals LLC.
Basic Protocol 1 : Standard ConSurf evolutionary conservation analysis of an RNA query.
Basic Protocol 2 : ConSurf evolutionary conservation analysis of an RNA query with external MSA.
Support Protocol 1 : Construction of an MSA for an RNA query using other online servers.
Support Protocol 2 : Construction of an MSA for an RNA query using nHMMER locally
INTRODUCTION
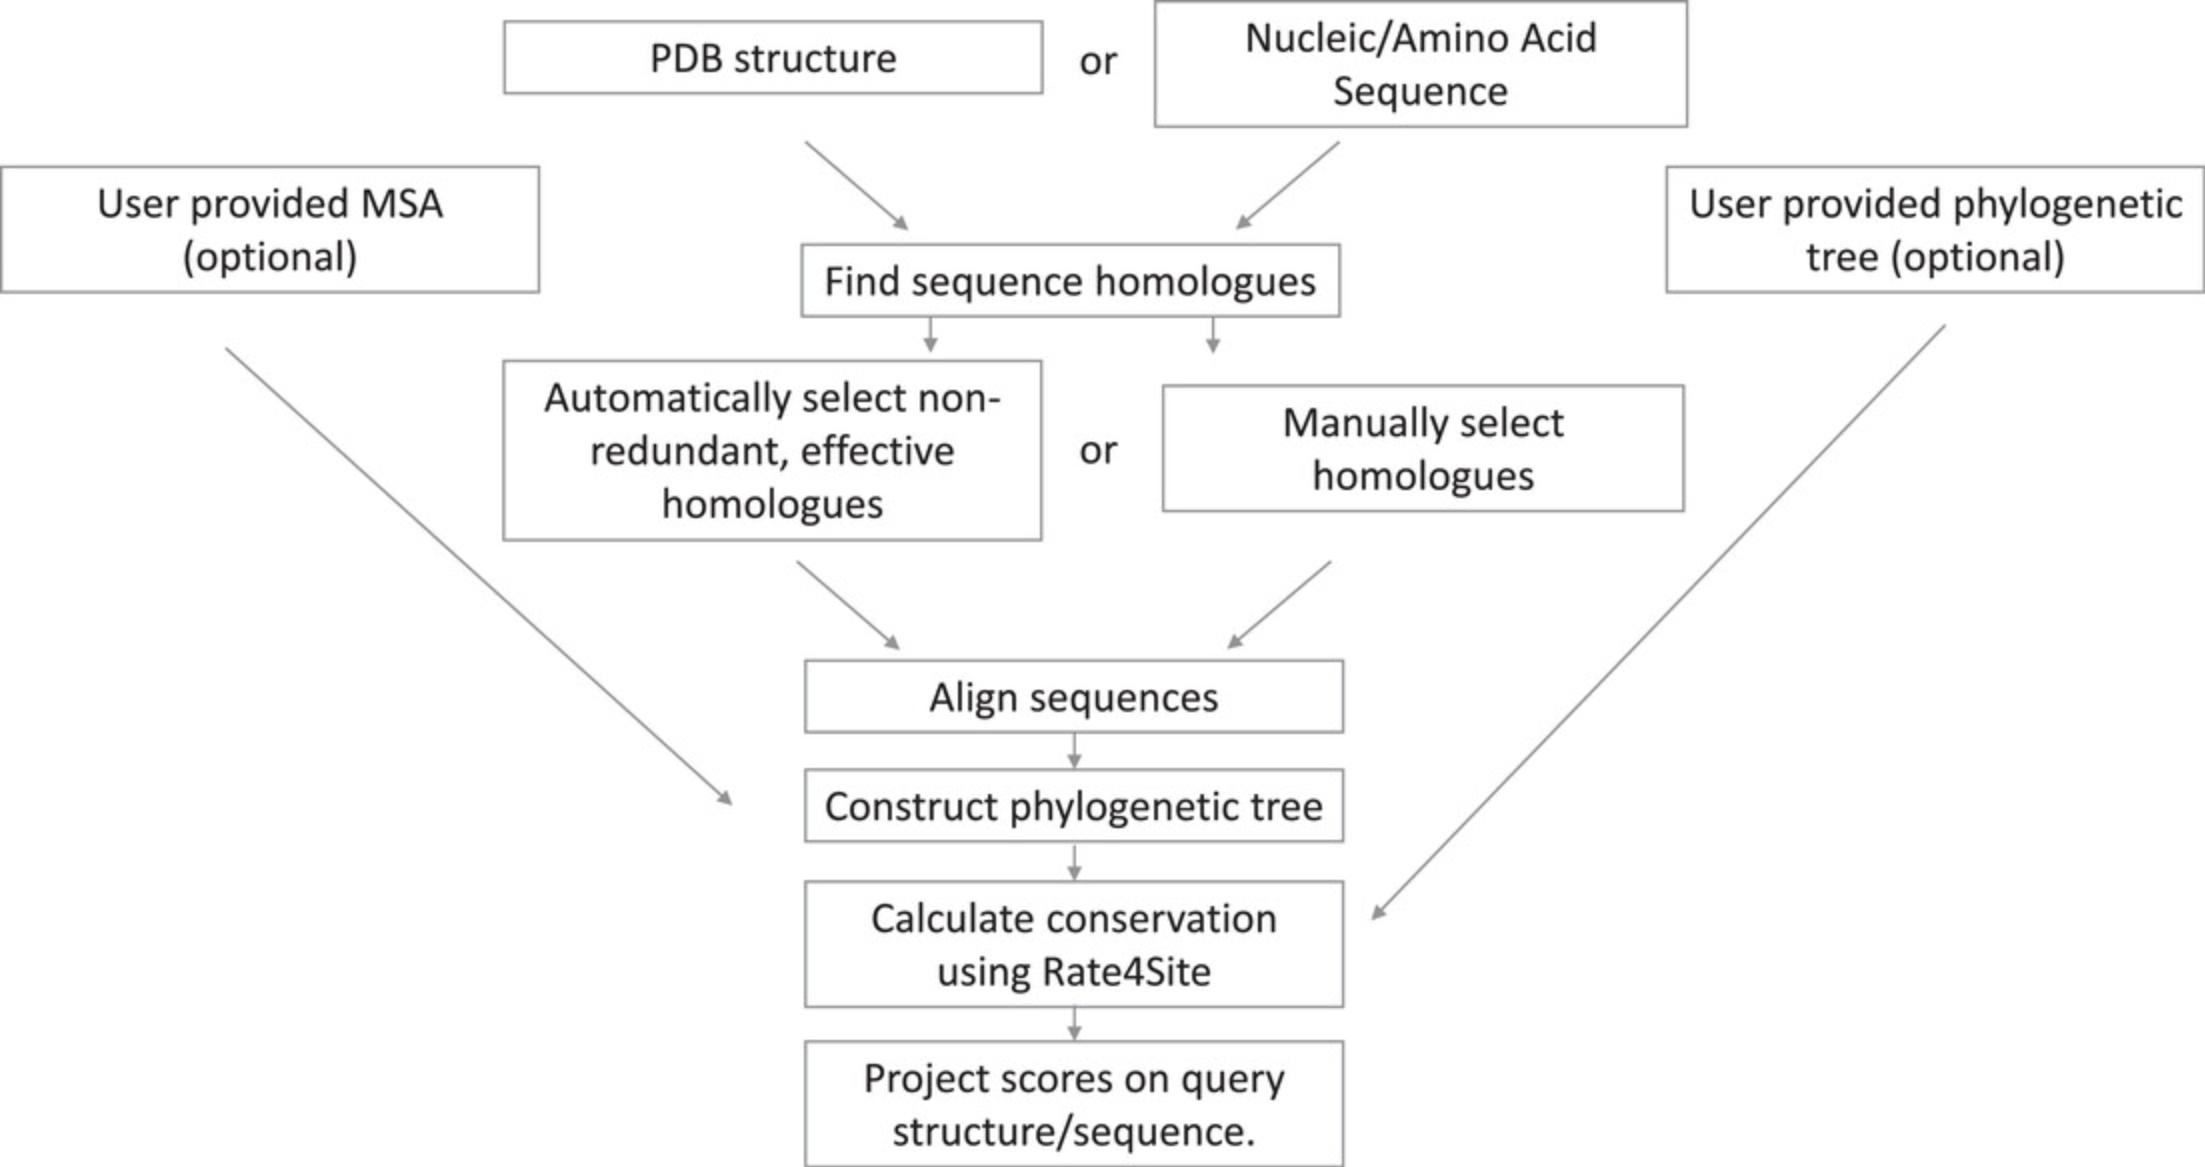
In the sequences of macromolecules, the evolutionary rate per site, be it an amino acid position in a protein sequence or a nucleotide position in an RNA or DNA sequence, reflects a balance between a natural tendency of the position to mutate, i.e., ‘drift’, and natural selection. Rarely, the latter may lead to accelerated evolutionary rate, as for example in the ligand-recognition regions of antibodies and other components of our immune system. However, most often, natural selection limits the evolutionary rates of binding and catalytic sites, as well as of other sites that are biologically important. Thus, a slow evolutionary rate is often a clear mark of functionally important regions in protein, DNA, and RNA molecules (Capra & Singh, 2007; Del Sol, Pazos, & Valencia, 2003; Gallet, Charloteaux, Thomas, & Brasseur, 2000; Huang & Golding, 2014, 2015; Innis, 2007; Landgraf, Xenarios, & Eisenberg, 2001; Lichtarge, Bourne, & Cohen, 1996a, 1996b; Lichtarge, Yamamoto, & Cohen, 1997; Mayrose, Graur, Ben-Tal, & Pupko, 2004; Valdar, 2002). ConSurf provides a reliable and easy-to-use way to exploit this principle (Ashkenazy et al., 2016; Ashkenazy, Erez, Martz, Pupko, & Ben-Tal, 2010; Celniker et al., 2013; Mayrose et al., 2004). Starting from the user-provided sequence or structure of a query protein/RNA/DNA, ConSurf automatically collects a set of effective homologs, aligns their sequences, builds a phylogenetic tree that represents their evolutionary relationships, and estimates the evolutionary rates of the amino acid or nucleotide positions using a statistically robust evolutionary model. An outline of the ConSurf pipeline is shown in Figure 1.
While ConSurf offers a pipeline for analyzing both proteins and RNA/DNA molecules, it is most used in protein analysis and rarely with nucleotides. This is presumably because the nucleic acid analysis pipeline offered by ConSurf is frequently aborted because of failure to detect a large enough set of effective homologs to the query.
Here, we show how to improve the analysis of an RNA query by utilizing state-of-the-art sequence search tools in combination with the ConSurf pipeline. Basic Protocol 1 details an analysis that utilizes the MSA construction of ConSurf itself. This protocol, which often fails, is used mostly as a reference. Basic Protocol 2, the recommended alternative, details an analysis based on an externally constructed MSA. The Support Protocols provide guidance on constructing an MSA for an RNA query to be used with Basic Protocol 2.
Basic Protocol 1: STANDARD ConSurf EVOLUTIONARY CONSERVATION ANALYSIS OF AN RNA QUERY
This protocol provides guidance on using the ConSurf server to analyze the evolutionary conservation profile of an RNA query, given its 3D structure or nucleotide sequence.
Necessary Resources
Hardware
- Computer with Internet connection, under Windows, Mac, or Linux
Software (recommended)
- The PyMOL (Schrödinger, 2021), Chimera (Pettersen et al., 2004), or RasMol (Sayle & Milner-White, 1995) molecular visualizer
1.Upload RNA query.

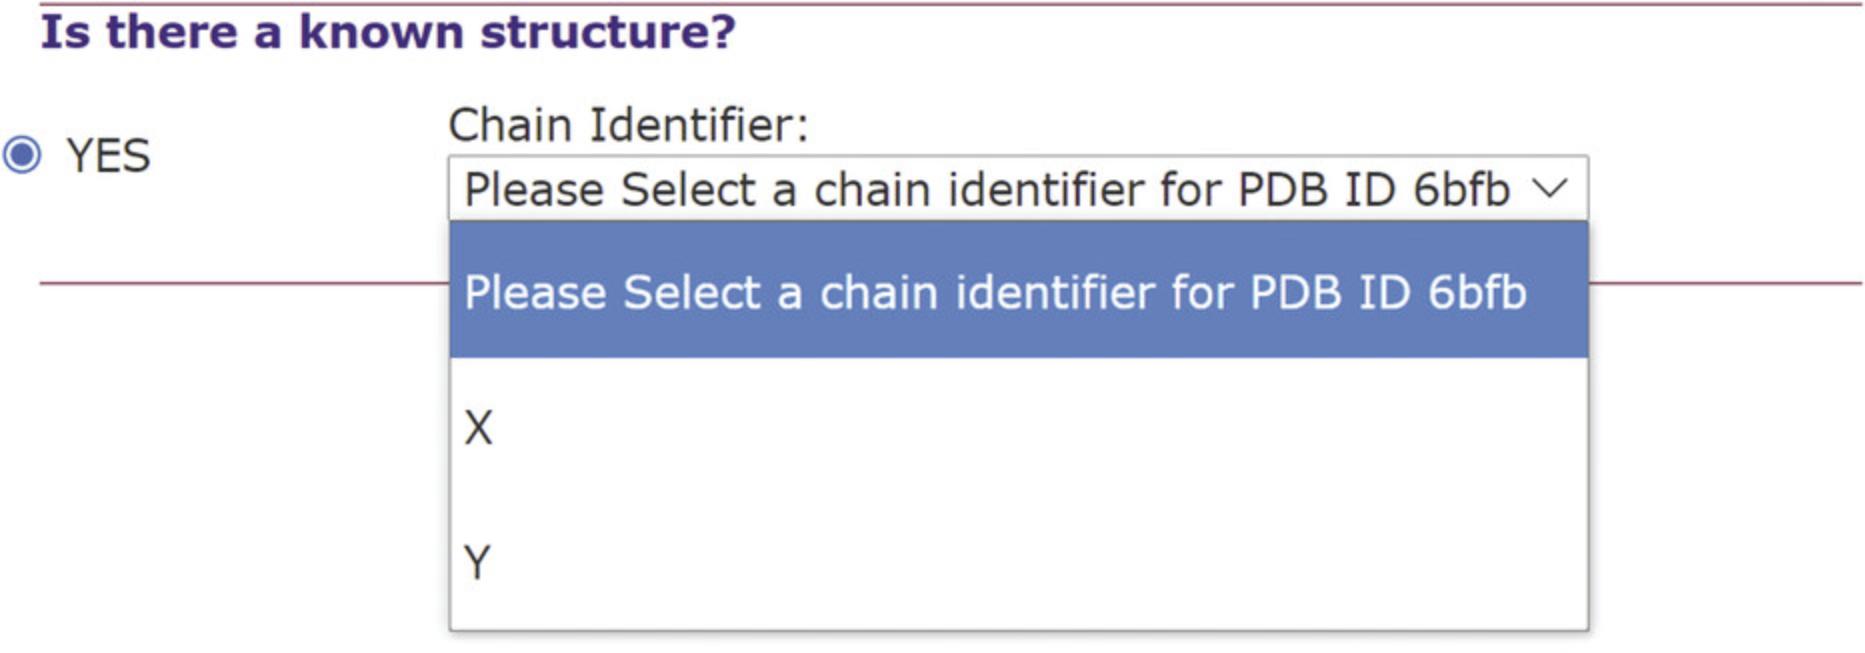
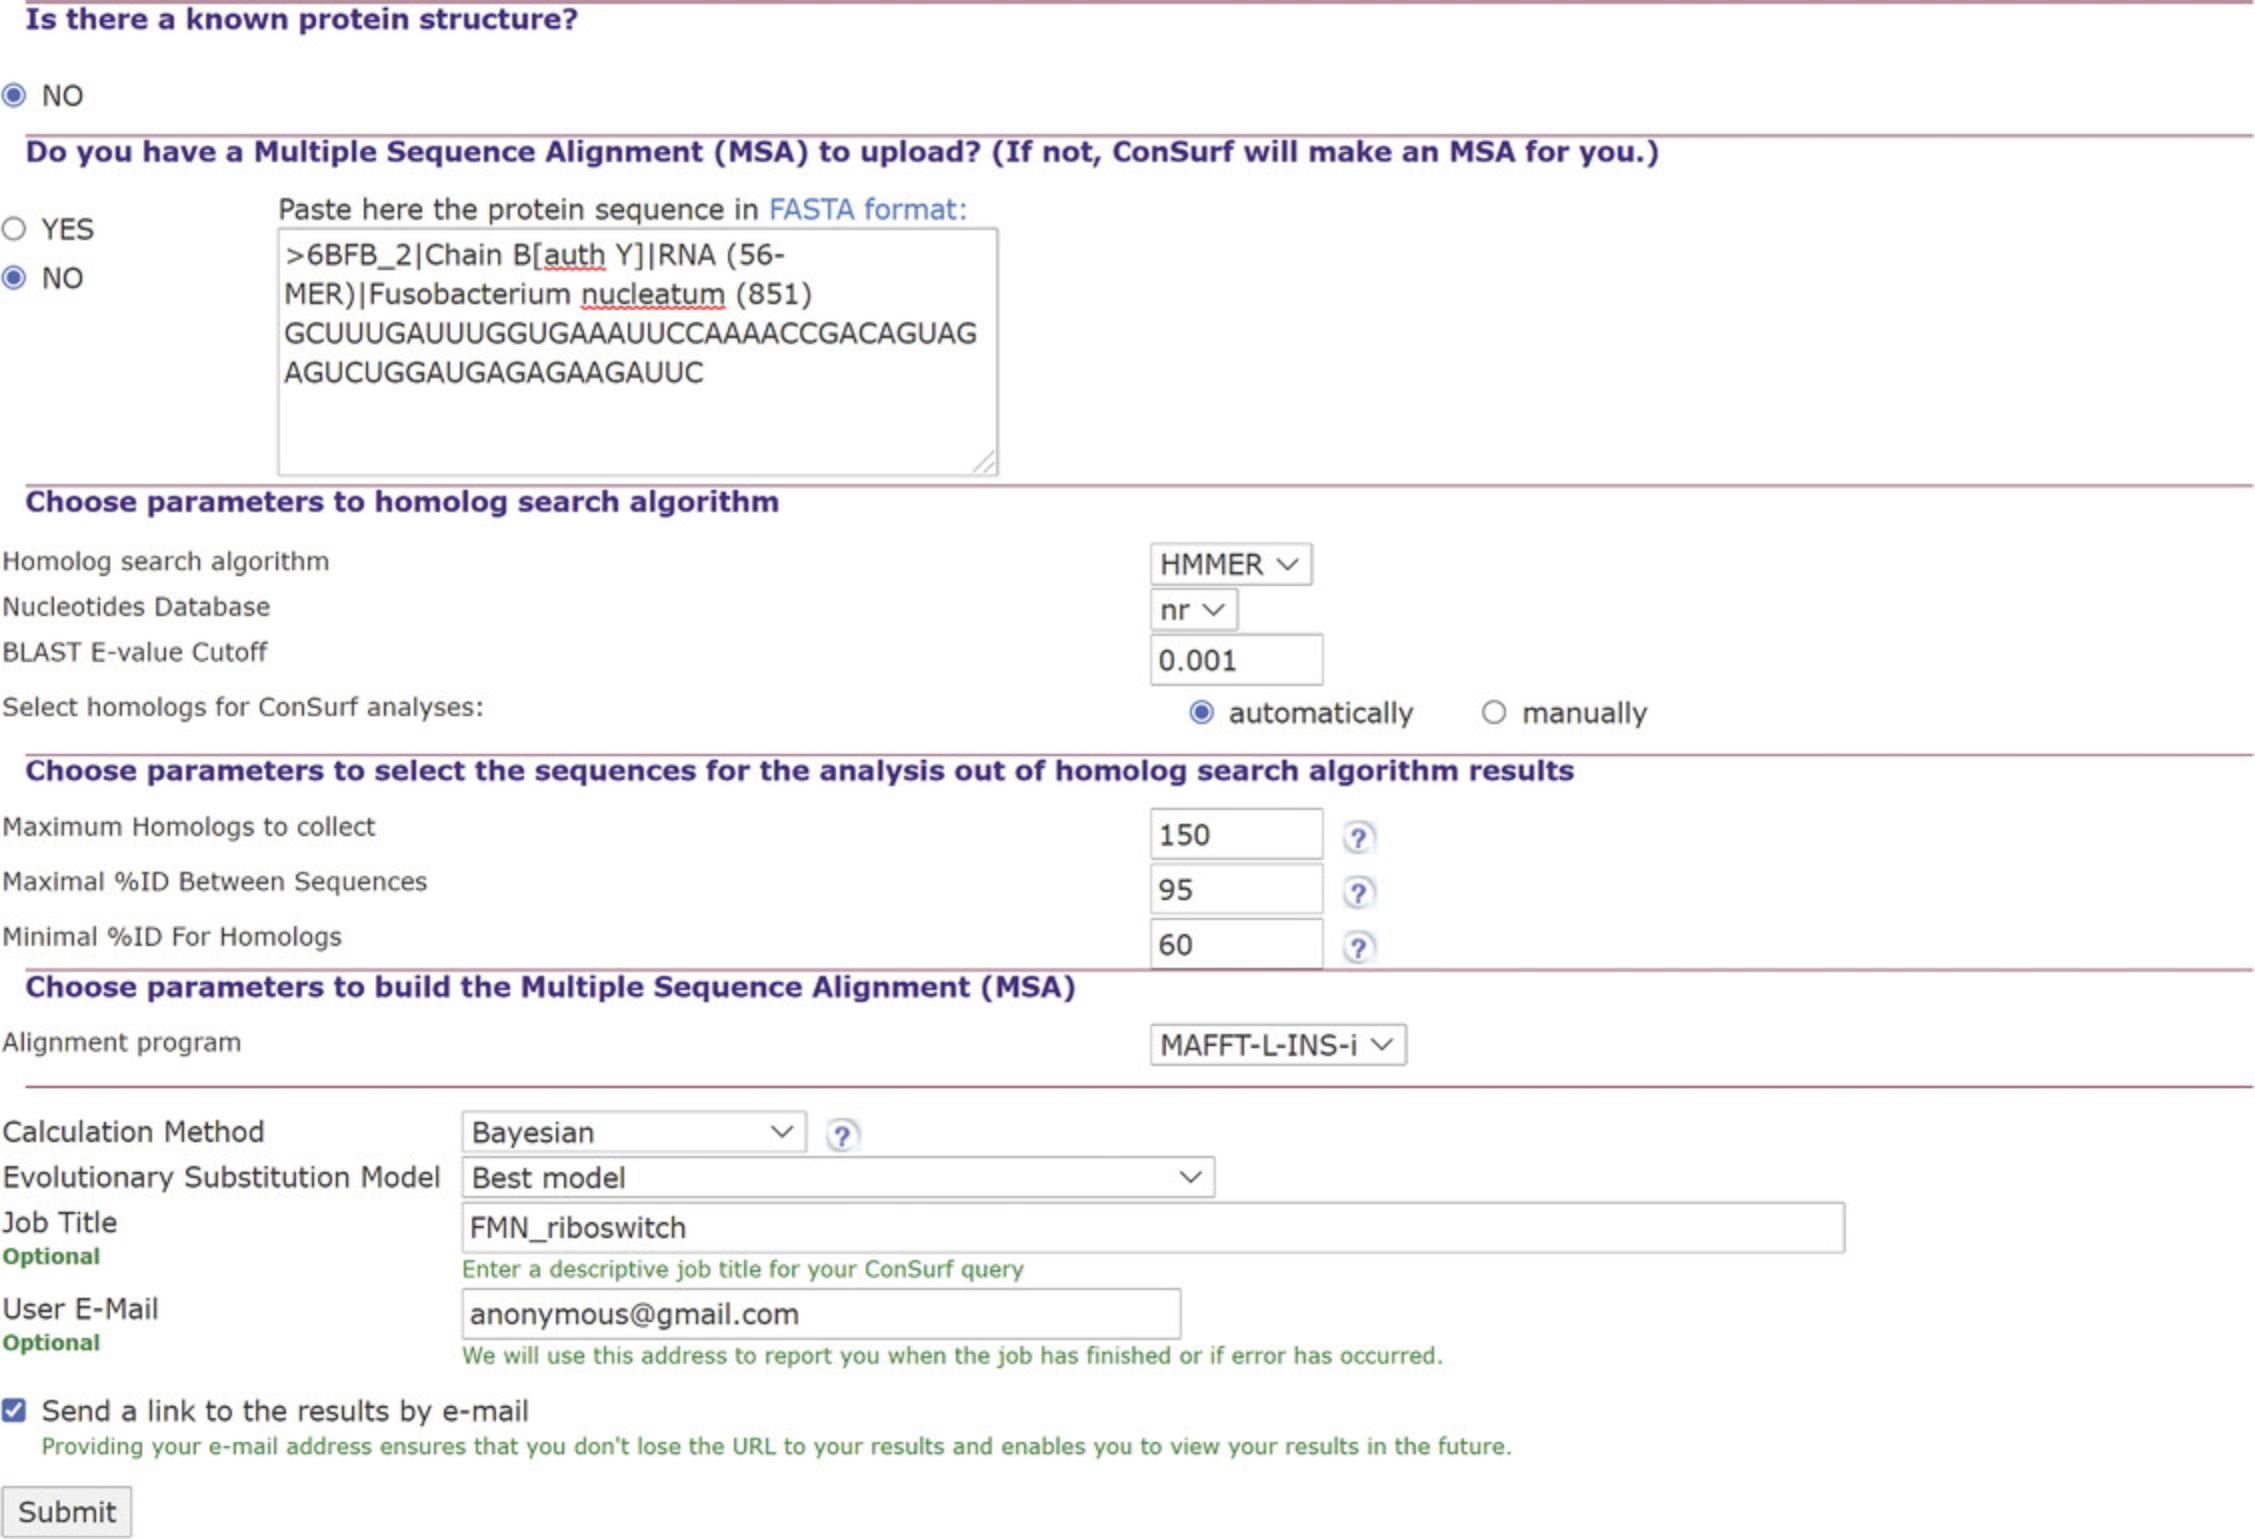
2.Select setting for the construction of a multiple sequence alignment (MSA). See Figure 5.
The server will ask if you wish to upload an MSA. Select NO, at which point ConSurf will allow you to select the homology search method and nucleotide database, as well as other parameters for generating an MSA:
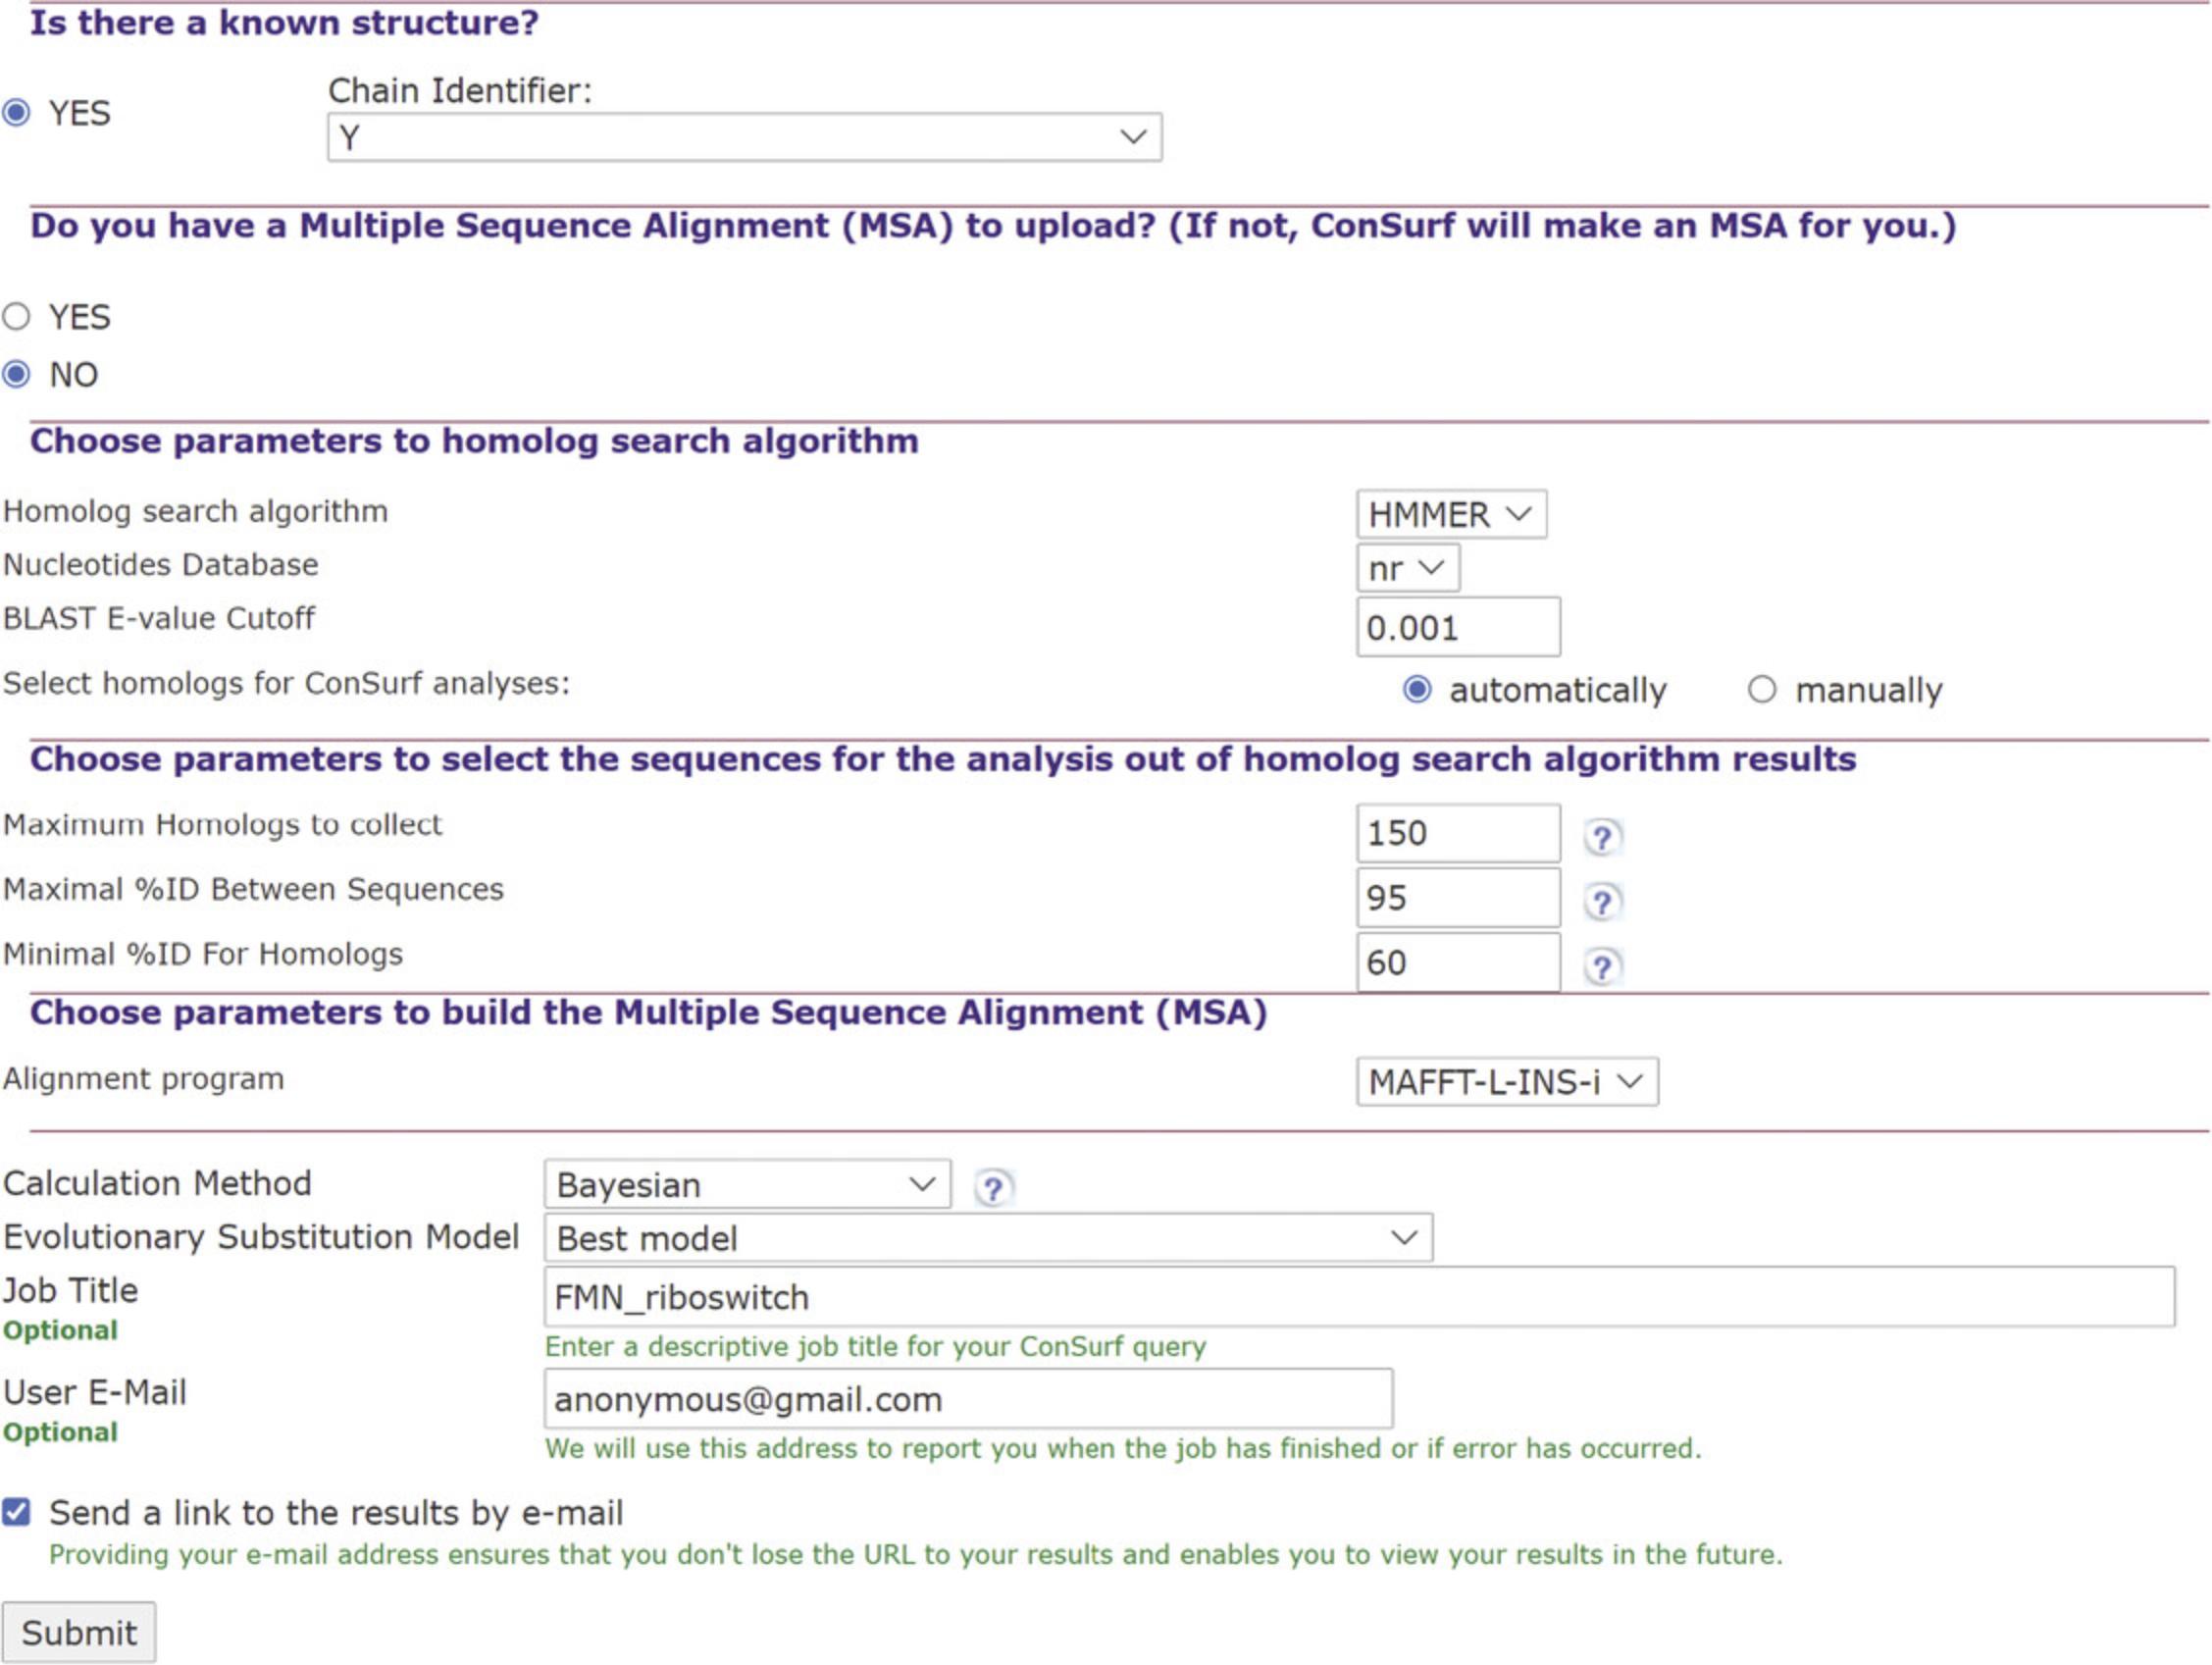
1.“automatically”: The user is asked to indicate the maximum number of homologs (150 is the default; selecting more than 300 would significantly slow the calculation), as well as the maximum and minimum sequence ID percentages (95 and 60 by default). In ConSurf, the hits (coming from the nBLAST or nHMMER search) are sorted by their E-values in an ascending order, based on the principle that the lower the E-value, the more likely the hit is to be a true homolog. When selecting “automatically,” a predetermined number of hits are sampled evenly from the sorted list to create the final list of homologs of the query protein. The user is also asked to choose between three methods for multiply align the selected homologs: MAFFT-L-INS-i (default), PRANK, or CLUSTALW.
3.Selecting analysis methods (Fig. 5)
4.Run job entry (Fig. 5).
Basic Protocol 2: ConSurf EVOLUTIONARY CONSERVATION ANALYSIS OF AN RNA QUERY WITH EXTERNAL MSA
This protocol will provide guidance to using the ConSurf server to analyze the evolutionary conservation profile of an RNA query, given its 3D structure or nucleotide sequence, using an externally provided MSA. Two Support Protocols for constructing MSA for the query are provided further below.
Necessary Resources
Hardware
- Computer with Internet connection, under Windows, Mac, or Linux.
Software (recommended)
- The PyMOL, Chimera or RasMol molecular visualizers
1.Upload RNA query.
2.Upload a multiple sequence alignment (MSA).
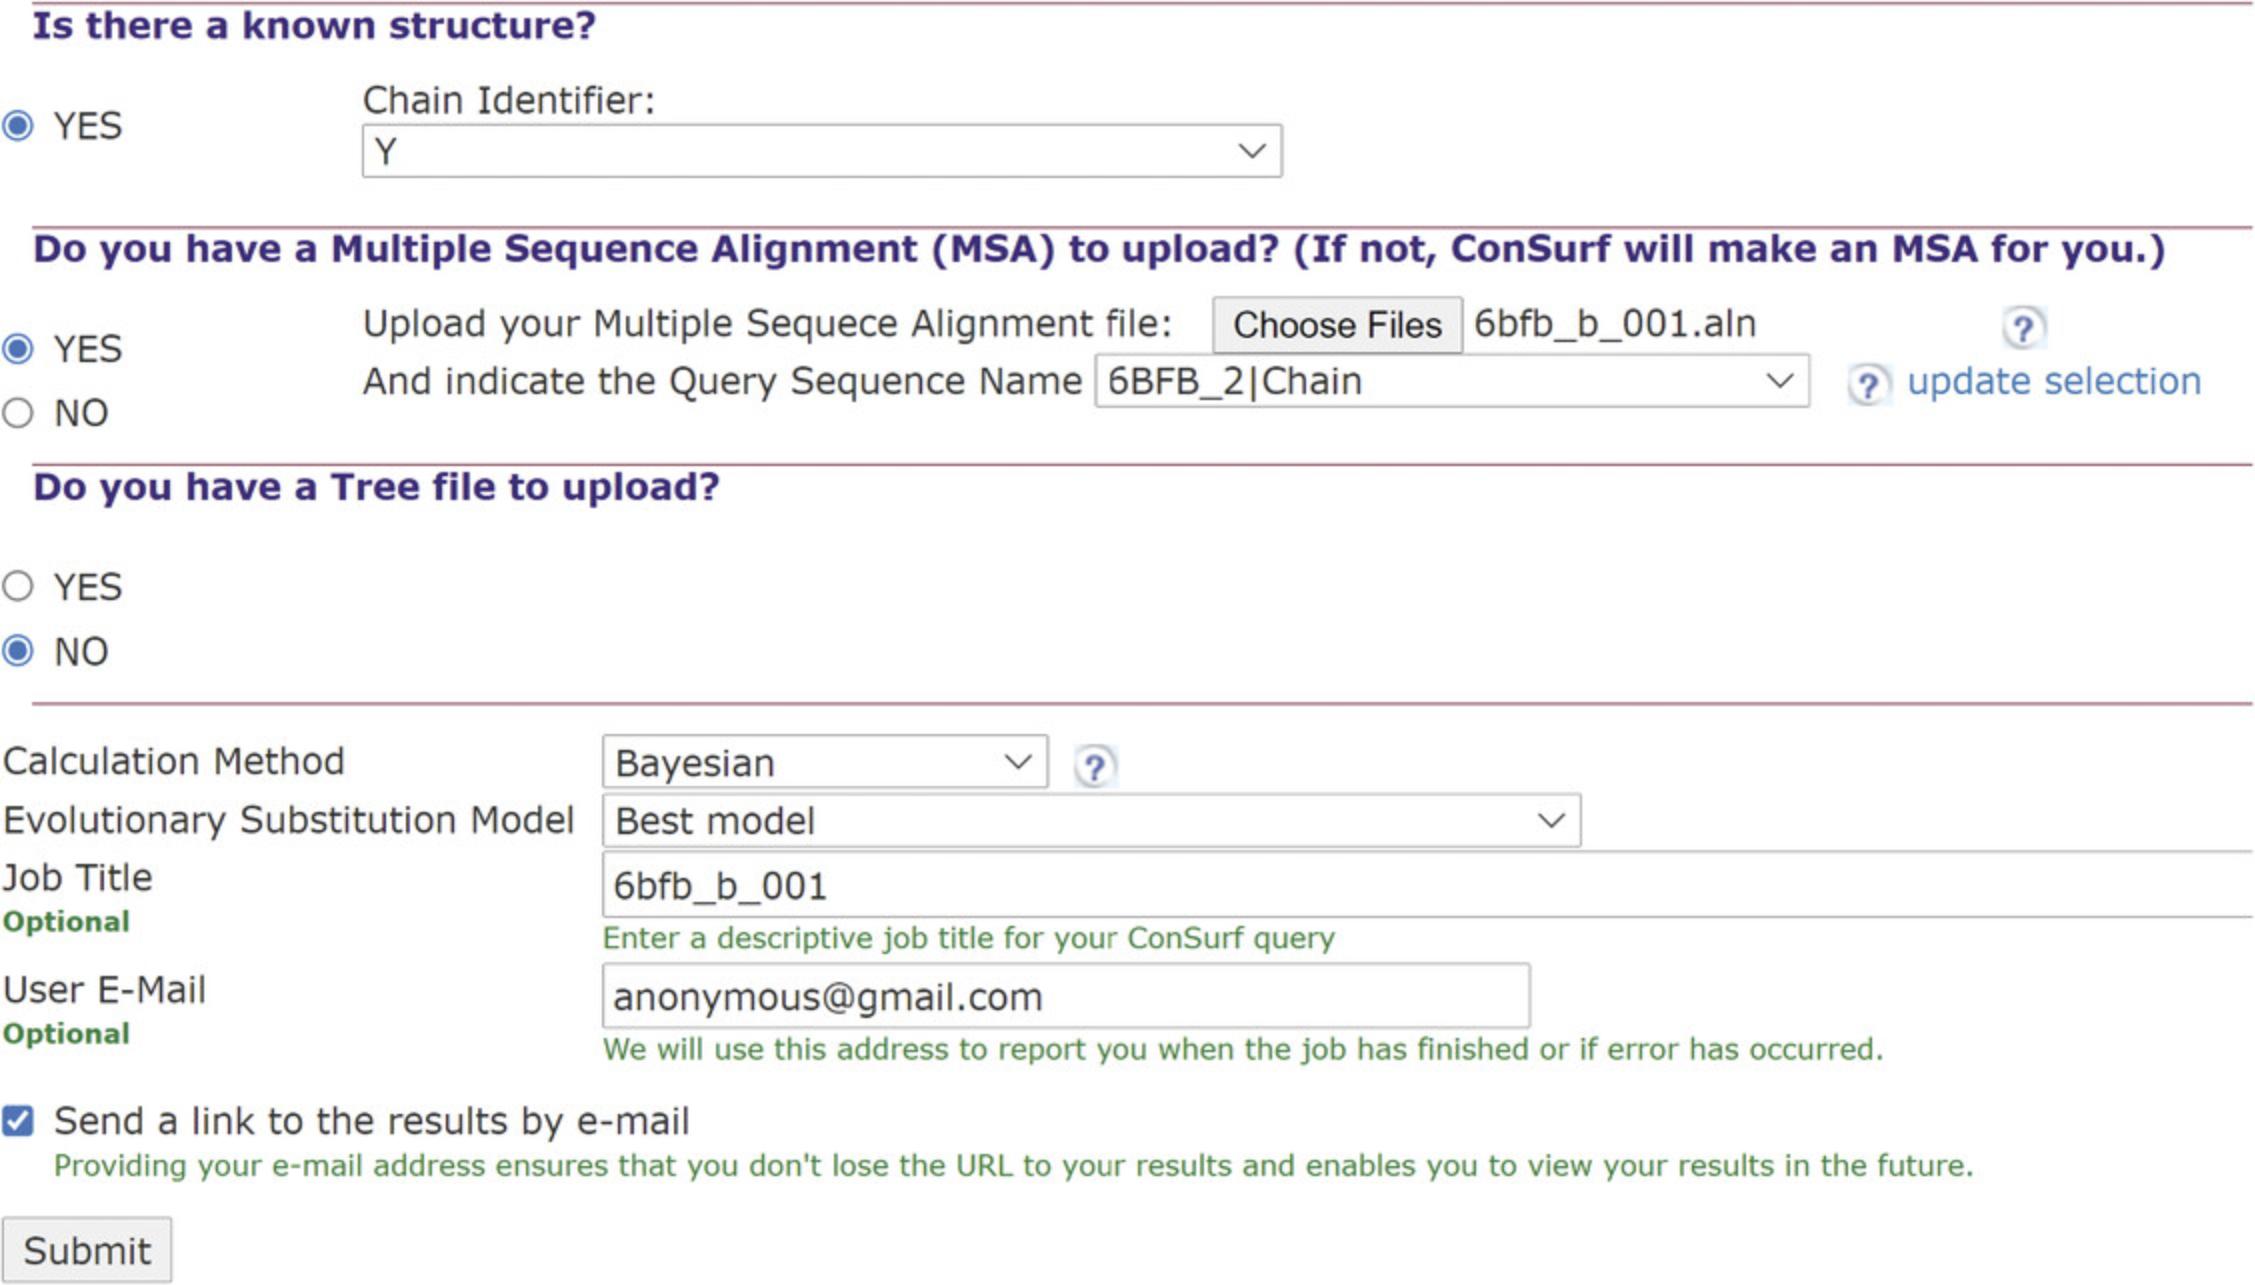
3.Tree upload and analysis methods.
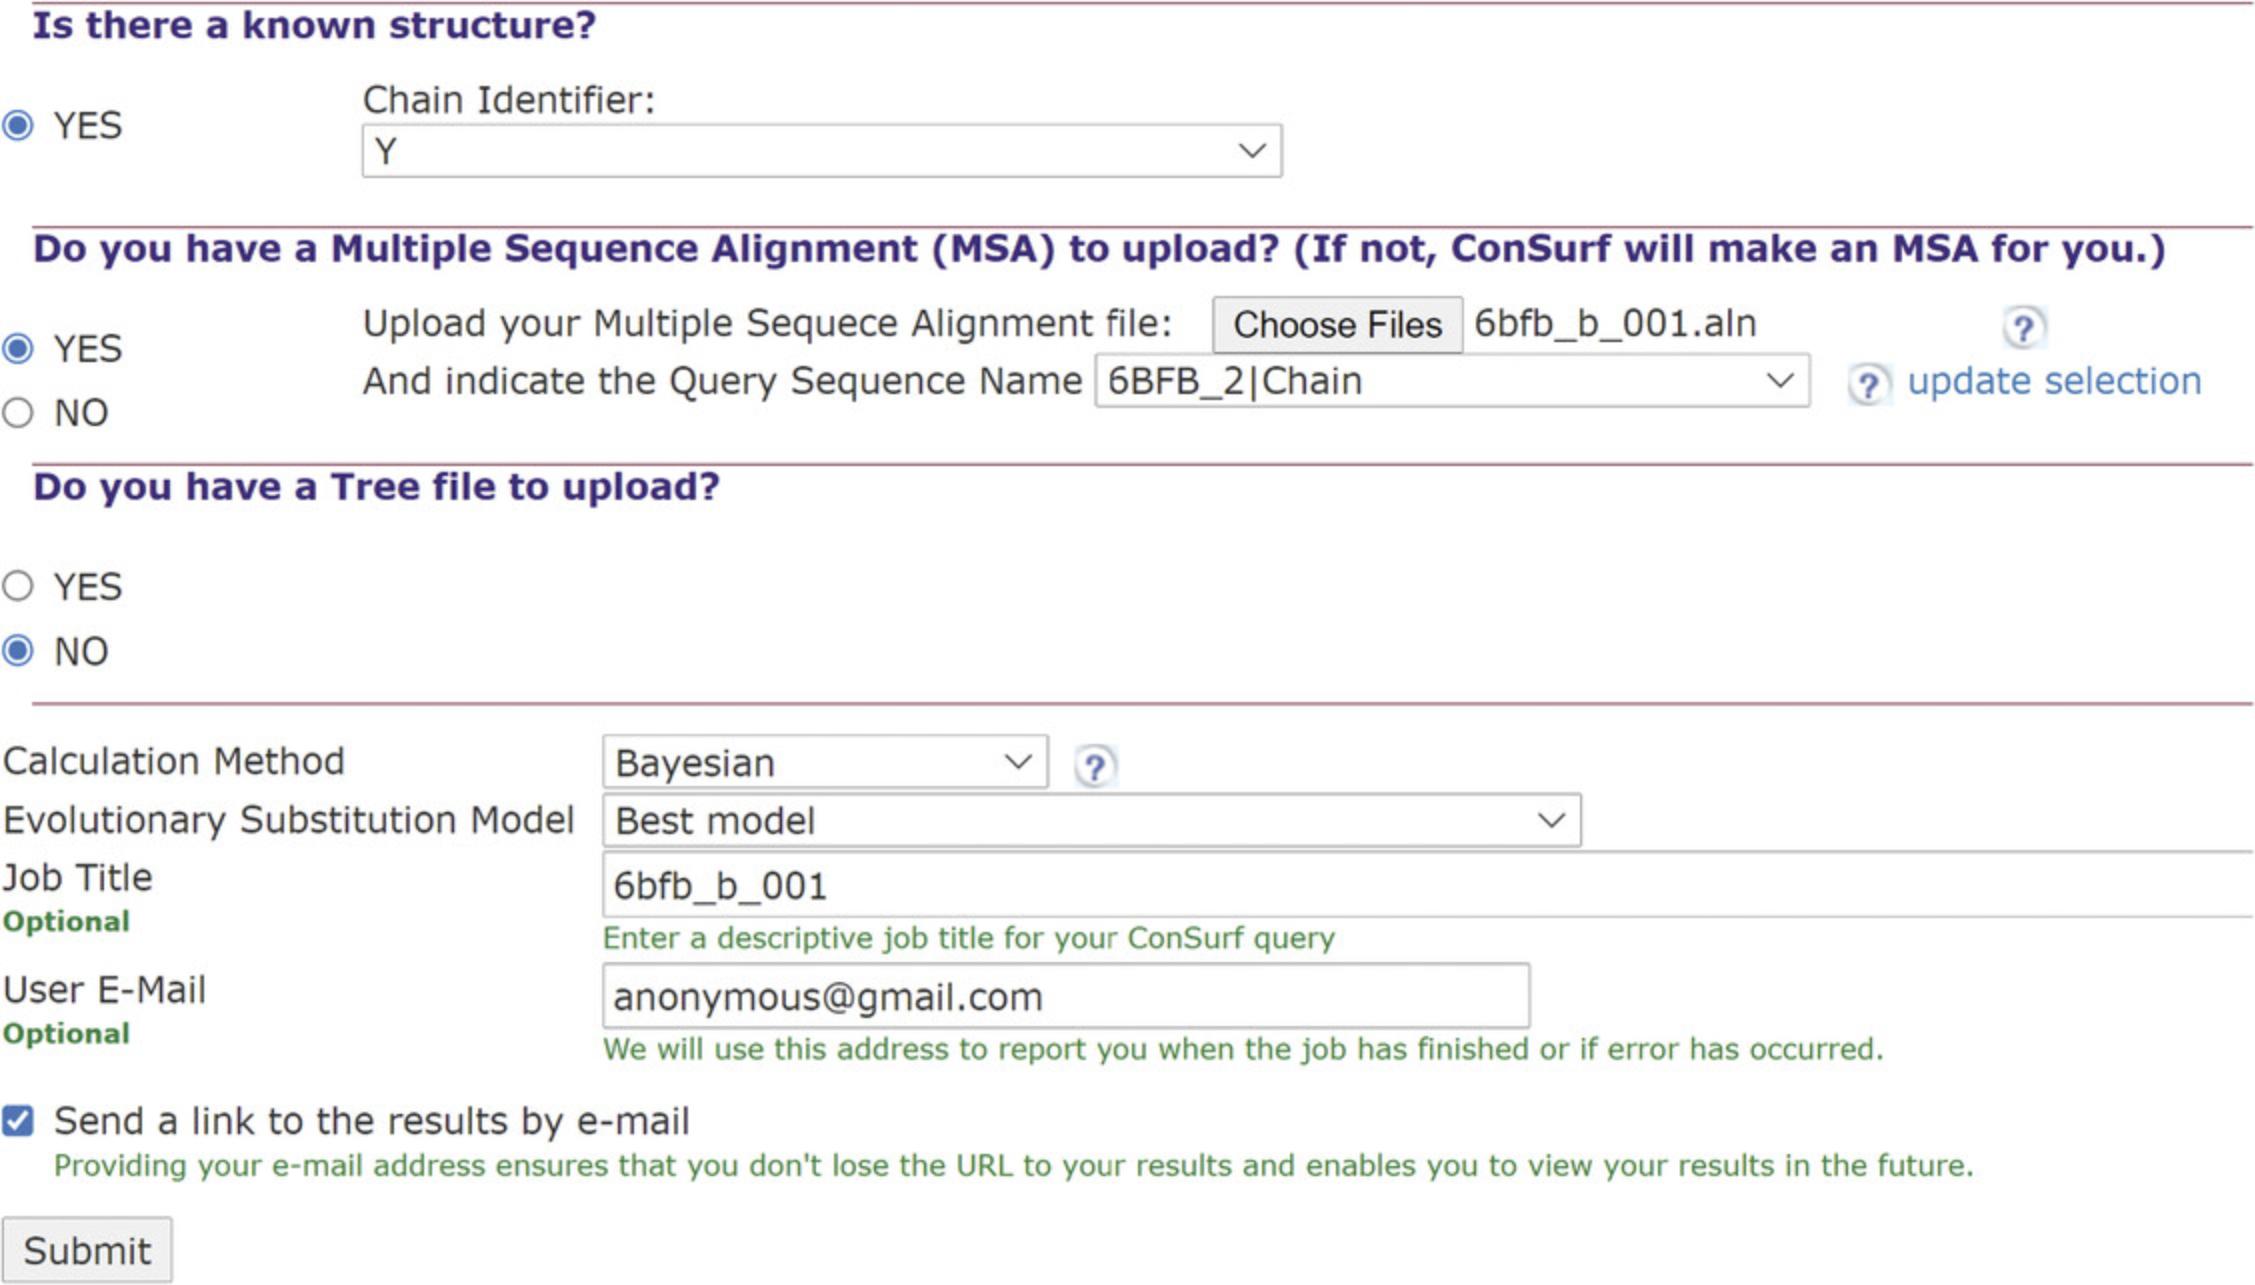
4.Run job entry.
Support Protocol 1: CONSTRUCTION OF AN MSA FOR AN RNA QUERY USING OTHER ONLINE SERVERS
Starting from a nucleotide query, ConSurf currently provides only searches in the NCBI NT database (marked as nr for non-redundant; NCBI Resource Coordinators, 2018). Unfortunately, this limited search often does not yield a large enough set of effective homologs. To overcome this obstacle, it is recommended to provide an external MSA for your RNA query. The following is a description of a protocol to construct a ConSurf-compatible MSA.
Necessary Resources
Hardware
- Computer with Internet connection, under Windows, Mac, or Linux
Software
- Notepad++ or any other similar text editor
1.Enter RNACentral (https://rnacentral.org/), select the “Sequence search” option, enter your RNA query sequence into the search box, and hit the Search button (Fig. 8).
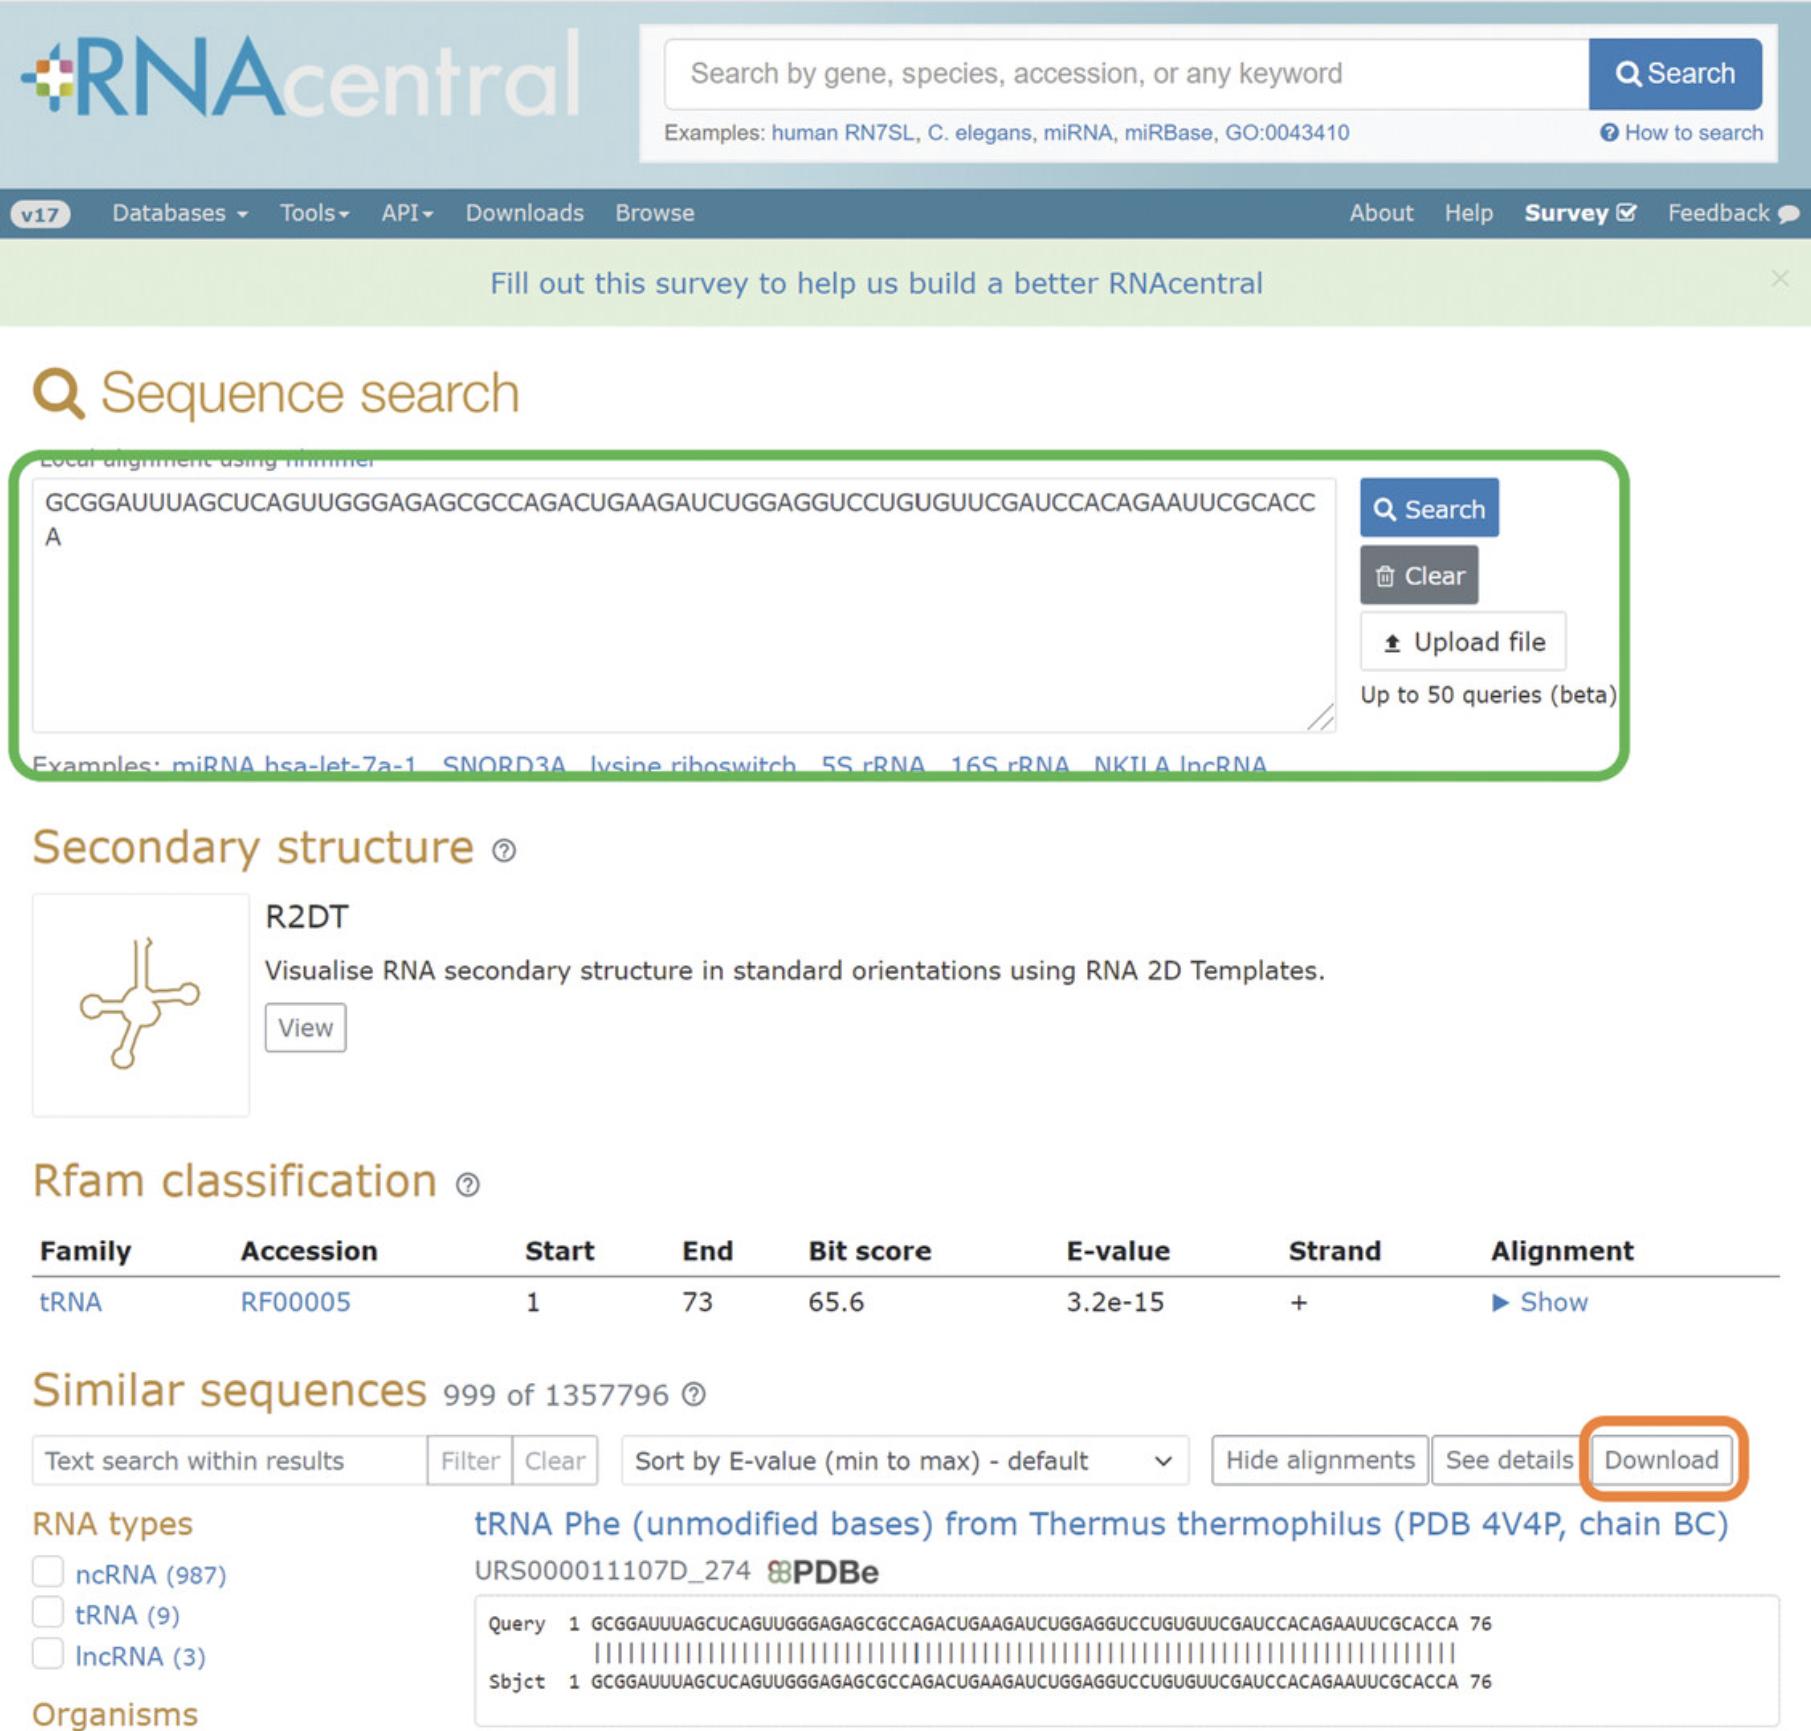
2.Download the results from RNACentral by pressing the “Download” button at the top of the search results.
3.Adjust the sequences for compatibility with ConSurf.
4.Cluster the sequences using cd-hit-est (http://weizhong-lab.ucsd.edu/cdhit-web-server/cgi-bin/index.cgi?cmd=cd-hit-est); see Fig. 9.
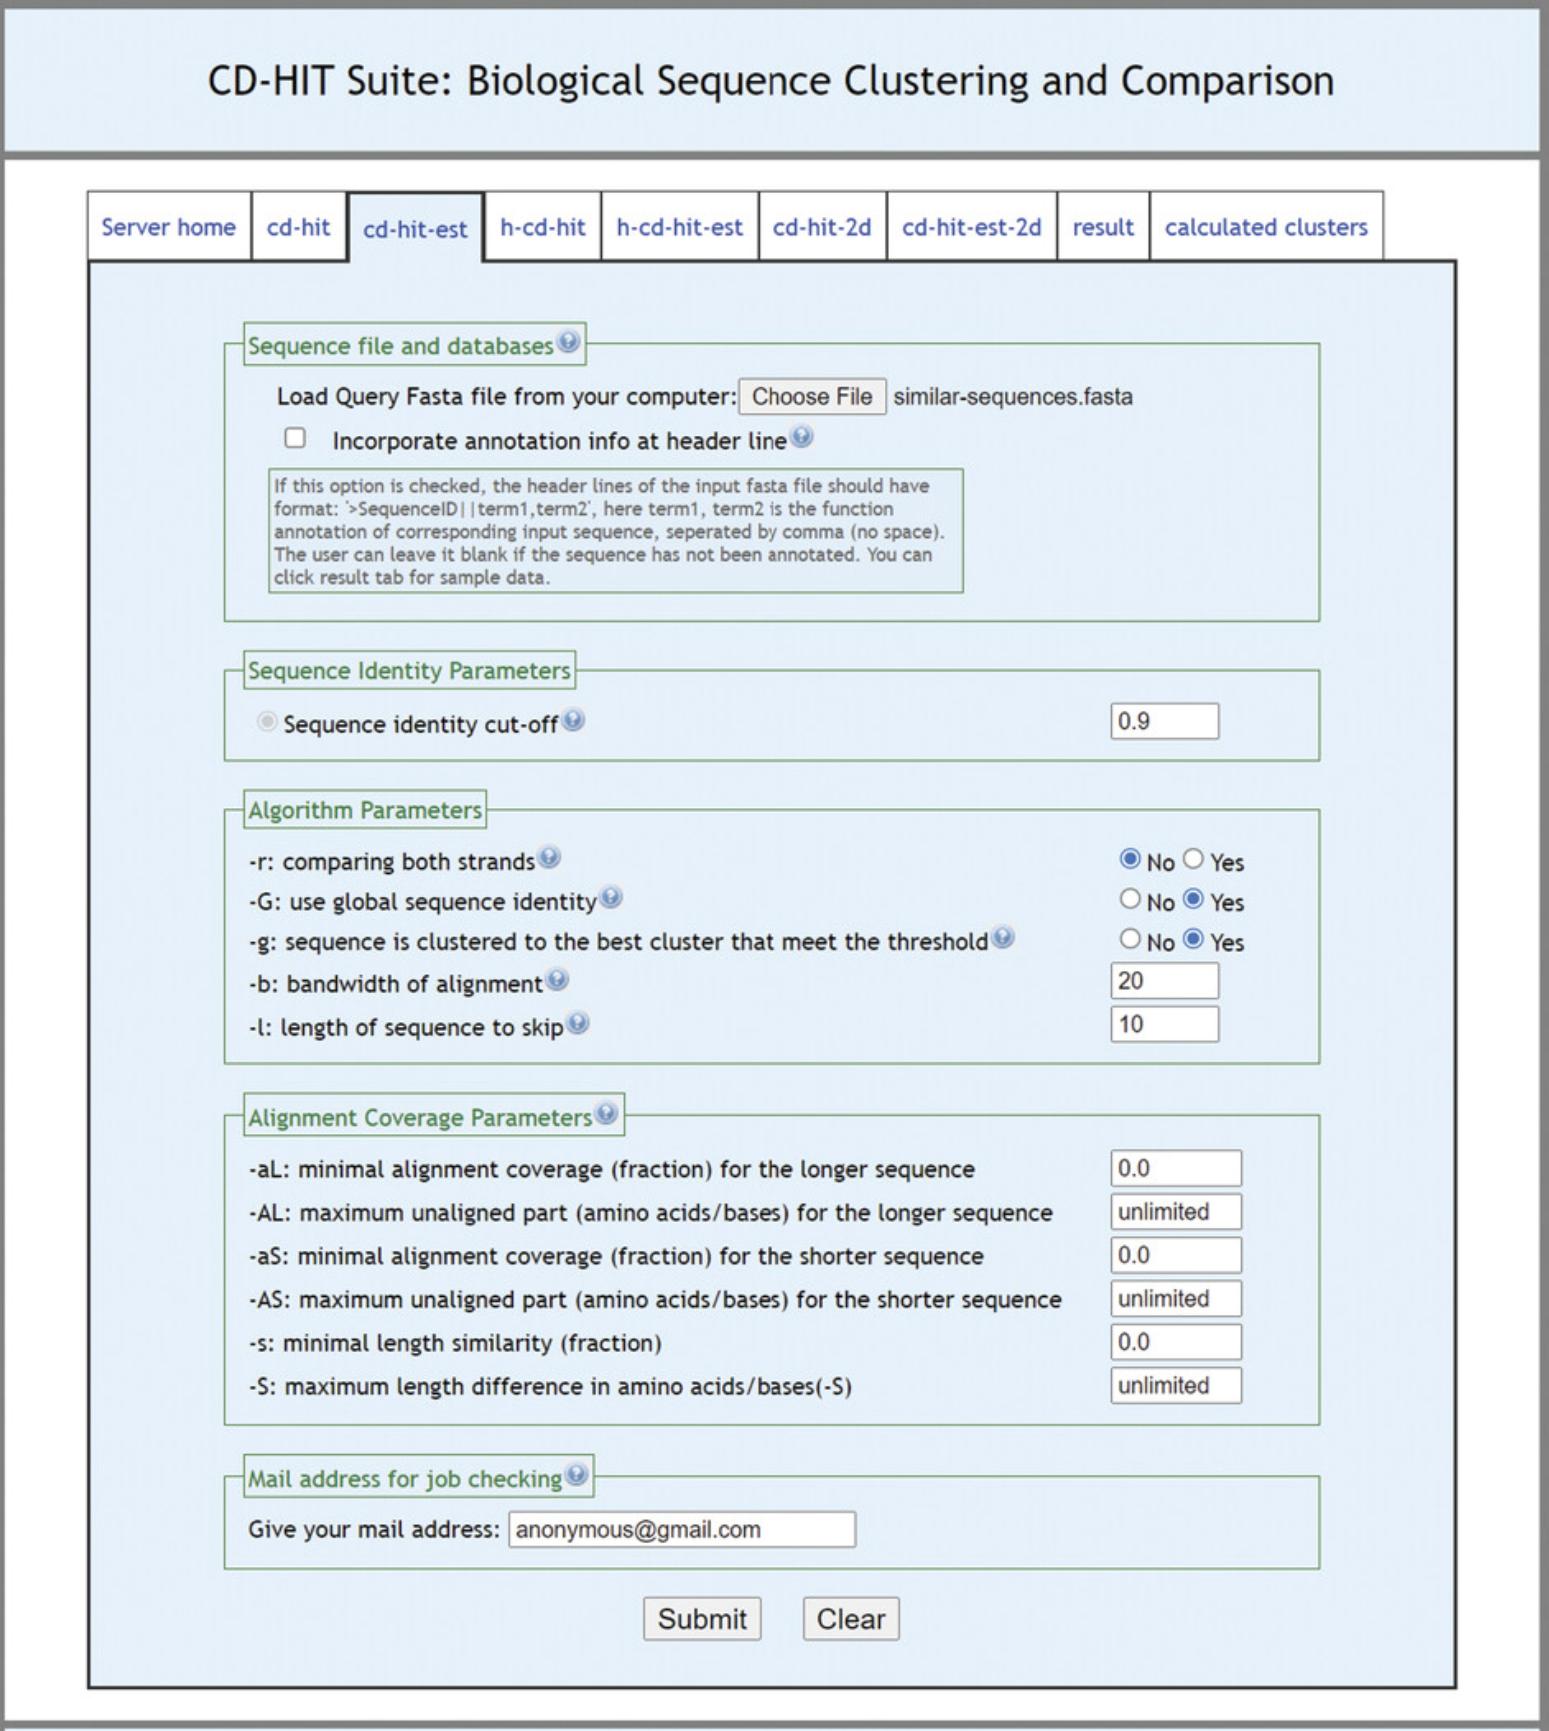
5.Check the resulting representative sequences for your query.
6.Align the sequence dataset using MAFFT (https://mafft.cbrc.jp/alignment/server/).
7.Download MSA in Clustal format.
Support Protocol 2: CONSTRUCTION OF AN MSA FOR AN RNA QUERY USING nHMMER LOCALLY
The RNACentral search engine for detecting RNA homologs follows a single rigid pipeline. Alternatively, for more flexible and comprehensive homology search it is possible to install and use nHMMER locally. This advanced option is meant for experts.
Necessary Resources
Hardware
- Computer with Internet connection, under Windows, Mac, or Linux
Software
- HMMER, can be downloaded from the HMMER site (http://hmmer.org/) and run on a Linux-based platform
- Notepad++, or any other similar text editor
Files
- RNA database in FASTA format downloaded from RNAcentral (http://ftp.ebi.ac.uk/pub/databases/RNAcentral/current_release/sequences/rnacentral_active.fasta.gz)
- A file of the query sequence in FASTA format
1.HMMER installation.
2.Search for homologs using nHMMER locally.
- nhmmer --rna -E
--incE <x’> -A queryfile seqdb - --rna asserts that the sequences are RNA.
- -E
Target sequences with an E-value of <= will be reported; the default is 10.0. - --incE <x’> Use an E-value of <= <x’> as the inclusion threshold, the default being 0.01.
- -A
Save a multiple alignment of all hits that satisfy the inclusion thresholds to the file . - Queryfile is the file with the query sequence, including the path if needed.
- Seqdb is the database of sequences from RNACentral, including the path if needed.
3.Convert the alignment file from Stockholm to FASTA format.
- esl-reformat -o
fasta seqfile - -o
saves the output to file . - Seqfile is the aligned output file from the previous step.
4.Adjust the sequences for compatibility with ConSurf.
5.Cluster the sequences using cd-hit-est (http://weizhong-lab.ucsd.edu/cdhit-web-server/cgi-bin/index.cgi?cmd=h-cd-hit; see Fig. 9).
6.Check the resulting representative sequences for your query.
7.Align the sequence dataset using MAFFT (https://mafft.cbrc.jp/alignment/server/).
8.Download MSA in Clustal format.
GUIDELINES FOR UNDERSTANDING RESULTS
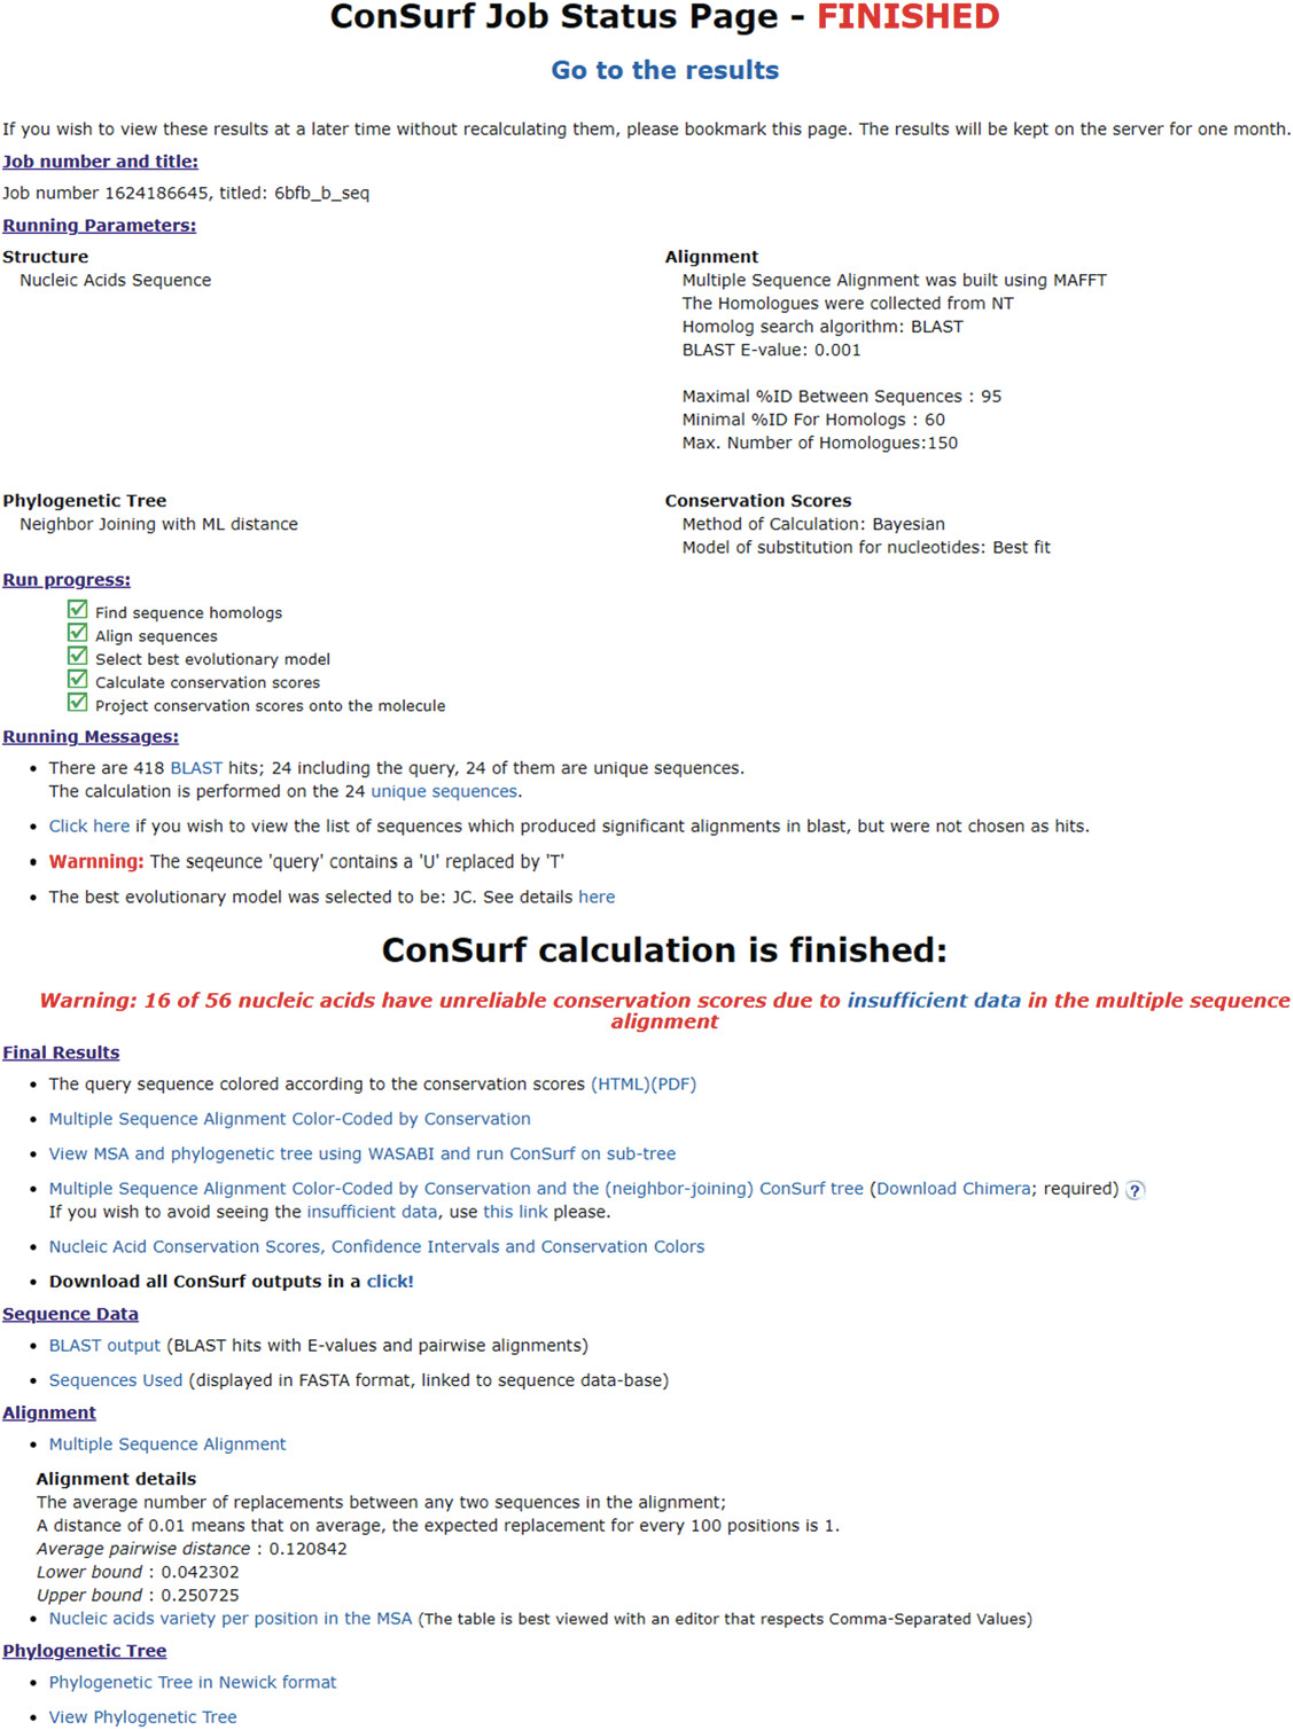
The results page of your ConSurf run will indicate the current stage of the analysis. Once complete, the job status at the top of the page will indicate in red “FINISHED” if the run completed successfully (Fig. 10), or “FAILED” if it did not (Fig. 11).
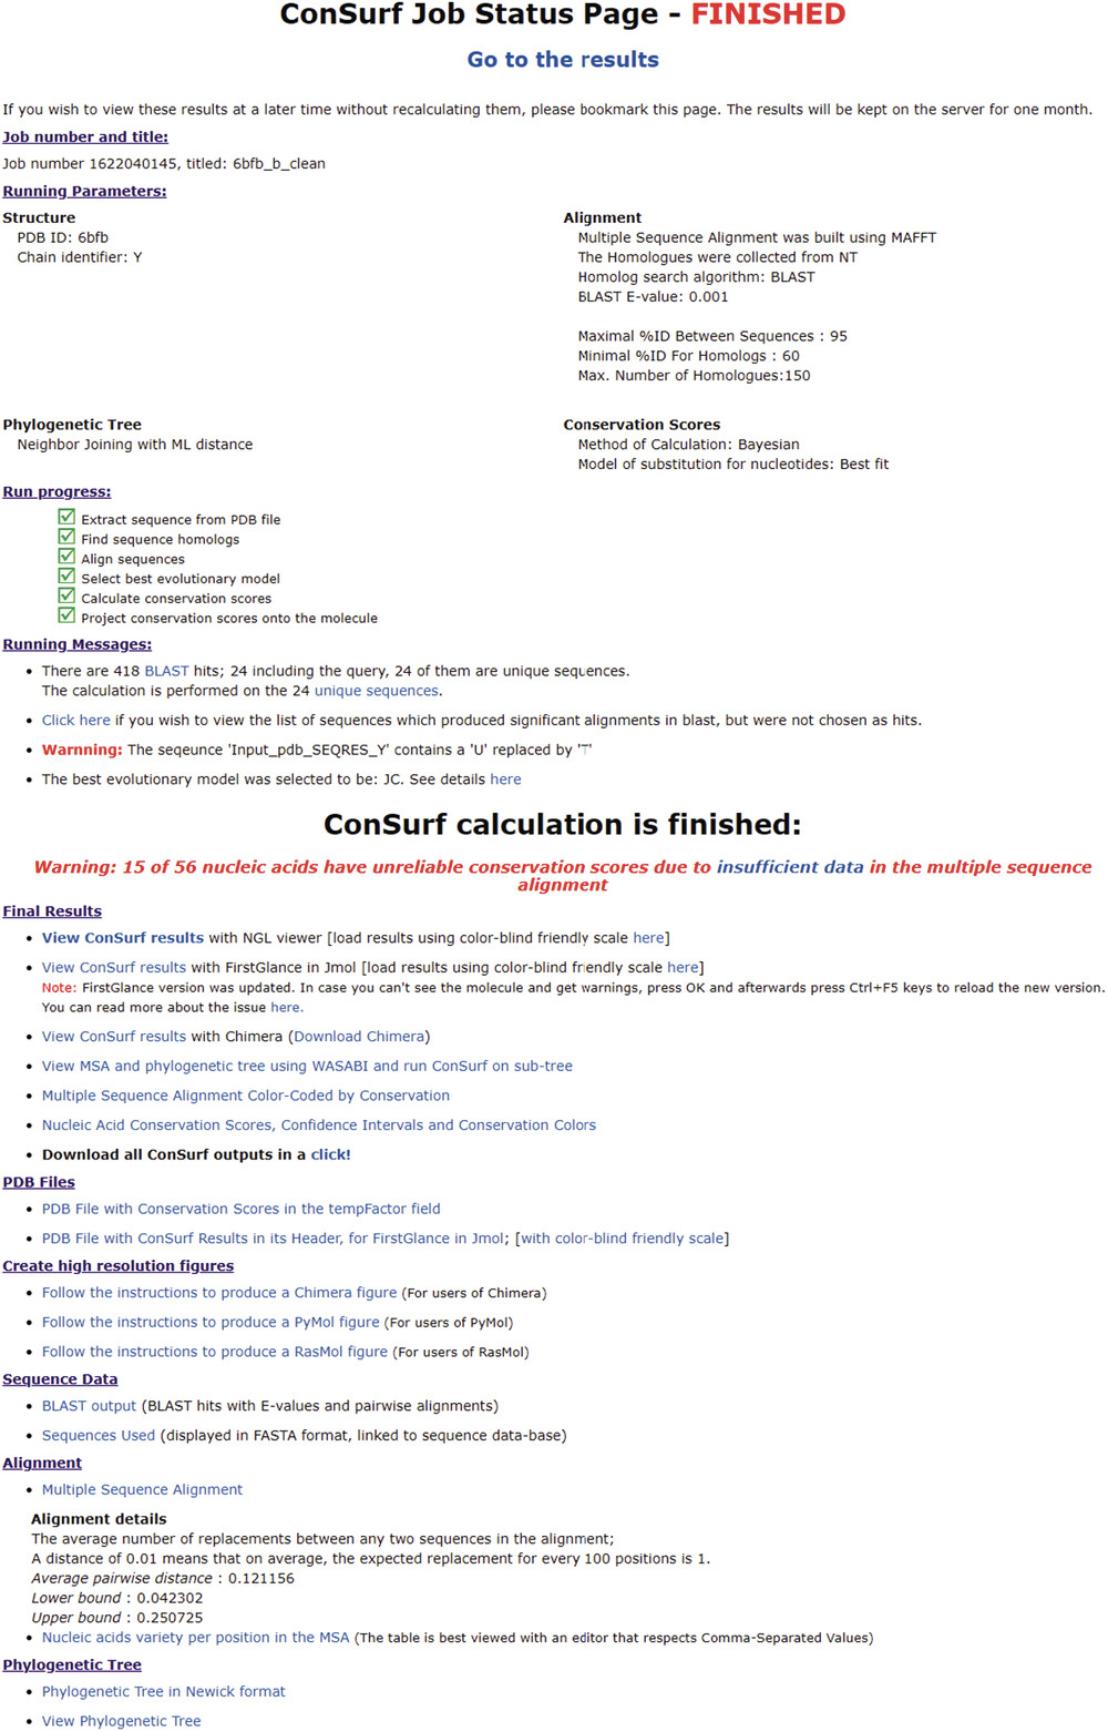
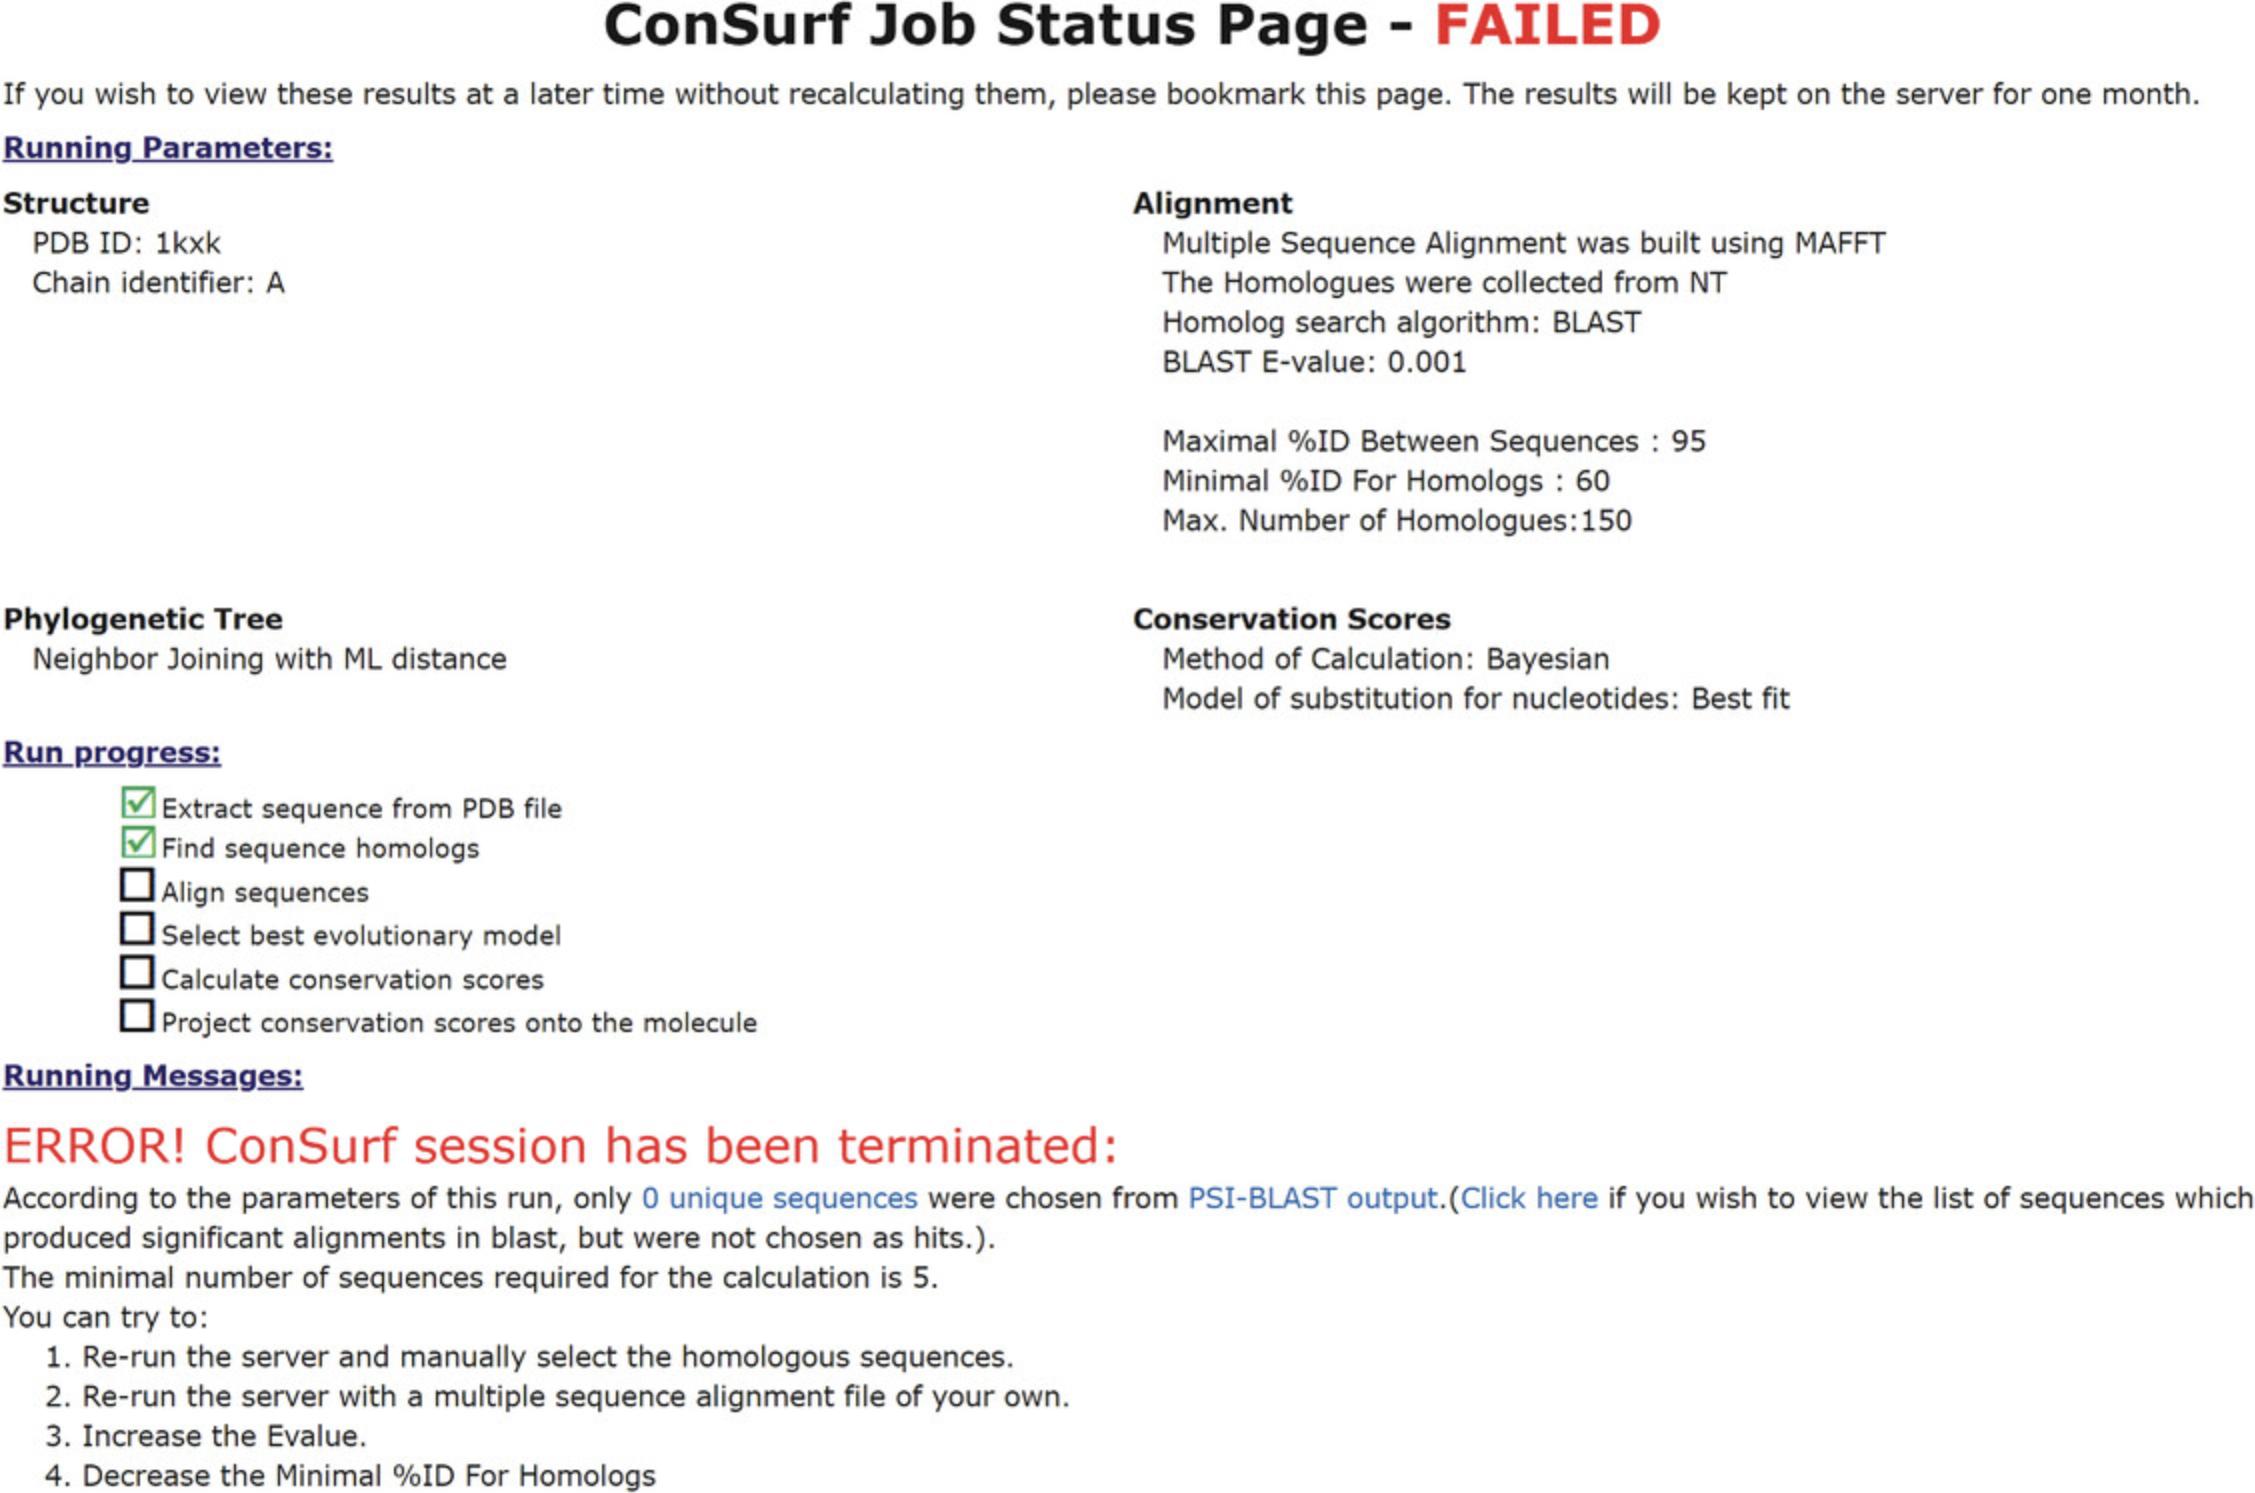
The parameters of the run will be detailed bellow the Job status, followed by a “Run progress” checklist and “Running massages.” In the case of a failed run, an error massage explaining the issue will be included.
For successful runs, the results page will include a secondary title, “ConSurf calculation is finished:” below the run details. Underneath it there may be a warning indicating the number of nucleic acid positions with insufficient data to reliably assign their conservation scores. If this number is too high, it is recommended to improve the search for homologs. The rest of the results will follow, and may vary slightly, depending on the input. A ConSurf analysis with a query structure will include the following in the results page (Fig. 10):
1.Final results
- The conservation profile can be viewed on the structure by selecting one of the “View ConSurf results” options.
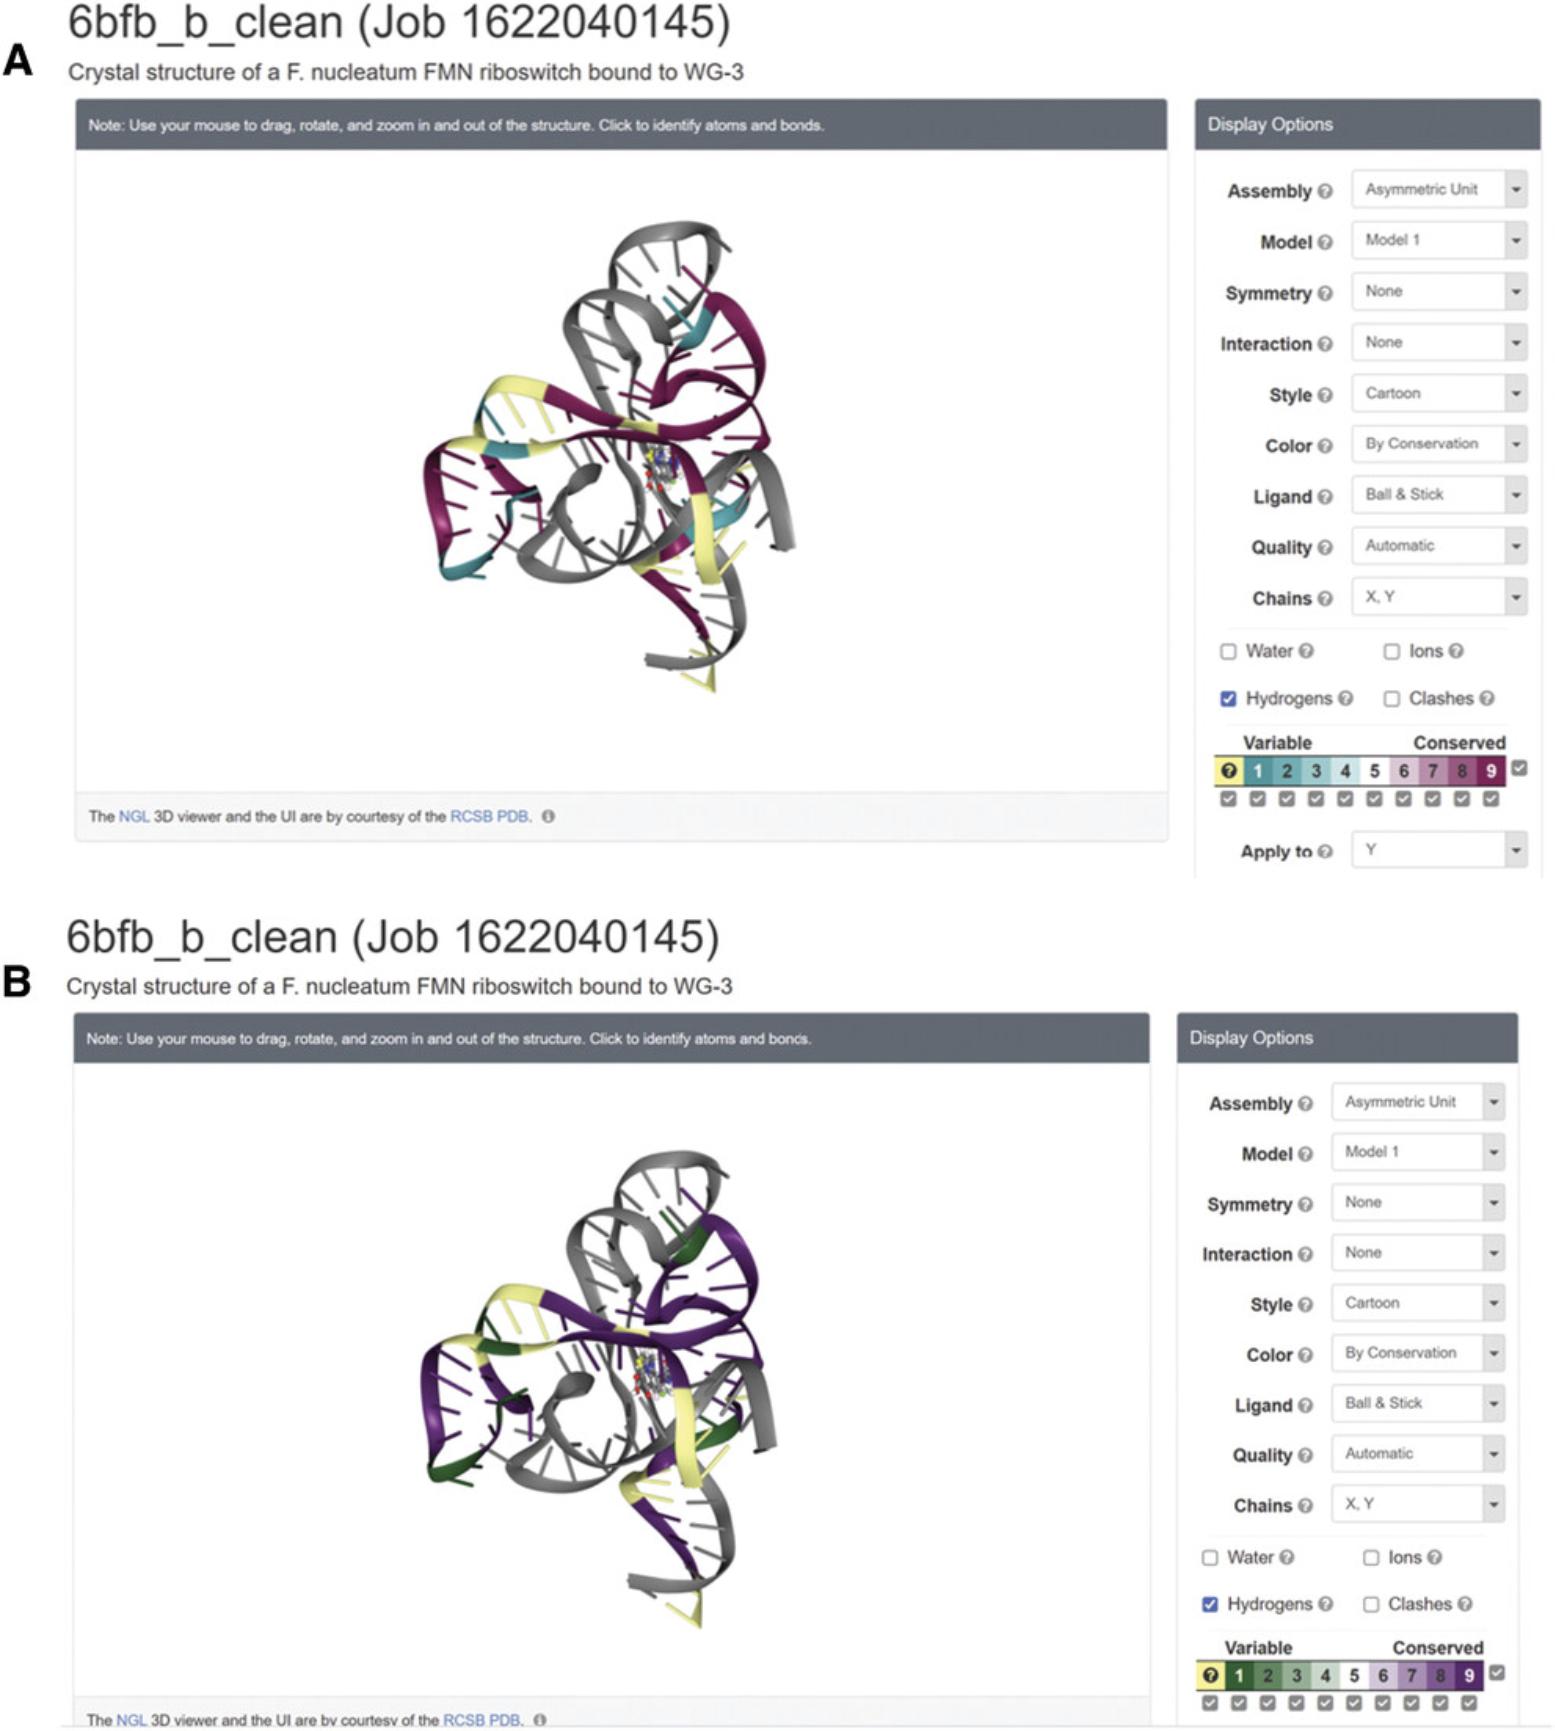
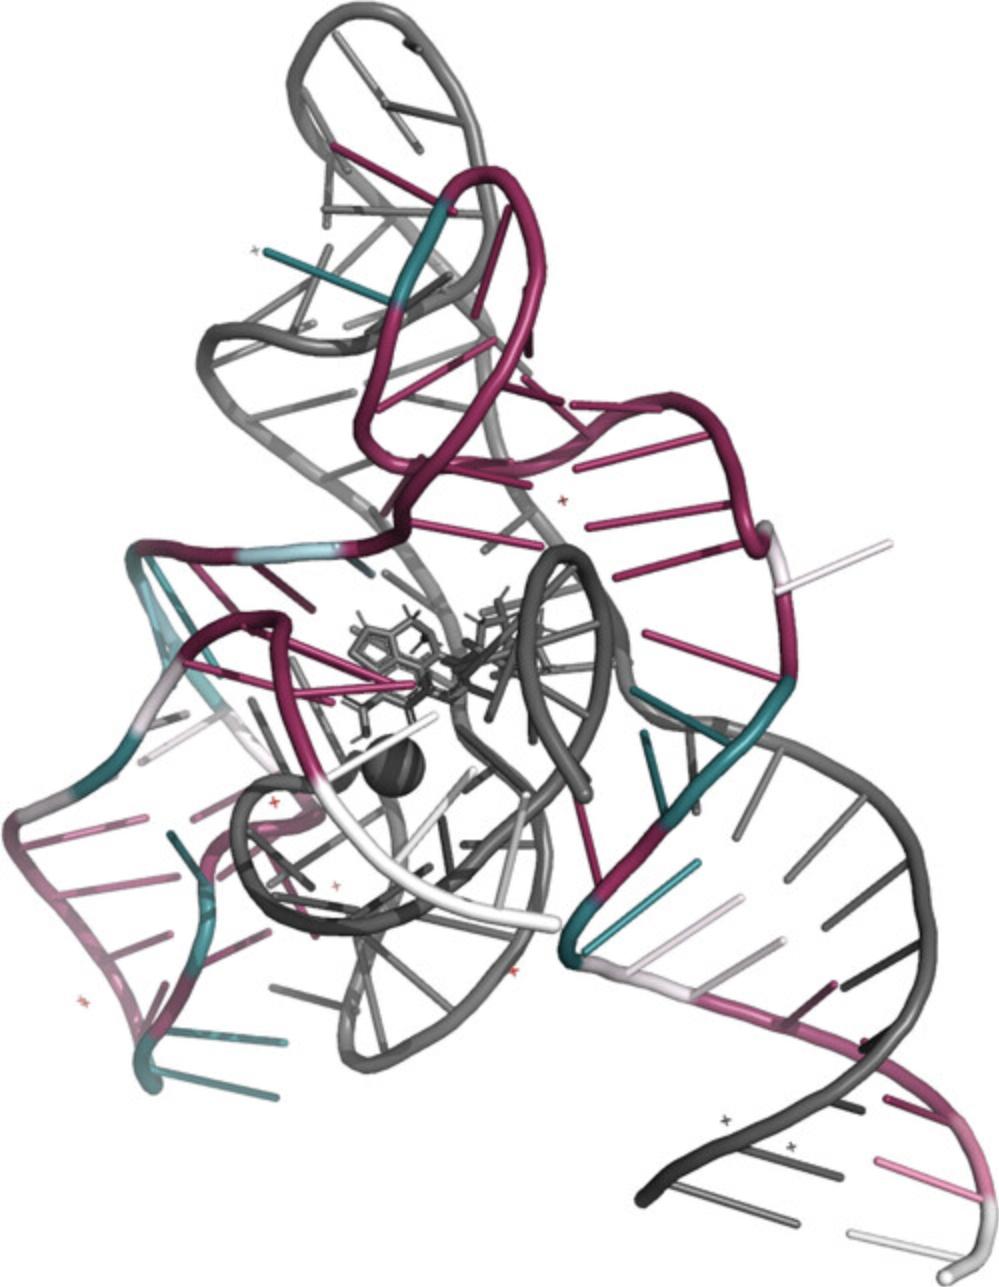
There are three viewing platforms: NGL viewer and FirstGlance in Jmol are online viewers, while Chimera is a platform that needs to be installed on your computer. Visualization is based on coding of the 1-through-9 conservation scores, 1 being the most variable and 9 the most highly conserved, into a cyan-through-magenta color palette. A tenth and separate color (yellow) indicates nucleobases for which the conservation score was not assigned a high enough confidence (mostly due to insufficient data, i.e., many insertions). On both online viewers, it is also possible to view the results in a color-blind-friendly scale of green-through-purple. (Fig. 12).
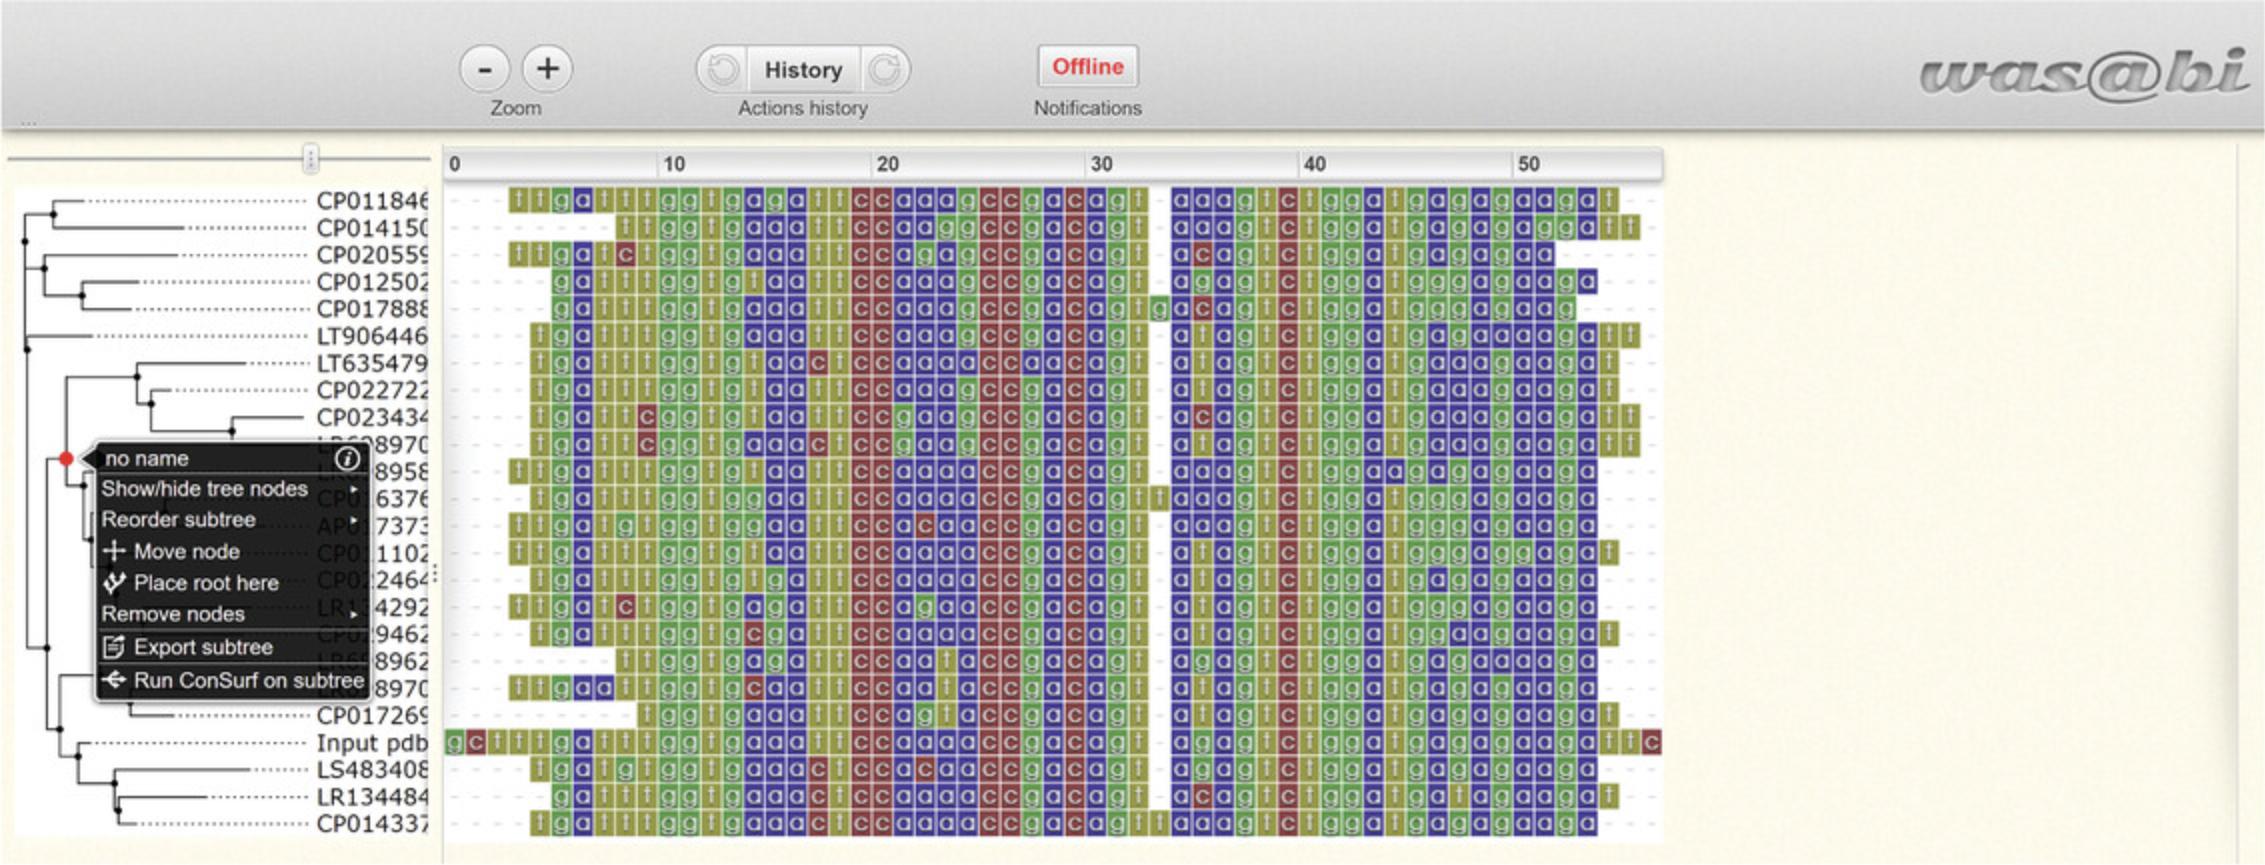
- The evolutionary tree and the MSA, which were either uploaded by the user or generated by the server, can be viewed on WASABI (Veidenberg, Medlar, & Löytynoja, 2016). The WASABI platform also allows the user to select a subtree and conduct a follow-up ConSurf analysis with the new section of homologs (Fig. 13).
Open the WASABI viewer and click on the root of the subtree that you wish to conduct the follow-up analysis with. A list of actions will open, “Run ConSurf on subtree” will appear at the end. Select this option and wait (maybe 1 min). A message from ConSurf will pop up with the new search number and an “OK” button. To open the results page, click on the “OK” button, and a new tab with the job status will open.
- The MSA colored by ConSurf conservation scores.
Each column is colored using the ConSurf color code. Yellow letters indicate columns for which the conservation score was not assigned a high enough confidence.
- A tabular text file summarizing the analysis for each base in the query sequence.
For each position on the query, there are: a normalized score calculated, with the grade assigned on the 1-through-9 scale with 9 being the most highly conserved; the reliability estimation (for the Bayesian method); and the nucleotides observed in the respective MSA column for each position.
- A download button.
When clicked, a compressed folder with all results will be downloaded.
2.PDB files
3.Creating high-resolution figures
- Chimera–follow the instructions to produce the desired image
- PyMOL–the only option in the instructions is for figure hiding the insufficient data (Fig. 14). To create a PyMOL figure that does show insufficient data, download all the results and open the appropriate pdb file, following the instructions as they are found in the server.
- RasMol–the pdb file that can be found in the instructions cannot be used to create a figure in RasMol. Instead, download all results and follow the instructions using the desired pdb file from the results file.
4.Sequence data
5.Alignment
6.Phylogenetic tree
The results of a ConSurf analysis with query sequence (i.e., no structure) will be as follows (Fig. 15).
1.Final results
- The query sequence with a colored conservation profile.
There are two viewing platforms, HTML and PDB. Visualization is based on coding of the 1-through-9 conservation scores, 1 being the most variable and 9 the most highly conserved, into a color palette. The HTML version uses the traditional cyan-through-magenta scale, and the pdf version offers a color-blind-friendly green-through-purple scale. A tenth and separate color (yellow) is used in both to indicate nucleobases for which the conservation score was not assigned a high enough confidence (mostly due to insufficient data, i.e., many insertions).
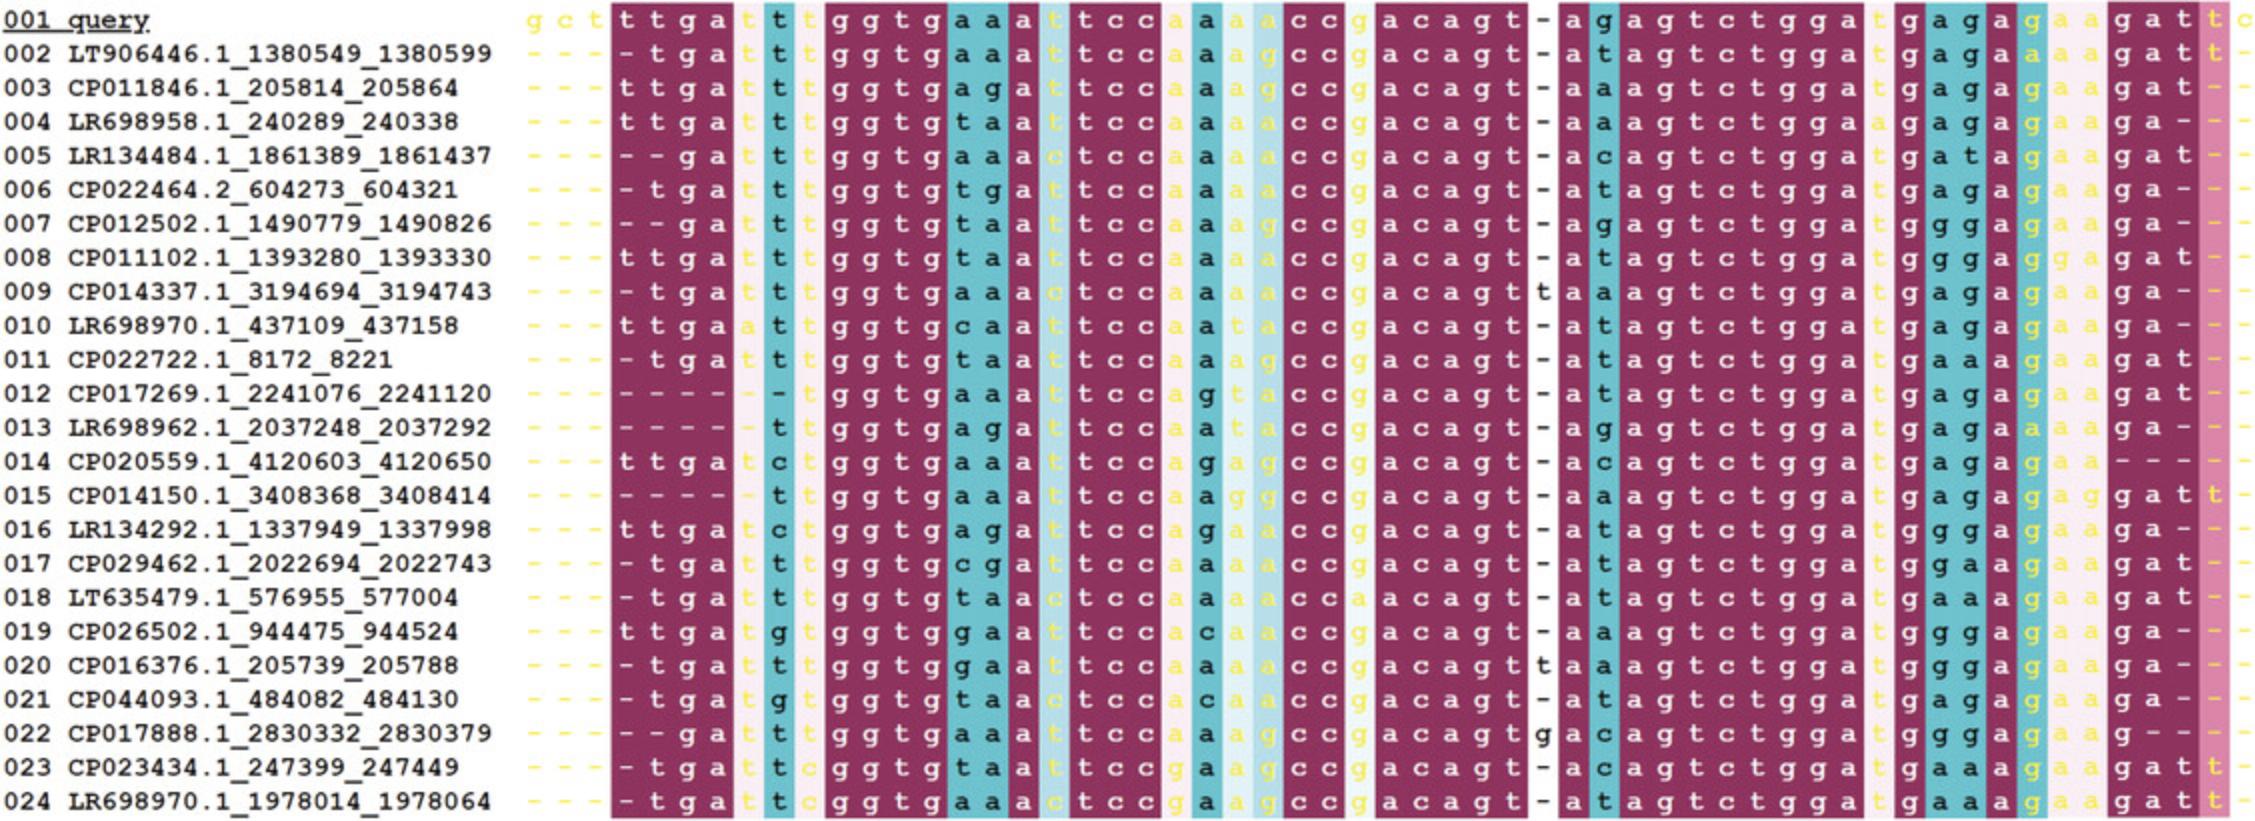
- The MSA colored by ConSurf conservation scores (Fig. 16).
Each column is colored using the traditional cyan-through-magenta ConSurf color-code. Yellow letters indicate columns for which the conservation score was not assigned a high enough confidence.
- The evolutionary tree and the MSA, which were either uploaded by the user or generated by the server, can be viewed on WASABI. The WASABI platform also allows the user to select a subtree and conduct a follow-up ConSurf analysis with the new section of select homologs.
Open the WASABI viewer and click on the root of the subtree on you wish to conduct the follow-up analysis. A list of actions will open; “Run ConSurf on subtree” will appear at the end. Select this option and wait (around a minute); a message from ConSurf will pop up with the new search number and an “OK” button. To open the results page, click on the “OK” button and a new tab with the job status will open.
- Chimera view of the MSA.
By following the instructions detailed under the question mark, the MSA, can be viewed with Chimera on your computer.
- A tabular text file summarizing the analysis for each base in the query sequence.
For each position on the query there are: a normalized score calculated, with the grade assigned on the 1-through-9 scale, with 9 being the most highly conserved; the reliability estimation (for the Bayesian method); and the nucleotides observed in the respective MSA column for each position.
- A download button.
When clicked, a compressed folder with all results will be downloaded.
2.Sequence data
3.Alignment
4.Phylogenetic tree
COMMENTARY
Background Information
ConSurf is a web-based tool which estimates the conservation of amino/nucleic acid positions in a protein/DNA/RNA molecule. Unfortunately, the pipeline for analyzing nucleic acids is mostly useless, in essence. The reason is that for the most part, the pipeline, which is based on dated databases and sequence search tools, fails to find a large enough set of effective homologs to allow a meaningful estimate of the evolutionary rates. Here we have described two complementary protocols (and variations thereof) based on state-of-the-art tools and databases for building a large enough multiple sequence alignment of effective homologs for your RNA molecule query. To examine the utility of these protocols, we utilized the pipelines to analyze a representative set of dozen RNA molecules of known structure (Table 1). By following Basic Protocol 1, four of the dozen queries we examined were successfully analyzed. When combining Basic Protocol 2 with Support Protocol 1, we were able to successfully analyze eleven of the twelve query sequences. All of the queries were successfully analyzed when combining Basic Protocol 2 with Support Protocol 2.
| Query details | Basic Protocol 1 | Basic Protocol 2 + Support Protocol 1 | Basic Protocol 2 + Support Protocol 2 | |||||
|---|---|---|---|---|---|---|---|---|
| PDB id | Chain | Sequence length | Number of effective homologs | Job status | Number of effective homologs | Job status | Number of effective homologs | Job status |
| 5fk4 | A | 93 | 0 | Failed | 156 | Completed | 226 | Completed |
| 4tra | A | 76 | 27 | Completed | 34 | Completed | 174 | Completed |
| 1z43 | A | 101 | 2 | Failed | 166 | Completed | 59 | Completed |
| 1kxk | A | 71 | 0 | Failed | 105 | Completed | 10b | Completed |
| 2qbz | A | 161 | 19 | Completed | 285 | Completed | 199 | Completed |
| 2gcs | B | 125 | 1 | Failed | 234 | Completed | 48 | Completed |
| 2ydh | A | 94 | 1 | Failed | 155 | Completed | 228 | Completed |
| 4wfm | A,B | 103 | 11 | Failed | 102 | Completed | 141 | Completed |
| 6bfb | A | 54 | 6 | Completed | 224 | Completed | 33 | Completed |
| 6bfb | B | 56 | 23 | Completed | 231 | Completed | 81 | Completed |
| 6d8o | A,B | 158 | 1 | Failed | 264 | Completed | 16b | Completed |
| 1duh | A | 45 | 0 | Failed | 1 | Failed | 15b | Completed |
- a The three leftmost columns list the PDB ID, chain, and number of RNA bases of the query. The next two columns list the number of effective homologs detected and whether the run using Basic Protocol 1 completed successfully. The next two columns list the number of effective homologs detected and whether the run using Basic Protocol 2 in combination with Support Protocol 1 completed successfully. The last two columns list the number of effective homologs detected and whether the run using Basic Protocol 2 in combination with Support Protocol 2 completed successfully. All analyses were carried out with RNA queries of known structure and default settings.
- b When searching for homologs using nHMMER locally, the inclusion threshold E-value was set to 0.1 rather than the default value.
Critical Parameters
Number of effective homologs
The number of effective homologs used to construct the MSA has great influence on the quality of the analysis. Too few homologs might not be sufficient to evenly sample the relevant sequence space. A minimum of five homologs (including the query) are required in ConSurf, but many more are usually needed for accurate estimate of the evolutionary rate per site. On the other hand, too many homologs may slow down the run or even prevent completion. We recommend including between 50-and-300 homologs.
Inclusion threshold E-value
Increasing the E-value of included homologs will increase the number of homologs. The E-value is set to determine the likelihood of a false positive homolog. If it is set to 1, then, on average, there will be one false positive in the list of homologs.
Sequence identity threshold
When clustering the homologs with CD-HIT, the sequence identity cut-off should be between 95% and 80%. Using a higher threshold may compromise the integrity of the final ConSurf analysis, as the relevant sequences may lack diversity. A lower threshold might compromise the clustering process and the CD-HIT run may not complete.
Troubleshooting
Table 2 lists common problems that may arise with the protocols in this article, along with their possible causes and solutions.
| Problem | Possible cause | Solution |
|---|---|---|
| Many of the nucleic acids have unreliable conservation scores due to insufficient data | MSA was constructed with too few sequences | Increase number of effective homologs |
| MSA is too large, causing the run to fail | There are over 300 sequences included in the MSA | Decrease the number of effective homologs by decreasing the percentage “sequence ID cut-off” in CD-HIT. |
| The query is a long sequence with a large MSA of over 200 effective homologs | ||
| The character “U” is found in the MSA | The adjustment of replacing “U” with “T” when constructing an MSA externally was skipped | Modify the MSA to fit the requirement of the server and attempt to run the analysis again |
Acknowledgments
The authors thank Gal Masrati and Amit Kessel for their assistance on this protocol. The research was supported by Grant 450/16 of the Israeli Science Foundation (ISF). NB-T's research is supported in part by the Abraham E. Kazan Chair in Structural Biology, Tel Aviv University.
Author Contributions
Maya Rubin : Writing original draft; Nir Ben-Tal : supervision, writing review and editing.
Conflict of Interest
The authors declare no conflict of interest.
Open Research
Data Availability Statement
The data that support the findings of this study are available from the corresponding author upon reasonable request.
Literature Cited
- Altschul, S. F., Gish, W., Miller, W., Myers, E. W., & Lipman, D. J. (1990). Basic local alignment search tool. Journal of Molecular Biology , 215(3), 403–410. doi: 10.1016/S0022-2836(05)80360-2.
- Ashkenazy, H., Abadi, S., Martz, E., Chay, O., Mayrose, I., Pupko, T., & Ben-Tal, N. (2016). ConSurf 2016: An improved methodology to estimate and visualize evolutionary conservation in macromolecules. Nucleic Acids Research , 44(W1), W344–50. doi: 10.1093/nar/gkw408.
- Ashkenazy, H., Erez, E., Martz, E., Pupko, T., & Ben-Tal, N. (2010). ConSurf 2010: Calculating evolutionary conservation in sequence and structure of proteins and nucleic acids. Nucleic Acids Research , 38(Web Server issue), W529–33. doi: 10.1093/nar/gkq399.
- Capra, J. A., & Singh, M. (2007). Predicting functionally important residues from sequence conservation. Bioinformatics , 23(15), 1875–1882. doi: 10.1093/bioinformatics/btm270.
- Celniker, G., Nimrod, G., Ashkenazy, H., Glaser, F., Martz, E., Mayrose, I., … Ben-Tal, N. (2013). ConSurf: Using evolutionary data to raise testable hypotheses about protein function. Israel Journal of Chemistry , 53(3-4), 199–206. doi: 10.1002/ijch.201200096.
- Del Sol, A., Pazos, F., & Valencia, A. (2003). Automatic methods for predicting functionally important residues. Journal of Molecular Biology , 326(4), 1289–1302. doi: 10.1016/s0022-2836(02)01451-1.
- Eddy, S. R. (2009). A new generation of homology search tools based on probabilistic inference. Genome Informatics. International Conference on Genome Informatics , 23(1), 205–211. doi: 10.1142/9781848165632_0019.
- Fu, L., Niu, B., Zhu, Z., Wu, S., & Li, W. (2012). CD-HIT: Accelerated for clustering the next-generation sequencing data. Bioinformatics , 28(23), 3150–3152. doi: 10.1093/bioinformatics/bts565.
- Gallet, X., Charloteaux, B., Thomas, A., & Brasseur, R. (2000). A fast method to predict protein interaction sites from sequences. Journal of Molecular Biology , 302(4), 917–926. doi: 10.1006/jmbi.2000.4092.
- Hasegawa, M., Kishino, H., & Yano, T. (1985). Dating of the human-ape splitting by a molecular clock of mitochondrial DNA. Journal of Molecular Evolution , 22(2), 160–174. doi: 10.1007/BF02101694.
- Huang, Y., Niu, B., Gao, Y., Fu, L., & Li, W. (2010). CD-HIT Suite: A web server for clustering and comparing biological sequences. Bioinformatics , 26(5), 680–682. doi: 10.1093/bioinformatics/btq003.
- Huang, Y.-F., & Golding, G. B. (2014). Phylogenetic Gaussian process model for the inference of functionally important regions in protein tertiary structures. PLoS Computational Biology , 10(1), e1003429. doi: 10.1371/journal.pcbi.1003429.
- Huang, Y.-F., & Golding, G. B. (2015). FuncPatch: A web server for the fast Bayesian inference of conserved functional patches in protein 3D structures. Bioinformatics , 31(4), 523–531. doi: 10.1093/bioinformatics/btu673.
- Innis, C. A. (2007). siteFiNDER|3D: A web-based tool for predicting the location of functional sites in proteins. Nucleic Acids Research , 35(Web Server issue), W489–94. doi: 10.1093/nar/gkm422.
- Jukes, T. H., & Cantor, C. R. (1969). Evolution of protein molecules. In Mammalian protein metabolism (pp. 21–132). Elsevier. doi: 10.1016/B978-1-4832-3211-9.50009-7.
- Katoh, K., Rozewicki, J., & Yamada, K. D. (2017). MAFFT online service: Multiple sequence alignment, interactive sequence choice and visualization. Briefings in Bioinformatics , bbx108. doi: 10.1093/bib/bbx108.
- Landgraf, R., Xenarios, I., & Eisenberg, D. (2001). Three-dimensional cluster analysis identifies interfaces and functional residue clusters in proteins. Journal of Molecular Biology , 307(5), 1487–1502. doi: 10.1006/jmbi.2001.4540.
- Li, W., & Godzik, A. (2006). Cd-hit: A fast program for clustering and comparing large sets of protein or nucleotide sequences. Bioinformatics , 22(13), 1658–1659. doi: 10.1093/bioinformatics/btl158.
- Lichtarge, O., Bourne, H. R., & Cohen, F. E. (1996a). An evolutionary trace method defines binding surfaces common to protein families. Journal of Molecular Biology , 257(2), 342–358. doi: 10.1006/jmbi.1996.0167.
- Lichtarge, O., Bourne, H. R., & Cohen, F. E. (1996b). Evolutionarily conserved Galphabetagamma binding surfaces support a model of the G protein-receptor complex. Proceedings of the National Academy of Sciences of the United States of America , 93(15), 7507–7511. doi: 10.1073/pnas.93.15.7507.
- Lichtarge, O., Yamamoto, K. R., & Cohen, F. E. (1997). Identification of functional surfaces of the zinc binding domains of intracellular receptors. Journal of Molecular Biology , 274(3), 325–337. doi: 10.1006/jmbi.1997.1395.
- Mayrose, I., Graur, D., Ben-Tal, N., & Pupko, T. (2004). Comparison of site-specific rate-inference methods for protein sequences: Empirical Bayesian methods are superior. Molecular Biology and Evolution , 21(9), 1781–1791. doi: 10.1093/molbev/msh194.
- NCBI Resource Coordinators. (2018). Database resources of the National Center for Biotechnology Information. Nucleic Acids Research , 46(D1), D8–D13. doi: 10.1093/nar/gkx1095.
- Pettersen, E. F., Goddard, T. D., Huang, C. C., Couch, G. S., Greenblatt, D. M., Meng, E. C., & Ferrin, T. E. (2004). UCSF Chimera—a visualization system for exploratory research and analysis. Journal of Computational Chemistry , 25(13), 1605–1612. doi: 10.1002/jcc.20084.
- Pupko, T., Bell, R. E., Mayrose, I., Glaser, F., & Ben-Tal, N. (2002). Rate4Site: An algorithmic tool for the identification of functional regions in proteins by surface mapping of evolutionary determinants within their homologues. Bioinformatics , 18(Suppl 1), S71–7. doi: 10.1093/bioinformatics/18.suppl_1.s71.
- RNAcentralConsortium. (2021). RNAcentral 2021: Secondary structure integration, improved sequence search and new member databases. Nucleic Acids Research , 49(D1), D212–D220. doi: 10.1093/nar/gkaa921.
- Sayle, R. A., & Milner-White, E. J. (1995). RASMOL: Biomolecular graphics for all. Trends in Biochemical Sciences , 20(9), 374. doi: 10.1016/s0968-0004(00)89080-5.
- Schrödinger. (2021). PyMOL Molecular Graphics System (2.5.1). Computer software, New York: Schrödinger, LLC.
- Tamura, K. (1992). Estimation of the number of nucleotide substitutions when there are strong transition-transversion and G+C-content biases. Molecular Biology and Evolution , 9(4), 678–687. doi: 10.1093/oxfordjournals.molbev.a040752.
- Tavare, S. (1986). Some probabilistic and statistical problems in the analysis of DNA sequences. Some Mathematical Questions in Biology /DNA Sequence Analysis edited by RobertM.Miura ,.
- Valdar, W. S. J. (2002). Scoring residue conservation. Proteins , 48(2), 227–241. doi: 10.1002/prot.10146.
- Veidenberg, A., Medlar, A., & Löytynoja, A. (2016). Wasabi: An integrated platform for evolutionary sequence analysis and data visualization. Molecular Biology and Evolution , 33(4), 1126–1130. doi: 10.1093/molbev/msv333.
- Wheeler, T. J., & Eddy, S. R. (2013). nhmmer: DNA homology search with profile HMMs. Bioinformatics , 29(19), 2487–2489. doi: 10.1093/bioinformatics/btt403.
Internet Resources
Nucleotide Home Page, NCBI.
Citing Literature
Number of times cited according to CrossRef: 2
- Safoura Salar, Nicolas E. Ball, Hiba Baaziz, Jay C. Nix, Richard C. Sobe, K. Karl Compton, Igor B. Zhulin, Anne M. Brown, Birgit E. Scharf, Florian D. Schubot, The structural analysis of the periplasmic domain of Sinorhizobium meliloti chemoreceptor McpZ reveals a novel fold and suggests a complex mechanism of transmembrane signaling, Proteins: Structure, Function, and Bioinformatics, 10.1002/prot.26510, 91 , 10, (1394-1406), (2023).
- Barak Yariv, Elon Yariv, Amit Kessel, Gal Masrati, Adi Ben Chorin, Eric Martz, Itay Mayrose, Tal Pupko, Nir Ben‐Tal, Using evolutionary data to make sense of macromolecules with a “face‐lifted” ConSurf, Protein Science, 10.1002/pro.4582, 32 , 3, (2023).

