Lineage barcoding in mice with homing CRISPR
Kian Kalhor, Kathleen Leeper, Andyna Vernet, Amanda Graveline, George M. Church, Prashant Mali, Reza Kalhor
Supplementary information
Supplementary Information
Supplementary Figs. 1–4, Supplementary Table 2 and legends for Supplementary Tables 1 and 3–8.
Reporting Summary
Supplementary Table 1
List of all hgRNAs in the MARC1 founder males. For each hgRNA, its assigned number, ID sequence, spacer sequence, TSS to PAM length, spacer length, observed inheritance probability, chromosomal location, and confidence level of the chromosomal location are given. A “+” sign in the location column indicates that the hgRNA is transcribed in the same direction as the positive strand of the mm10 reference sequence.
Supplementary Table 3
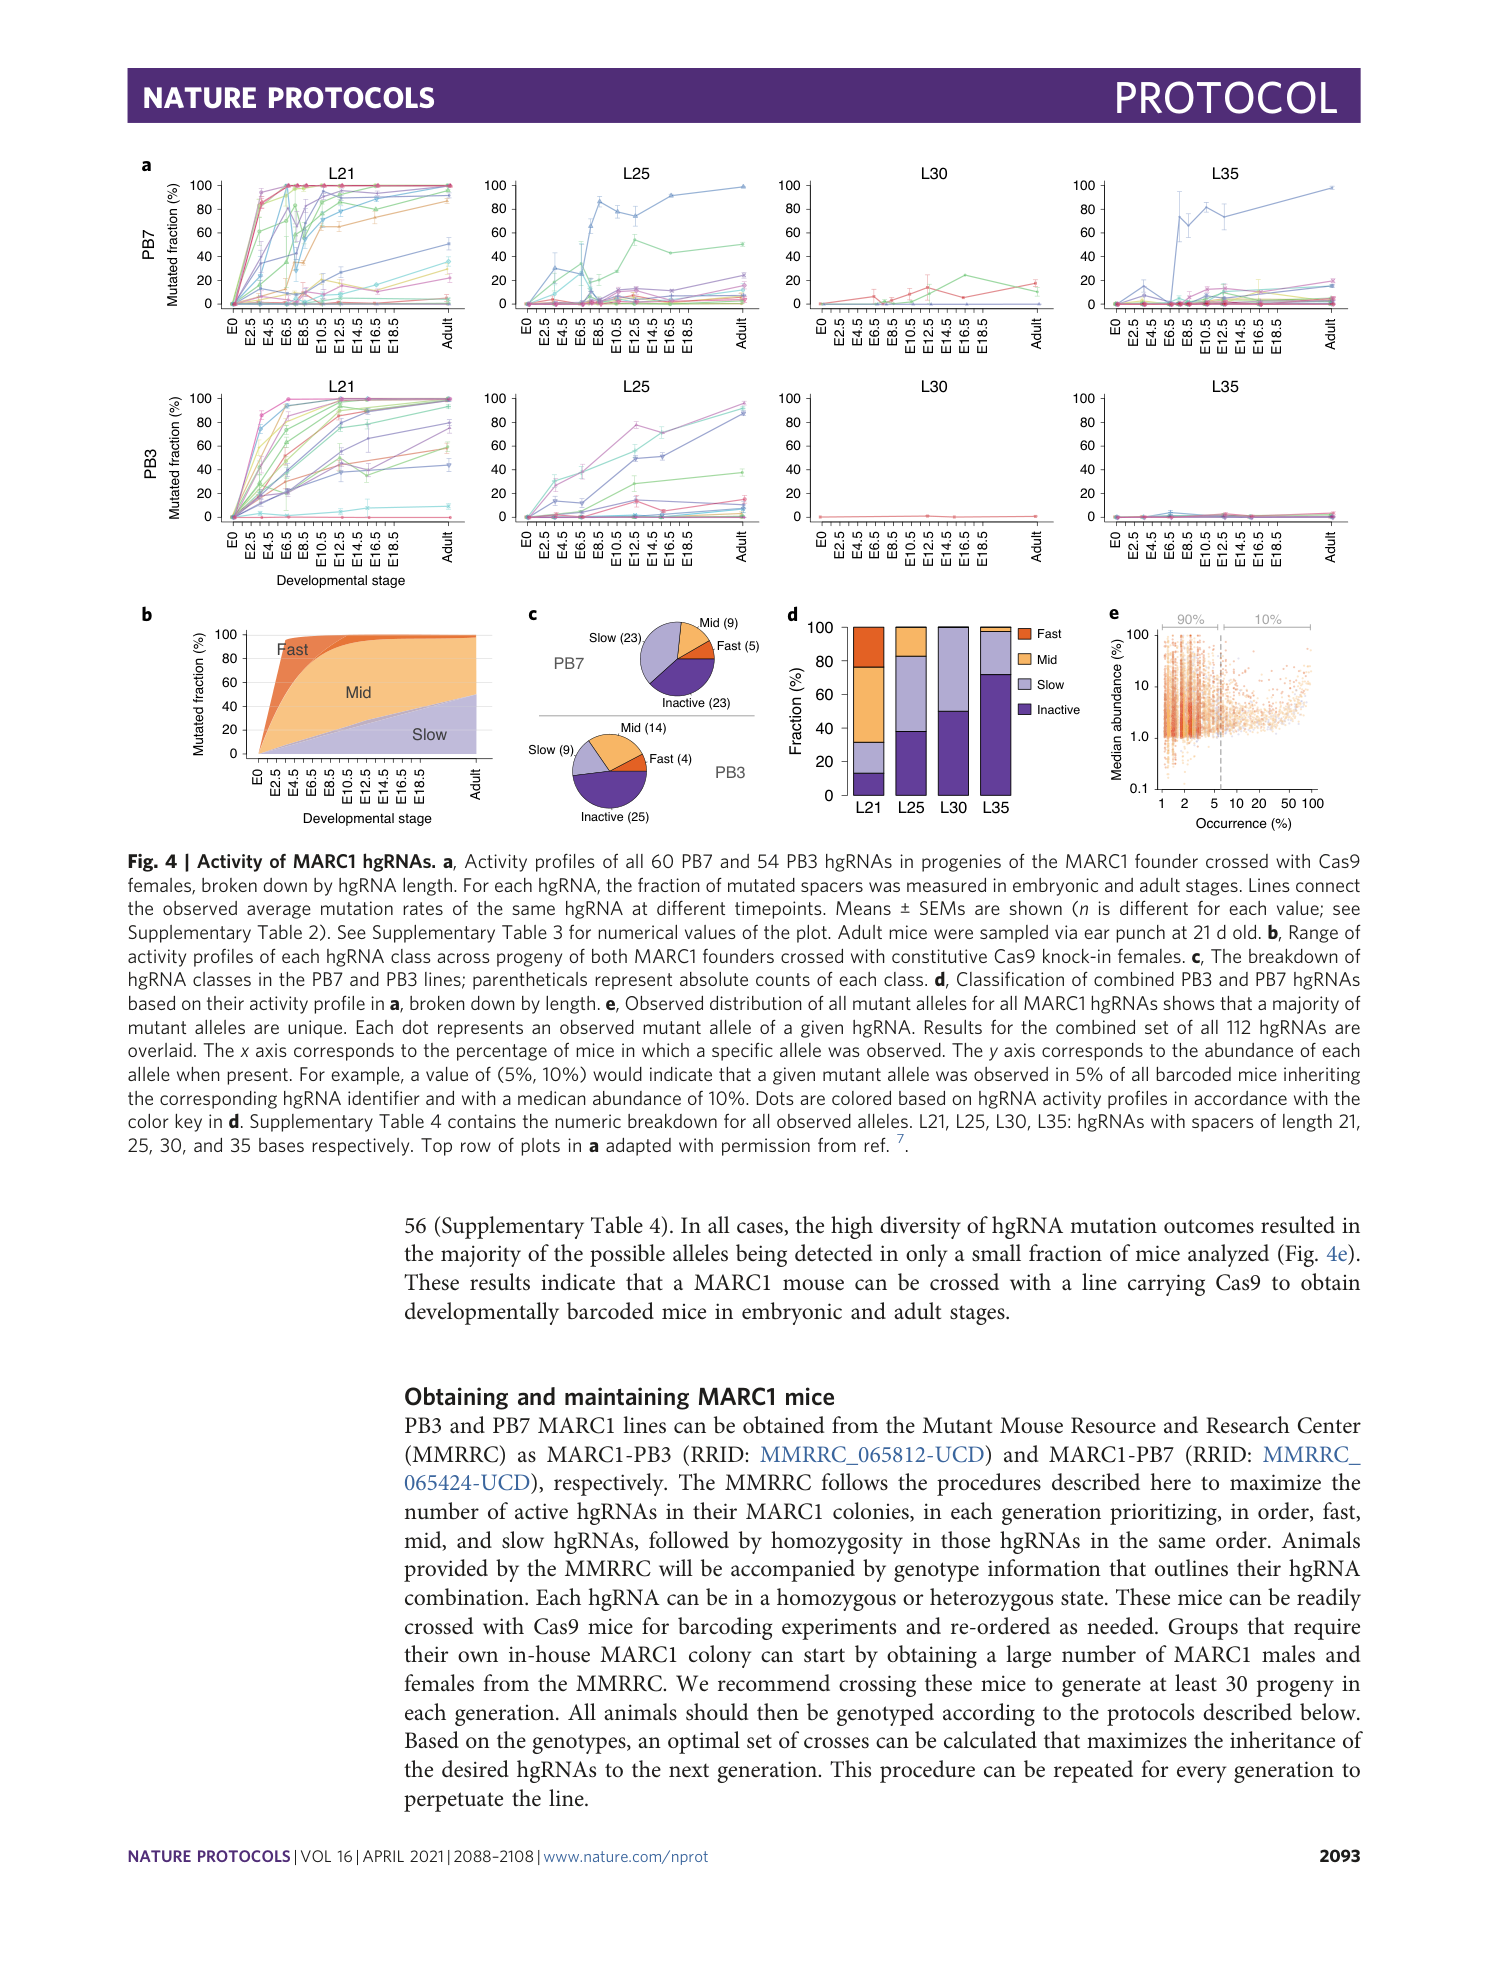
Average observed mutation level of each hgRNA during different stages of development. Values indicate percent mutated while “NA” indicates values that were not measured. Functional category based on this mutation level is also shown. Barcodes with <2% maximum mutation rate in all samples were assigned as “inactive”, those with 2–50% maximum mutation rate in all samples were assigned as “slow”, those with >90% average mutation frequency at any point before E9 were assigned as “fast”, and the rest were assigned as “mid.”
Supplementary Table 4
For each mutant spacer allele of each hgRNA, its sequence, occurrence probability (fraction of mice with that hgRNA which contained the allele), occurrence (number of mice out of total with that hgRNA which contained the allele), and median abundance (median of its abundance fraction in all mice in which it was observed) are shown.
Supplementary Table 5
Example genotyping output of the analysis pipeline, corresponding to a mutated sample. A [ sampleName ]_genotypes.txt file is produced for each sample. It provides each identifier (# and ID) and the most commonly observed associated spacer sequence (SP), forming an identifier–spacer pair; the absolute count of observations of this pair (count); the percent of this pair relative to all observed pairs in a sample; and the percent of this pair relative to all pairs with that identifier.
Supplementary Table 6
Example filtered pairs output of the analysis pipeline on a mutated sample. A [ sample ]_filteredpairs.txt file, produced for each sample, contains information on mutation levels and all observed pairs. This table contains the observed identifier with a corresponding observed spacer, the total observation count for that pair, the percent of that pair within all observations of that identifier, and the percent of that pair within all sample observations.
Supplementary Table 7
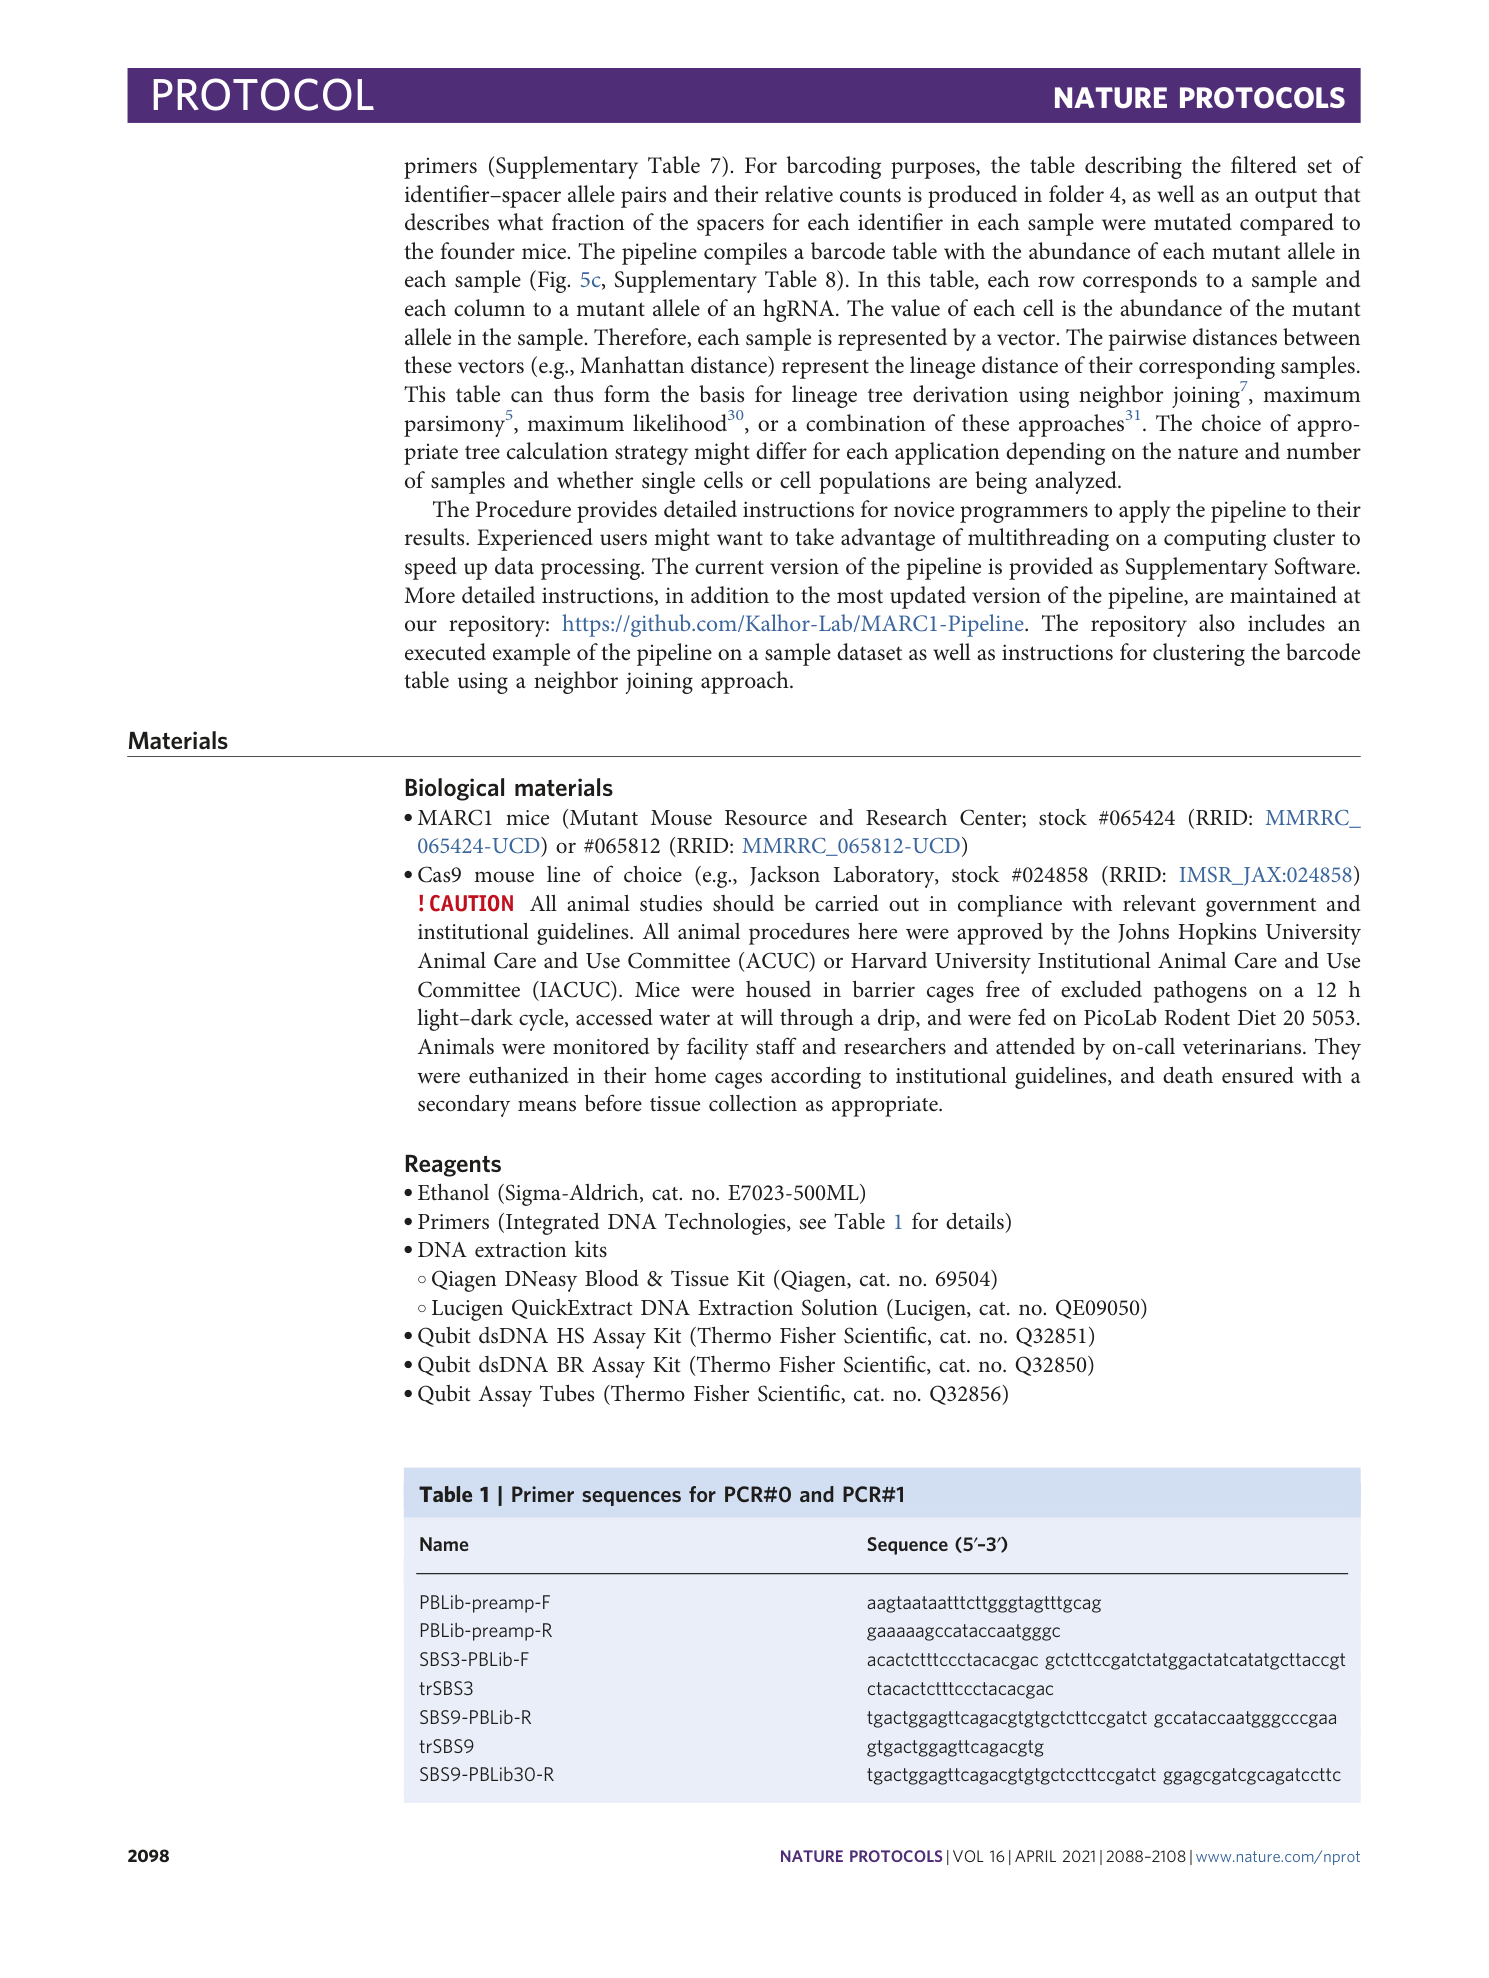
Suggested primer sets for specific amplification of each hgRNA in non-barcoded mice. Each pair is expected to produce an amplicon of 141–155 bp in length. Using each primer pair in a standard PCR on genomic DNA of MARC1 mice can establish the presence of the targeted hgRNA if an amplicon of the correct size appears. Absence of the correct amplicon in the PCR product would indicate absence of the hgRNA. These primer sets are not experimentally validated and might fail to amplify mutated hgRNA sequences, as they depend on the spacer region to bind.
Supplementary Table 8
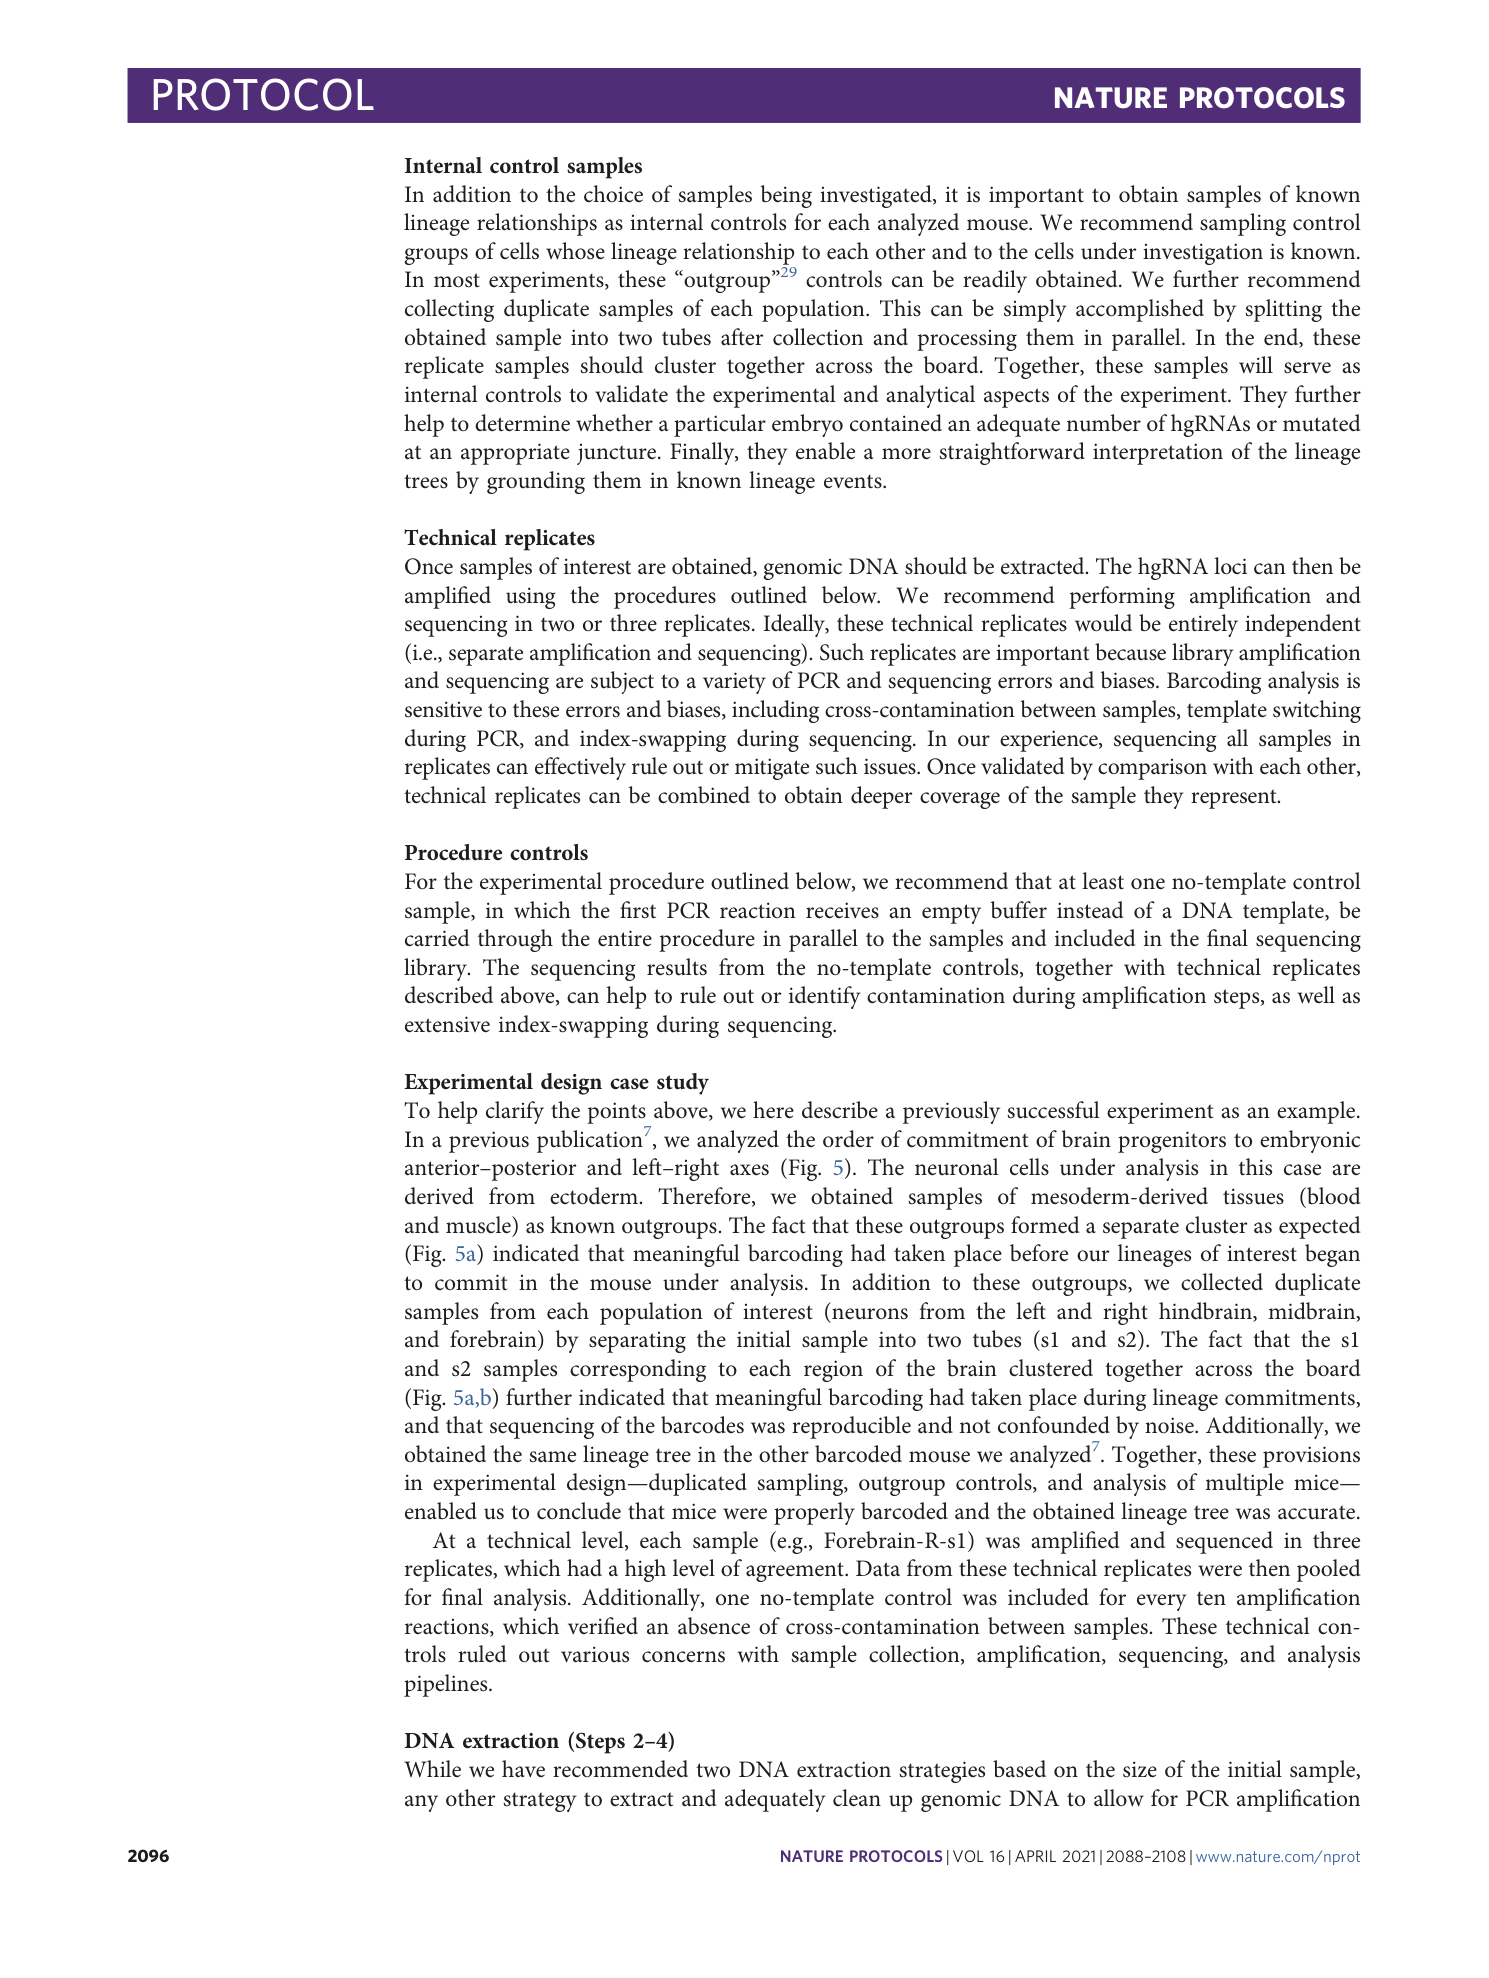
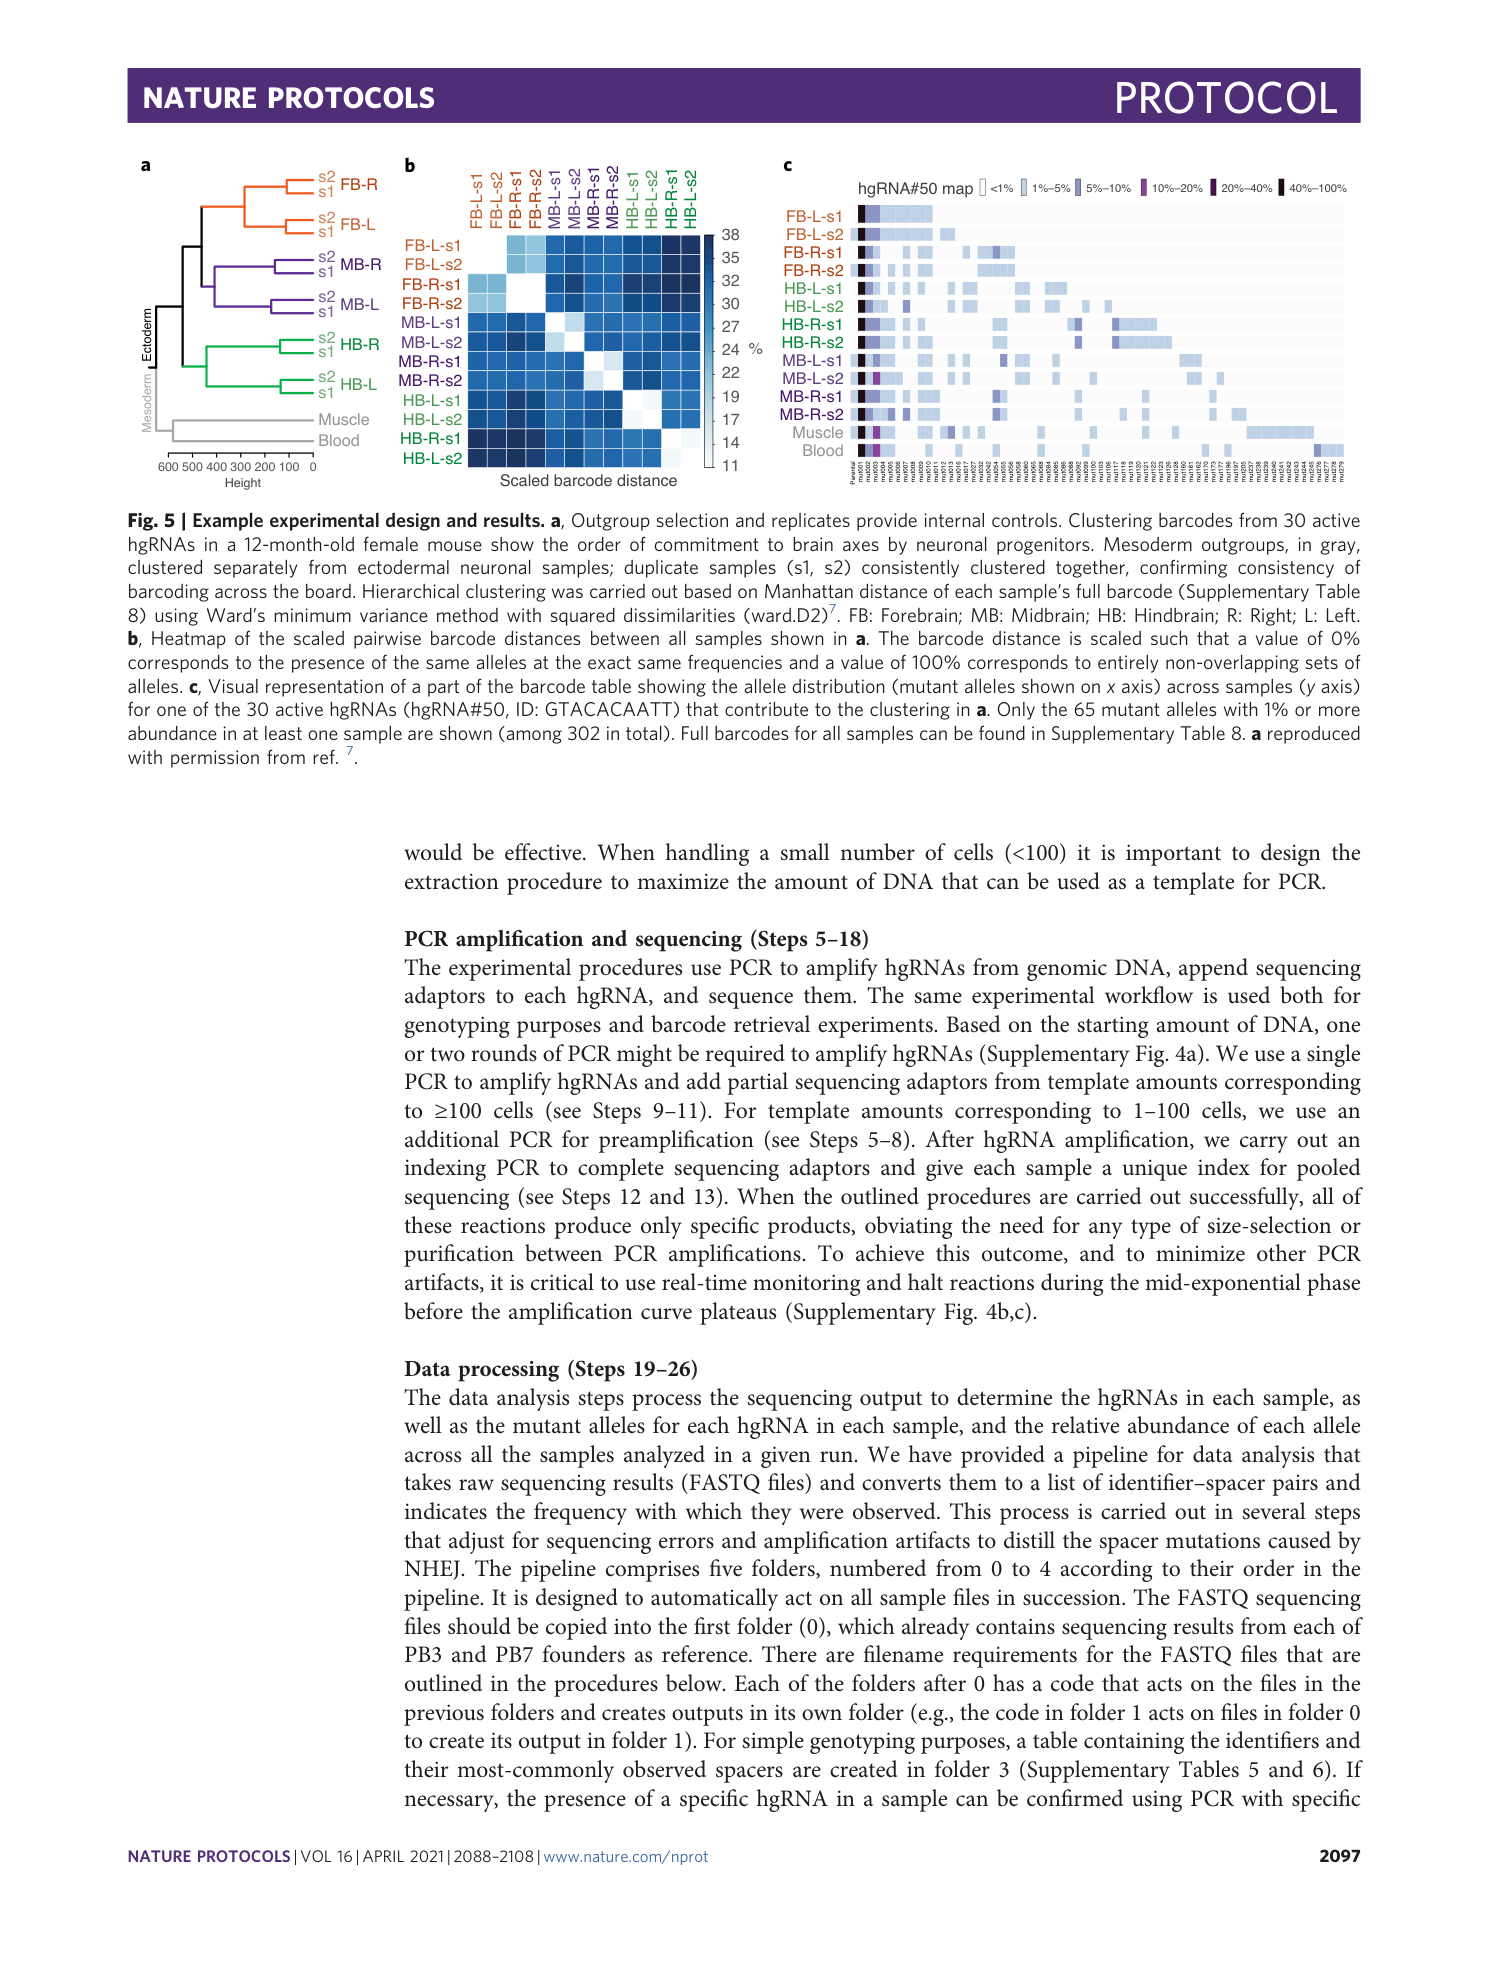
Table of observed mutant allele frequencies in each sample in Fig. 5. Rows correspond to samples and columns to each of the mutant spacer alleles that were observed. Alleles with <0.25% abundance in each sample are not included. parSP indicates spacer sequence observed in founder, mutSP indicates mutant spacer sequences observed in samples under analysis.
Supplementary Software
Data analysis pipeline.
