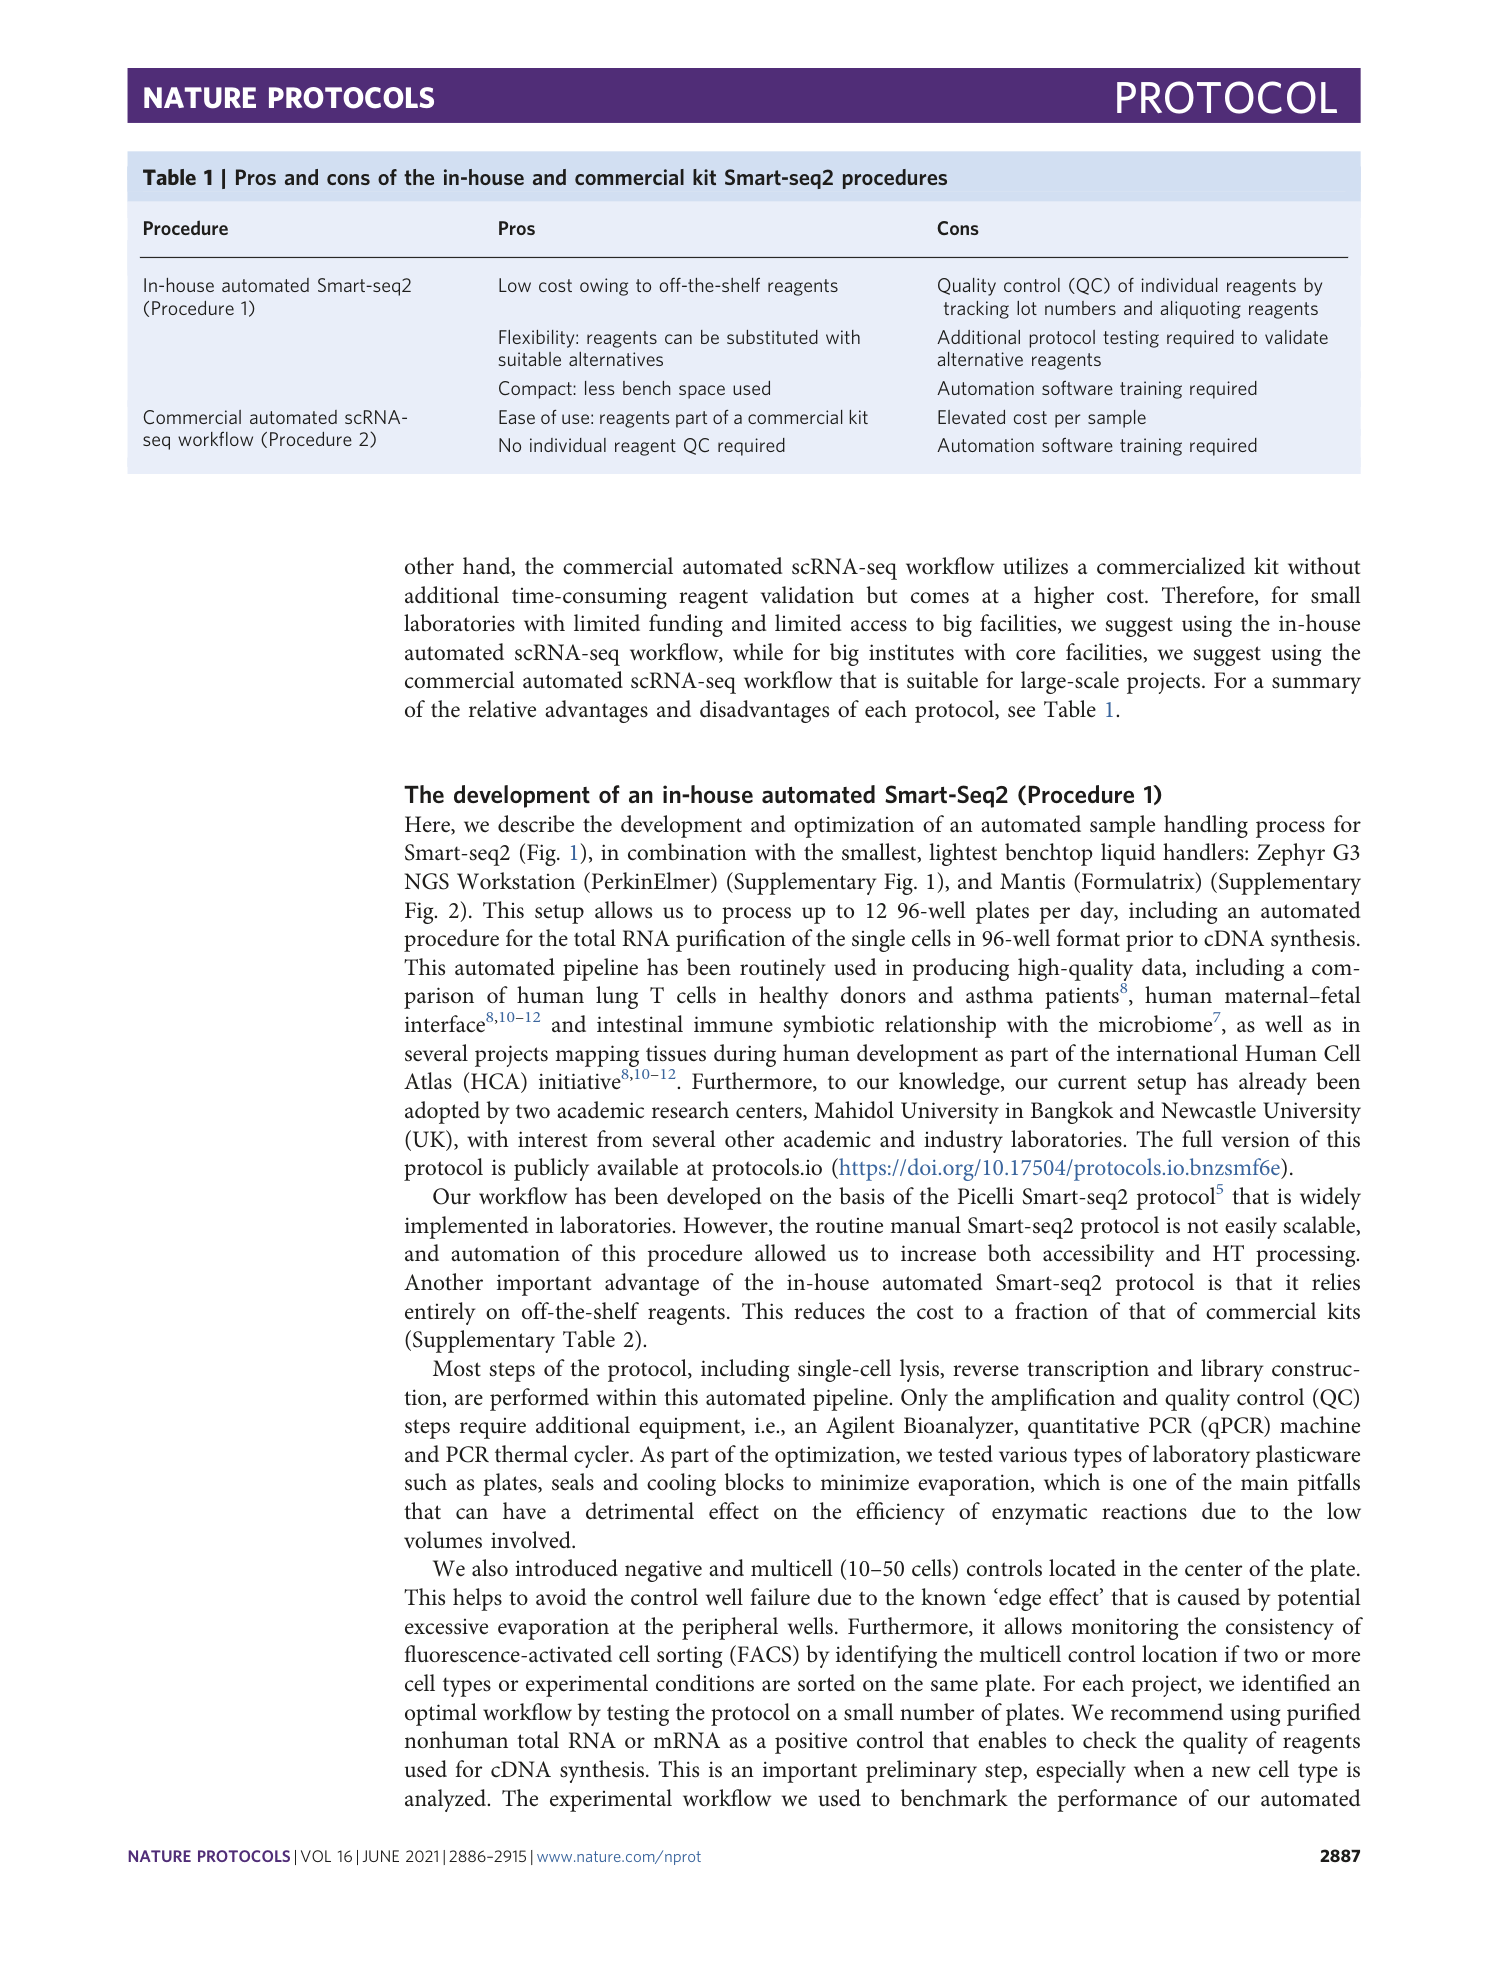
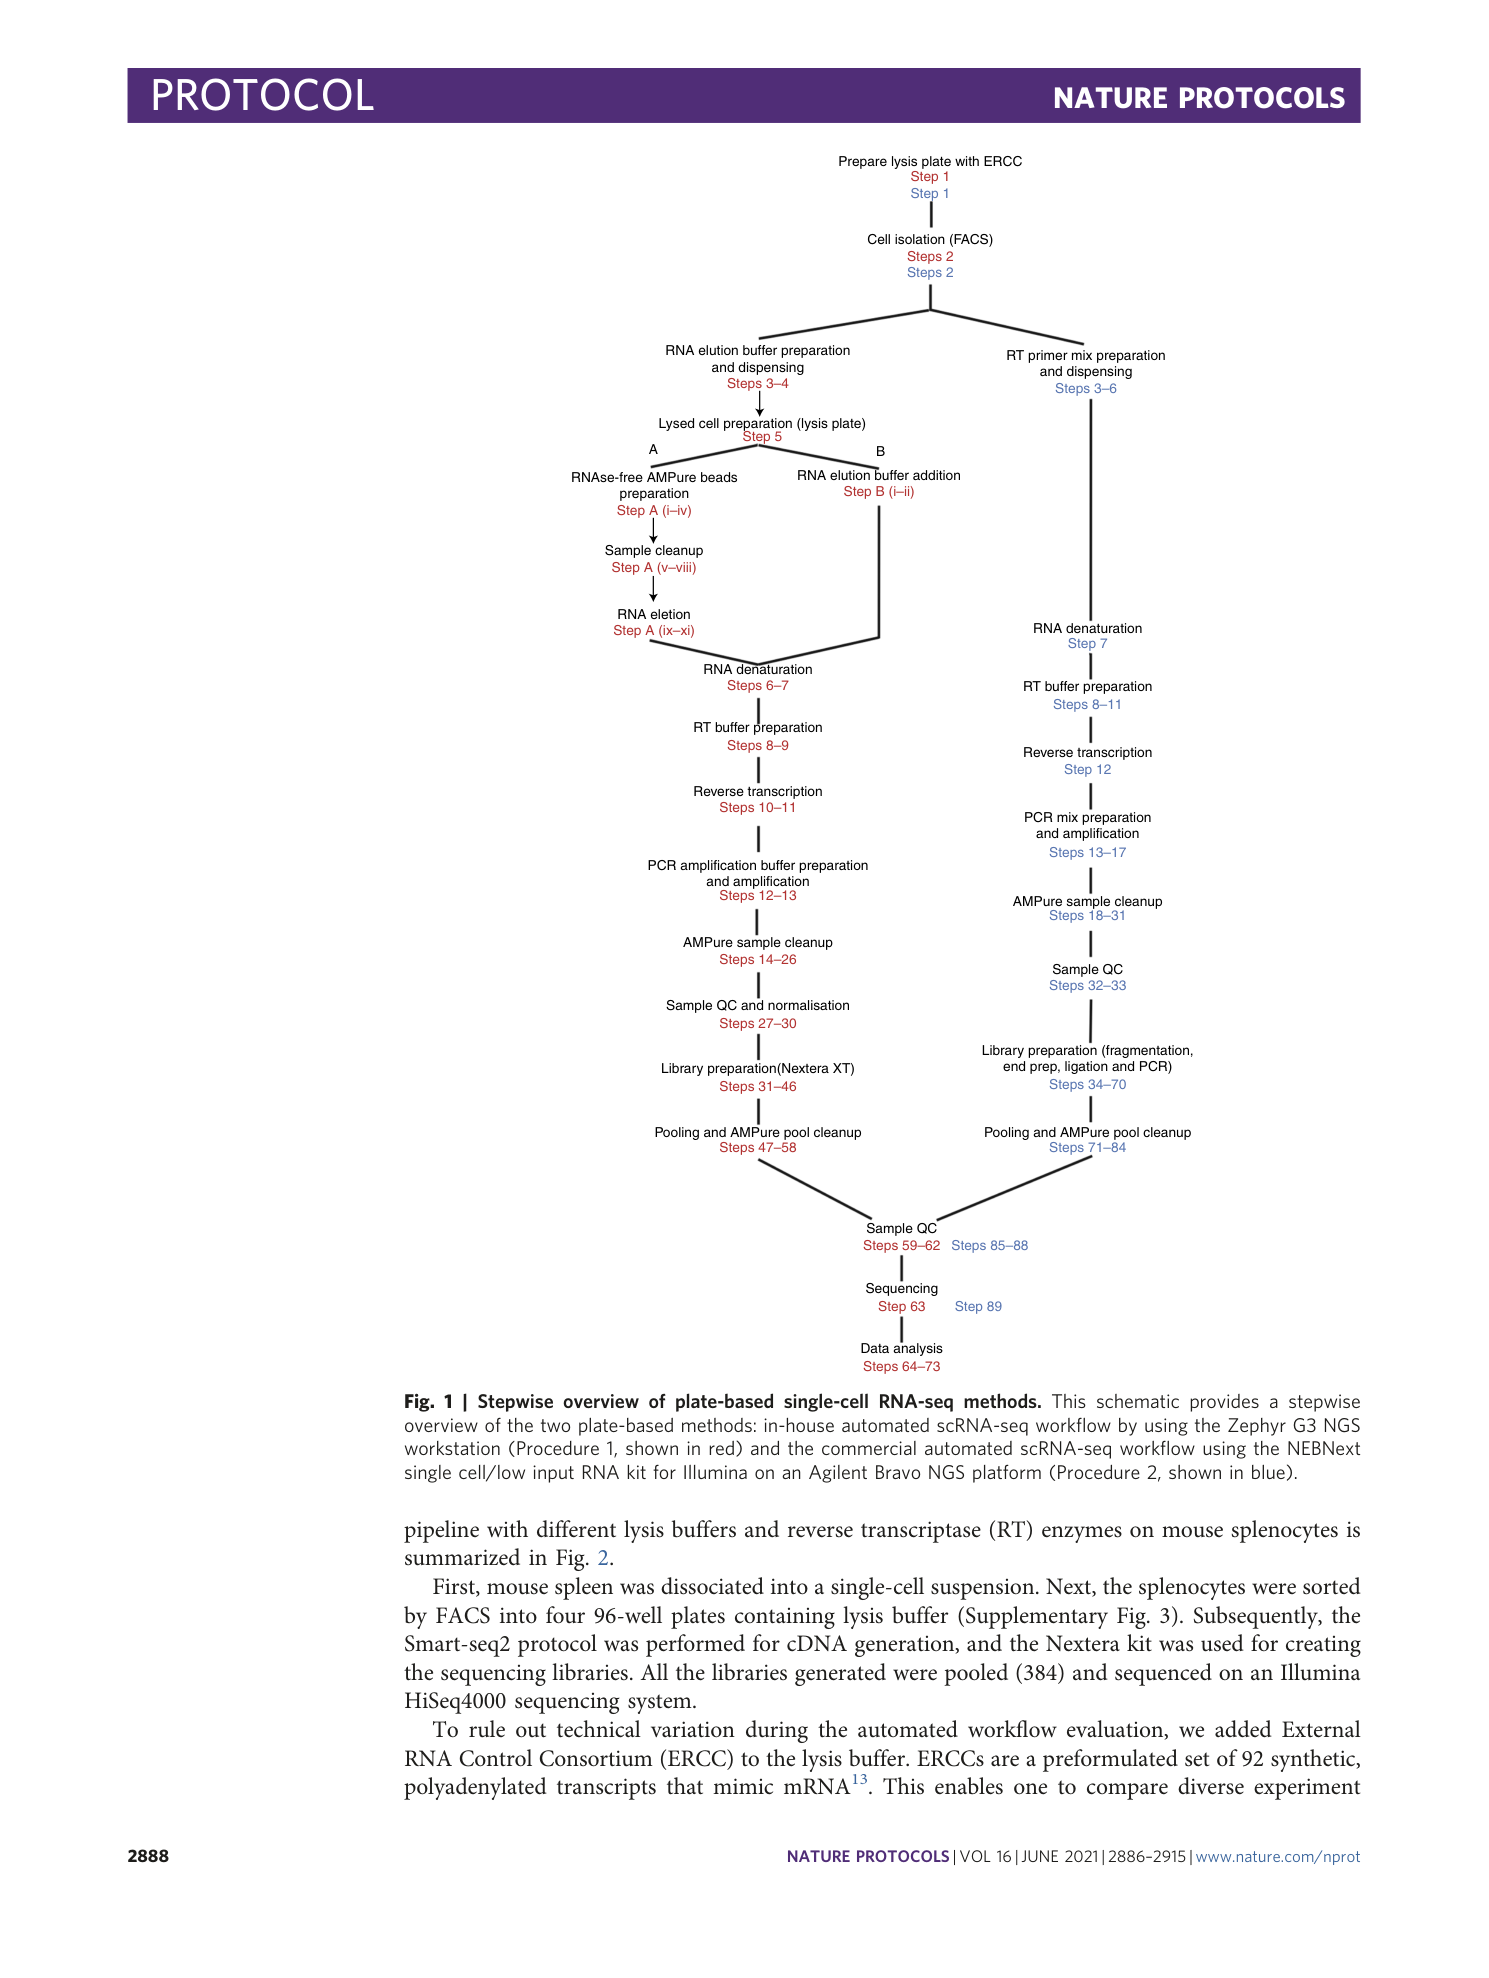
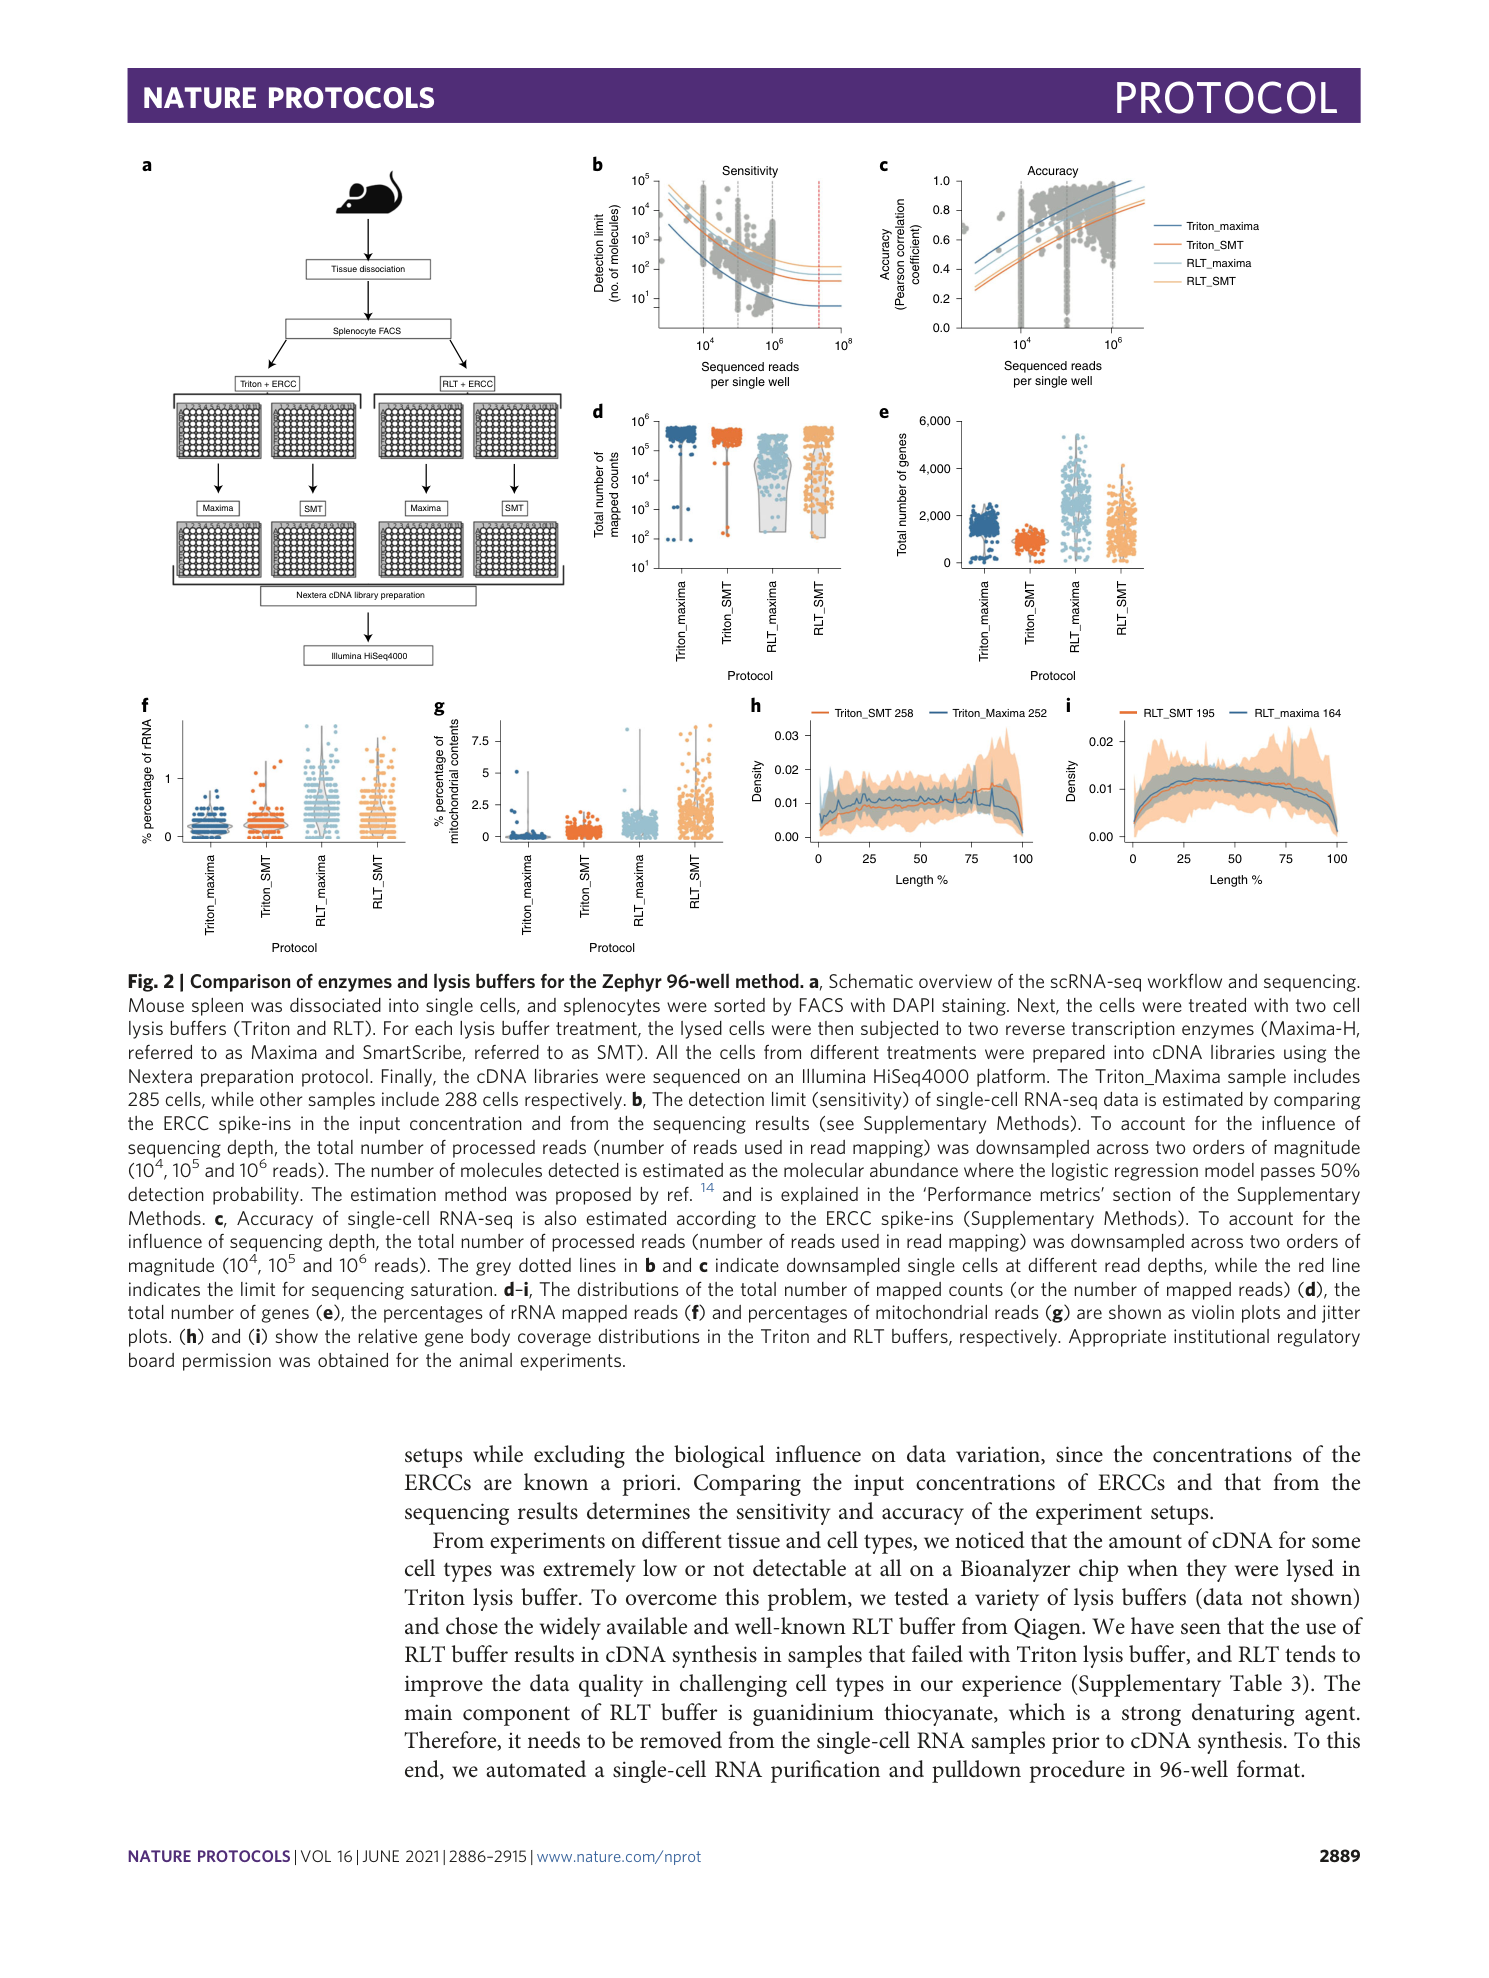
High-throughput full-length single-cell RNA-seq automation
Lesley Shirley, Peter Ellis, Lira Mamanova, Zhichao Miao, Ayesha Jinat, Sarah A. Teichmann


Extended
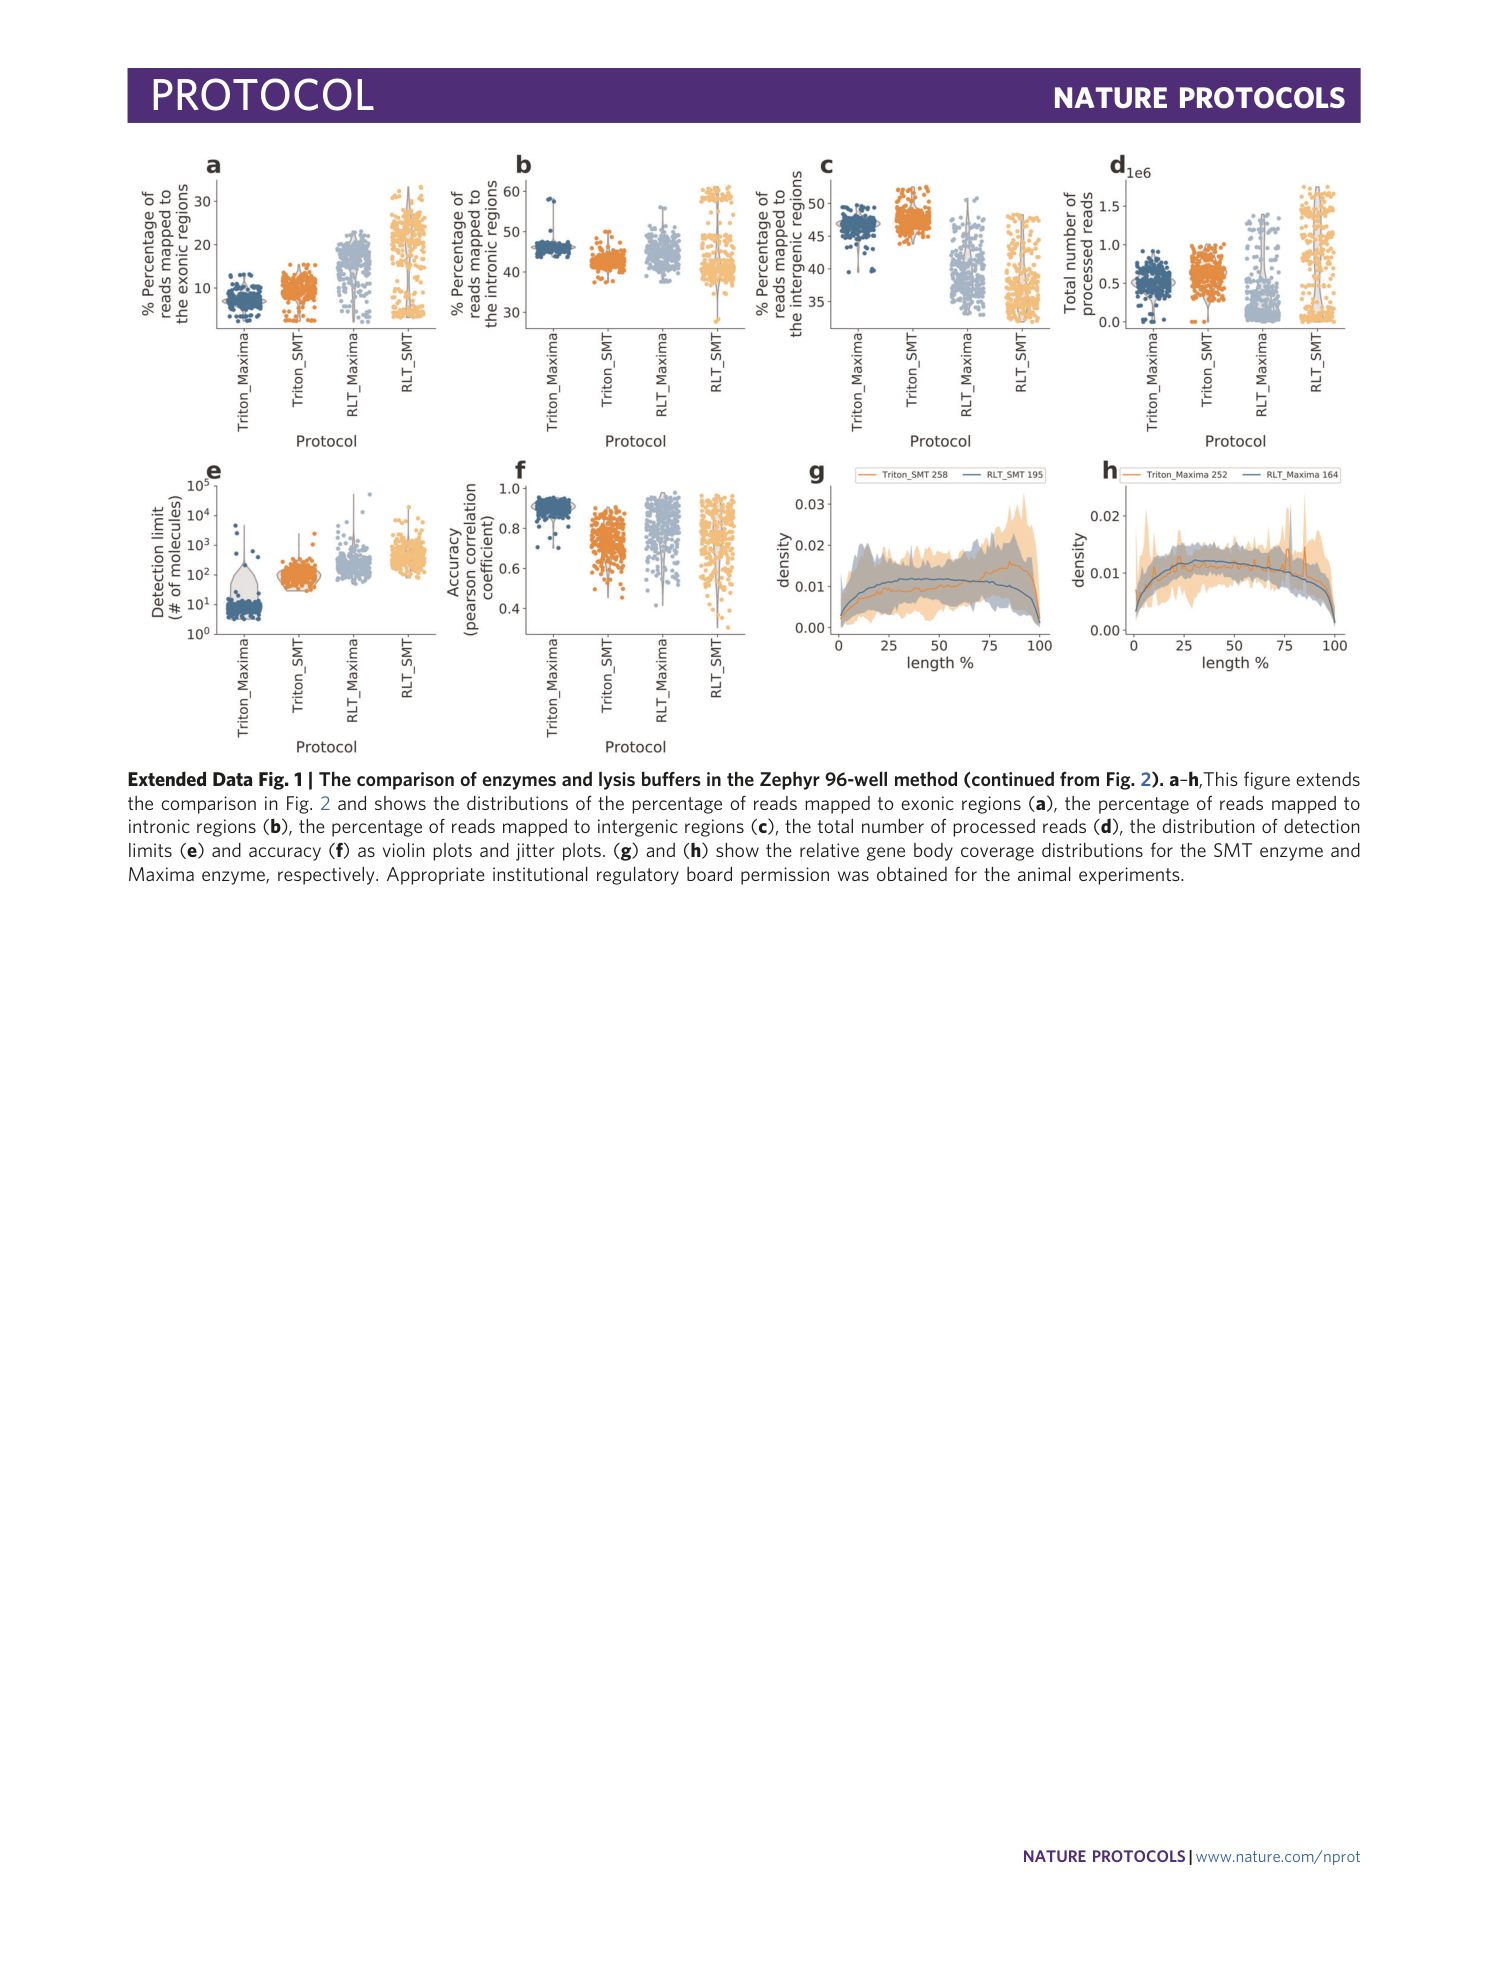
[ Extended Data Fig. 1 The comparison of enzymes and lysis buffers in the Zephyr 96-well method (continued from Fig. 2 ). ](https://www.nature.com/articles/s41596-021-00523-3/figures/3)
a – h ,This figure extends the comparison in Fig. 2 and shows the distributions of the percentage of reads mapped to exonic regions ( a ), the percentage of reads mapped to intronic regions ( b ), the percentage of reads mapped to intergenic regions ( c ), the total number of processed reads ( d ), the distribution of detection limits ( e ) and accuracy ( f ) as violin plots and jitter plots. ( g ) and ( h ) show the relative gene body coverage distributions for the SMT enzyme and Maxima enzyme, respectively. Appropriate institutional regulatory board permission was obtained for the animal experiments.
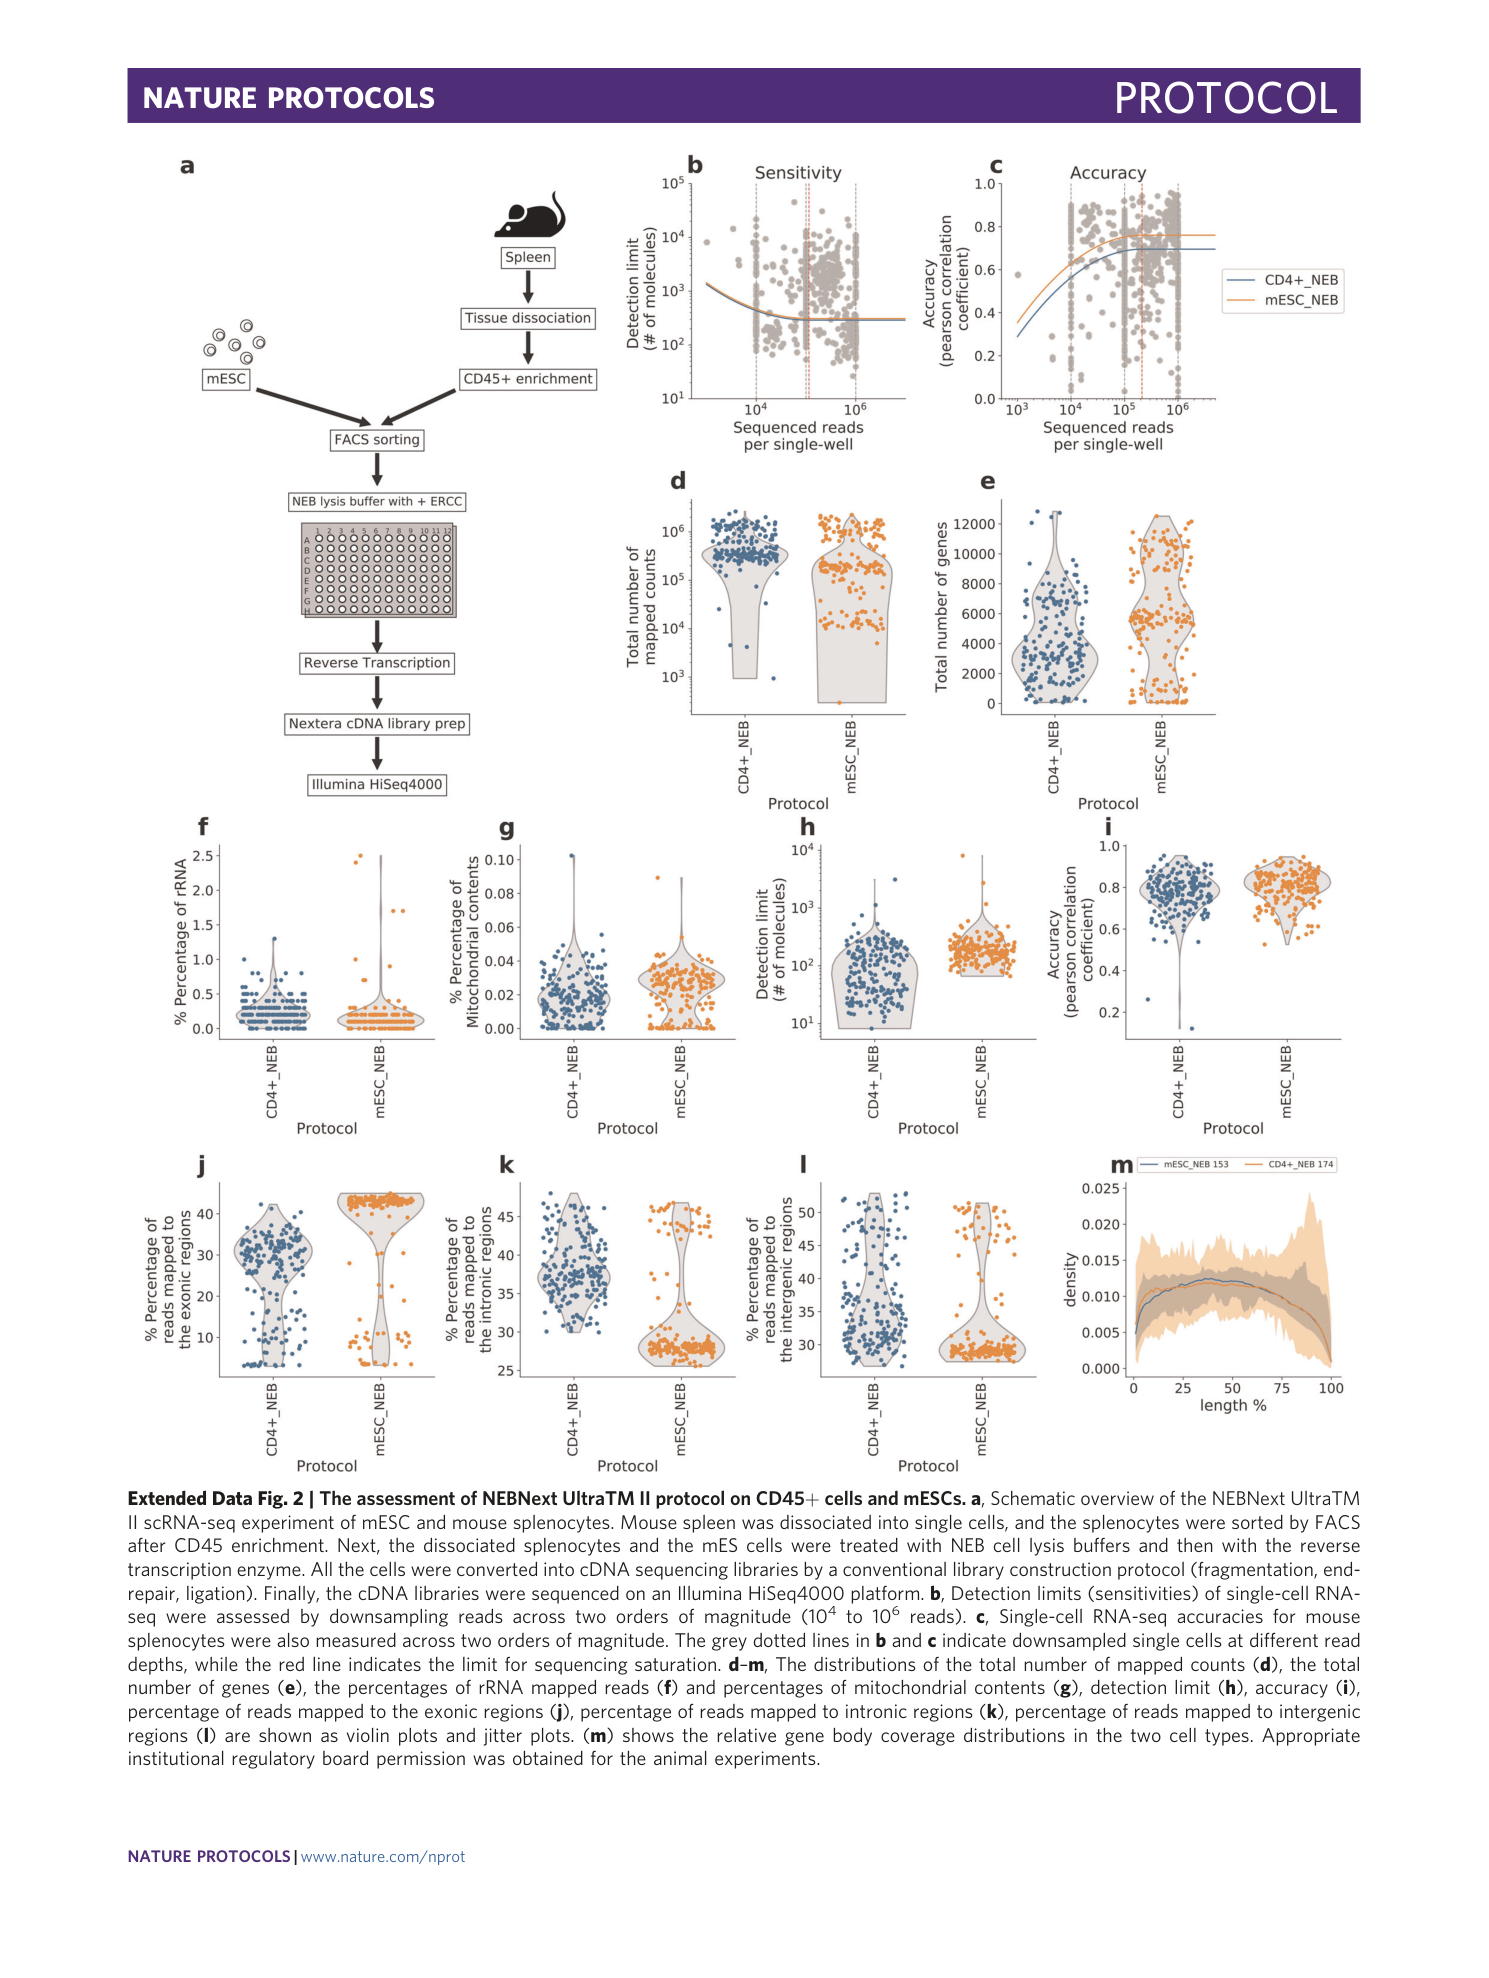
Extended Data Fig. 2 The assessment of NEBNext UltraTM II protocol on CD45+ cells and mESCs.
a , Schematic overview of the NEBNext UltraTM II scRNA-seq experiment of mESC and mouse splenocytes. Mouse spleen was dissociated into single cells, and the splenocytes were sorted by FACS after CD45 enrichment. Next, the dissociated splenocytes and the mES cells were treated with NEB cell lysis buffers and then with the reverse transcription enzyme. All the cells were converted into cDNA sequencing libraries by a conventional library construction protocol (fragmentation, end-repair, ligation). Finally, the cDNA libraries were sequenced on an Illumina HiSeq4000 platform. b , Detection limits (sensitivities) of single-cell RNA-seq were assessed by downsampling reads across two orders of magnitude (10 4 to 10 6 reads). c , Single-cell RNA-seq accuracies for mouse splenocytes were also measured across two orders of magnitude. The grey dotted lines in b and c indicate downsampled single cells at different read depths, while the red line indicates the limit for sequencing saturation. d – m , The distributions of the total number of mapped counts ( d ), the total number of genes ( e ), the percentages of rRNA mapped reads ( f ) and percentages of mitochondrial contents ( g ), detection limit ( h ), accuracy ( i ), percentage of reads mapped to the exonic regions ( j ), percentage of reads mapped to intronic regions ( k ), percentage of reads mapped to intergenic regions ( l ) are shown as violin plots and jitter plots. ( m ) shows the relative gene body coverage distributions in the two cell types. Appropriate institutional regulatory board permission was obtained for the animal experiments.
Supplementary information
Supplementary Information
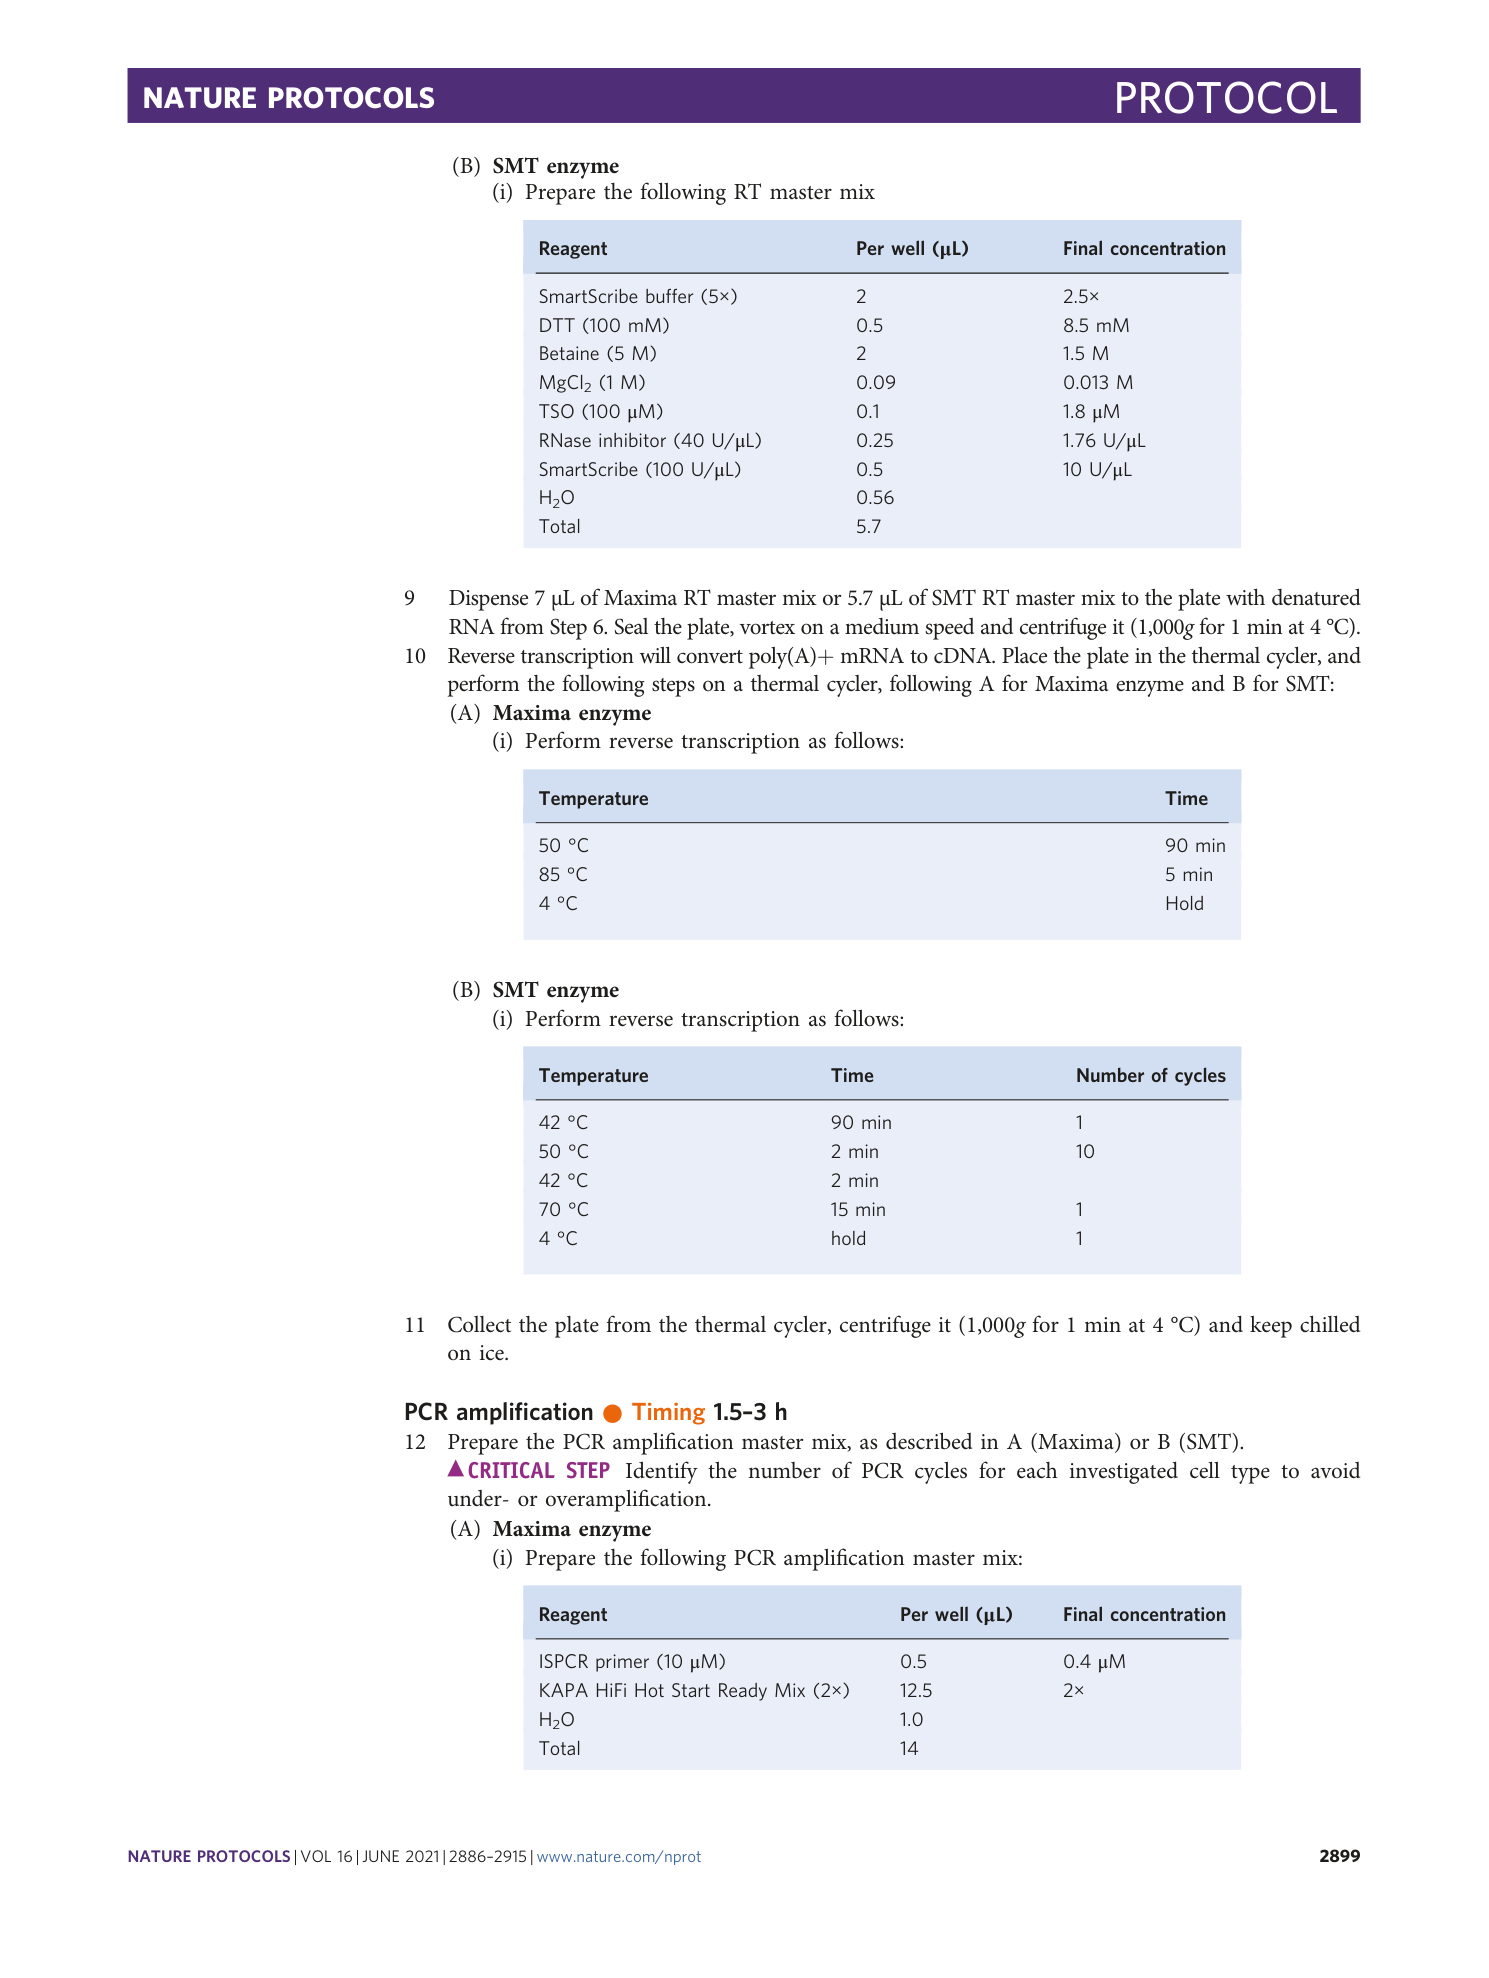
Supplementary Figs. 1–7, Supplementary Tables 1–3, Supplementary Methods and Supplementary Protocol.
