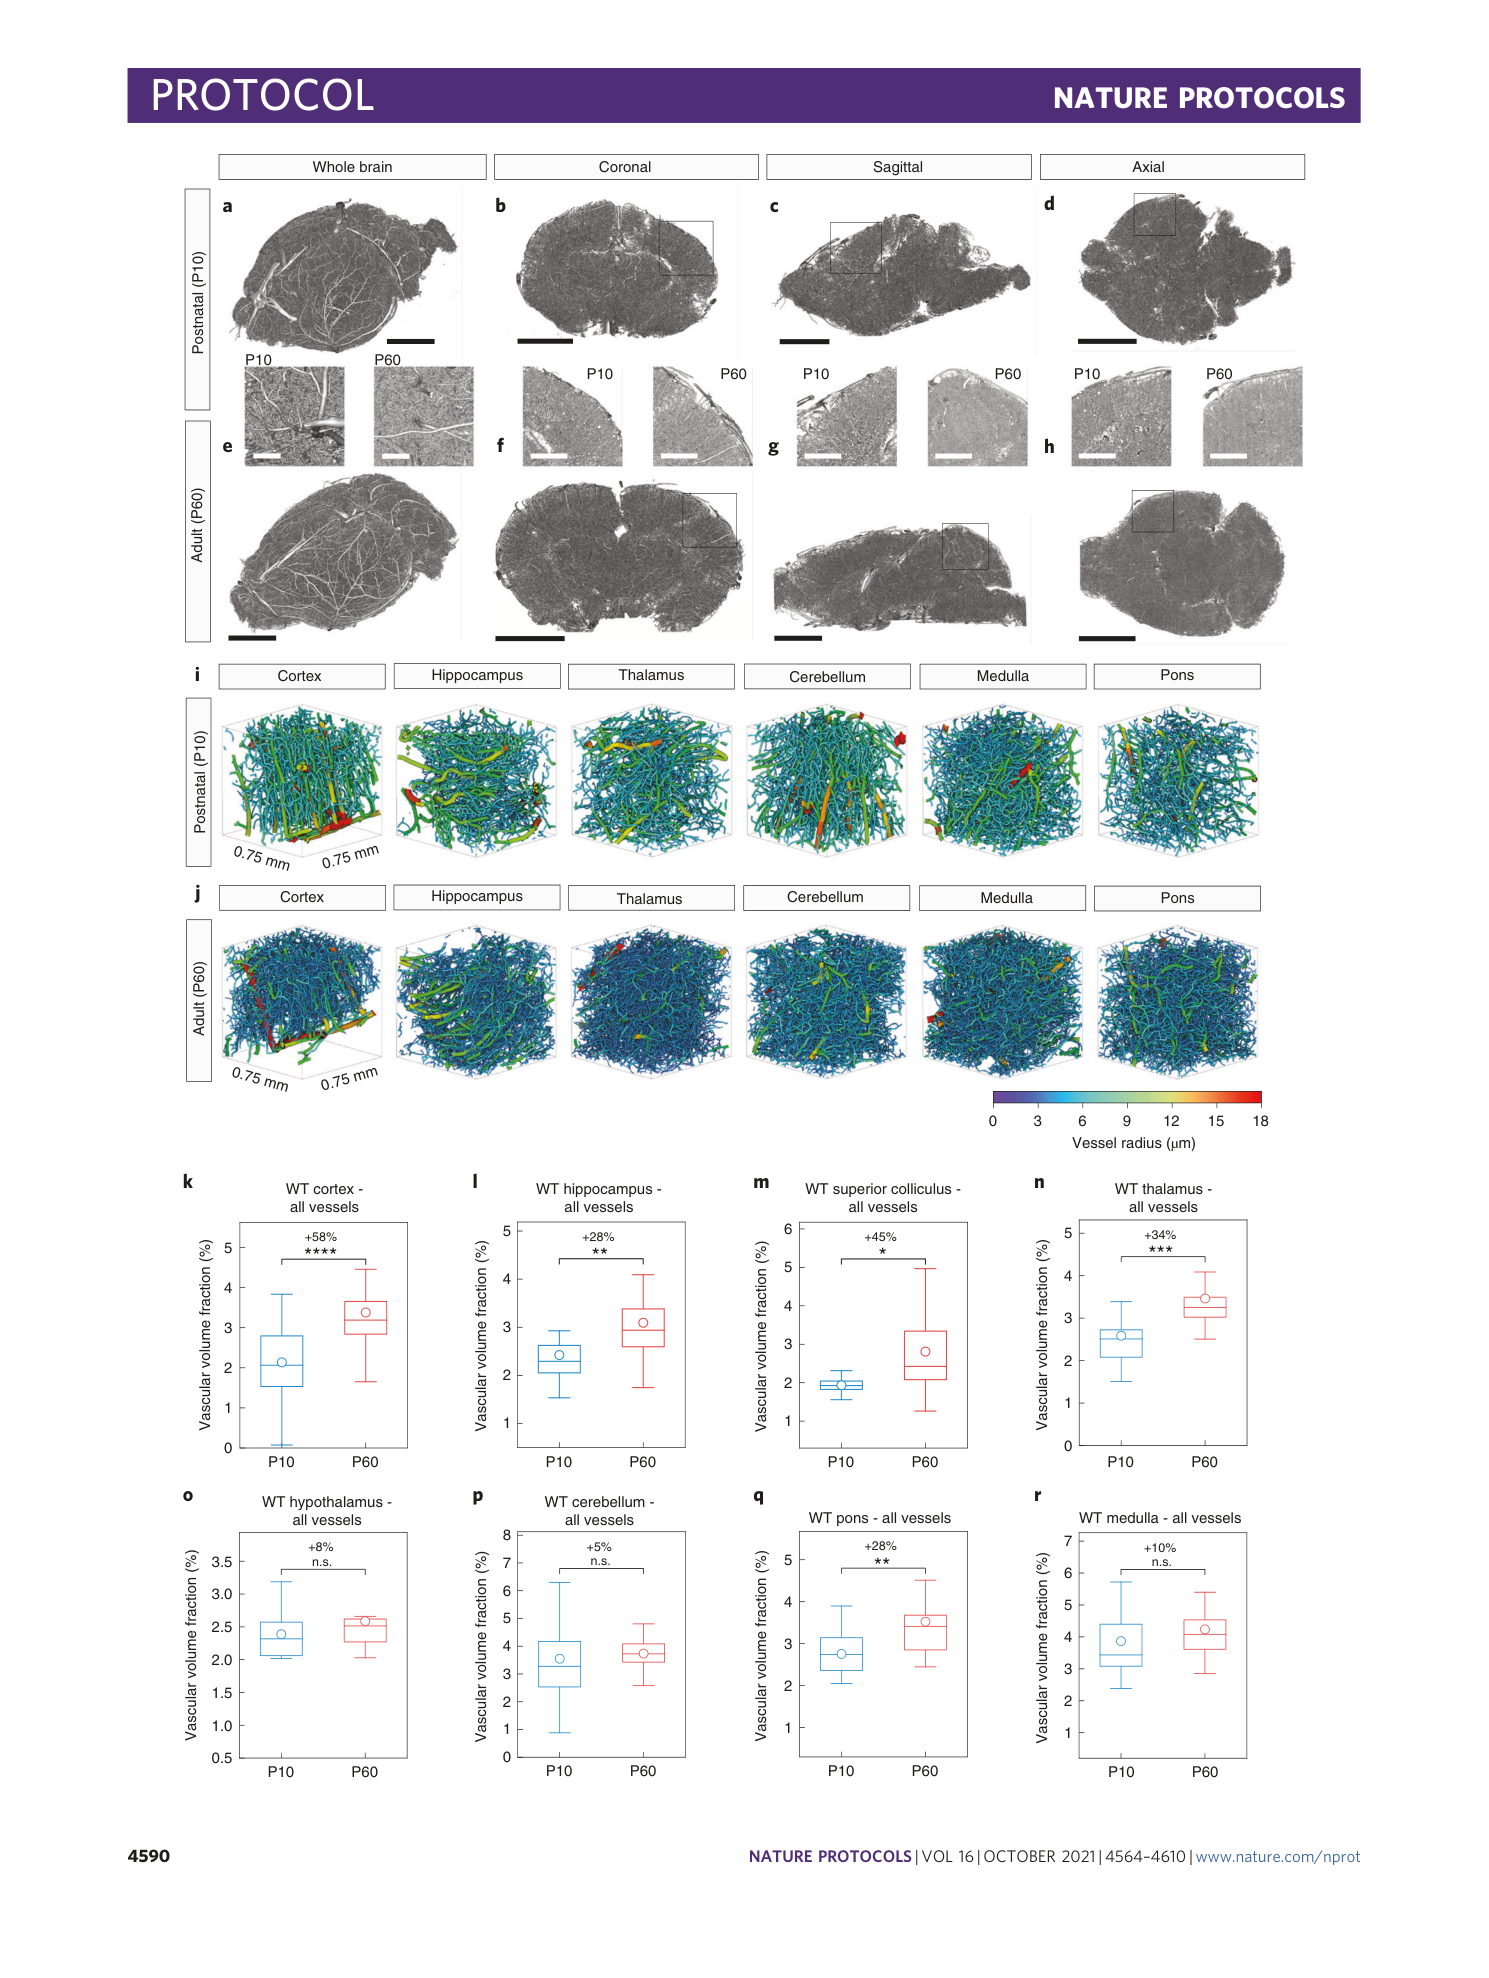
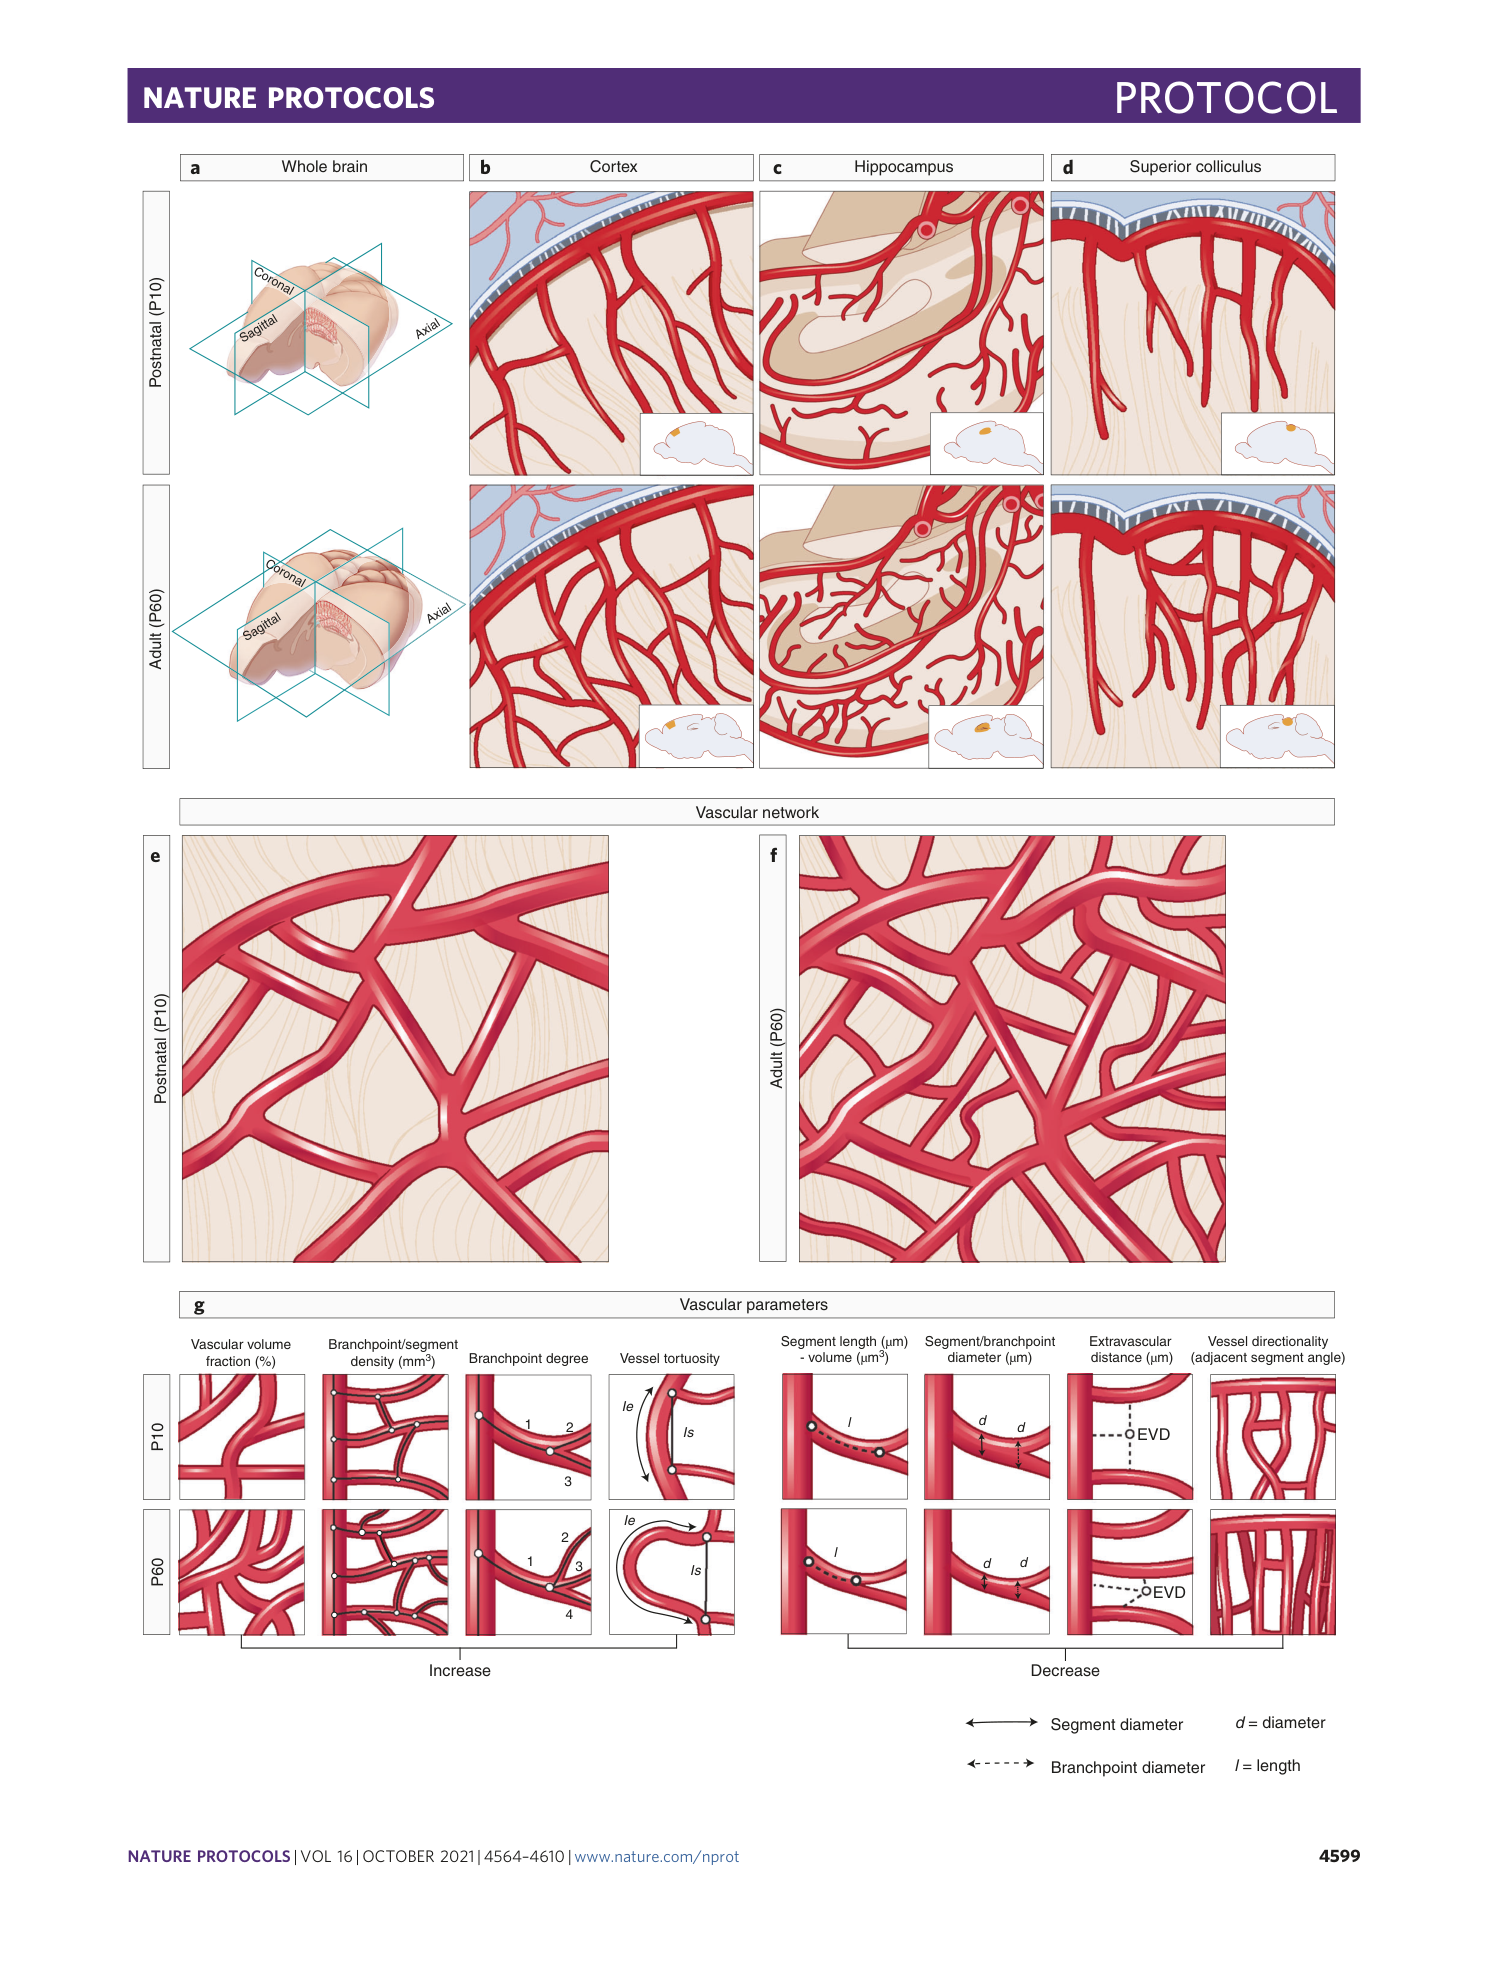
Hierarchical imaging and computational analysis of three-dimensional vascular network architecture in the entire postnatal and adult mouse brain
Thomas Wälchli, Jeroen Bisschop, Arttu Miettinen, Alexandra Ulmann-Schuler, Christoph Hintermüller, Eric P. Meyer, Thomas Krucker, Regula Wälchli, Philippe P. Monnier, Peter Carmeliet, Johannes Vogel, Marco Stampanoni


Extended
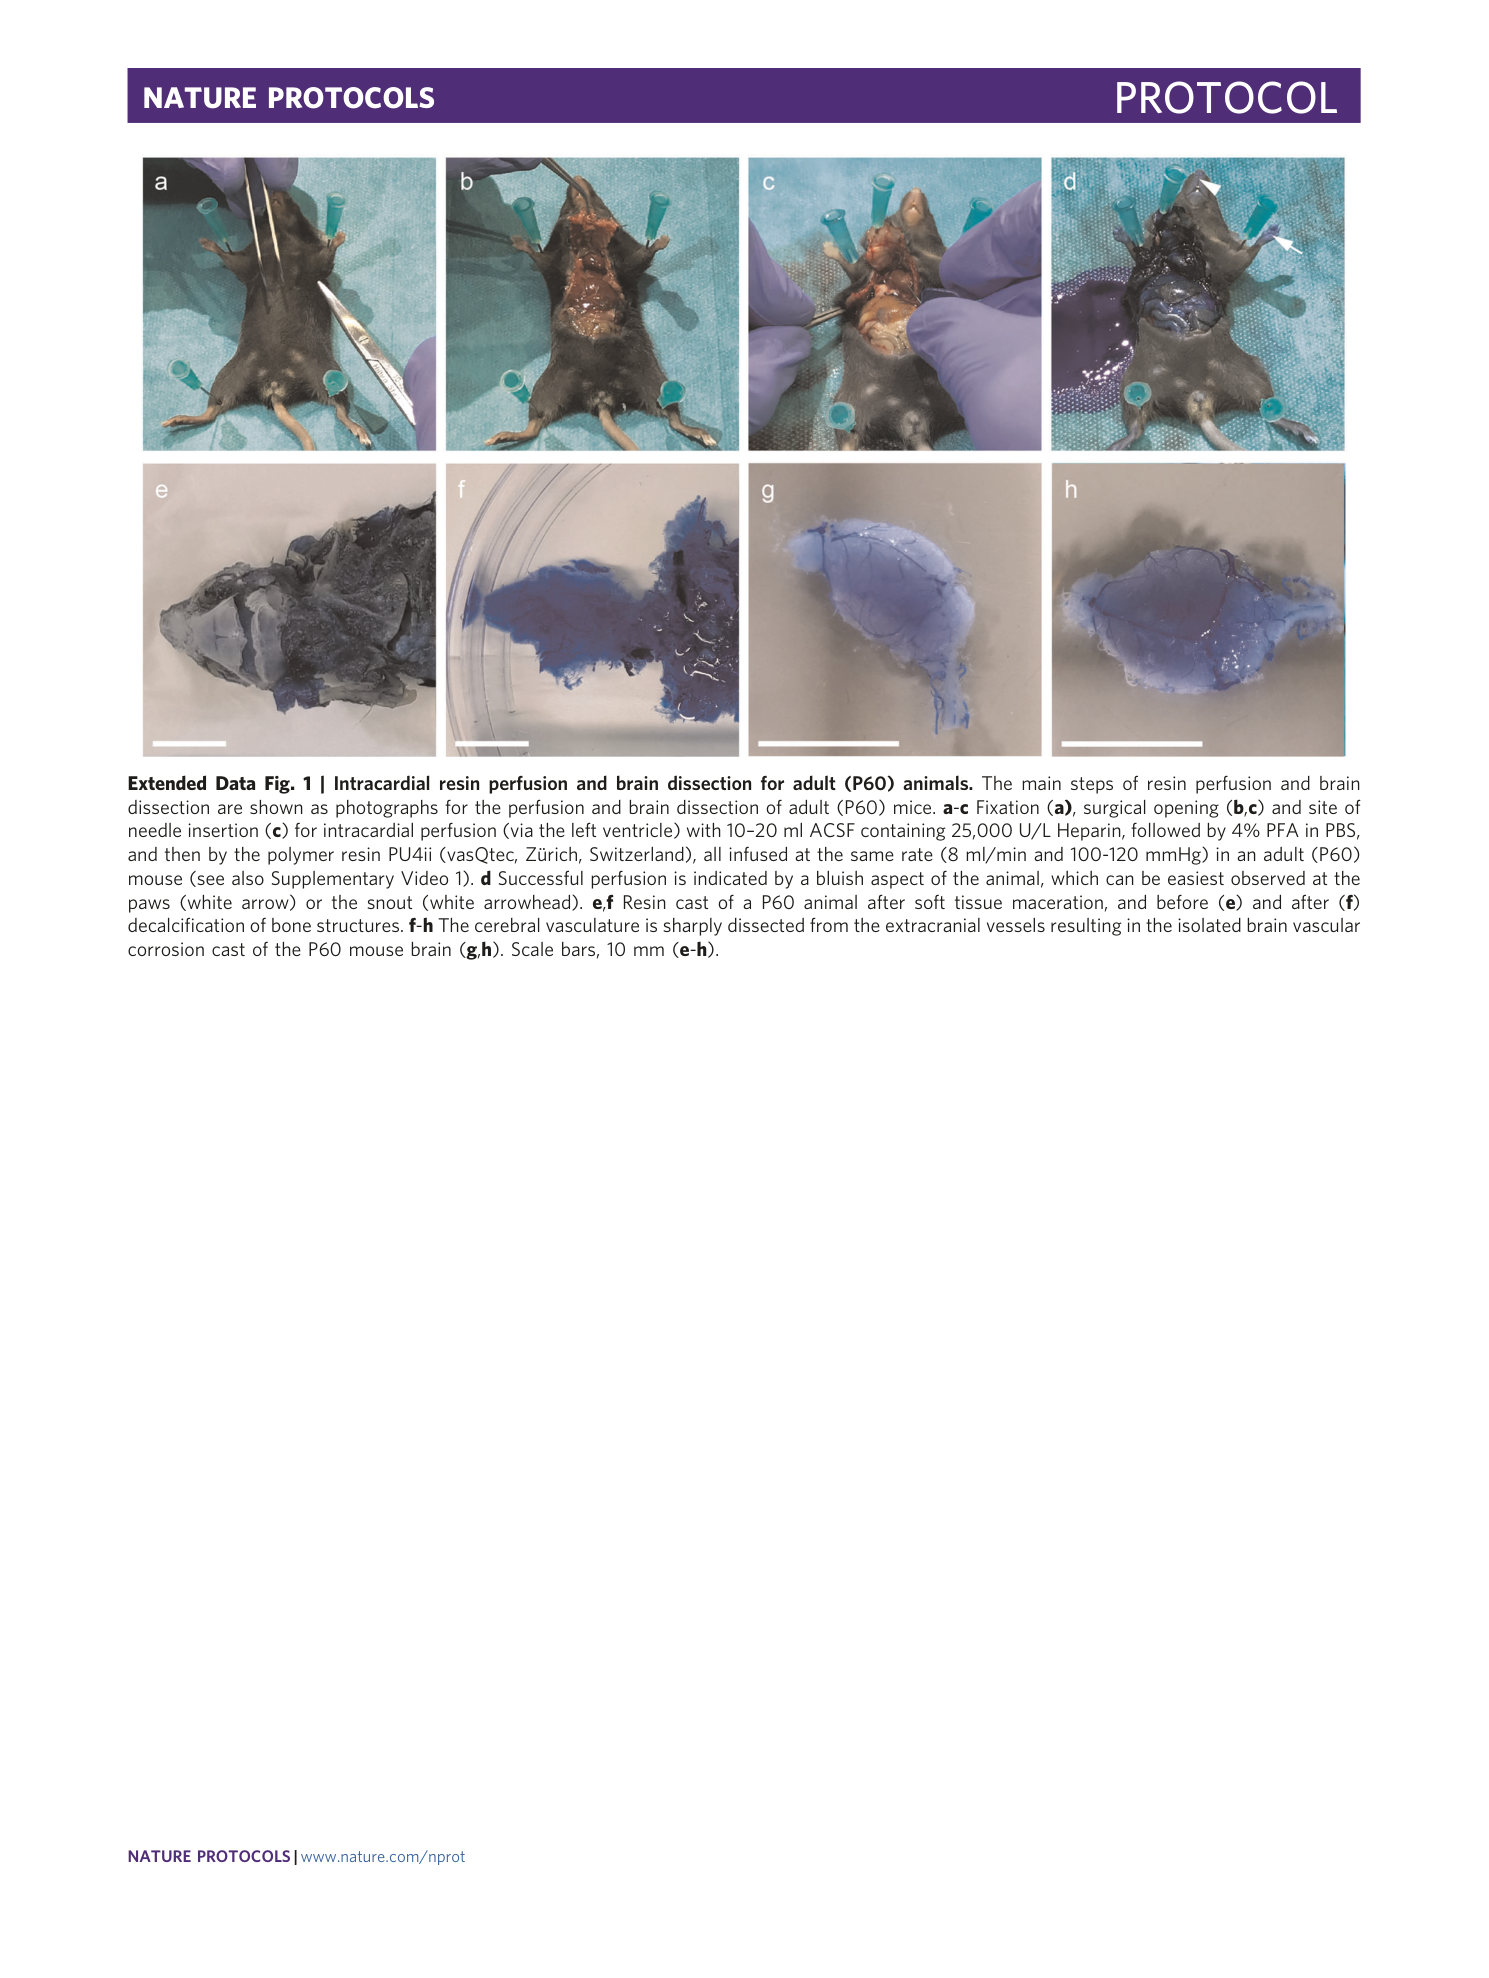
Extended Data Fig. 1 Intracardial resin perfusion and brain dissection for adult (P60) animals.
The main steps of resin perfusion and brain dissection are shown as photographs for the perfusion and brain dissection of adult (P60) mice. a - c Fixation ( a) , surgical opening ( b , c ) and site of needle insertion ( c ) for intracardial perfusion (via the left ventricle) with 10–20 ml ACSF containing 25,000 U/L Heparin, followed by 4% PFA in PBS, and then by the polymer resin PU4ii (vasQtec, Zürich, Switzerland), all infused at the same rate (8 ml/min and 100-120 mmHg) in an adult (P60) mouse (see also Supplementary Video 1 ). d Successful perfusion is indicated by a bluish aspect of the animal, which can be easiest observed at the paws (white arrow) or the snout (white arrowhead). e , f Resin cast of a P60 animal after soft tissue maceration, and before ( e ) and after ( f ) decalcification of bone structures. f - h The cerebral vasculature is sharply dissected from the extracranial vessels resulting in the isolated brain vascular corrosion cast of the P60 mouse brain ( g , h ). Scale bars, 10 mm ( e - h ).
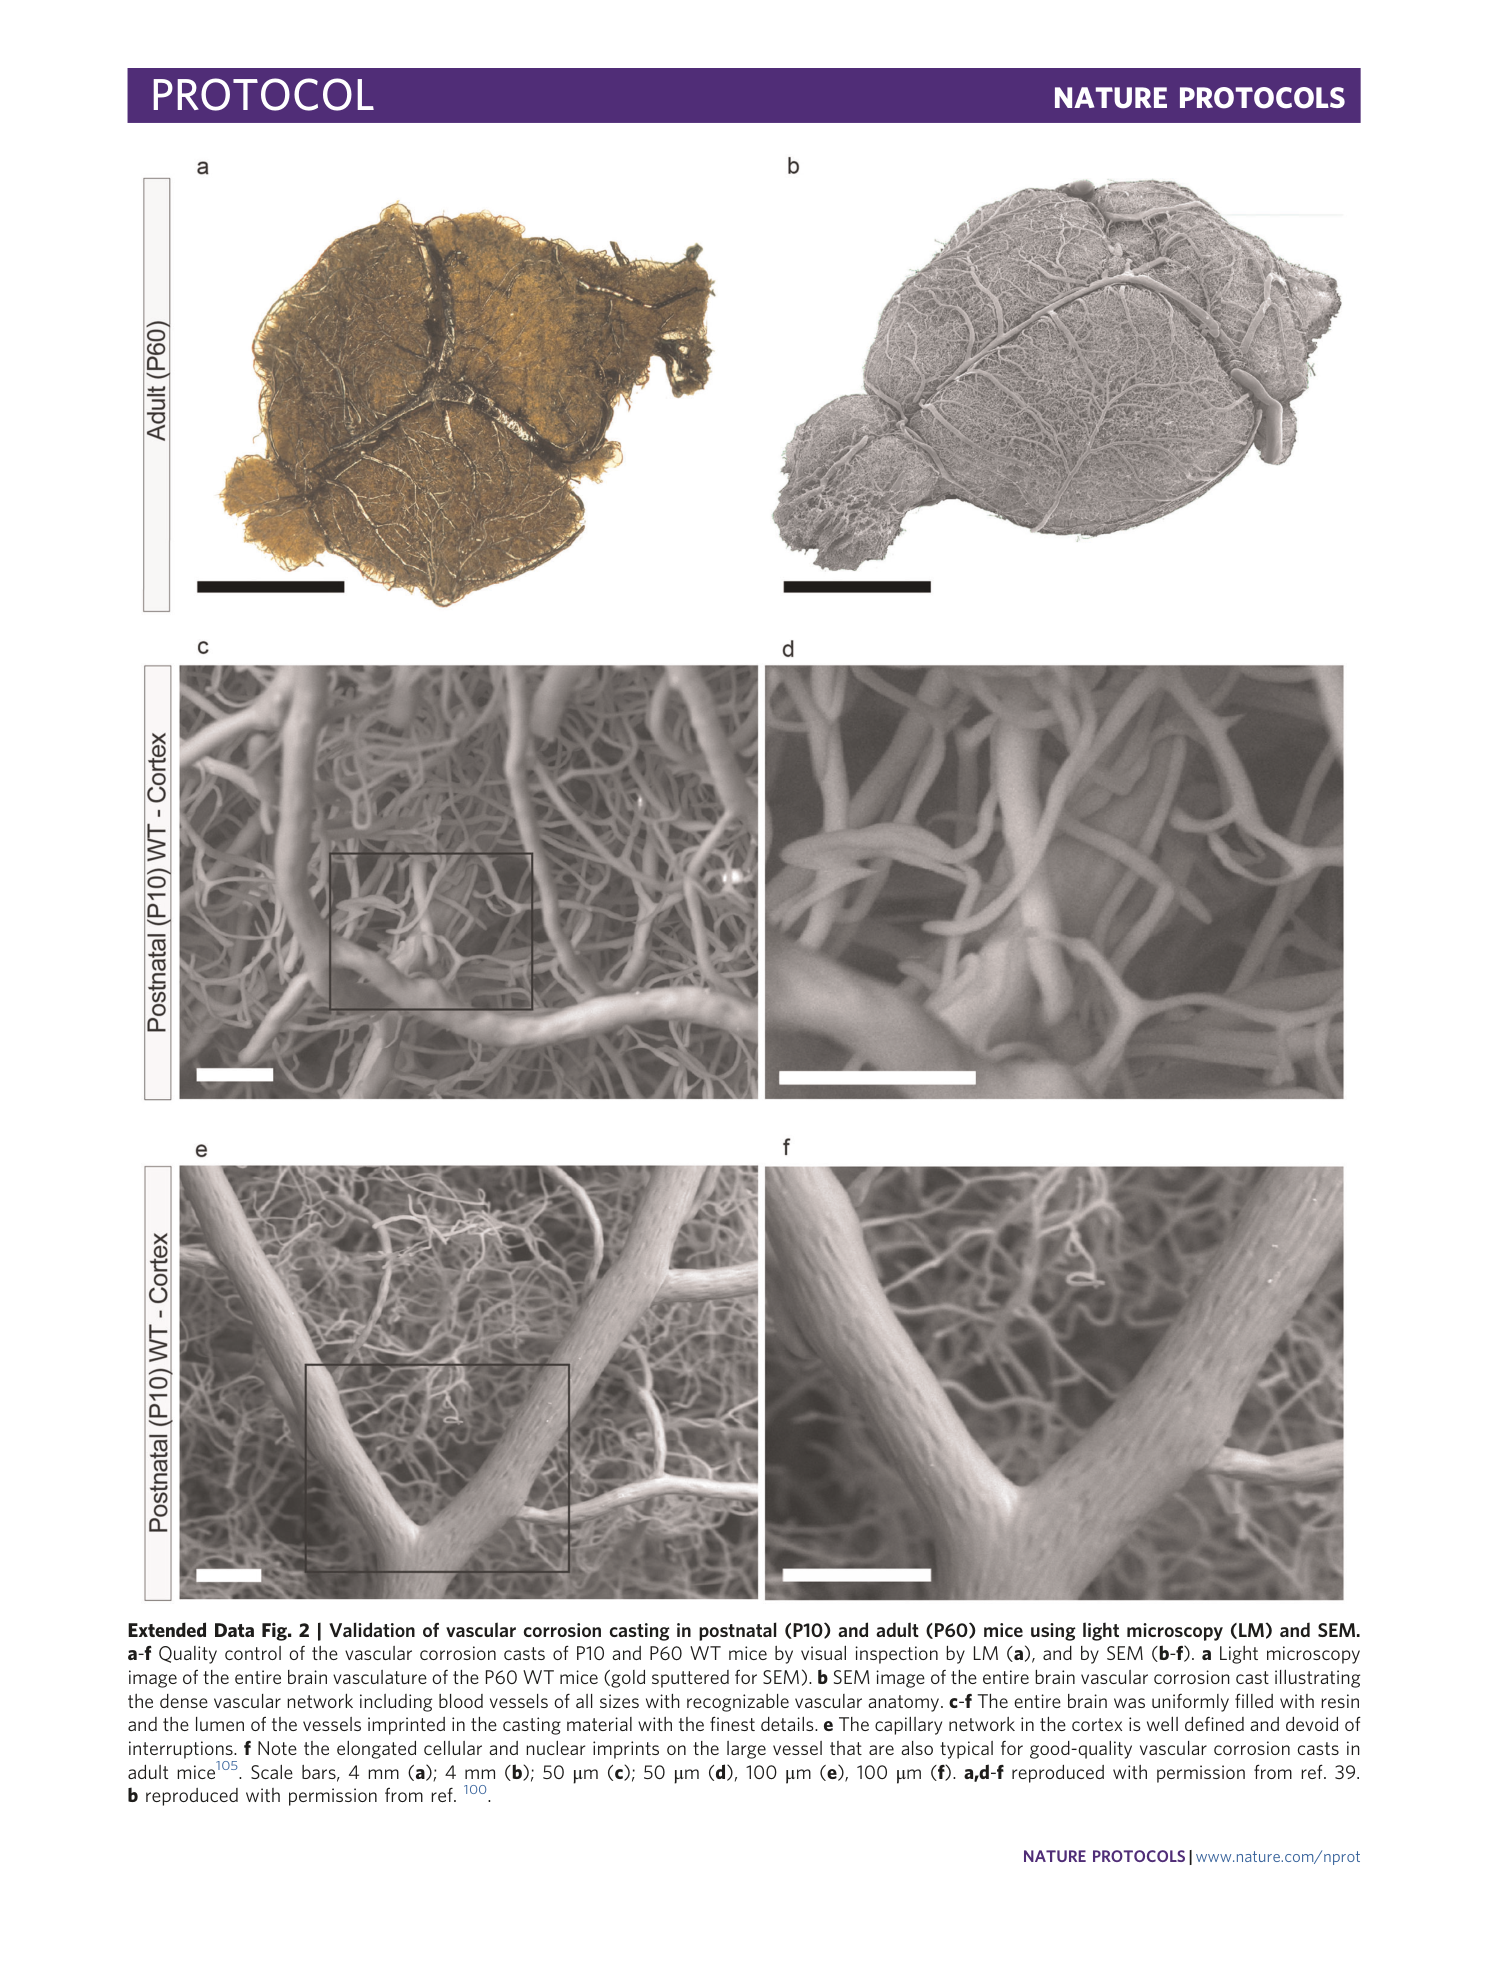
Extended Data Fig. 2 Validation of vascular corrosion casting in postnatal (P10) and adult (P60) mice using light microscopy (LM) and SEM.
a - f Quality control of the vascular corrosion casts of P10 and P60 WT mice by visual inspection by LM ( a ), and by SEM ( b - f ). a Light microscopy image of the entire brain vasculature of the P60 WT mice (gold sputtered for SEM). b SEM image of the entire brain vascular corrosion cast illustrating the dense vascular network including blood vessels of all sizes with recognizable vascular anatomy. c - f The entire brain was uniformly filled with resin and the lumen of the vessels imprinted in the casting material with the finest details. e The capillary network in the cortex is well defined and devoid of interruptions. f Note the elongated cellular and nuclear imprints on the large vessel that are also typical for good-quality vascular corrosion casts in adult mice 105 . Scale bars, 4 mm ( a ); 4 mm ( b ); 50 μm ( c ); 50 μm ( d ), 100 μm ( e ), 100 μm ( f ). a,d - f reproduced with permission from ref. 39. b reproduced with permission from ref. 100 .
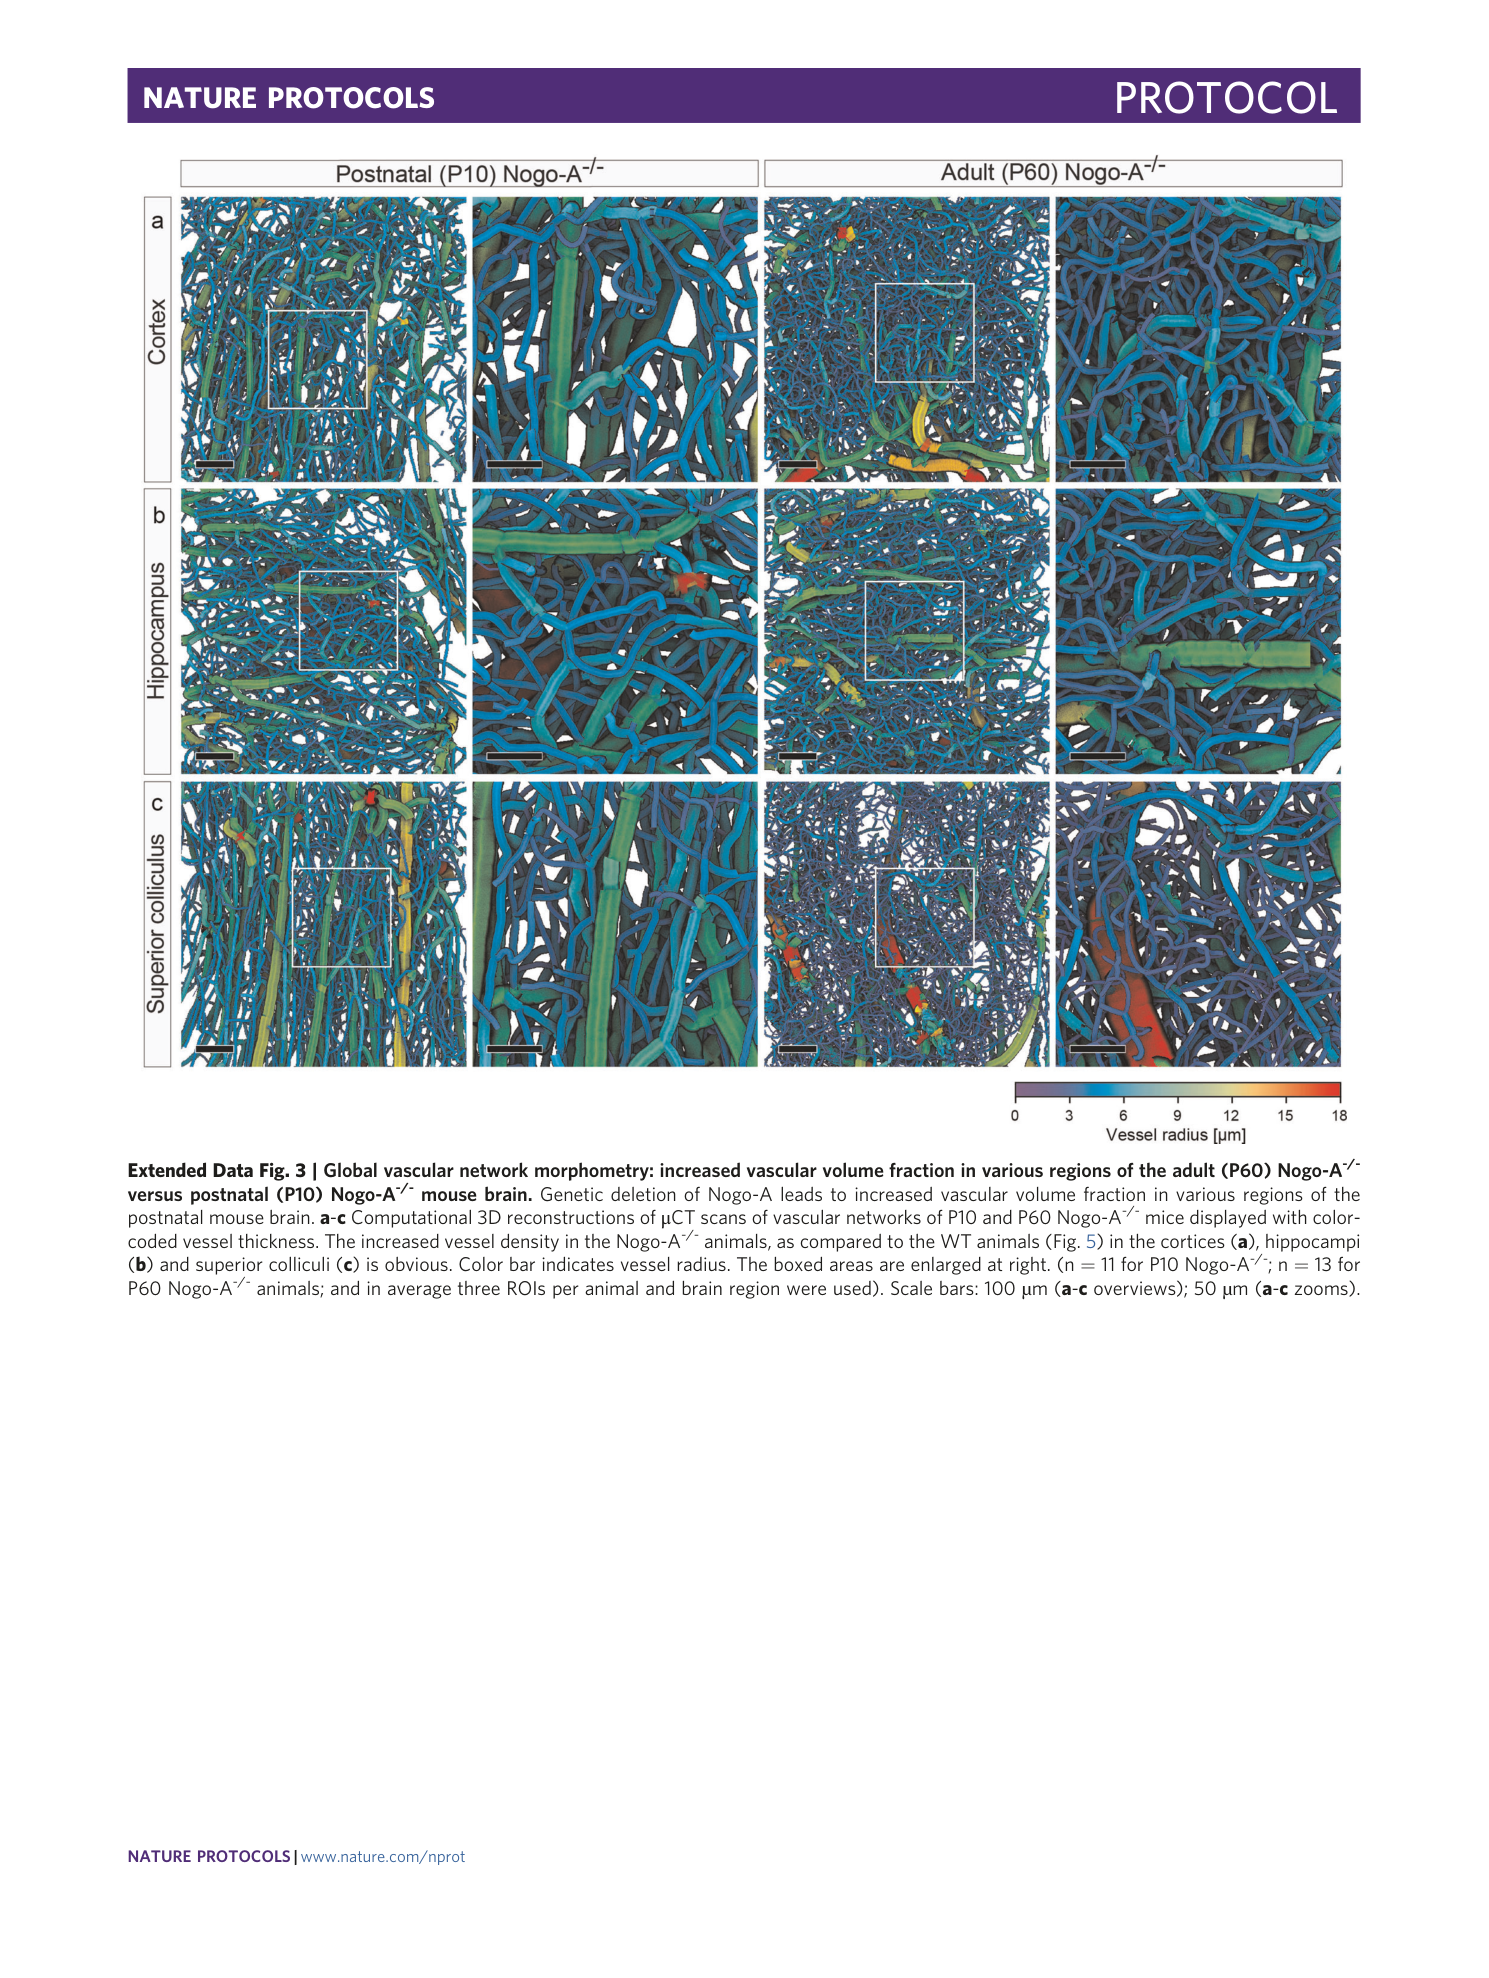
Extended Data Fig. 3 Global vascular network morphometry: increased vascular volume fraction in various regions of the adult (P60) Nogo-A -/- versus postnatal (P10) Nogo-A -/- mouse brain.
Genetic deletion of Nogo-A leads to increased vascular volume fraction in various regions of the postnatal mouse brain. a - c Computational 3D reconstructions of μCT scans of vascular networks of P10 and P60 Nogo-A -/- mice displayed with color-coded vessel thickness. The increased vessel density in the Nogo-A -/- animals, as compared to the WT animals (Fig. 5 ) in the cortices ( a ), hippocampi ( b ) and superior colliculi ( c ) is obvious. Color bar indicates vessel radius. The boxed areas are enlarged at right. (n = 11 for P10 Nogo-A -/- ; n = 13 for P60 Nogo-A -/- animals; and in average three ROIs per animal and brain region were used). Scale bars: 100 µm ( a - c overviews); 50 µm ( a - c zooms).
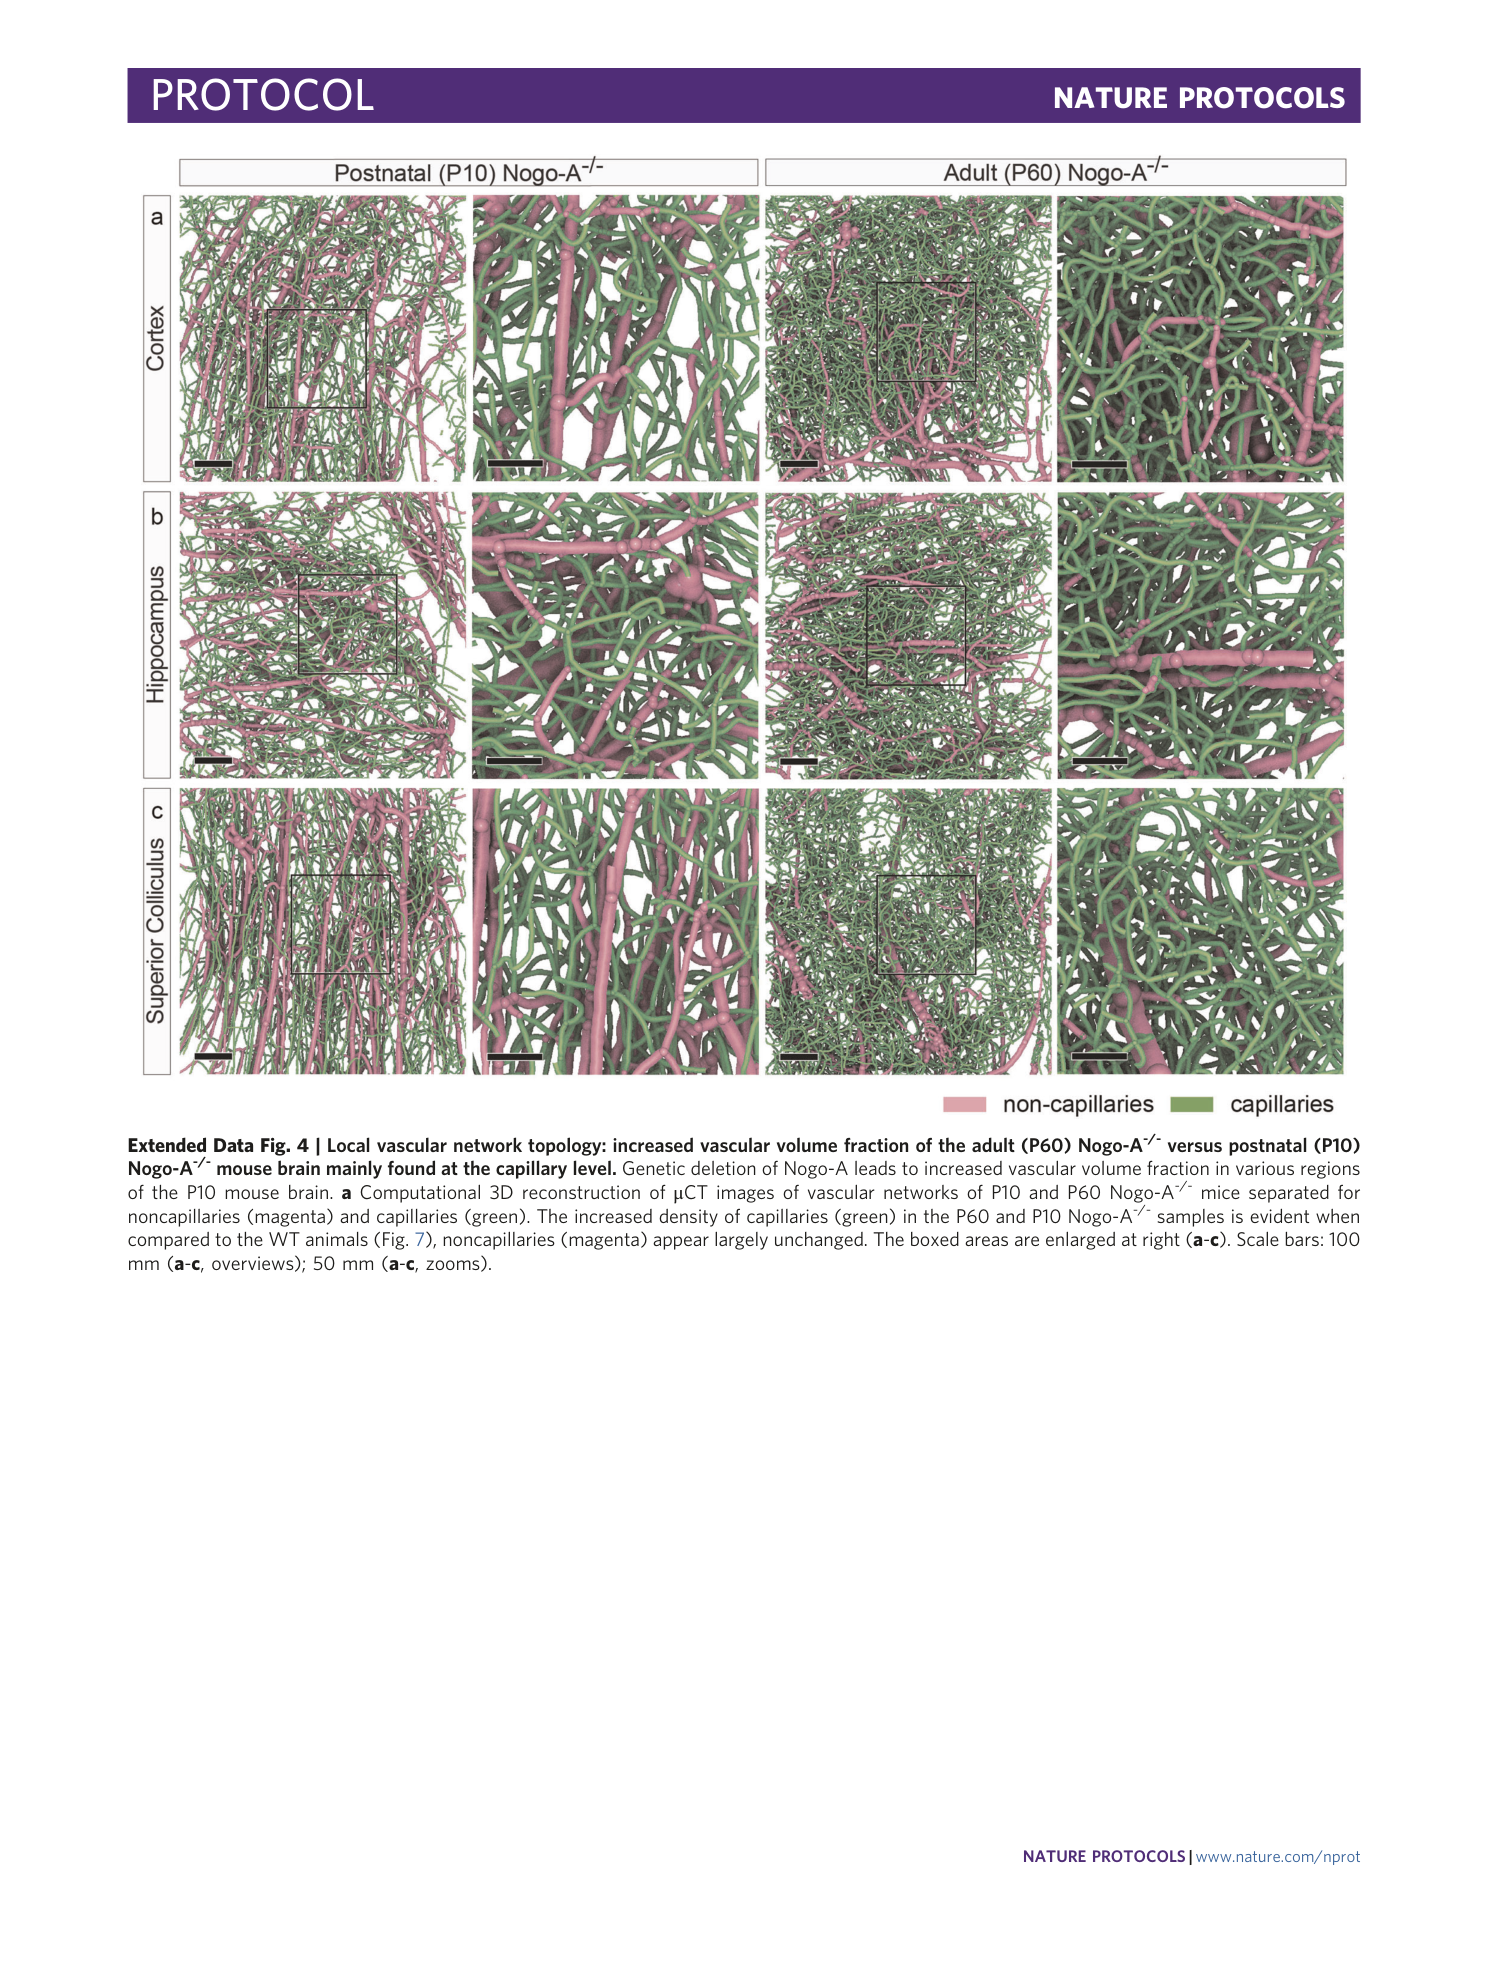
Extended Data Fig. 4 Local vascular network topology: increased vascular volume fraction of the adult (P60) Nogo-A -/- versus postnatal (P10) Nogo-A -/- mouse brain mainly found at the capillary level.
Genetic deletion of Nogo-A leads to increased vascular volume fraction in various regions of the P10 mouse brain. a Computational 3D reconstruction of μCT images of vascular networks of P10 and P60 Nogo-A -/- mice separated for noncapillaries (magenta) and capillaries (green). The increased density of capillaries (green) in the P60 and P10 Nogo-A -/- samples is evident when compared to the WT animals (Fig. 7 ), noncapillaries (magenta) appear largely unchanged. The boxed areas are enlarged at right ( a - c ). Scale bars: 100 mm ( a - c , overviews); 50 mm ( a - c , zooms).
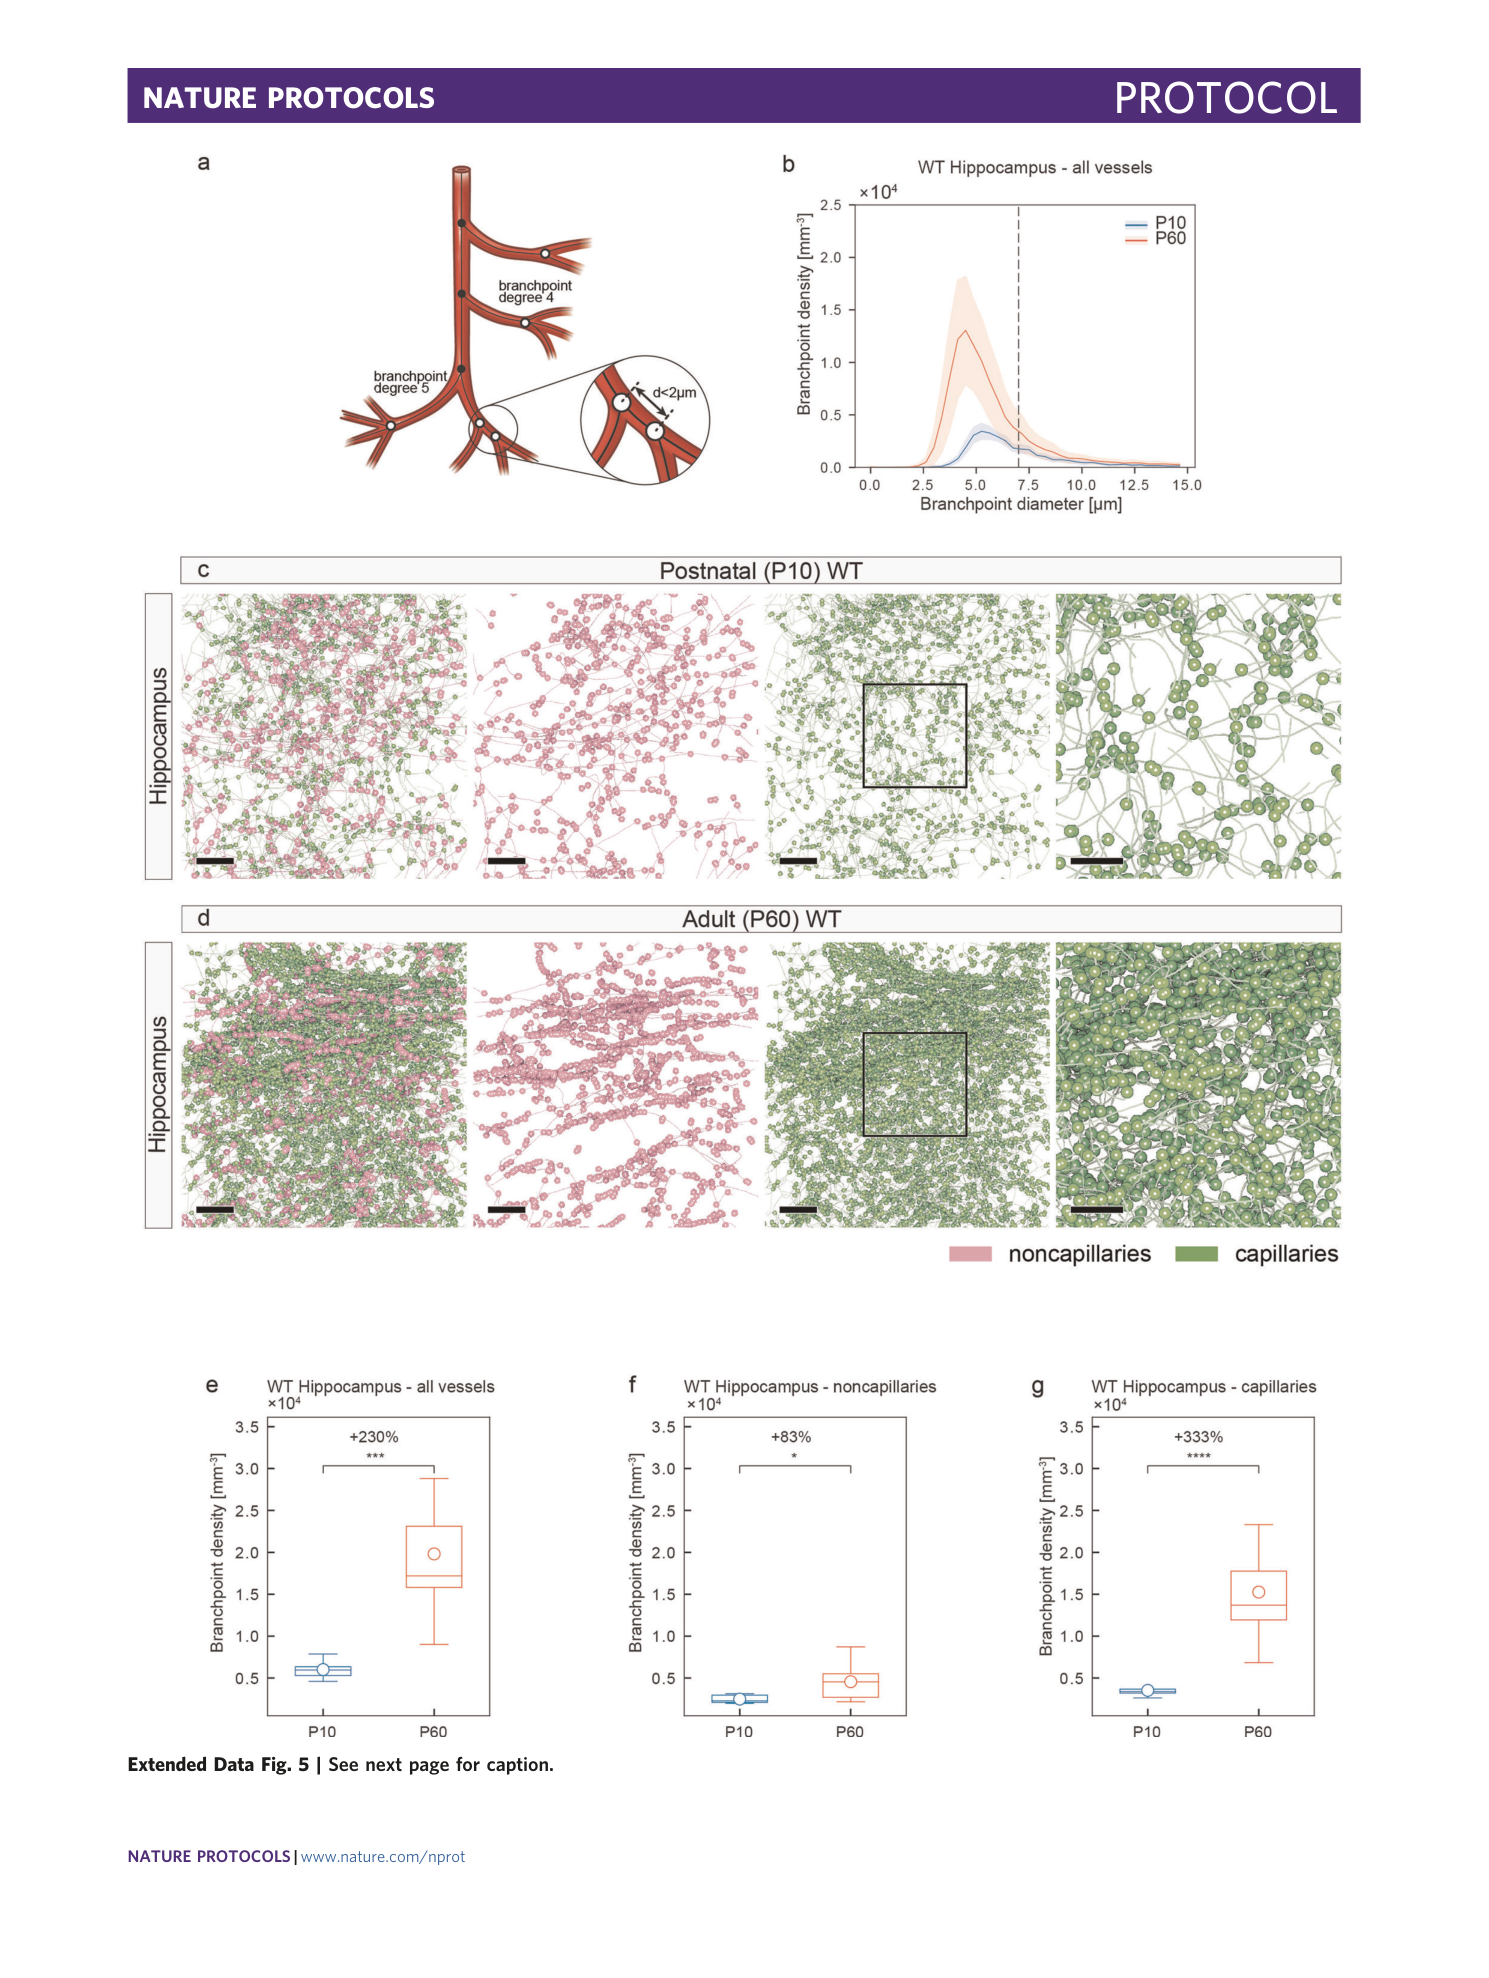
Extended Data Fig. 5 Local vascular network topology: visualization and quantification of vascular branch point diameter and vascular branch point density in the hippocampus of the adult (P60) WT versus the postnatal (P10) WT mouse brain.
The vascular branch point diameter and vascular branch point density are significantly increased in the P60 as compared to the P10 mouse brain hippocampus. a Scheme depicting the definition of vascular branch points (see Fig. 8b for details) b Histogram showing the distribution of branch point diameter plotted against the branch point density in P10 WT and P60 WT animals. P60 WT animals show an increased branch point density as compared to P10 WT (bin width = 0.38 μm; number of bins = 40). Black dashed line marks the separation between capillaries (< 7 μm) and non-capillaries (≥7 μm), as defined in Fig. 6 . c,d Computational 3D reconstructions of μCT images of vascular networks in the hippocampi of P10 WT and P60 WT mice with visualizations of the vessel branch points displayed as dots, separated for noncapillaries (magenta) and capillaries (green). The higher density of branch points in the P60 WT hippocampi especially at the capillary level (green) is obvious, a slight increase of branch point density can be observed at the noncapillary level (magenta). The boxed areas are enlarged at right. e – g Quantitative analysis of the branch point density for all vessels ( e ), noncapillaries ( f ), and capillaries ( g ) in P10 WT and P60 WT hippocampi by local morphometry analysis. The significant increase of the branch point density for all vessels in the P60 WT animals ( e ) was mainly due to a significant increase at the level of capillaries ( g ) and in part due to a significant increase at the level of noncapillaries ( f ). In average, n = 2-7 animals were used for the hippocampi and in average three ROIs per animal and brain region were used. All data are shown as mean distributions where the open dot represents the mean. Boxplots indicate the 25% to 75% quartiles of the data. The shaded blue and red areas indicate the SD. * P < 0.05, ** P < 0.01, *** P < 0.001. Scale bars: 100 µm ( c - d overviews); 50 µm ( c - d zooms).
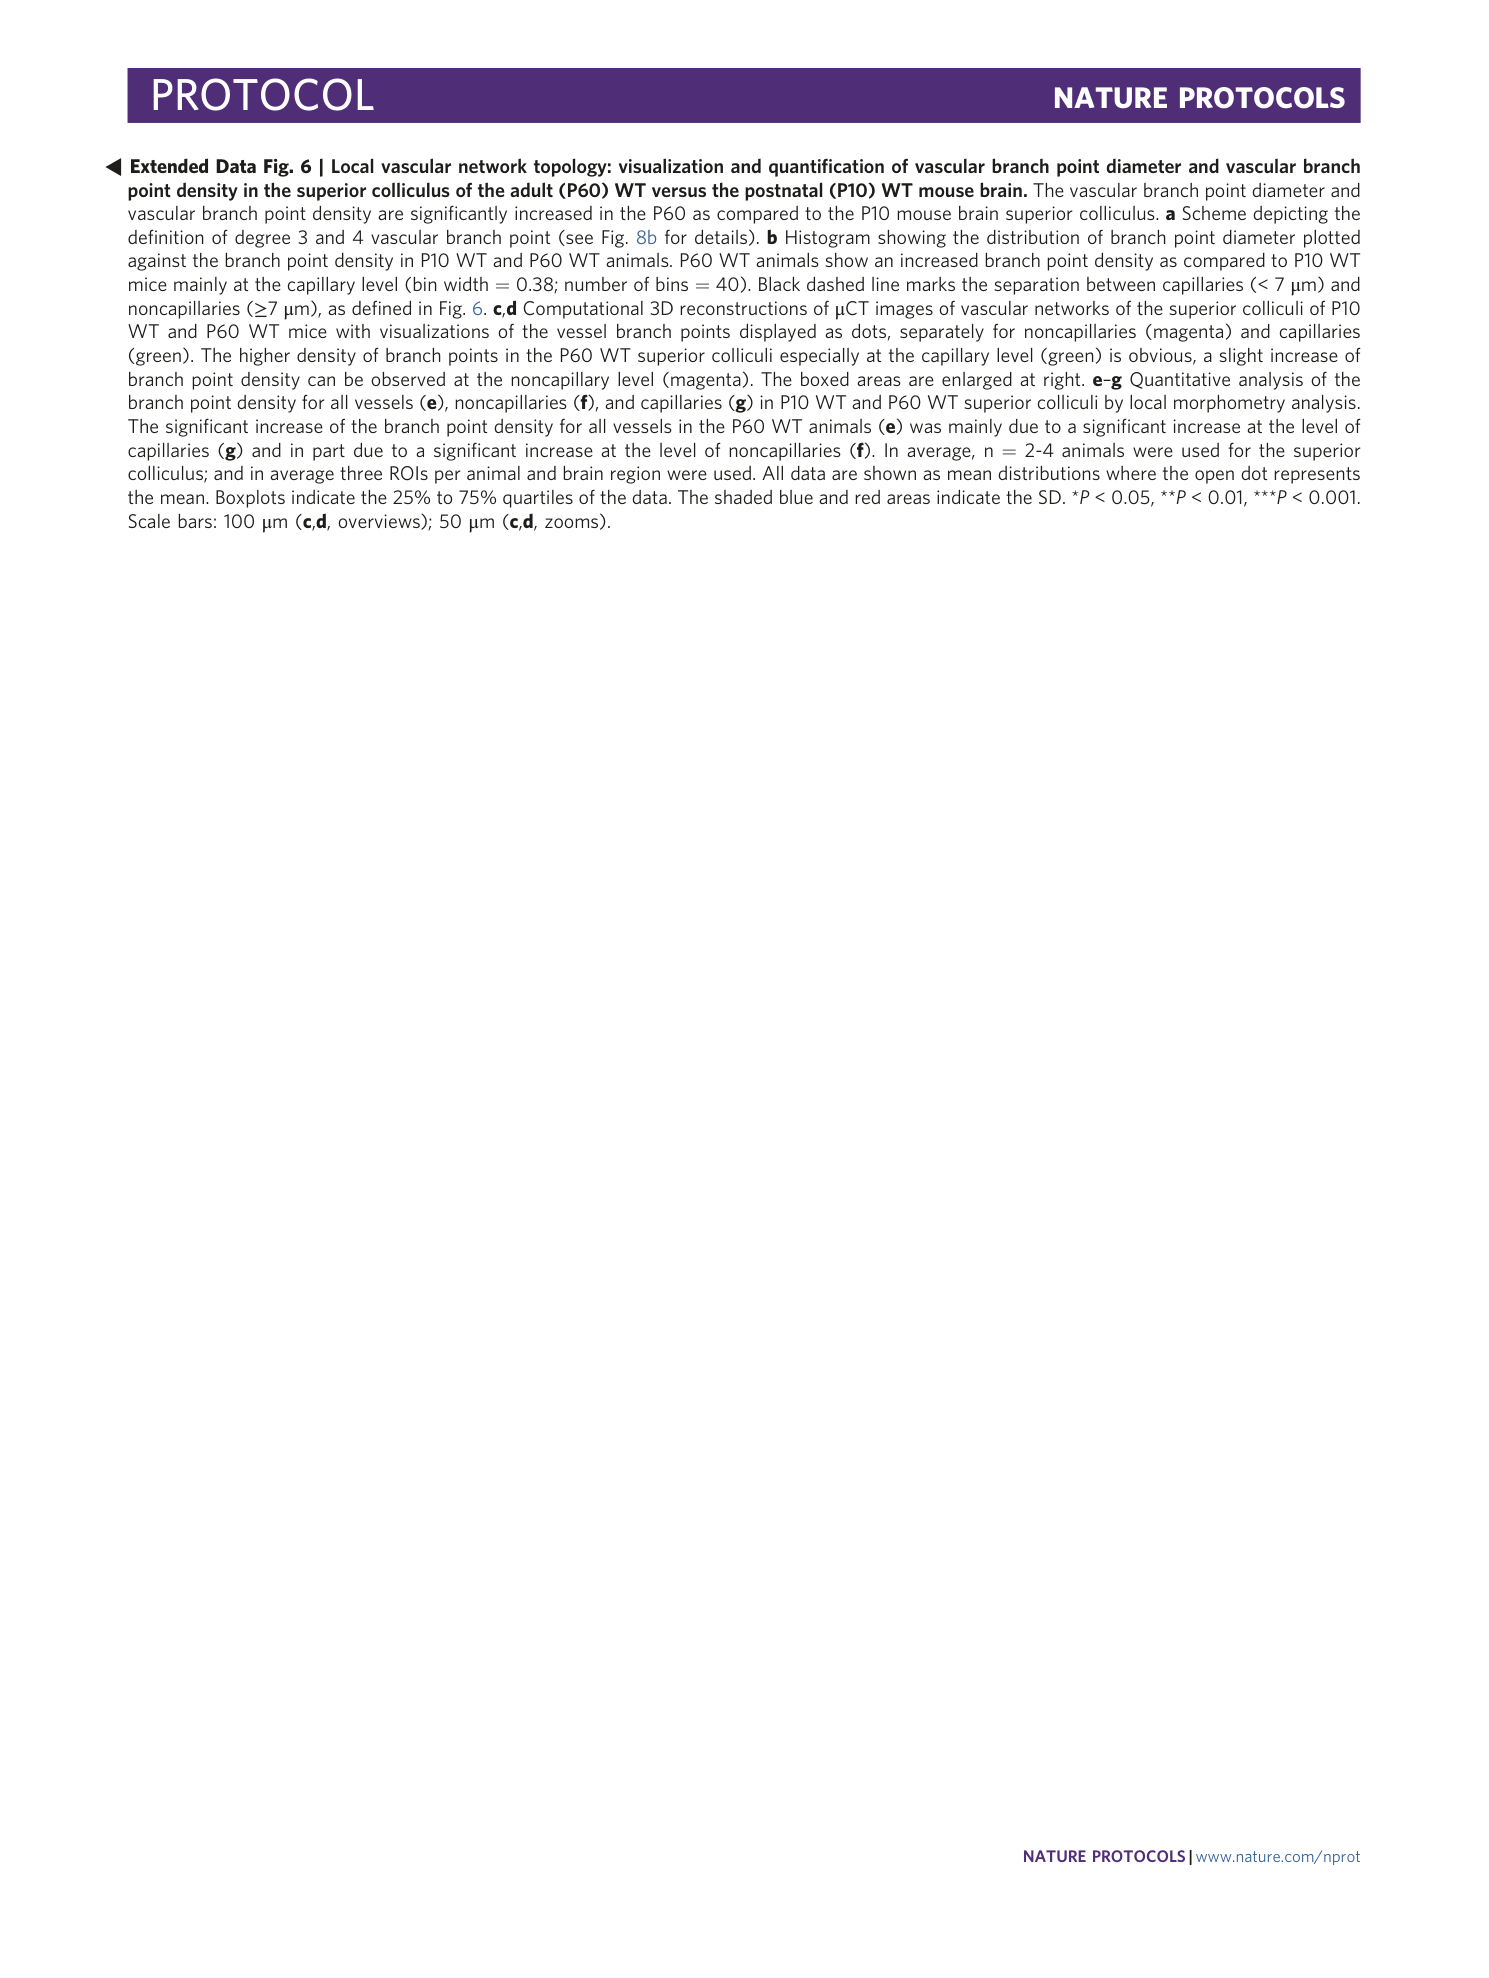
Extended Data Fig. 6 Local vascular network topology: visualization and quantification of vascular branch point diameter and vascular branch point density in the superior colliculus of the adult (P60) WT versus the postnatal (P10) WT mouse brain.
The vascular branch point diameter and vascular branch point density are significantly increased in the P60 as compared to the P10 mouse brain superior colliculus. a Scheme depicting the definition of degree 3 and 4 vascular branch point (see Fig. 8b for details). b Histogram showing the distribution of branch point diameter plotted against the branch point density in P10 WT and P60 WT animals. P60 WT animals show an increased branch point density as compared to P10 WT mice mainly at the capillary level (bin width = 0.38; number of bins = 40). Black dashed line marks the separation between capillaries (< 7 μm) and noncapillaries (≥7 μm), as defined in Fig. 6 . c , d Computational 3D reconstructions of μCT images of vascular networks of the superior colliculi of P10 WT and P60 WT mice with visualizations of the vessel branch points displayed as dots, separately for noncapillaries (magenta) and capillaries (green). The higher density of branch points in the P60 WT superior colliculi especially at the capillary level (green) is obvious, a slight increase of branch point density can be observed at the noncapillary level (magenta). The boxed areas are enlarged at right. e – g Quantitative analysis of the branch point density for all vessels ( e ), noncapillaries ( f ), and capillaries ( g ) in P10 WT and P60 WT superior colliculi by local morphometry analysis. The significant increase of the branch point density for all vessels in the P60 WT animals ( e ) was mainly due to a significant increase at the level of capillaries ( g ) and in part due to a significant increase at the level of noncapillaries ( f ). In average, n = 2-4 animals were used for the superior colliculus; and in average three ROIs per animal and brain region were used. All data are shown as mean distributions where the open dot represents the mean. Boxplots indicate the 25% to 75% quartiles of the data. The shaded blue and red areas indicate the SD. * P < 0.05, ** P < 0.01, *** P < 0.001. Scale bars: 100 μm ( c , d , overviews); 50 μm ( c , d , zooms).
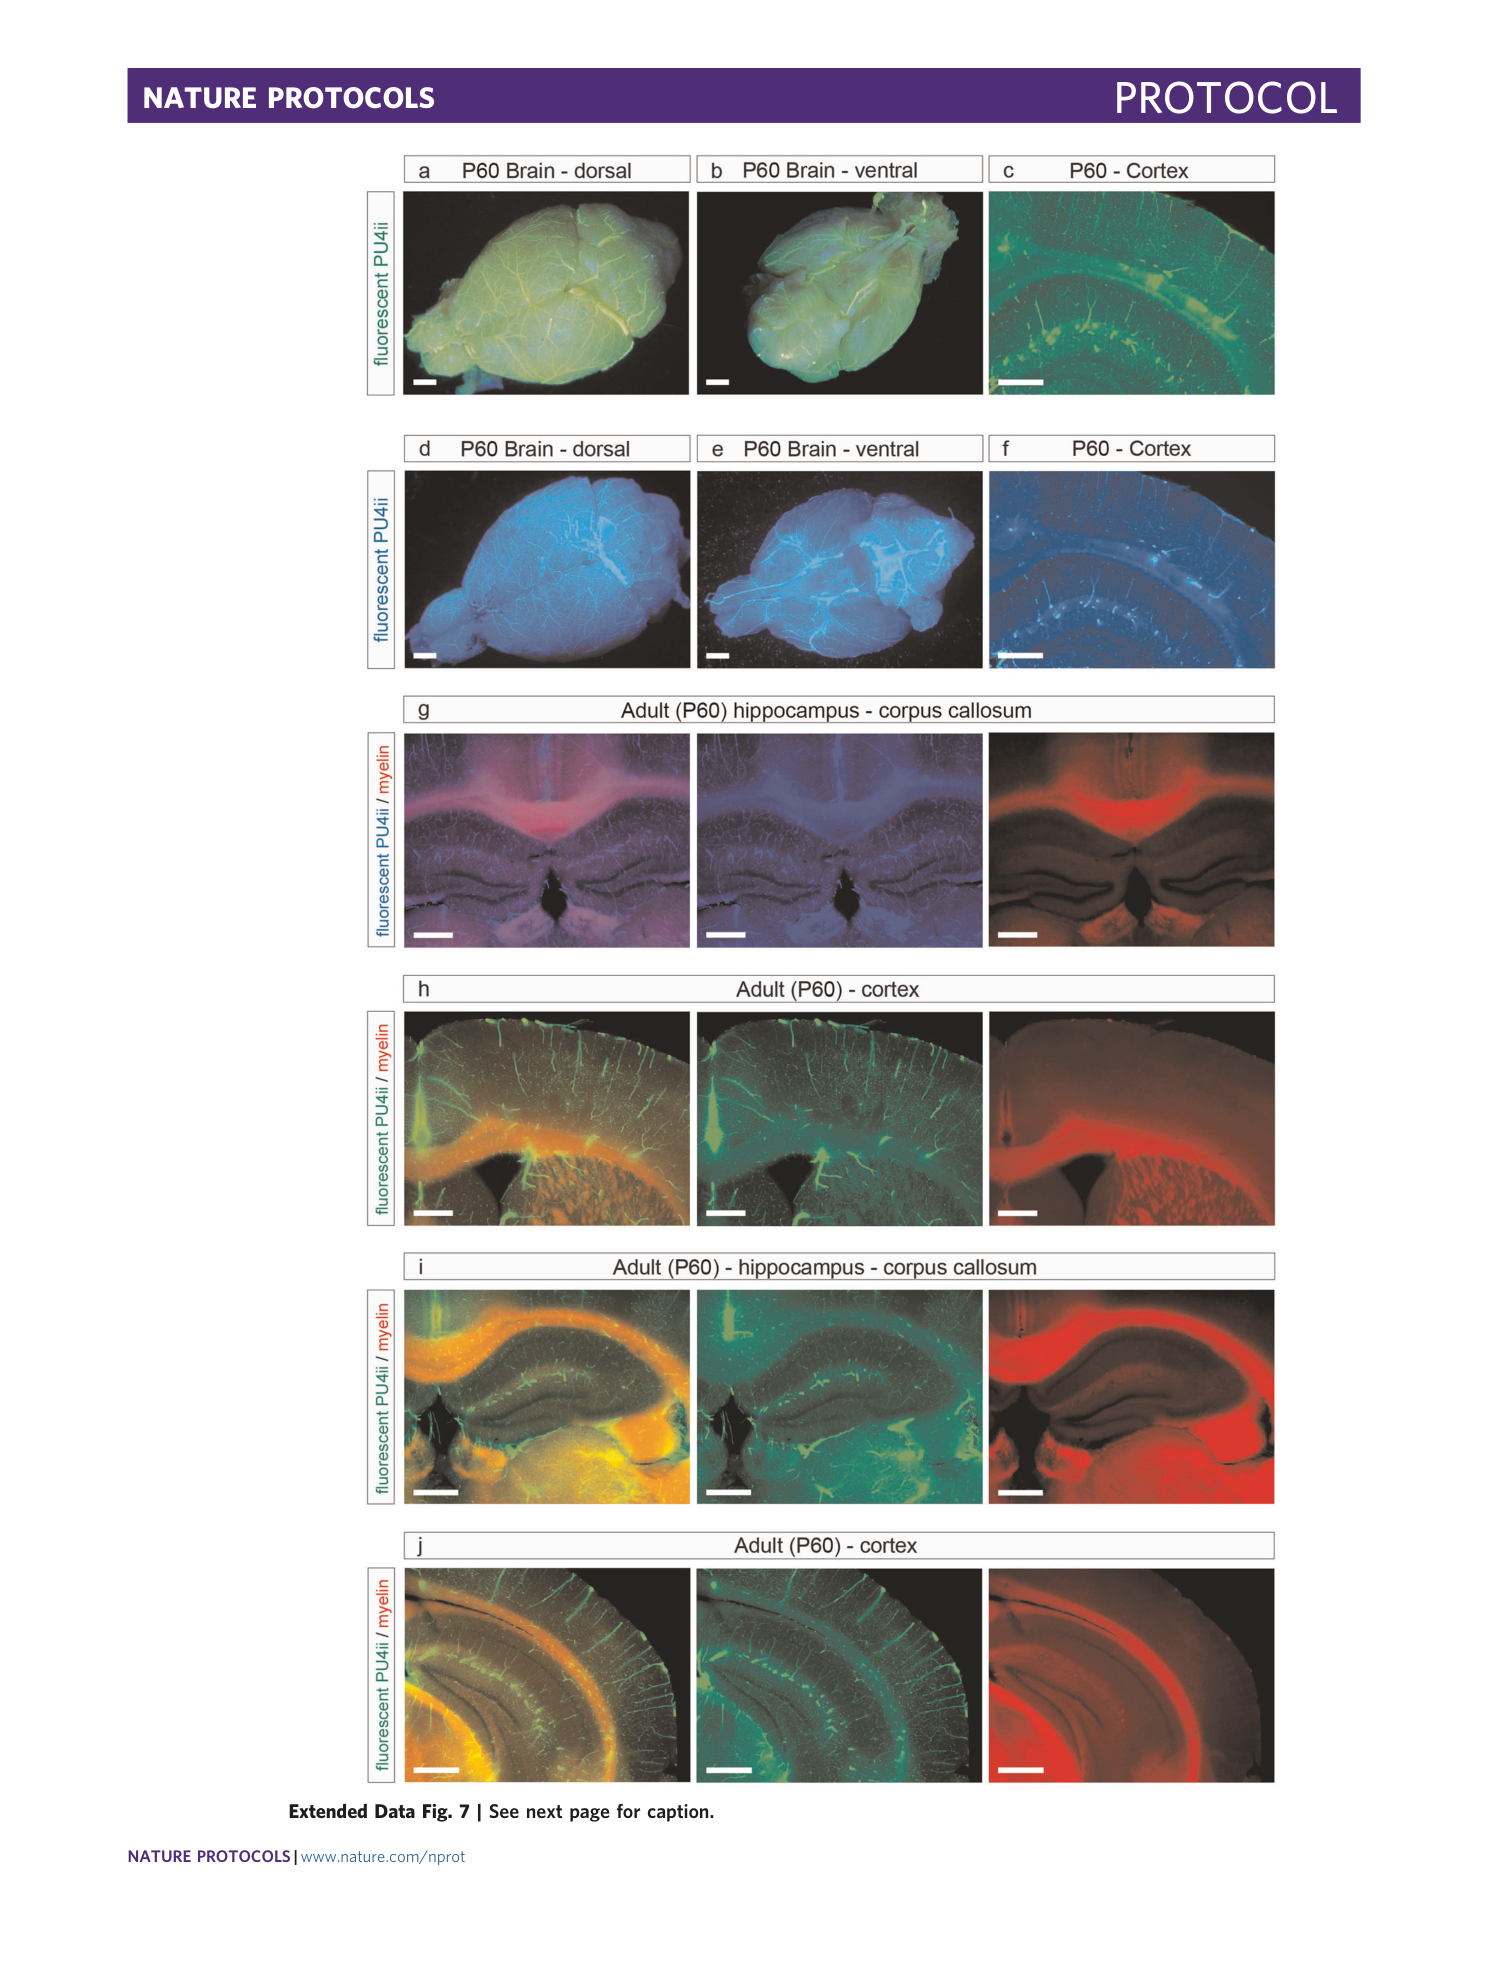
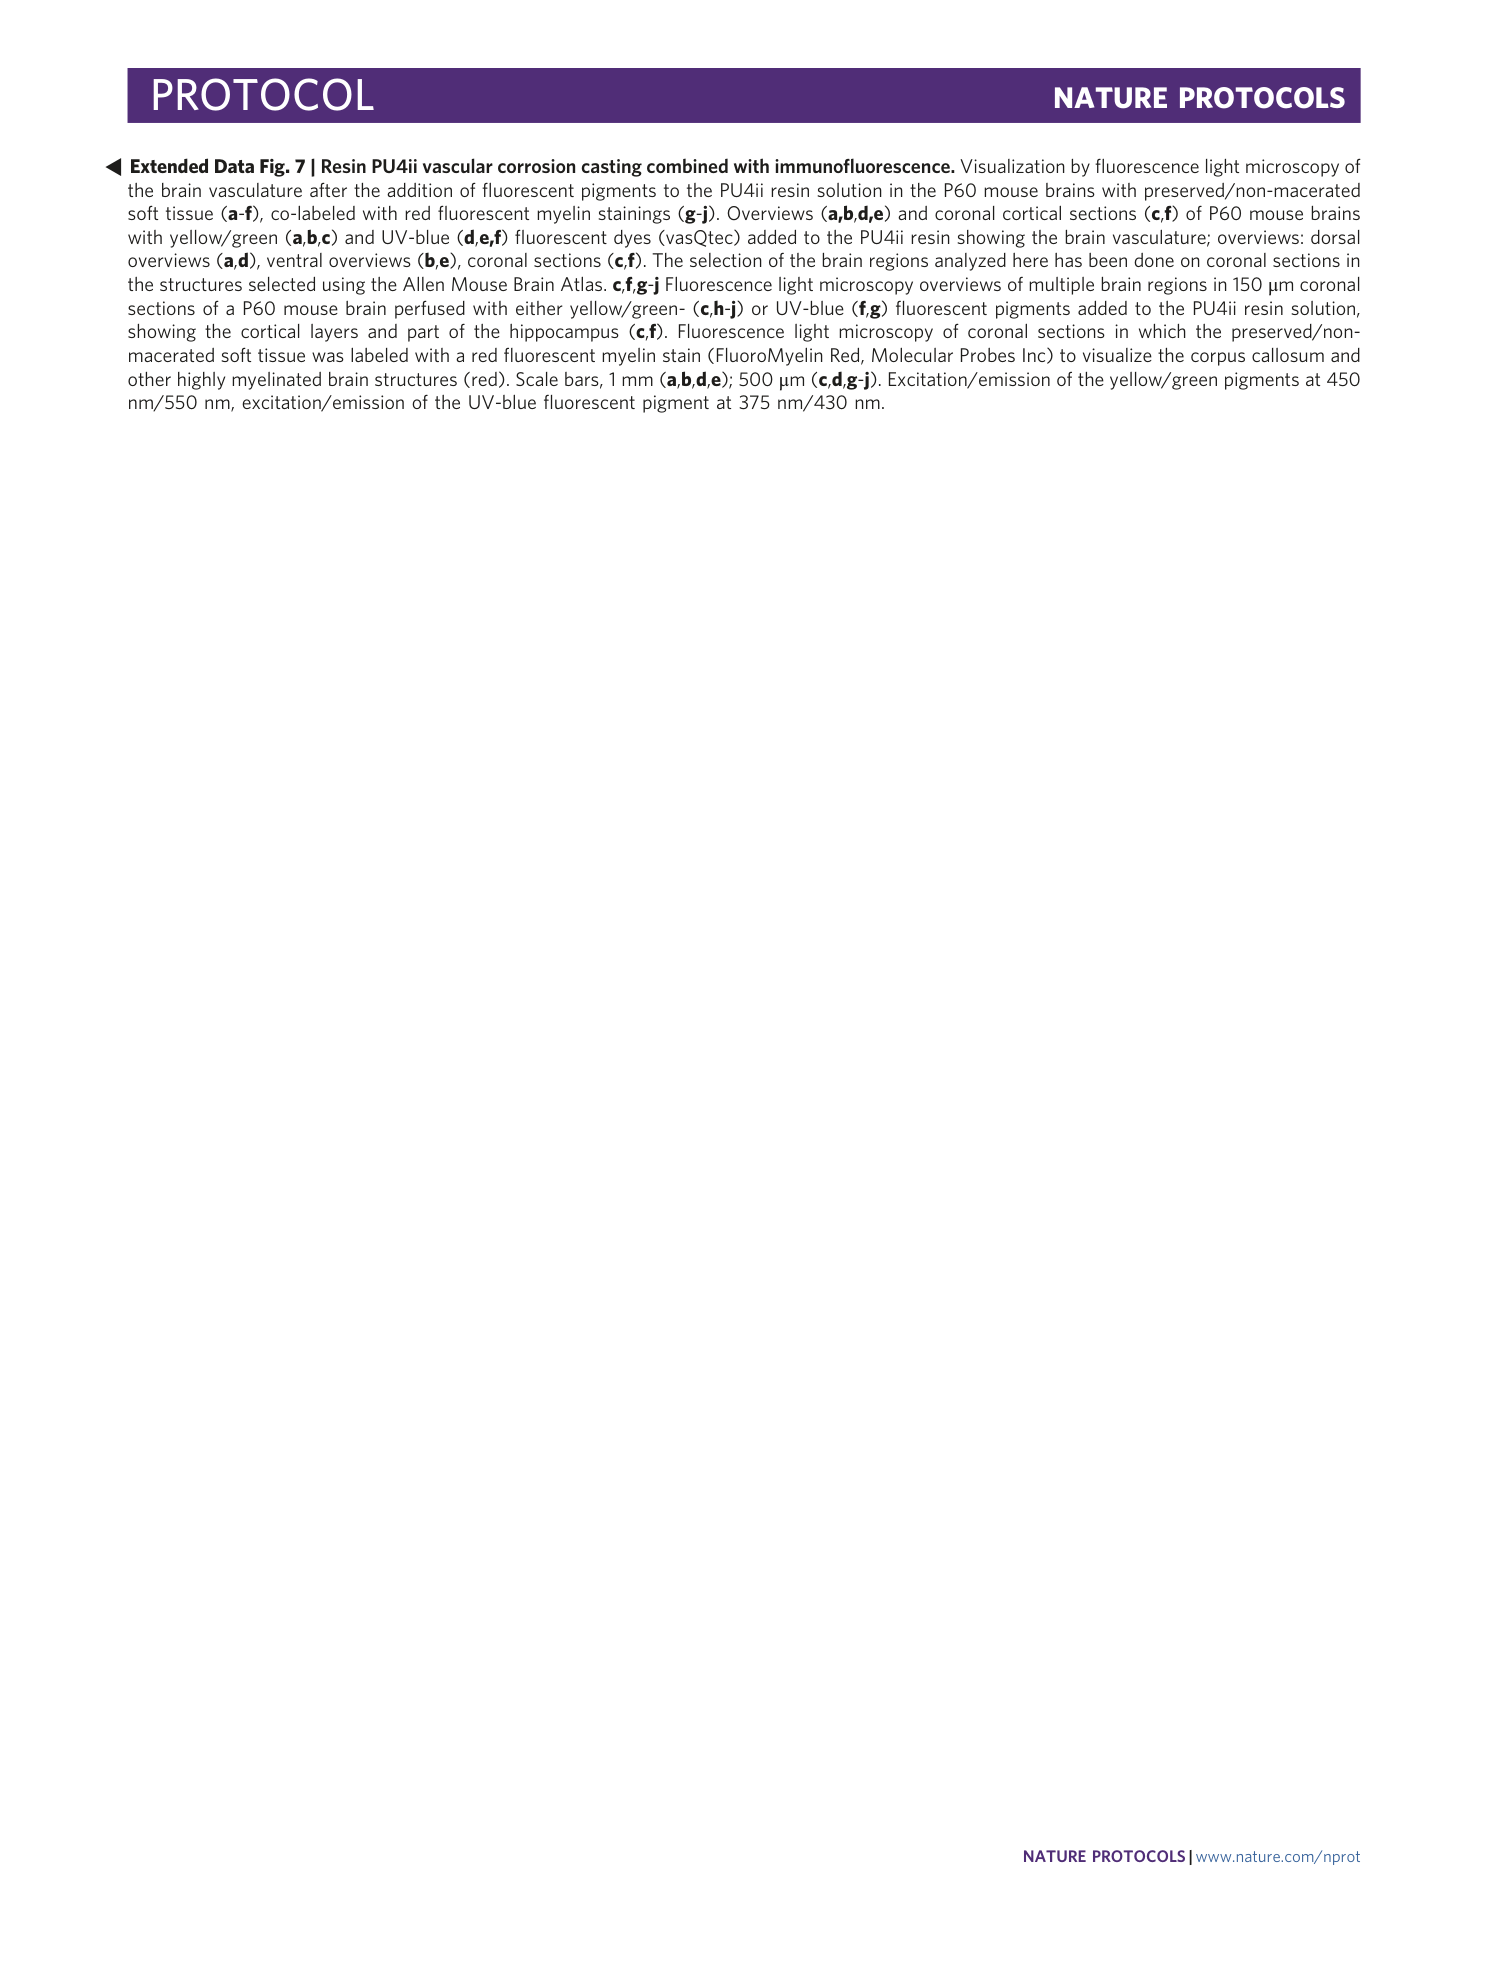
Extended Data Fig. 7 Resin PU4ii vascular corrosion casting combined with immunofluorescence.
Visualization by fluorescence light microscopy of the brain vasculature after the addition of fluorescent pigments to the PU4ii resin solution in the P60 mouse brains with preserved/non-macerated soft tissue ( a - f ), co-labeled with red fluorescent myelin stainings ( g - j ). Overviews ( a,b , d,e ) and coronal cortical sections ( c , f ) of P60 mouse brains with yellow/green ( a , b , c ) and UV-blue ( d , e,f ) fluorescent dyes (vasQtec) added to the PU4ii resin showing the brain vasculature; overviews: dorsal overviews ( a , d ), ventral overviews ( b , e ), coronal sections ( c , f ). The selection of the brain regions analyzed here has been done on coronal sections in the structures selected using the Allen Mouse Brain Atlas. c , f , g - j Fluorescence light microscopy overviews of multiple brain regions in 150 μm coronal sections of a P60 mouse brain perfused with either yellow/green- ( c , h - j ) or UV-blue ( f , g ) fluorescent pigments added to the PU4ii resin solution, showing the cortical layers and part of the hippocampus ( c , f ). Fluorescence light microscopy of coronal sections in which the preserved/non-macerated soft tissue was labeled with a red fluorescent myelin stain (FluoroMyelin Red, Molecular Probes Inc) to visualize the corpus callosum and other highly myelinated brain structures (red). Scale bars, 1 mm ( a , b , d , e ); 500 μm ( c , d , g - j ). Excitation/emission of the yellow/green pigments at 450 nm/550 nm, excitation/emission of the UV-blue fluorescent pigment at 375 nm/430 nm.
Supplementary information
Supplementary Information
Supplementary Figs. 1–21.
Reporting Summary
Supplementary Video 1
Intracardial resin perfusion of a postnatal (P10) wildtype mouse. This video shows the intracardial resin perfusion of a postnatal (P10) wildtype mouse pub. All steps are precisely explained in the Procedure.
Supplementary Video 2
Three-dimensional animation of a reconstructed SRμCT scan of the entire vascular brain corrosion cast of an adult (P60) wildtype mouse. This animation shows a reconstructed SRμCT of an entire brain vascular corrosion cast of an adult (P60) wildtype animal. Five anatomical regions (cortex, hippocampus, superior colliculus, thalamus and cerebellum) were zoomed into with high resolution. Artificial coloring illustrates the vessel radius and the division between capillaries (vessel diameter <7 μm) and noncapillaries (vessel diameter ≥7 μm).
