Chemometric analysis in Raman spectroscopy from experimental design to machine learning–based modeling
Shuxia Guo, Jürgen Popp, Thomas Bocklitz


Extended
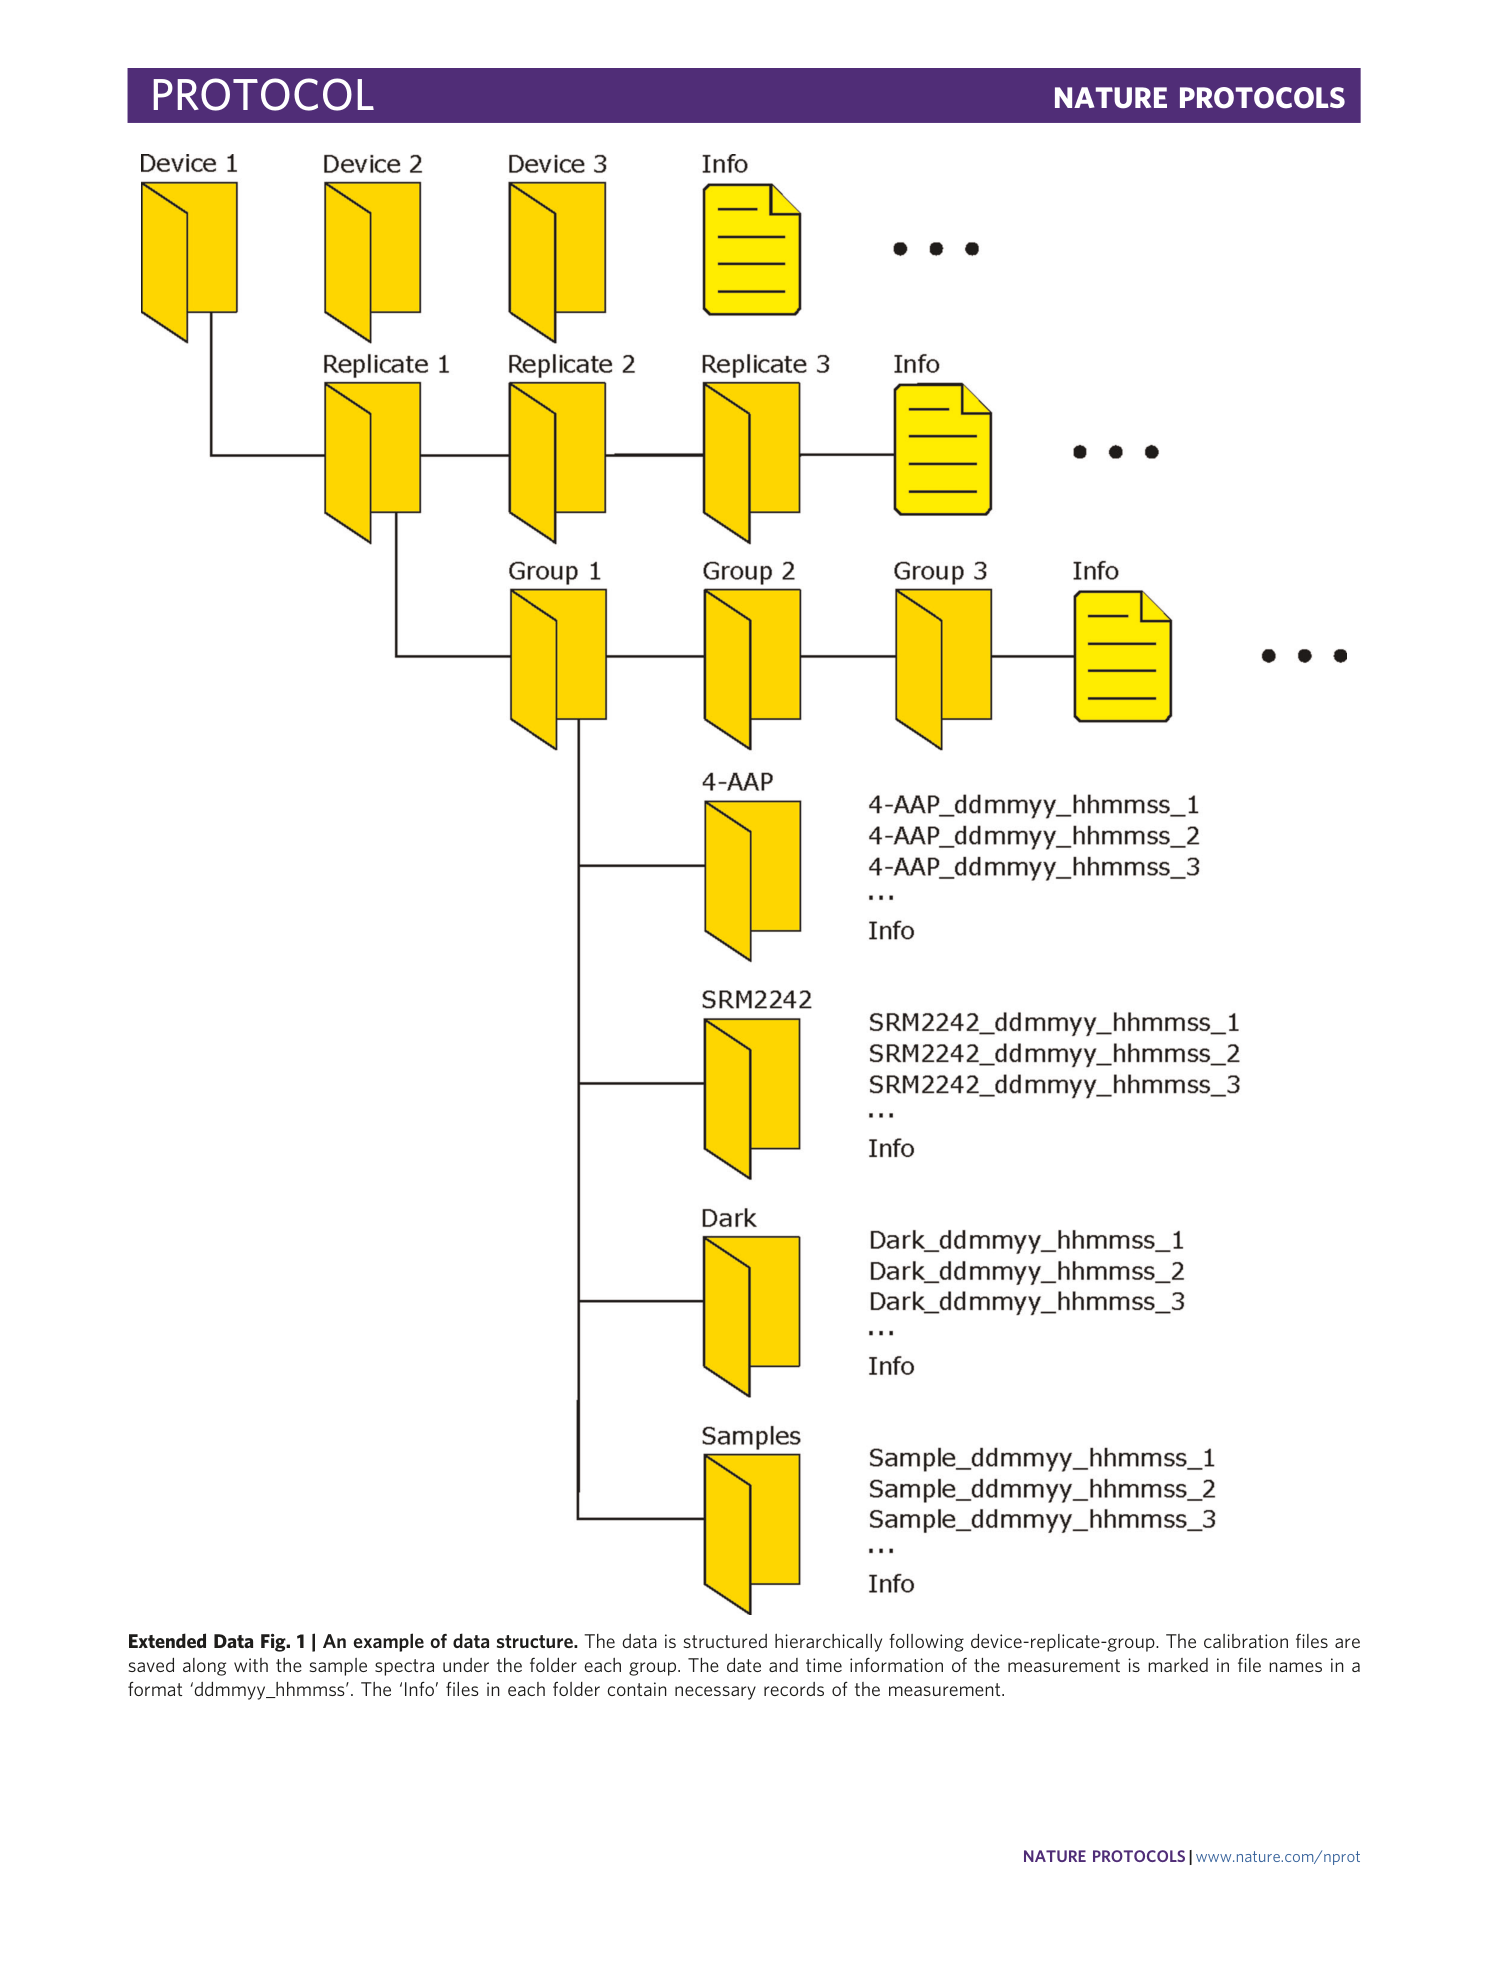
Extended Data Fig. 1 An example of data structure.
The data is structured hierarchically following device-replicate-group. The calibration files are saved along with the sample spectra under the folder each group. The date and time information of the measurement is marked in file names in a format ‘ddmmyy_hhmmss’. The ‘Info’ files in each folder contain necessary records of the measurement.
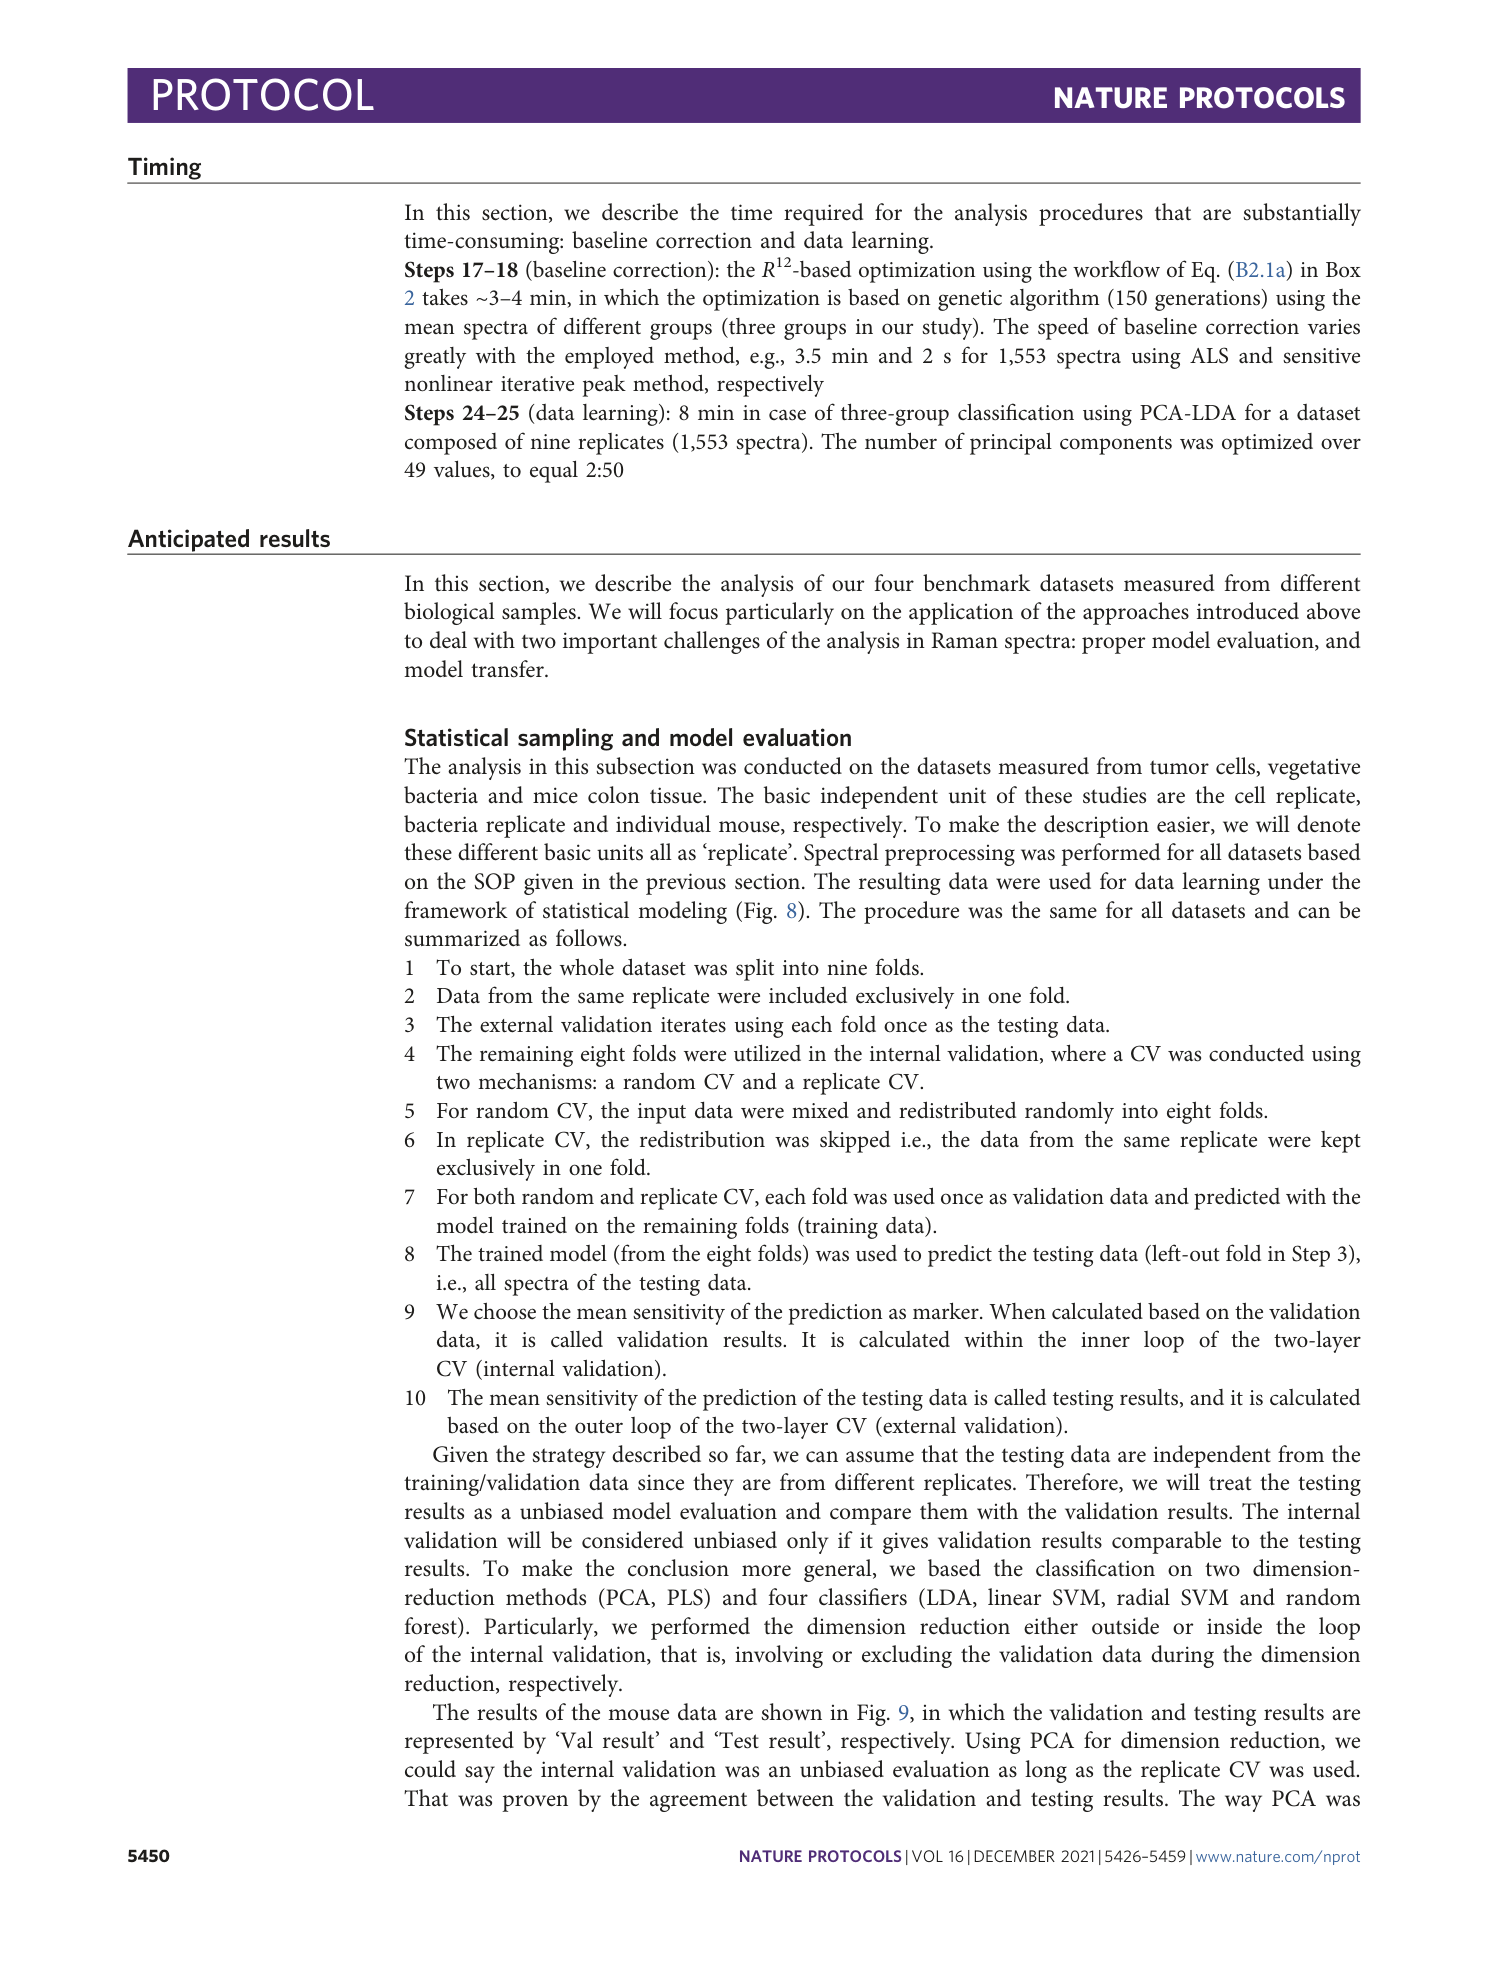
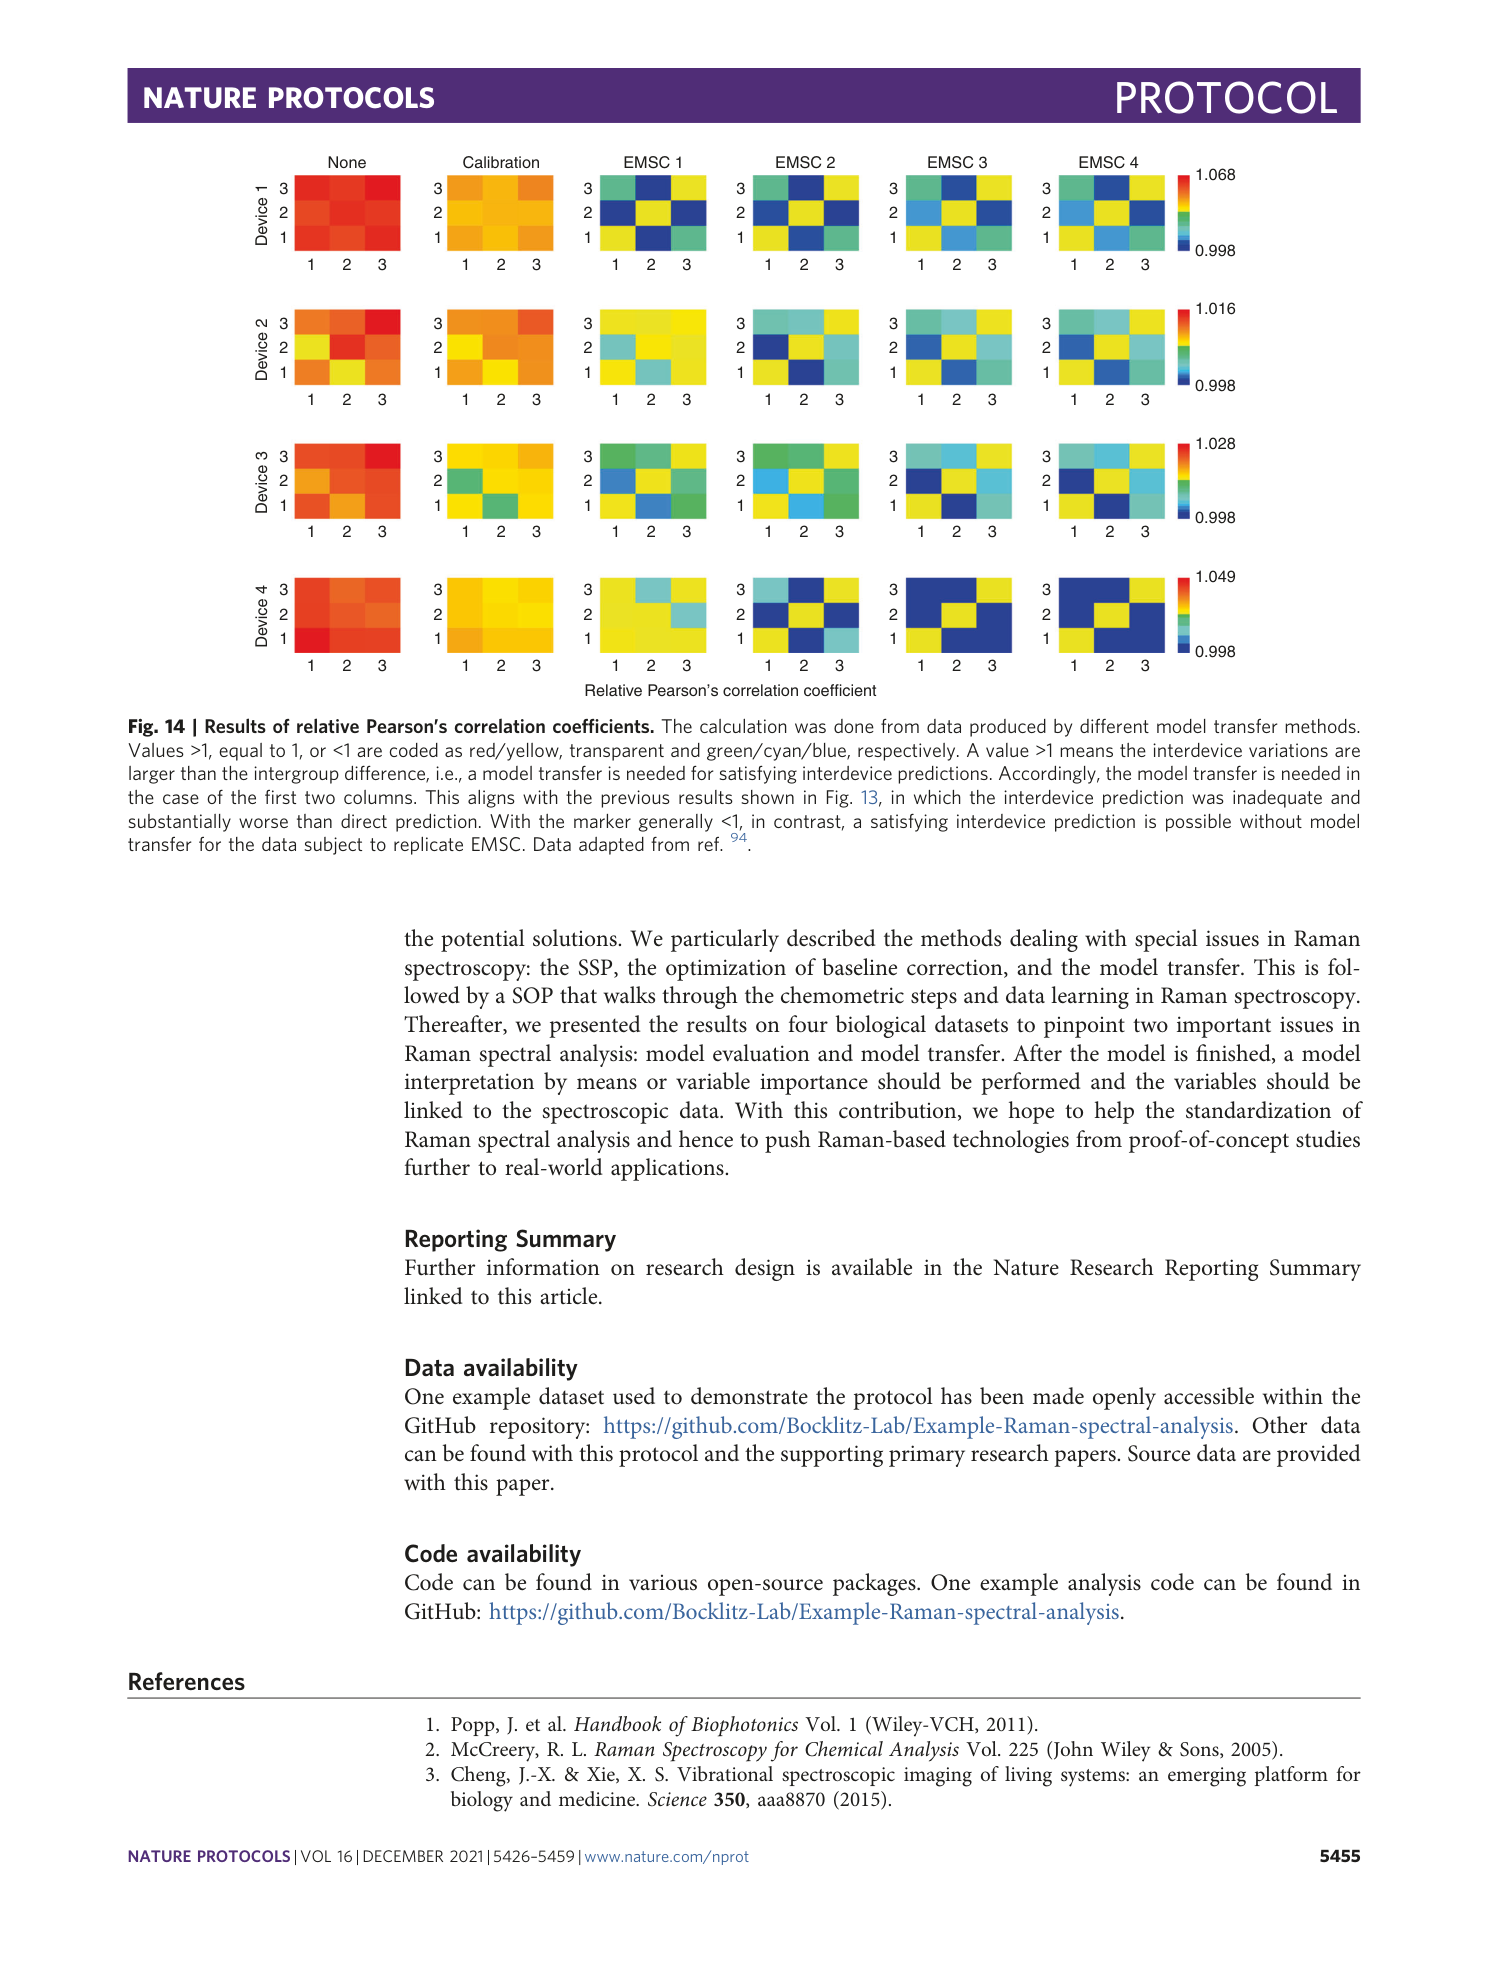
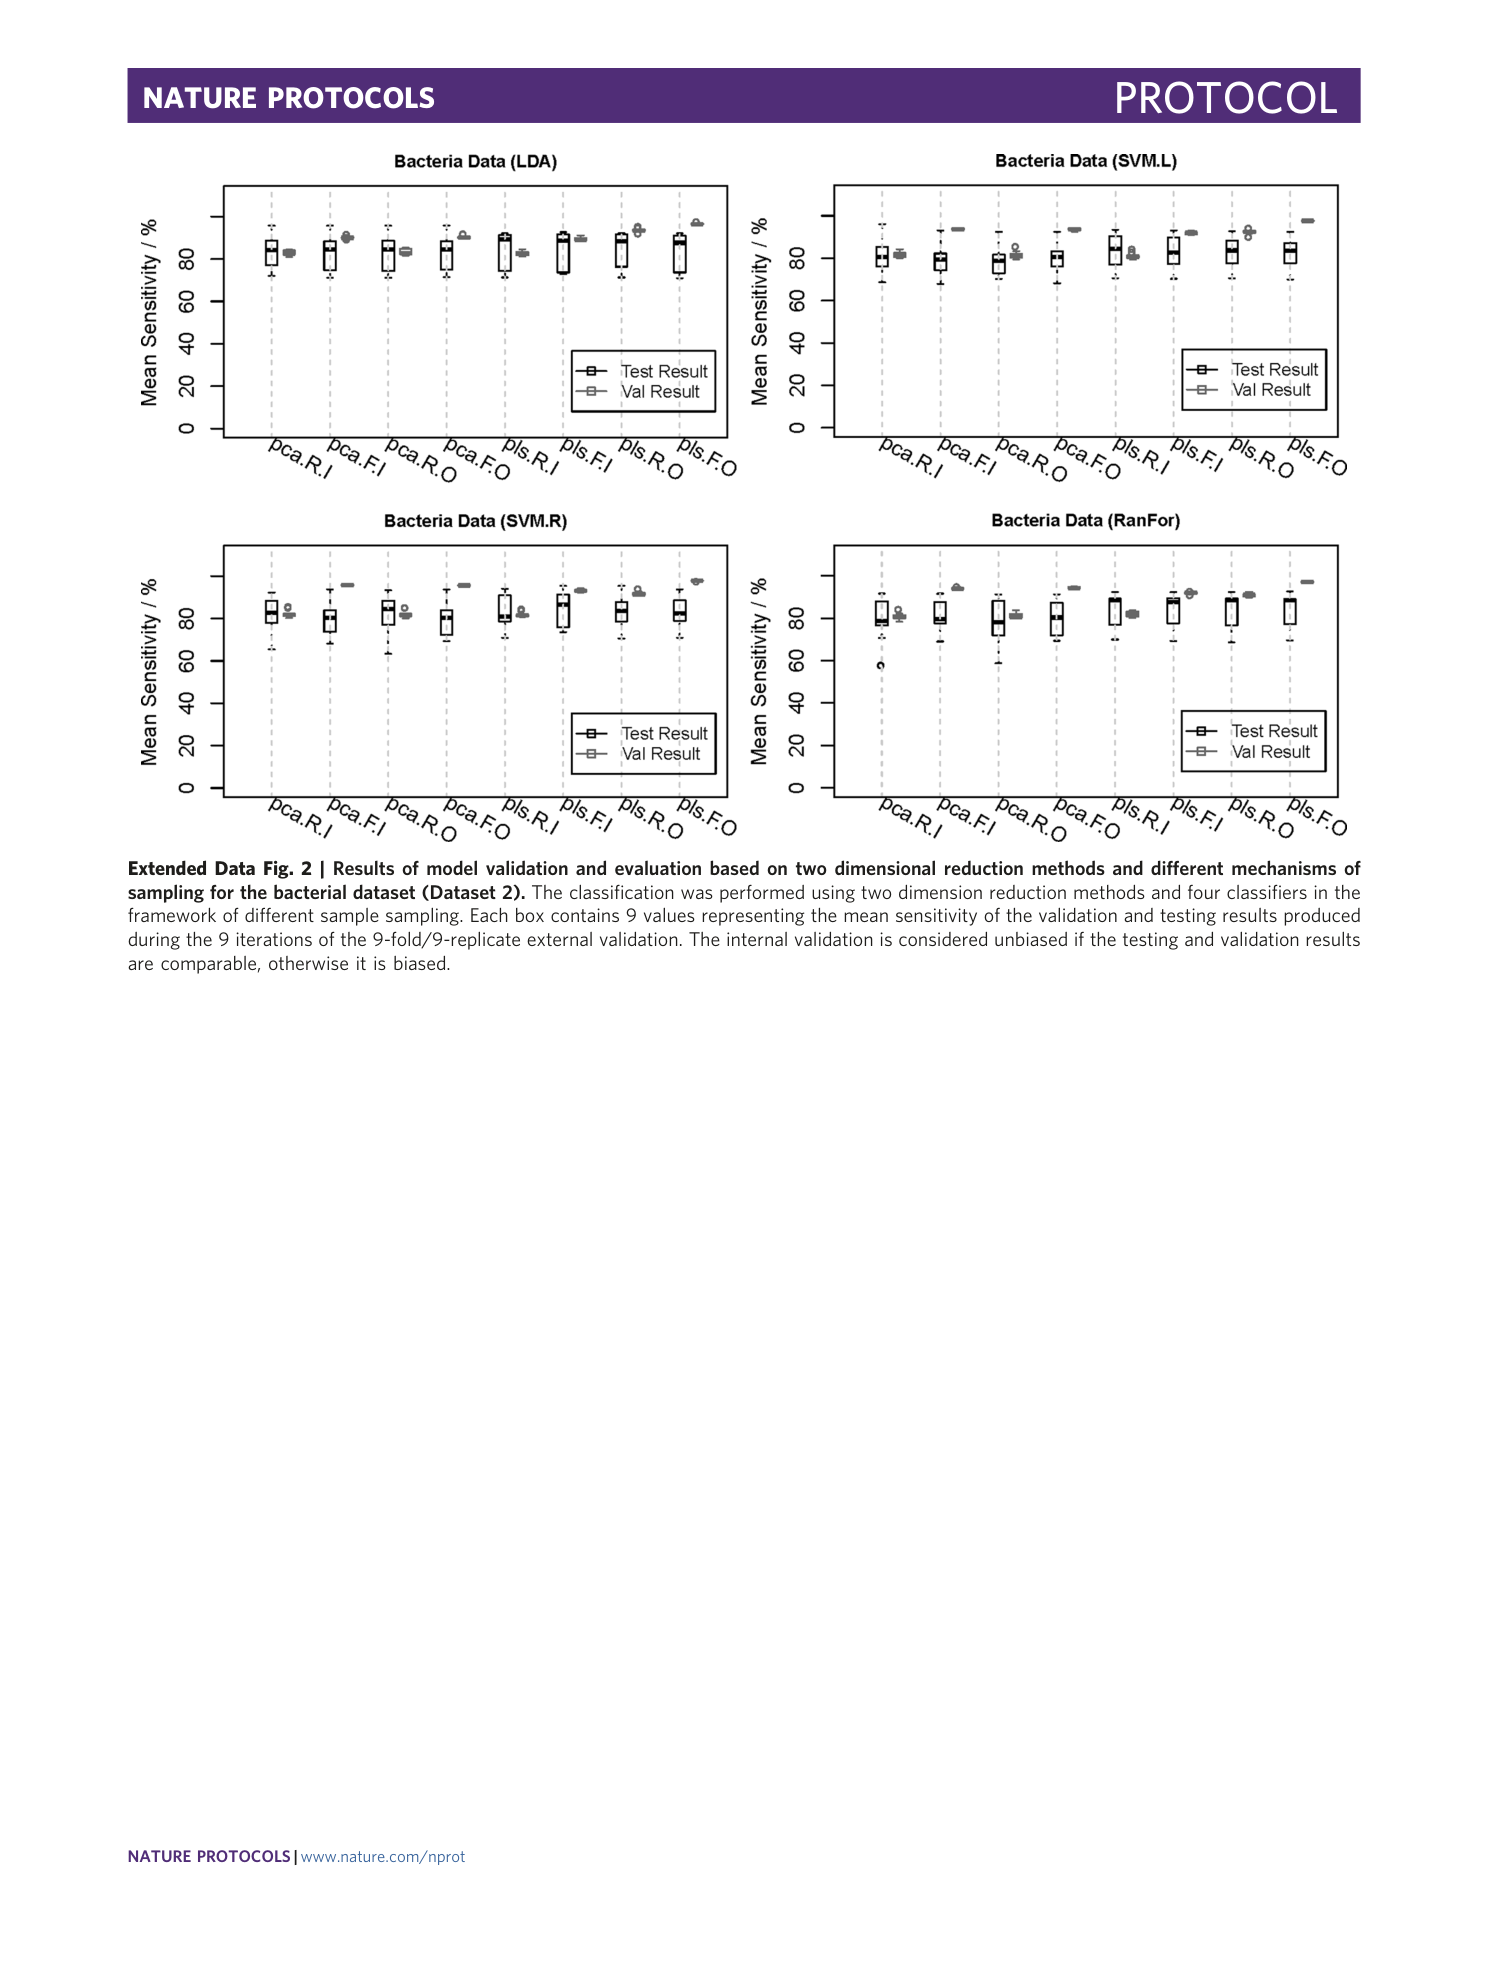
Extended Data Fig. 2 Results of model validation and evaluation based on two dimensional reduction methods and different mechanisms of sampling for the bacterial dataset (Dataset 2).
The classification was performed using two dimension reduction methods and four classifiers in the framework of different sample sampling. Each box contains 9 values representing the mean sensitivity of the validation and testing results produced during the 9 iterations of the 9-fold/9-replicate external validation. The internal validation is considered unbiased if the testing and validation results are comparable, otherwise it is biased.
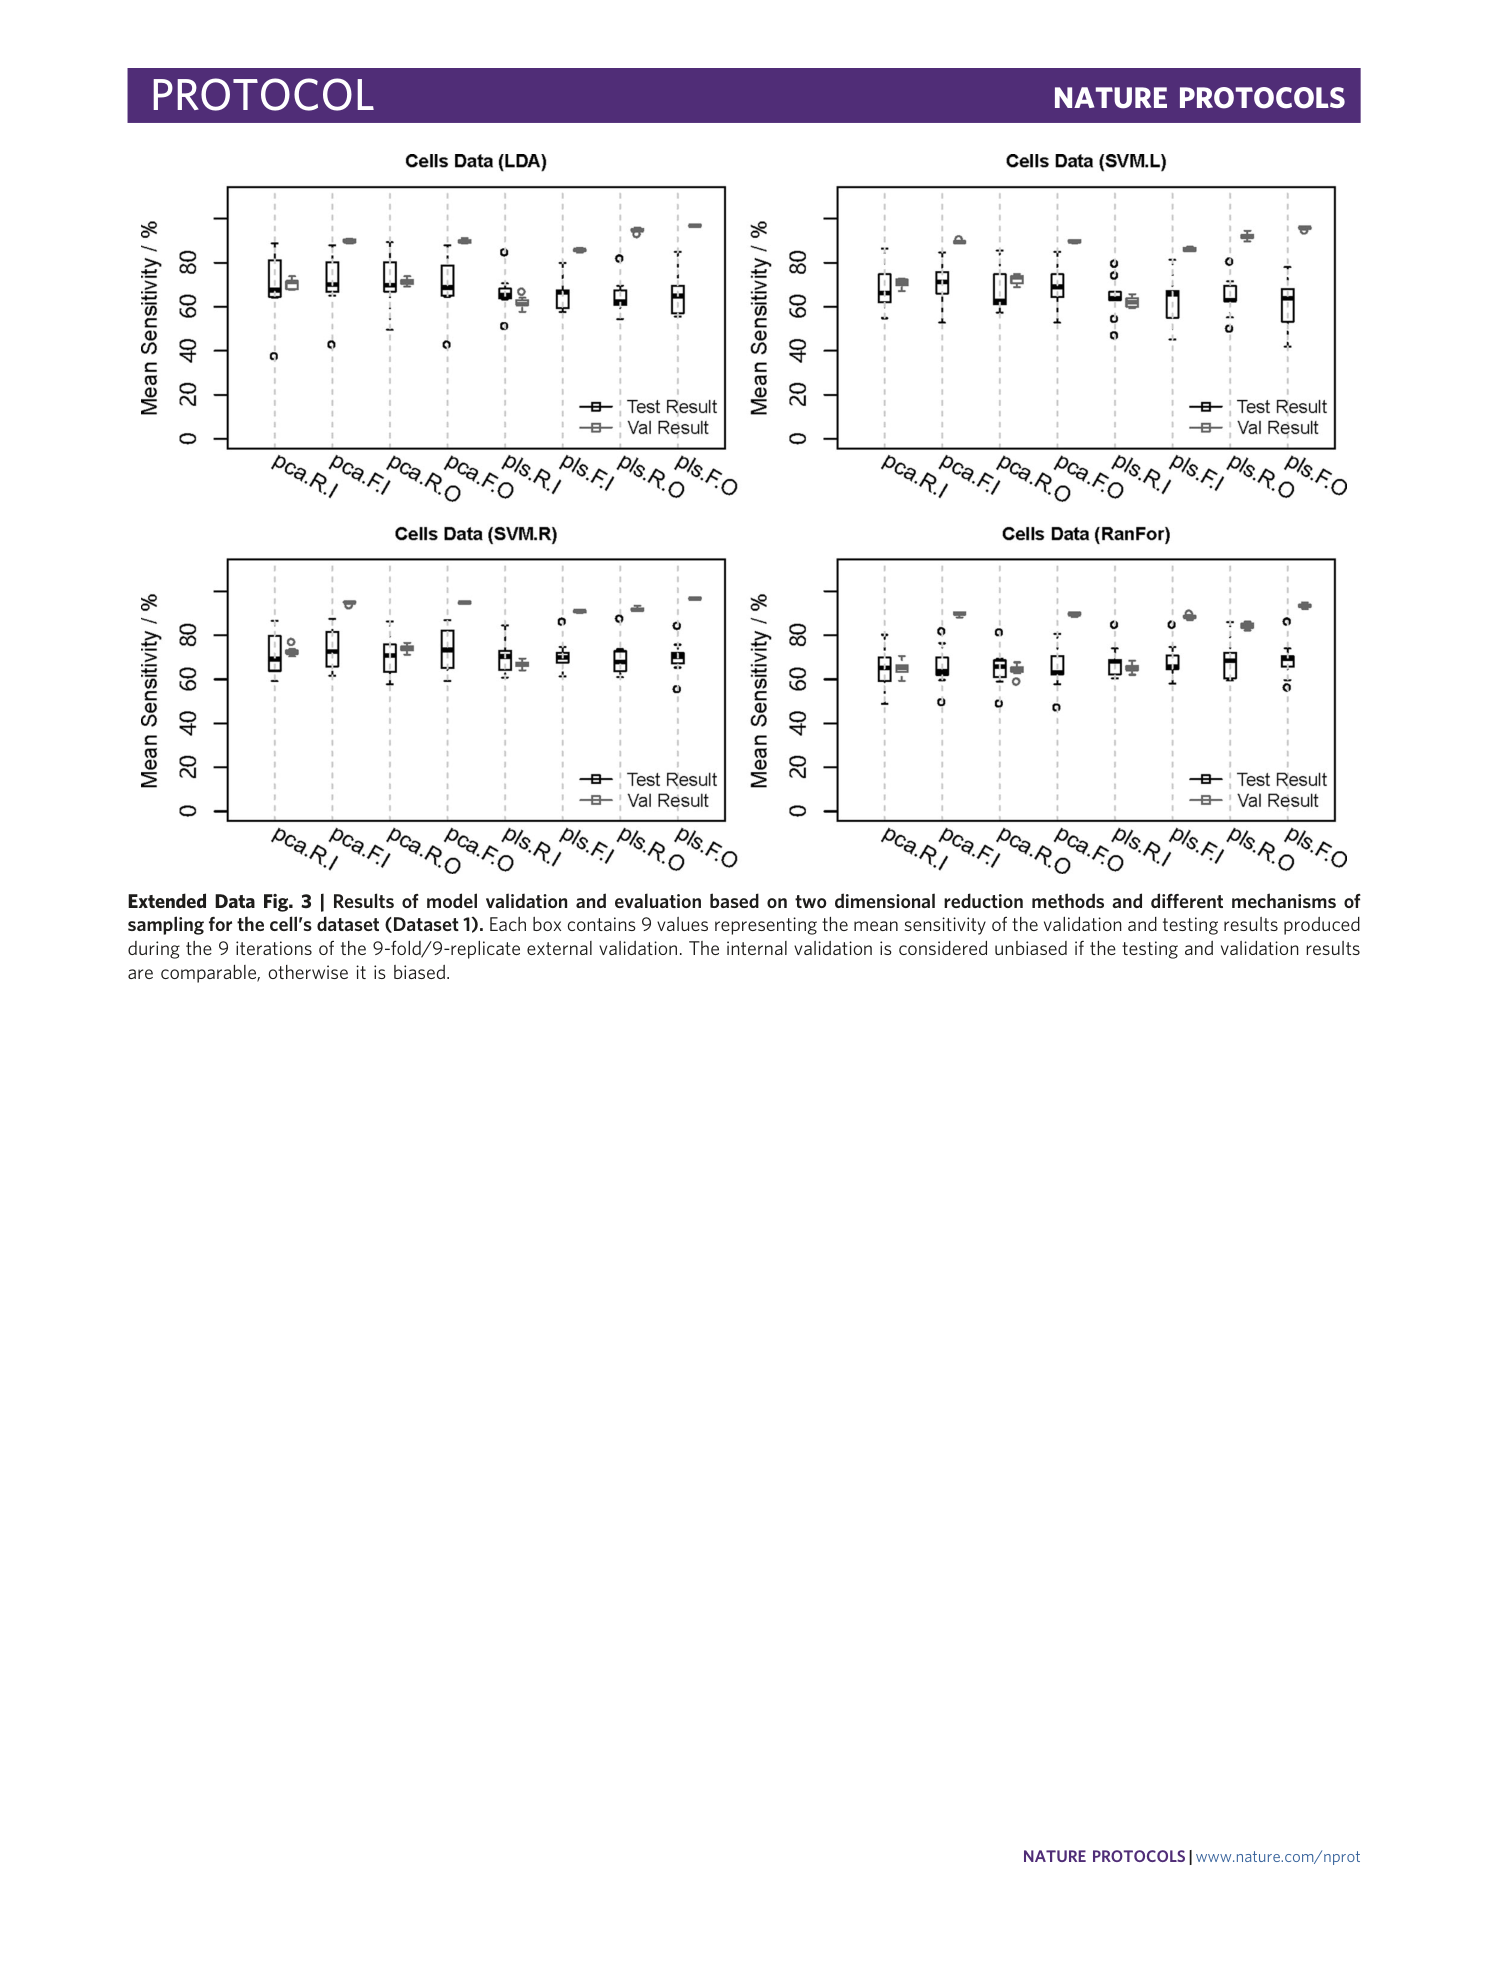
Extended Data Fig. 3 Results of model validation and evaluation based on two dimensional reduction methods and different mechanisms of sampling for the cell’s dataset (Dataset 1).
Each box contains 9 values representing the mean sensitivity of the validation and testing results produced during the 9 iterations of the 9-fold/9-replicate external validation. The internal validation is considered unbiased if the testing and validation results are comparable, otherwise it is biased.
