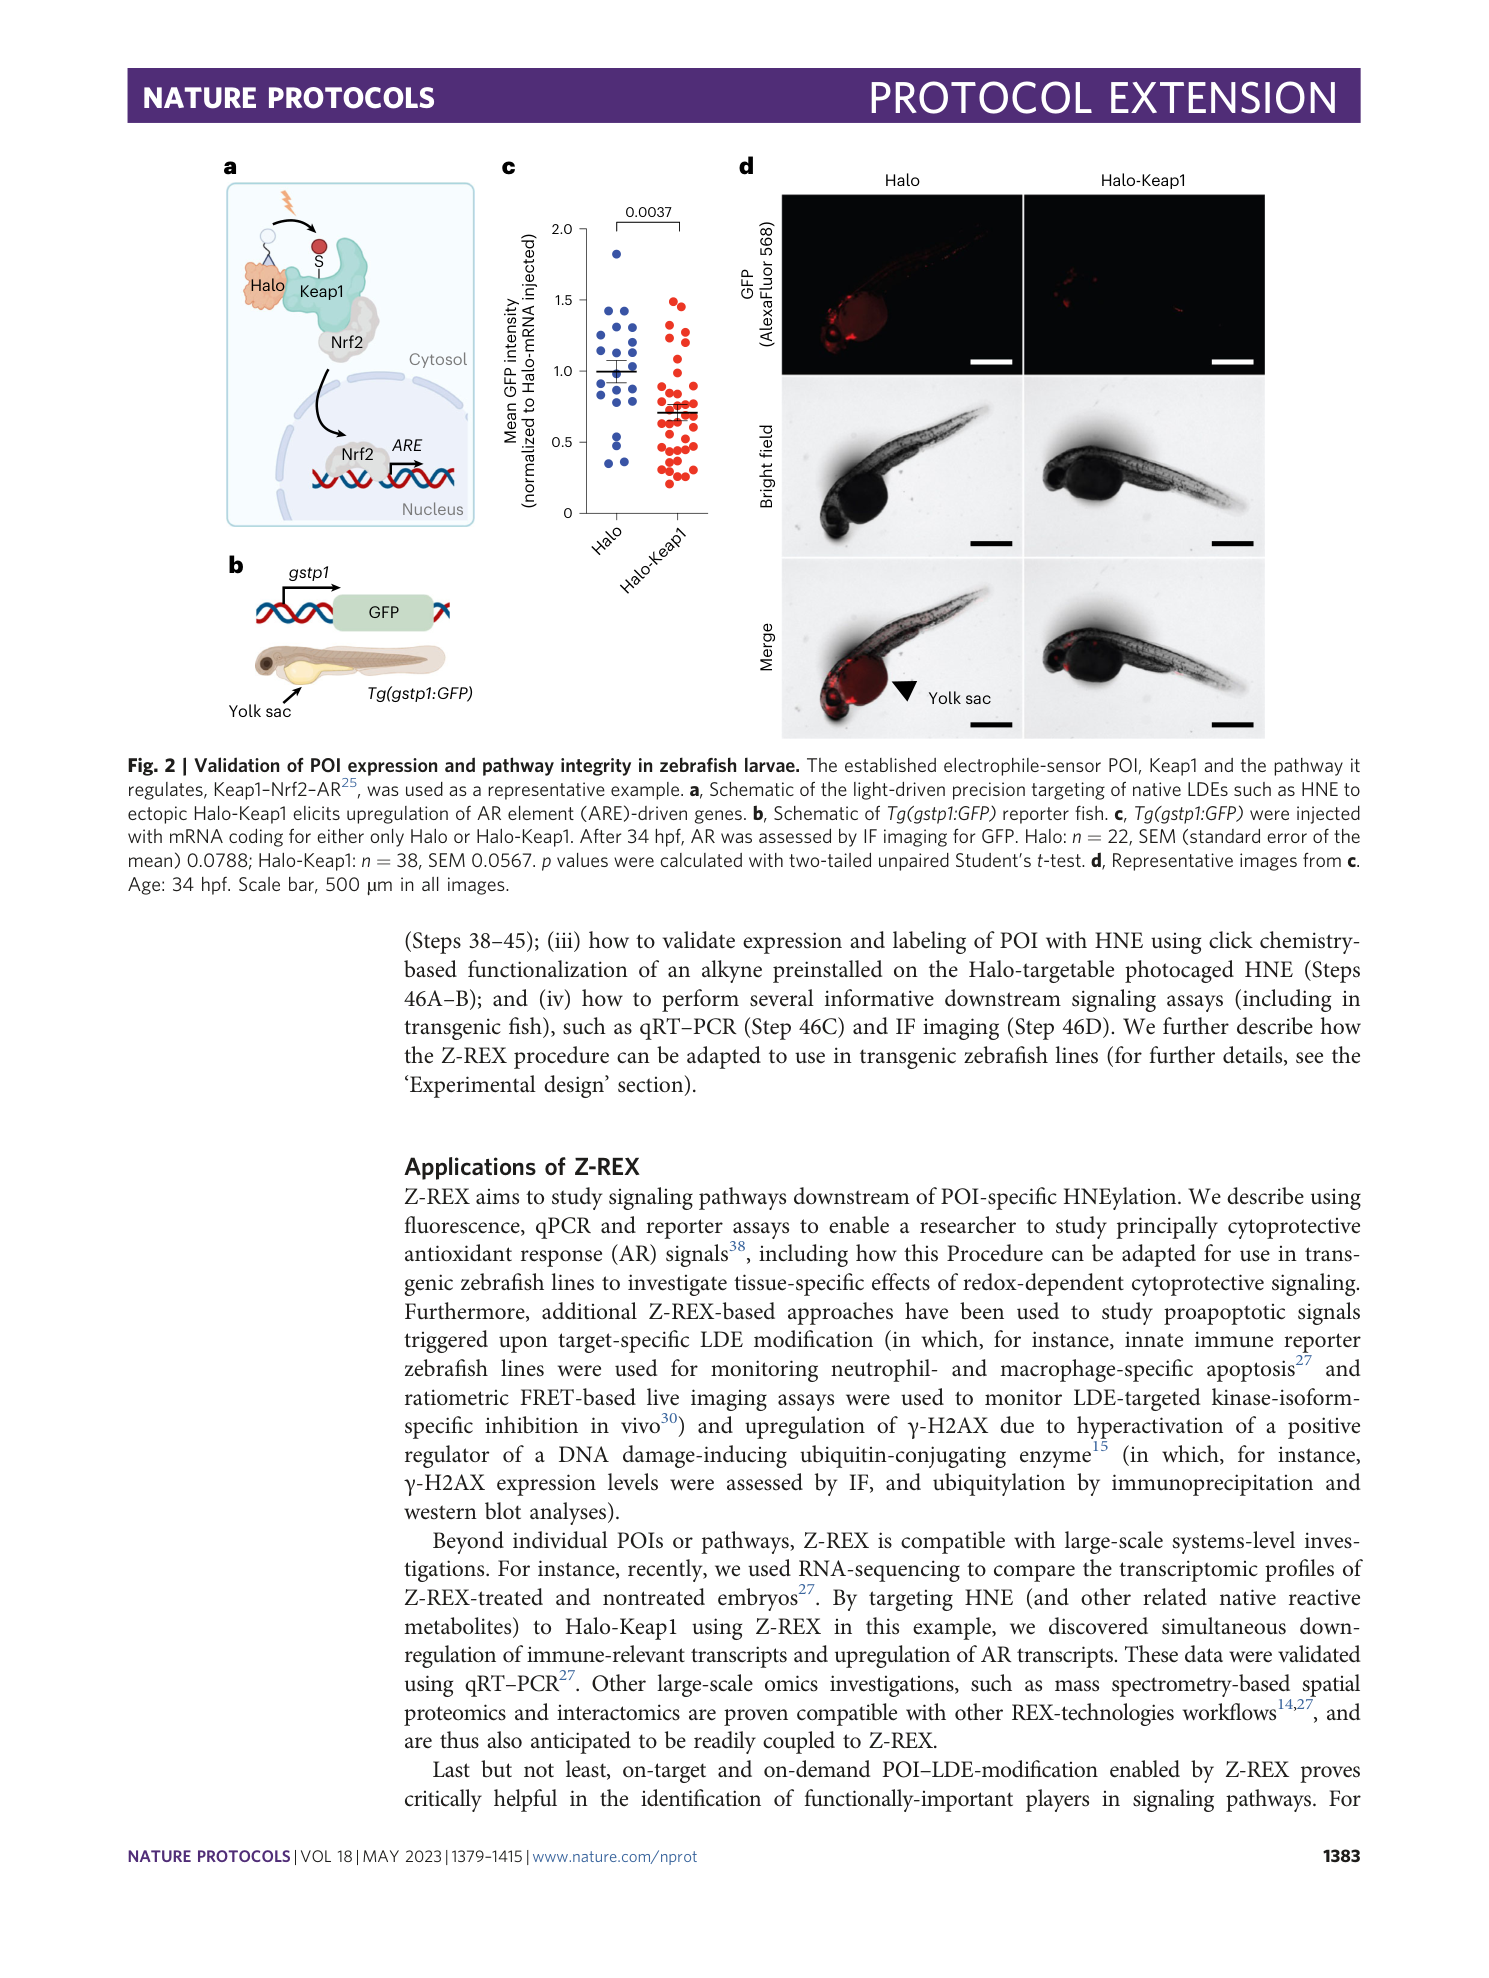
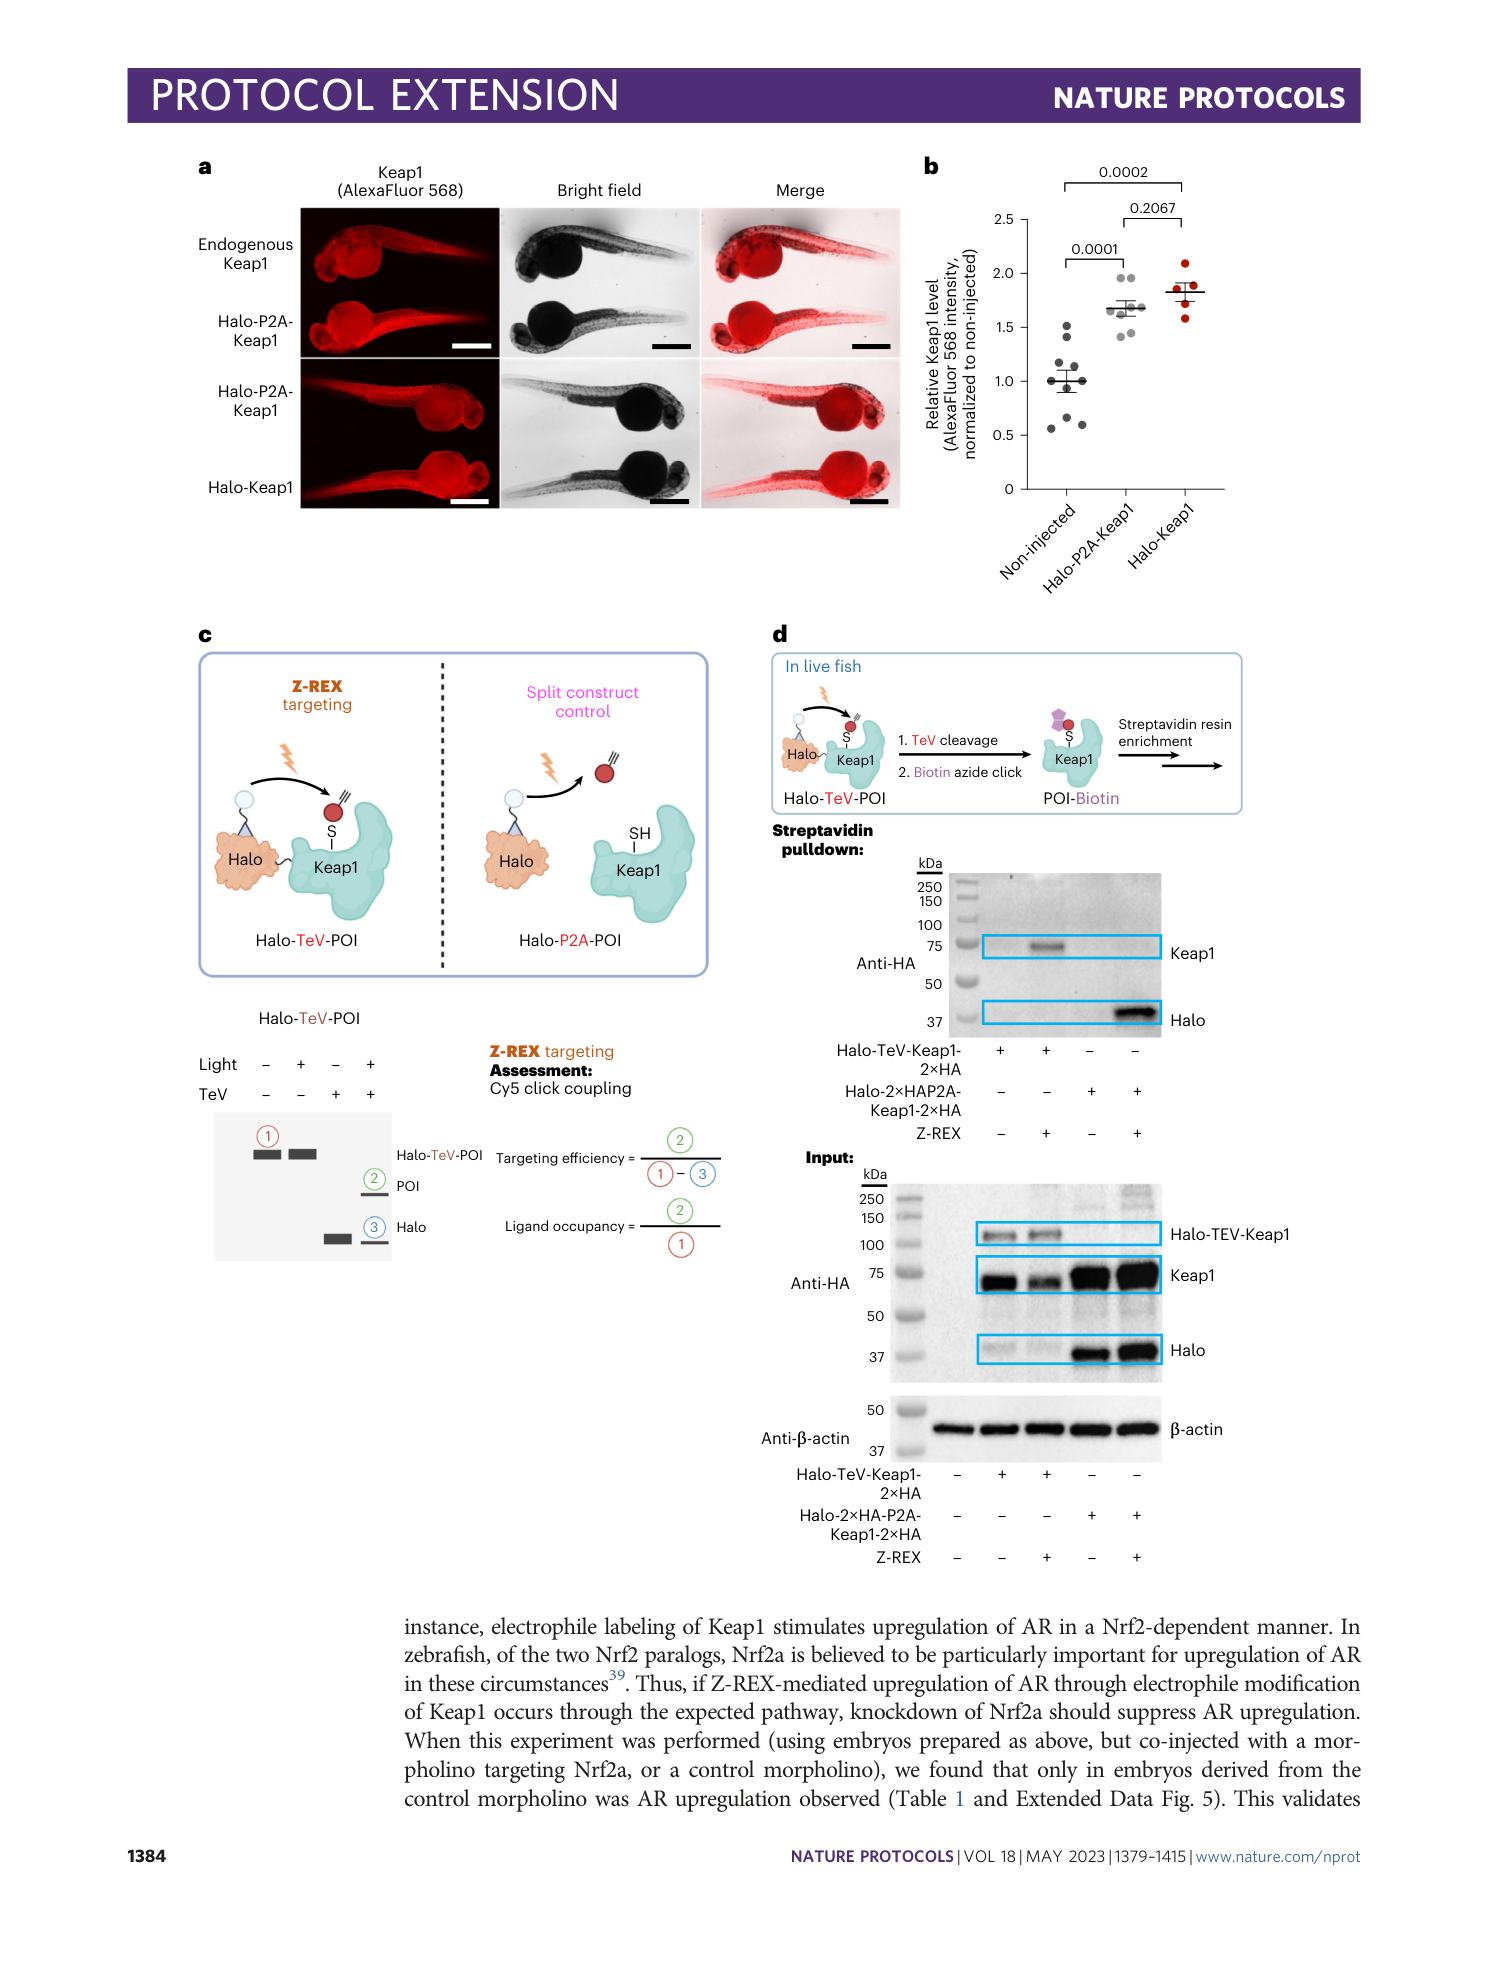
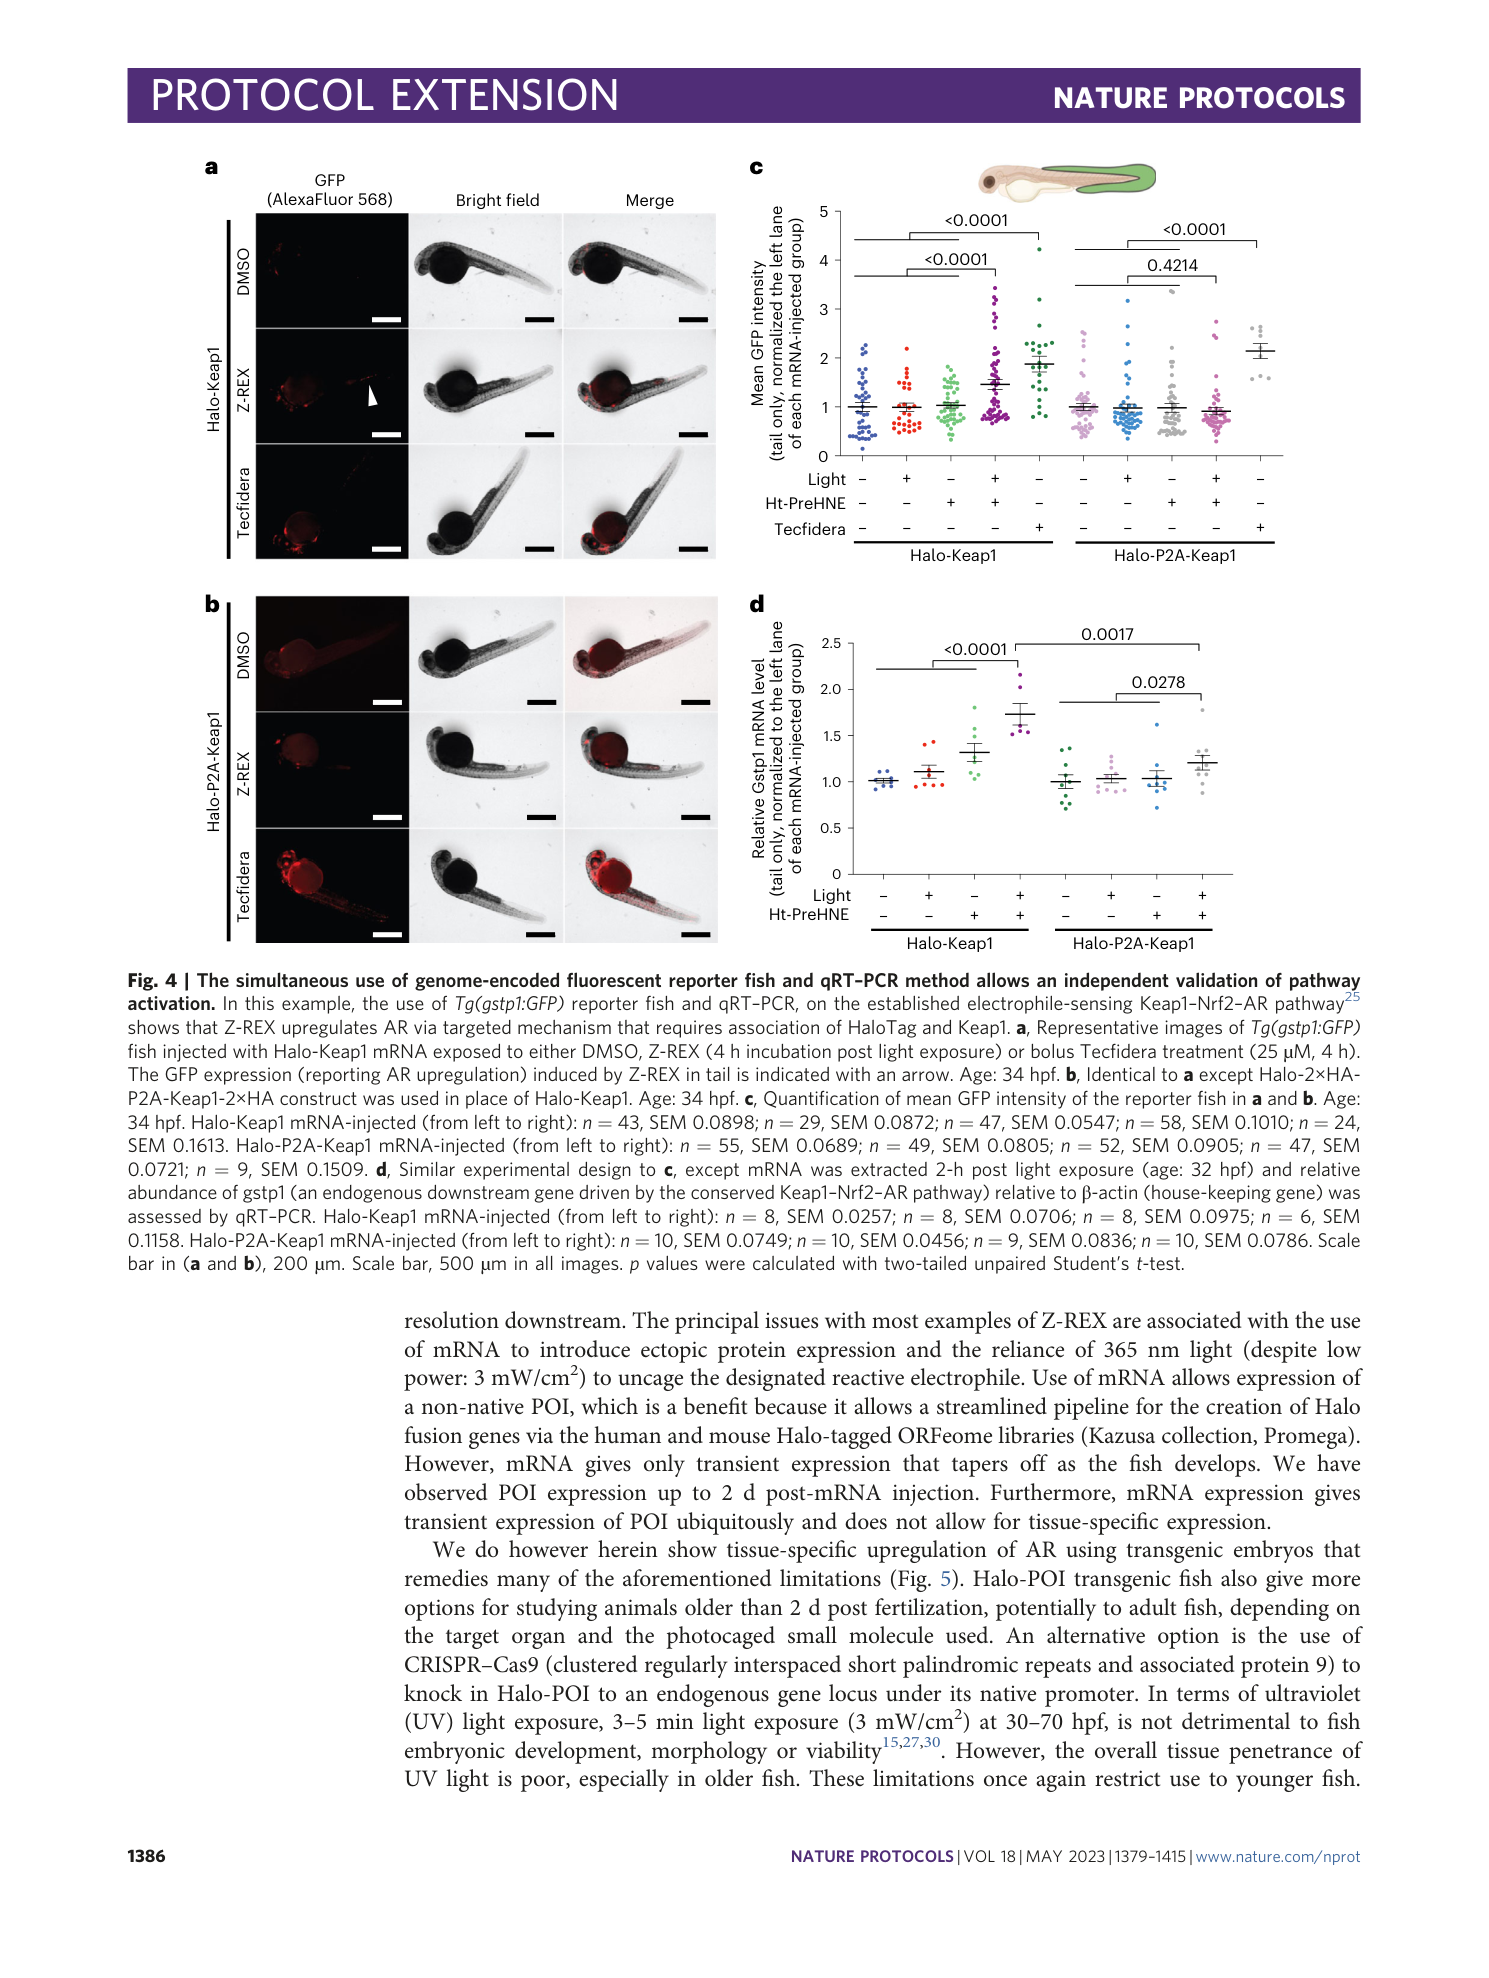
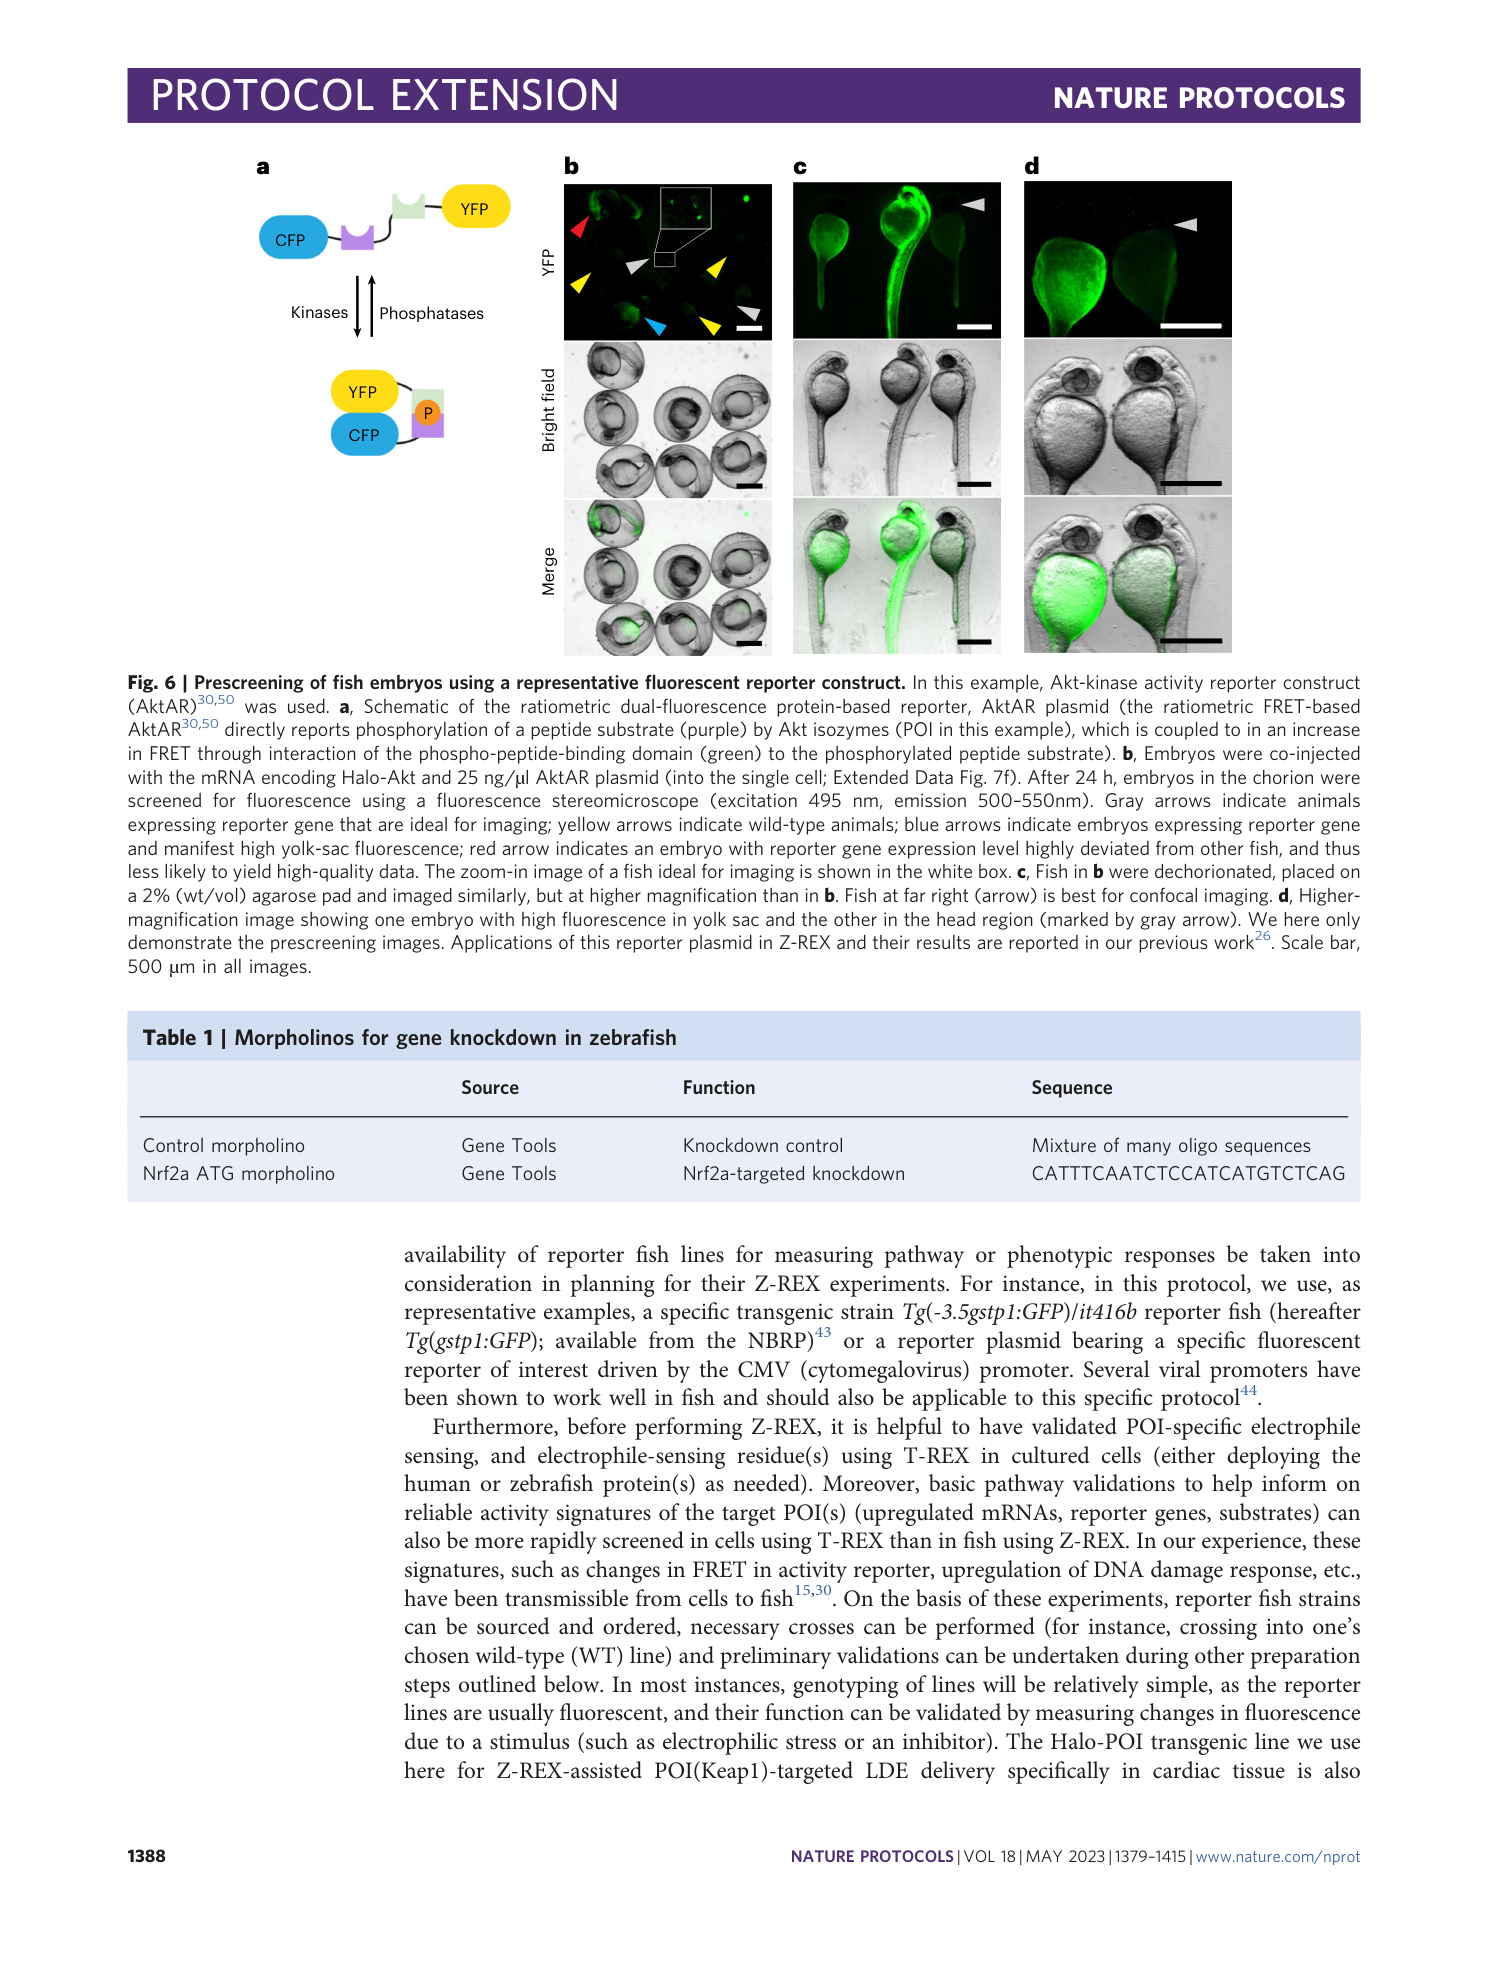
Z-REX: shepherding reactive electrophiles to specific proteins expressed tissue specifically or ubiquitously, and recording the resultant functional electrophile-induced redox responses in larval fish
Brian Miller, Kuan-Ting Huang, Jesse R. Poganik, Saba Parvez, Sruthi Raja, Marcus J. C. Long, Joseph R. Fetcho, Yimon Aye
Extended
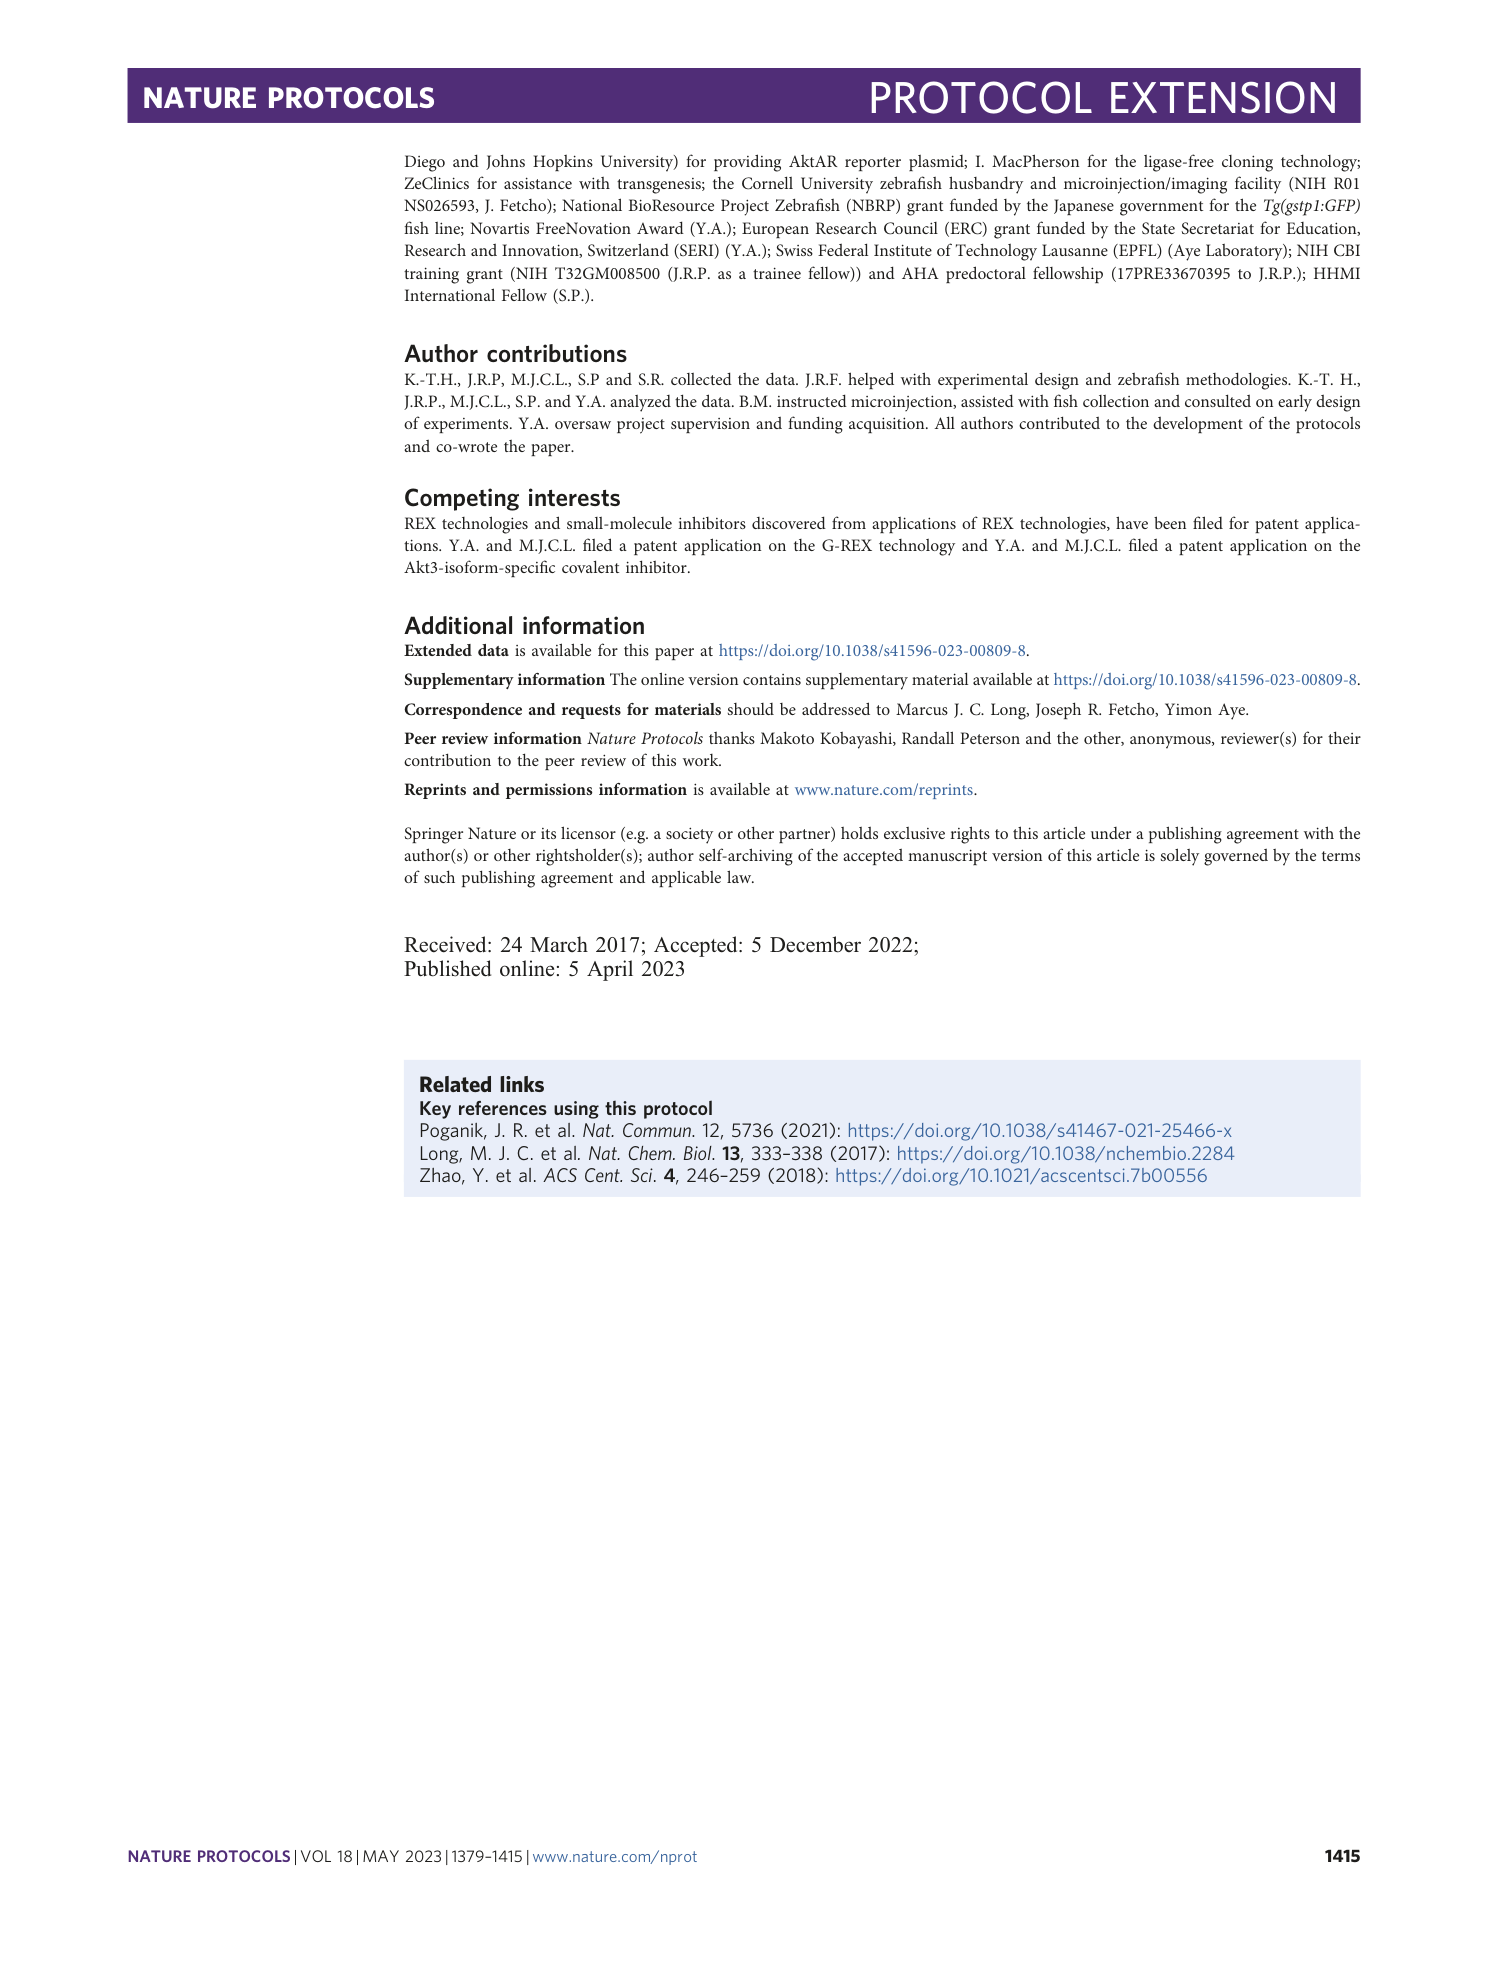
Extended Data Fig. 1 mRNA injection of Halo-POI constructs gives uniform expression of POI in fish.
Keap1 is used as a representative POI 25 . (a) IF analysis of zebrafish embryos (34 hpf). Top row: non-injected embryos not stained with primary antibody; bottom row: Halo-P2A-Keap1 injected embryos (note that there are two sets of each fish in this row, corresponding to fish either stained (top set) or not stained (bottom set) with anti-Keap1 primary antibody). ( b ) IF analysis of zebrafish embryos (34 hpf) injected with Halo-P2A -Keap (top), or non-injected control embryos (bottom). Both groups were stained with anti-HA primary antibody as described (note that all embryos in both groups were treated with the same primary and secondary antibody mix). ( c ) Same as ( b ) but no injection was compared to Halo-Keap1 injection. ( d ) Quantitation of data in (b) and (c). Halo-P2A-Keap1: n=6, SEM=5.012; Halo-Keap1: n=5, SEM=2.926. Scale bar, 500 µm in all images.
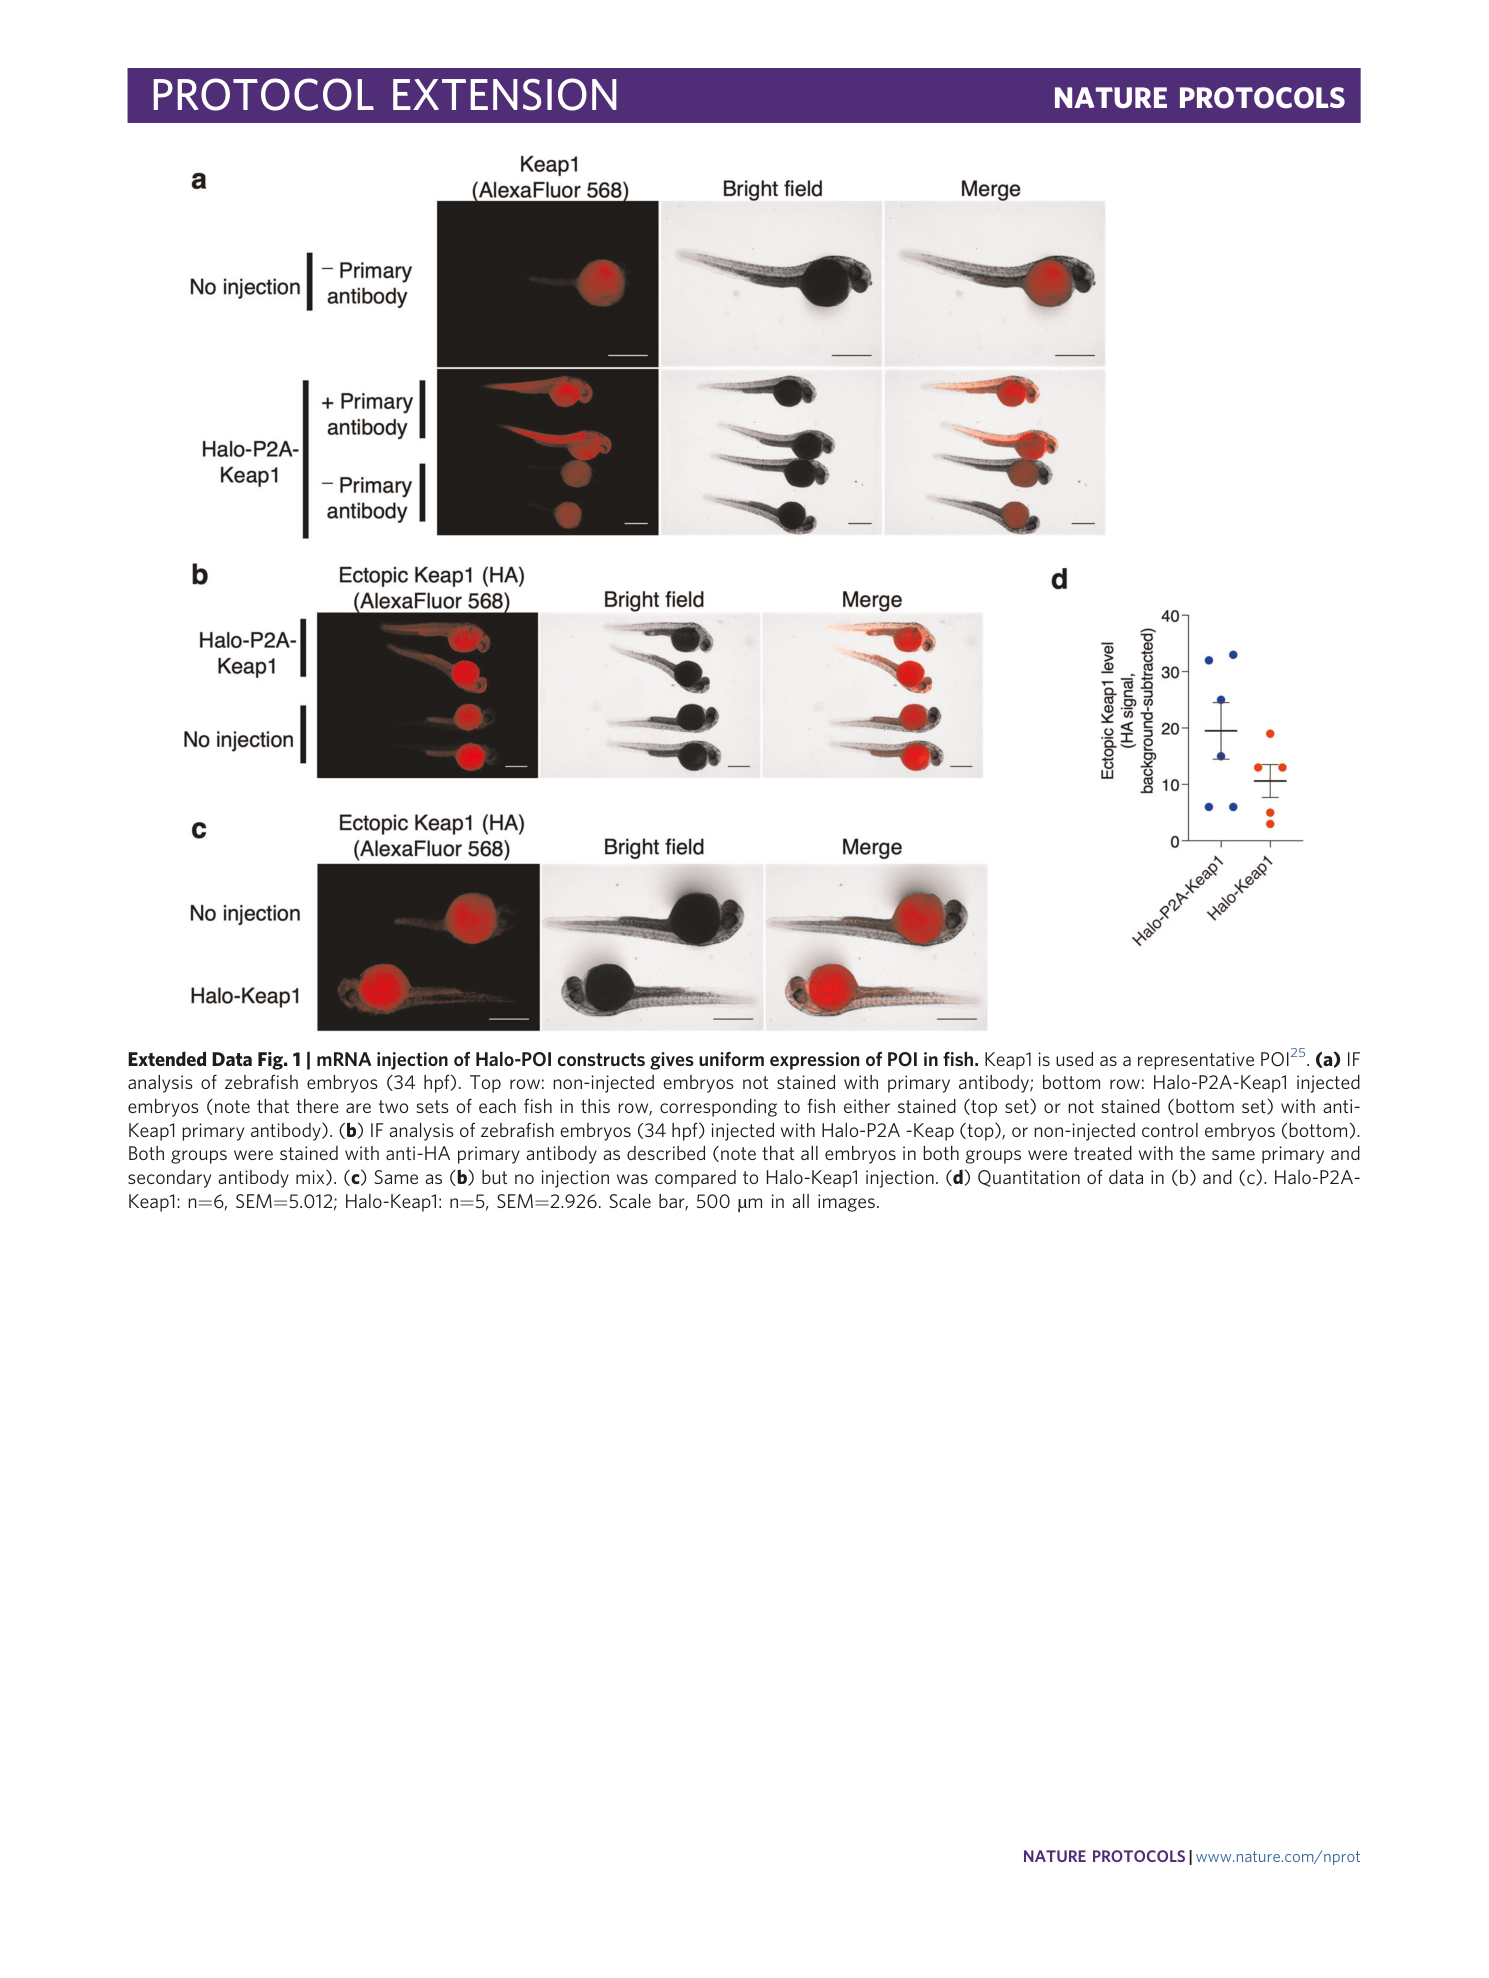
Extended Data Fig. 2 Downstream pathway activation analyzed by transgenic reporter fish and qRT-PCR analysis.
In this example, responsivity differences were characterized for Keap1–Nrf2–AR pathway using Tg(gstp1:GFP) fish and an endogenous downstream gene Gstp1 driven by Nrf2/AR. ( a ) Unlike in the tail fin, (see also Fig. 4 ), Z-REX-assisted Keap1-HNEylation or whole-animal treatment with Tecfidera (25 µM, 4 h treatment) do not cause elevation of AR in the head when measured using Tg(gstp1:GFP) . (34 hpf) Halo-Keap1 mRNA-injected (from left to right): n=43, SEM=0.0455; n=29, SEM=0.0416; n=49, SEM=0.0378; n=65, SEM=0.0313; n=24, SEM=0.0767. Halo-P2A-Keap1 mRNA-injected (from left to right): n=55, SEM=0.0510; n=48, SEM=0.0553; n=54, SEM=0.0497; n=49, SEM=0.0622; n=10, SEM=0.0480. ( b ) qRT-PCR analysis is able to detect a small increase in AR in the head upon Z-REX-assisted Keap1-HNEylation, that is selective to the Halo-Keap1 construct over the Halo-P2A-Keap1 construct. This is significantly less than what is observed in the tail (see Fig. 4d ). Fish age: 32 hpf. Fish age: 32 hpf. Halo-Keap1 mRNA-injected (from left to right): n=8, SEM=0.0590; n=8, SEM=0.0418; n=8, SEM=0.0756; n=8, SEM=0.0948. Halo-P2A-Keap1 mRNA-injected (from left to right): n=6, SEM=0.0609; n=6, SEM=0.0586; n=6, SEM=0.0349; n=6, SEM=0.0493. ( c ) Human Halo-Keap-injected AR reporter fish larvae maintain bolus-electrophile-induced pathway responsivity as assessed by bolus HNE and Tecfidera treatment of the injected larvae. Tg(gstp1:GFP) were injected with mRNA coding for Halo-Keap1. At 30 hpf, embryos were treated with DMSO, HNE (25 μM) or Tecfidera (25 μM) for 4 h. Then the extent of AR upregulation specifically in the tail was assessed by IF imaging for GFP (age: 34 hpf). Non-treated: n = 50, SEM 0.0582; HNE-treated: n = 15, SEM 0.1325; Tecfidera-treated: n = 25, SEM 0.1442. Inset: chemical structure of HNE and Tecfidera. p values were calculated with two-tailed unpaired Student’s t test.
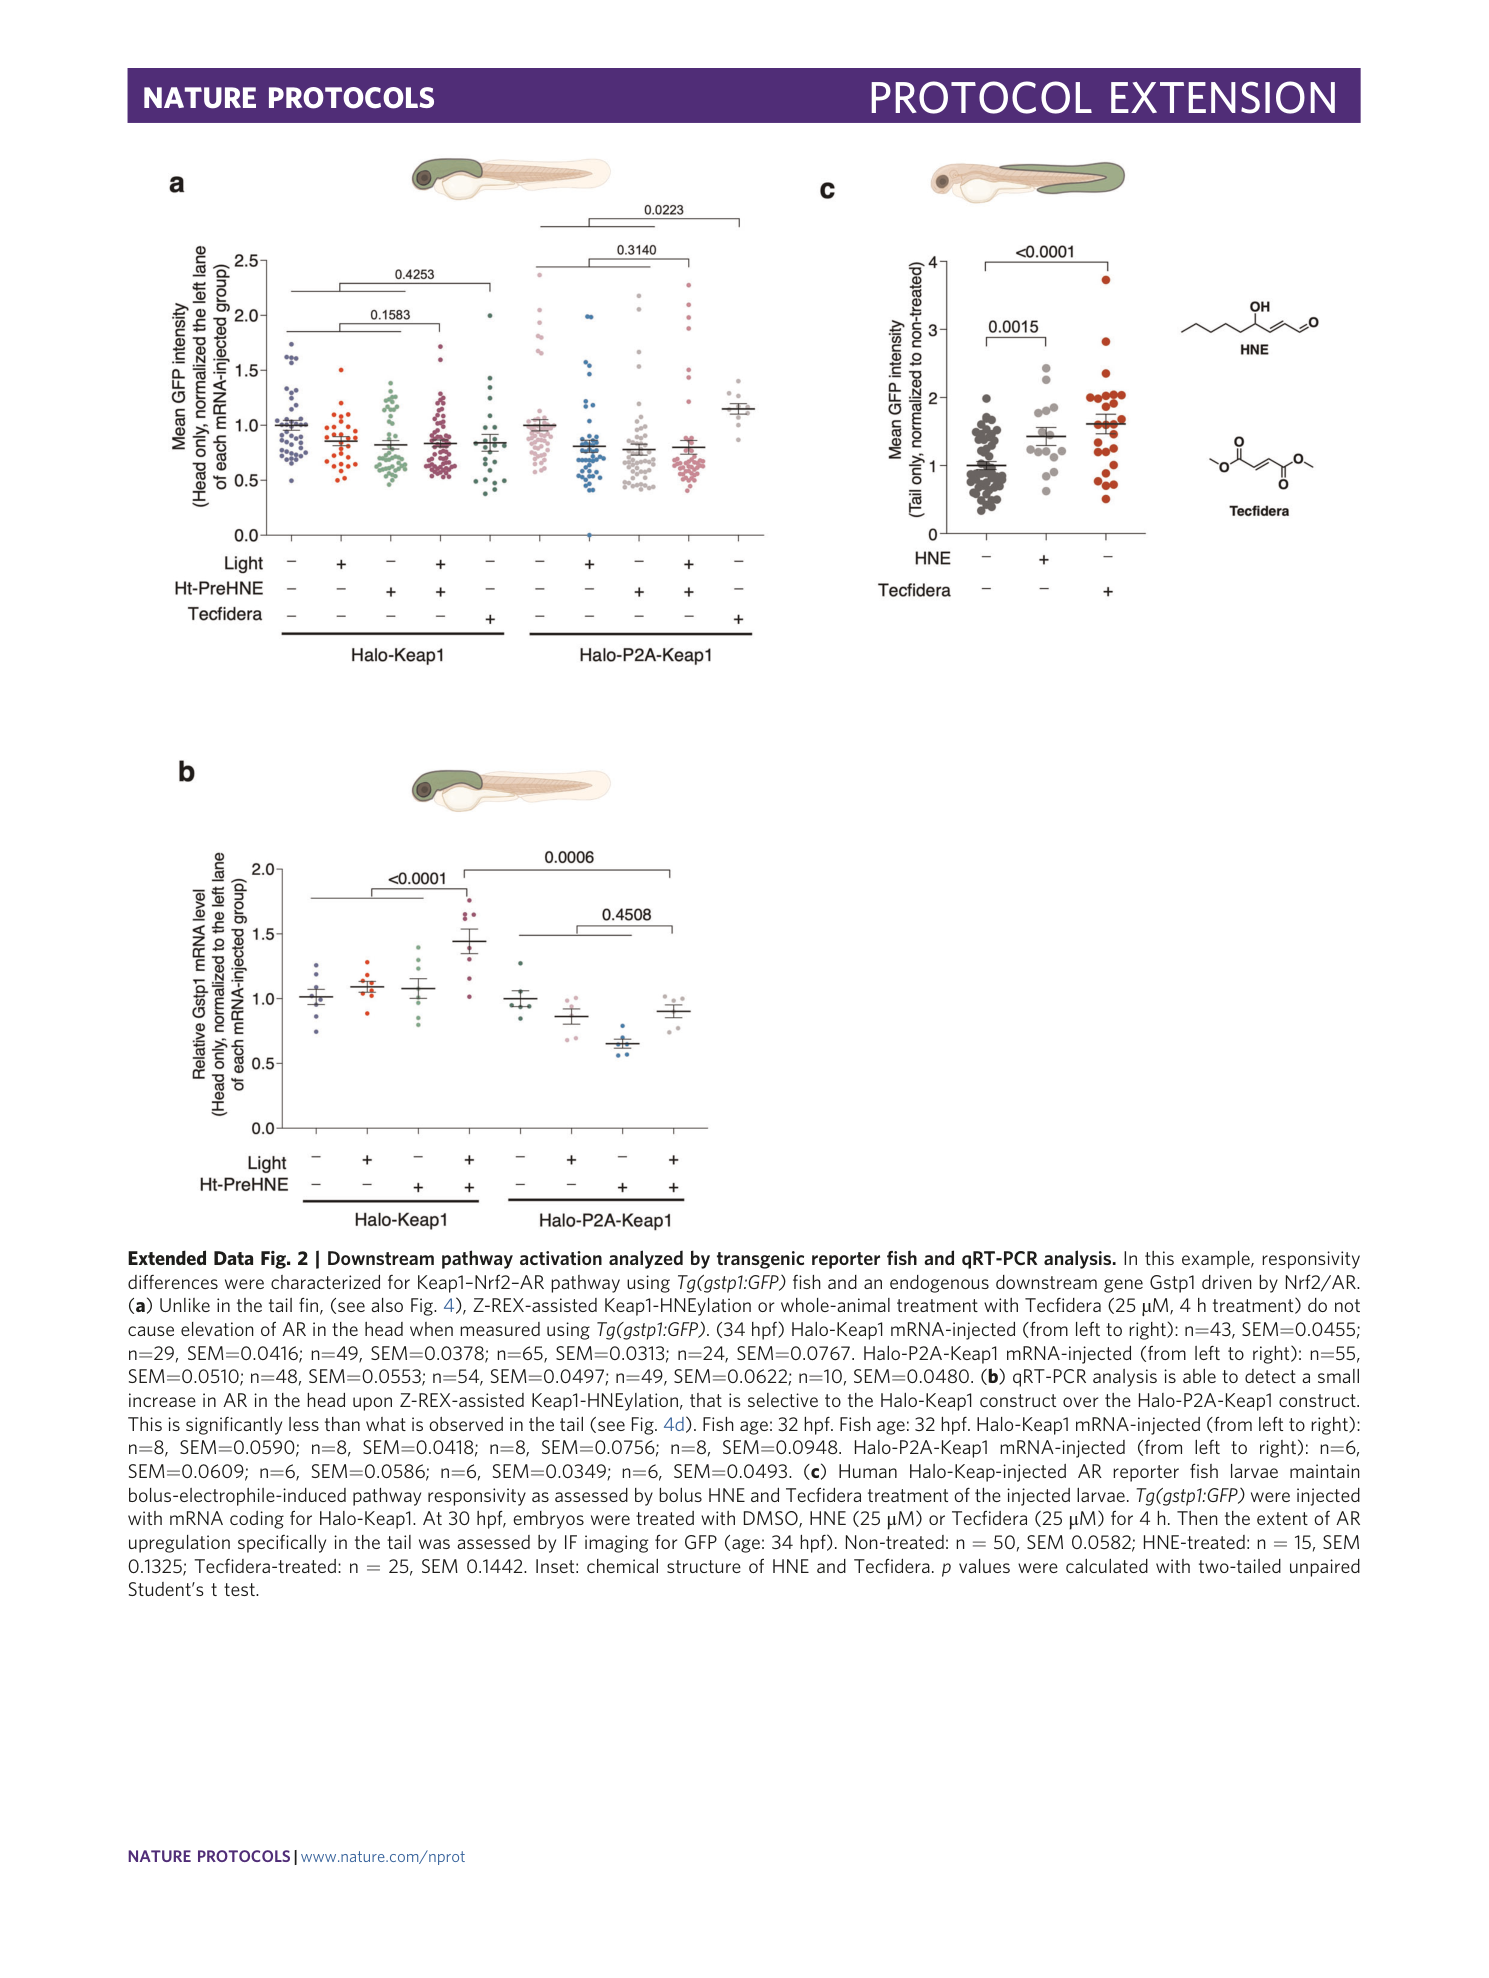
Extended Data Fig. 3 Validation of the same outcome between whole-mount immunofluorescence and live imaging.
( a ) Live Tg(gstp1:GFP) embryos (34 hpf) were dechorionated and placed on an agarose pad and imaged using GFP fluorescence (Ex. 495 nm, Em. 500-500 nm) and bright field. ( b ) Top row: Tg(gstp1:GFP) (34 hpf) were exposed to Z-REX conditions using Keap1-HNEylation as a representative example, and at 4-h post light exposure, dechorionated, fixed and immunostained for GFP as described. AlexaFluor568 channel shows GFP signal. GFP localization is similar for GFP intrinsic fluorescence (in (a)) and red fluorescence from IF (this figure). Bottom row: identical series of steps carried out as in top row except WT fish was used in place of Tg(gstp1:GFP) reporter fish. Scale bar, 500 µm in all images.
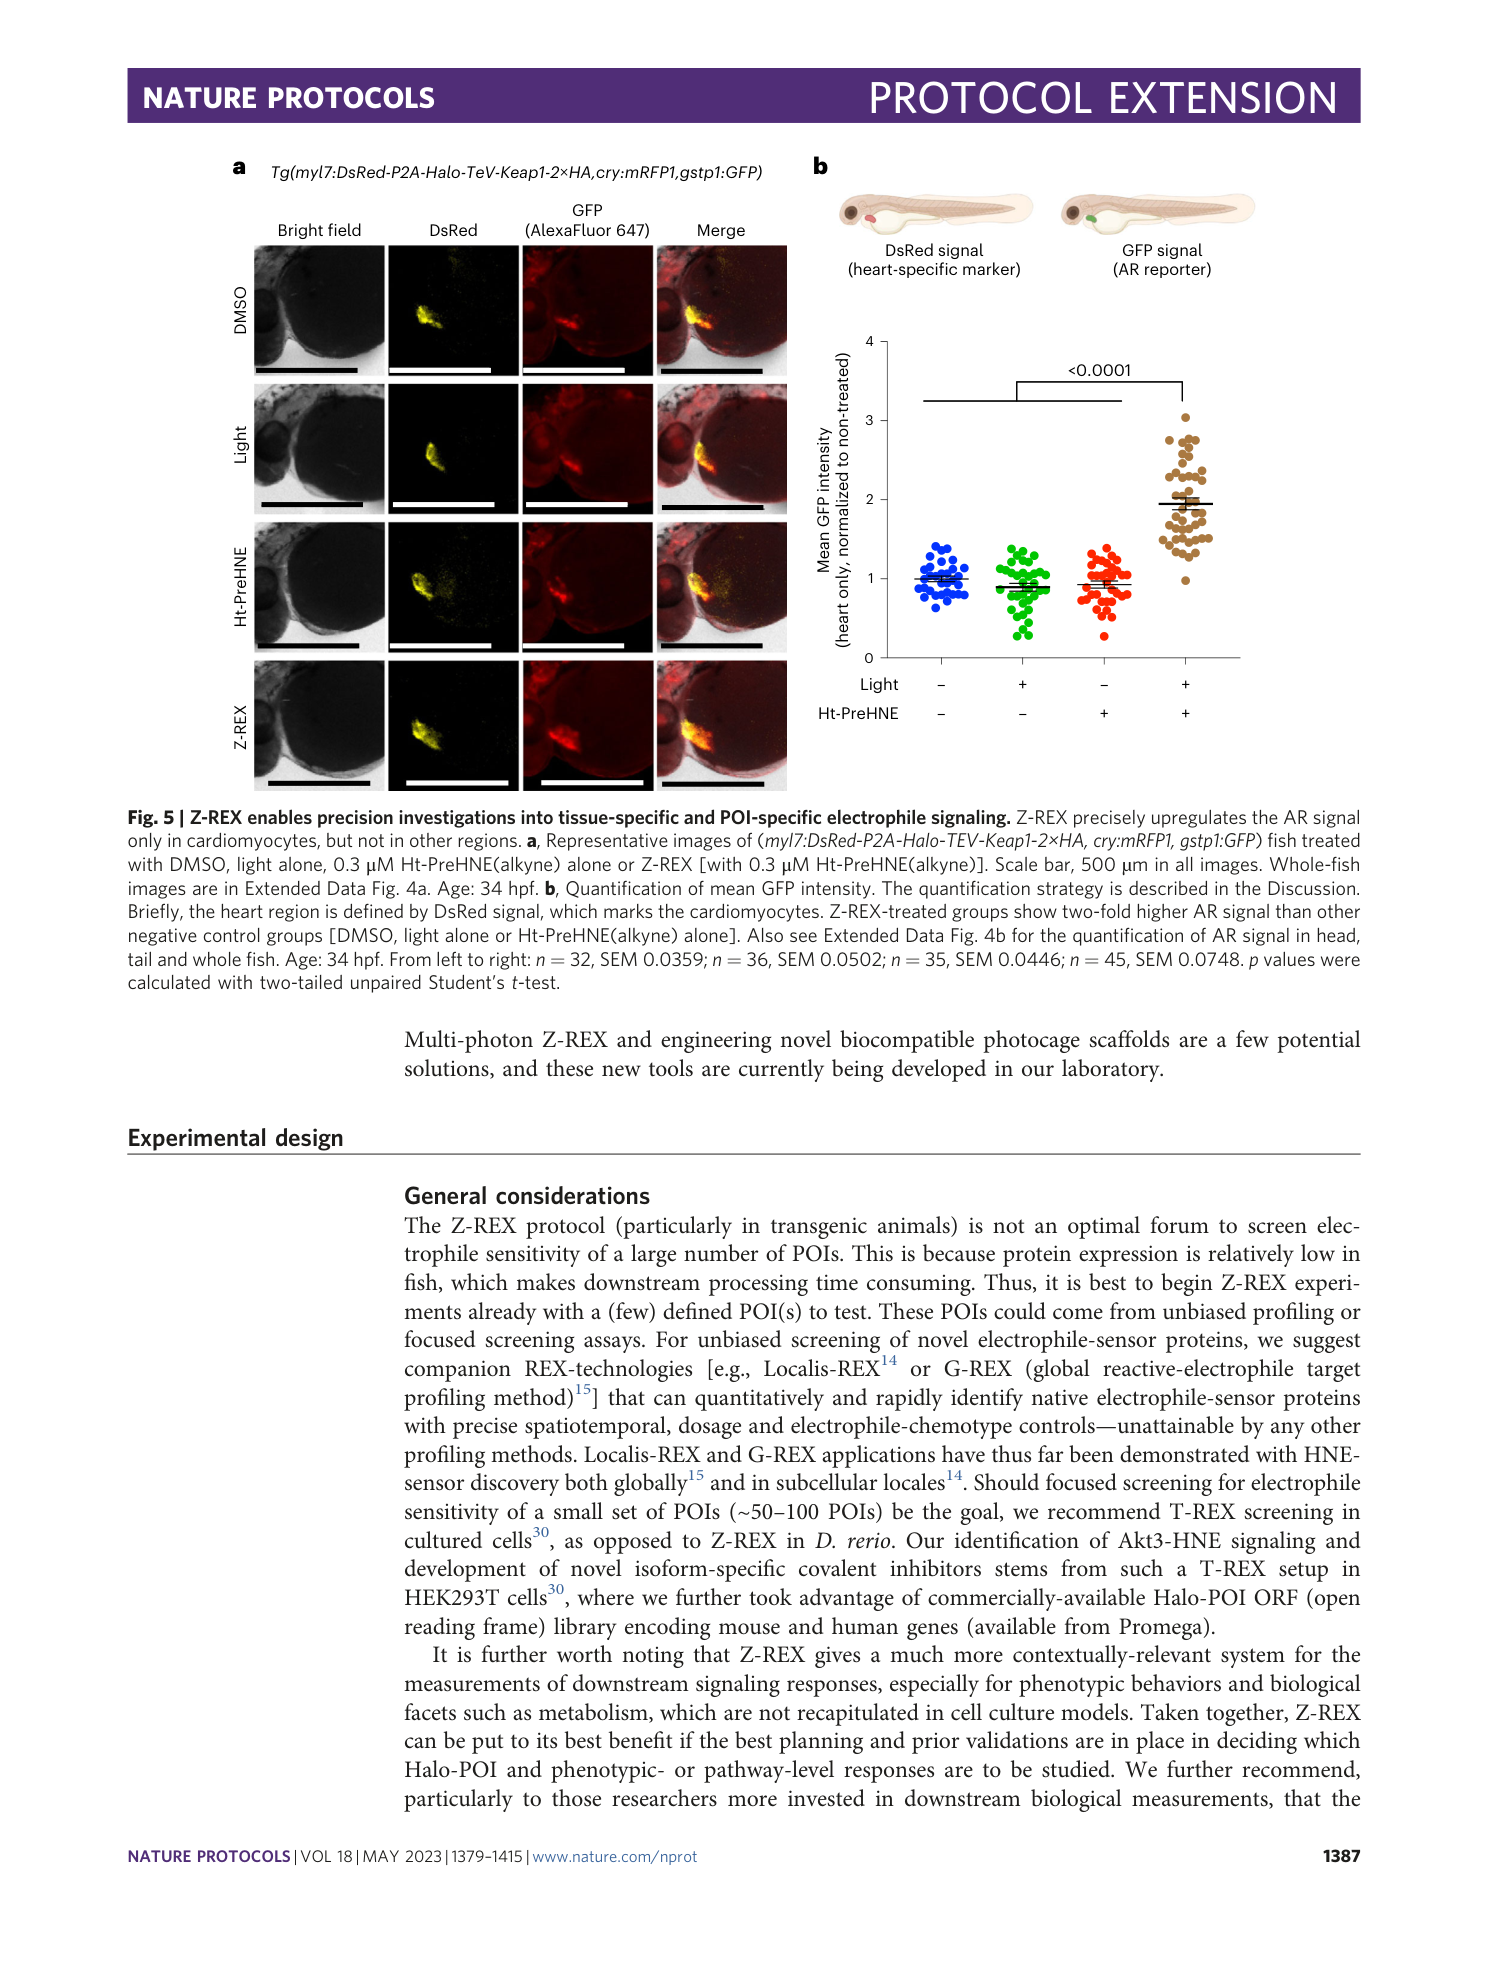
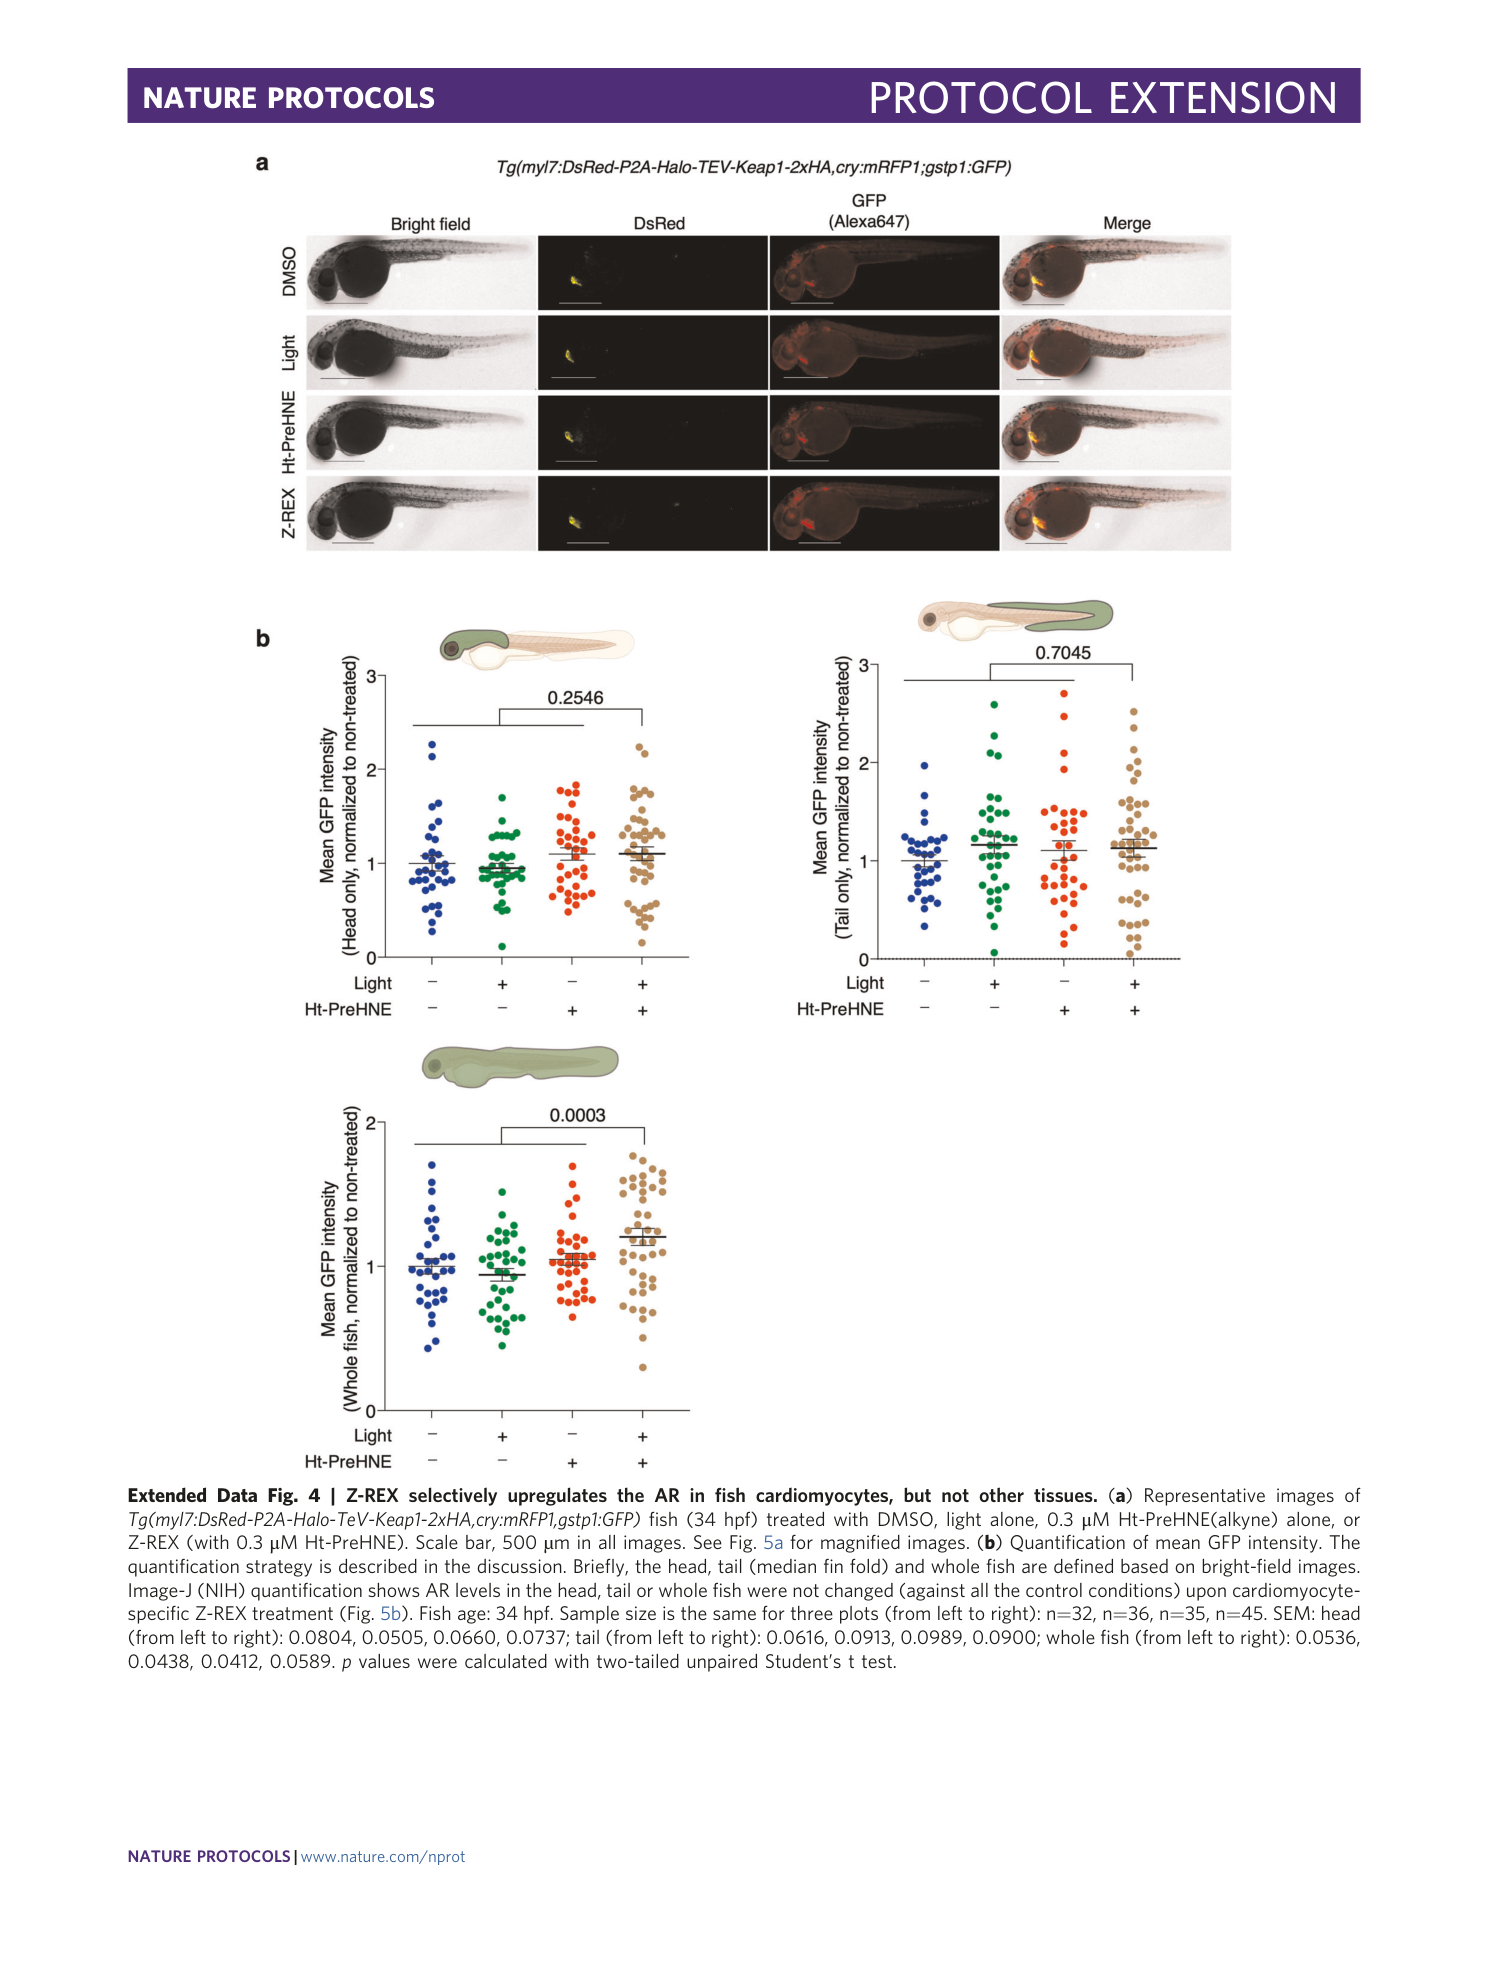
Extended Data Fig. 4 Z-REX selectively upregulates the AR in fish cardiomyocytes, but not other tissues.
( a ) Representative images of Tg(myl7:DsRed-P2A-Halo-T e V-Keap1-2xHA,cry:mRFP1,gstp1:GFP) fish (34 hpf) treated with DMSO, light alone, 0.3 μM Ht-PreHNE(alkyne) alone, or Z-REX (with 0.3 μM Ht-PreHNE). Scale bar, 500 µm in all images. See Fig. 5a for magnified images. ( b ) Quantification of mean GFP intensity. The quantification strategy is described in the discussion. Briefly, the head, tail (median fin fold) and whole fish are defined based on bright-field images. Image-J (NIH) quantification shows AR levels in the head, tail or whole fish were not changed (against all the control conditions) upon cardiomyocyte-specific Z-REX treatment (Fig. 5b ). Fish age: 34 hpf. Sample size is the same for three plots (from left to right): n=32, n=36, n=35, n=45. SEM: head (from left to right): 0.0804, 0.0505, 0.0660, 0.0737; tail (from left to right): 0.0616, 0.0913, 0.0989, 0.0900; whole fish (from left to right): 0.0536, 0.0438, 0.0412, 0.0589. p values were calculated with two-tailed unpaired Student’s t test.
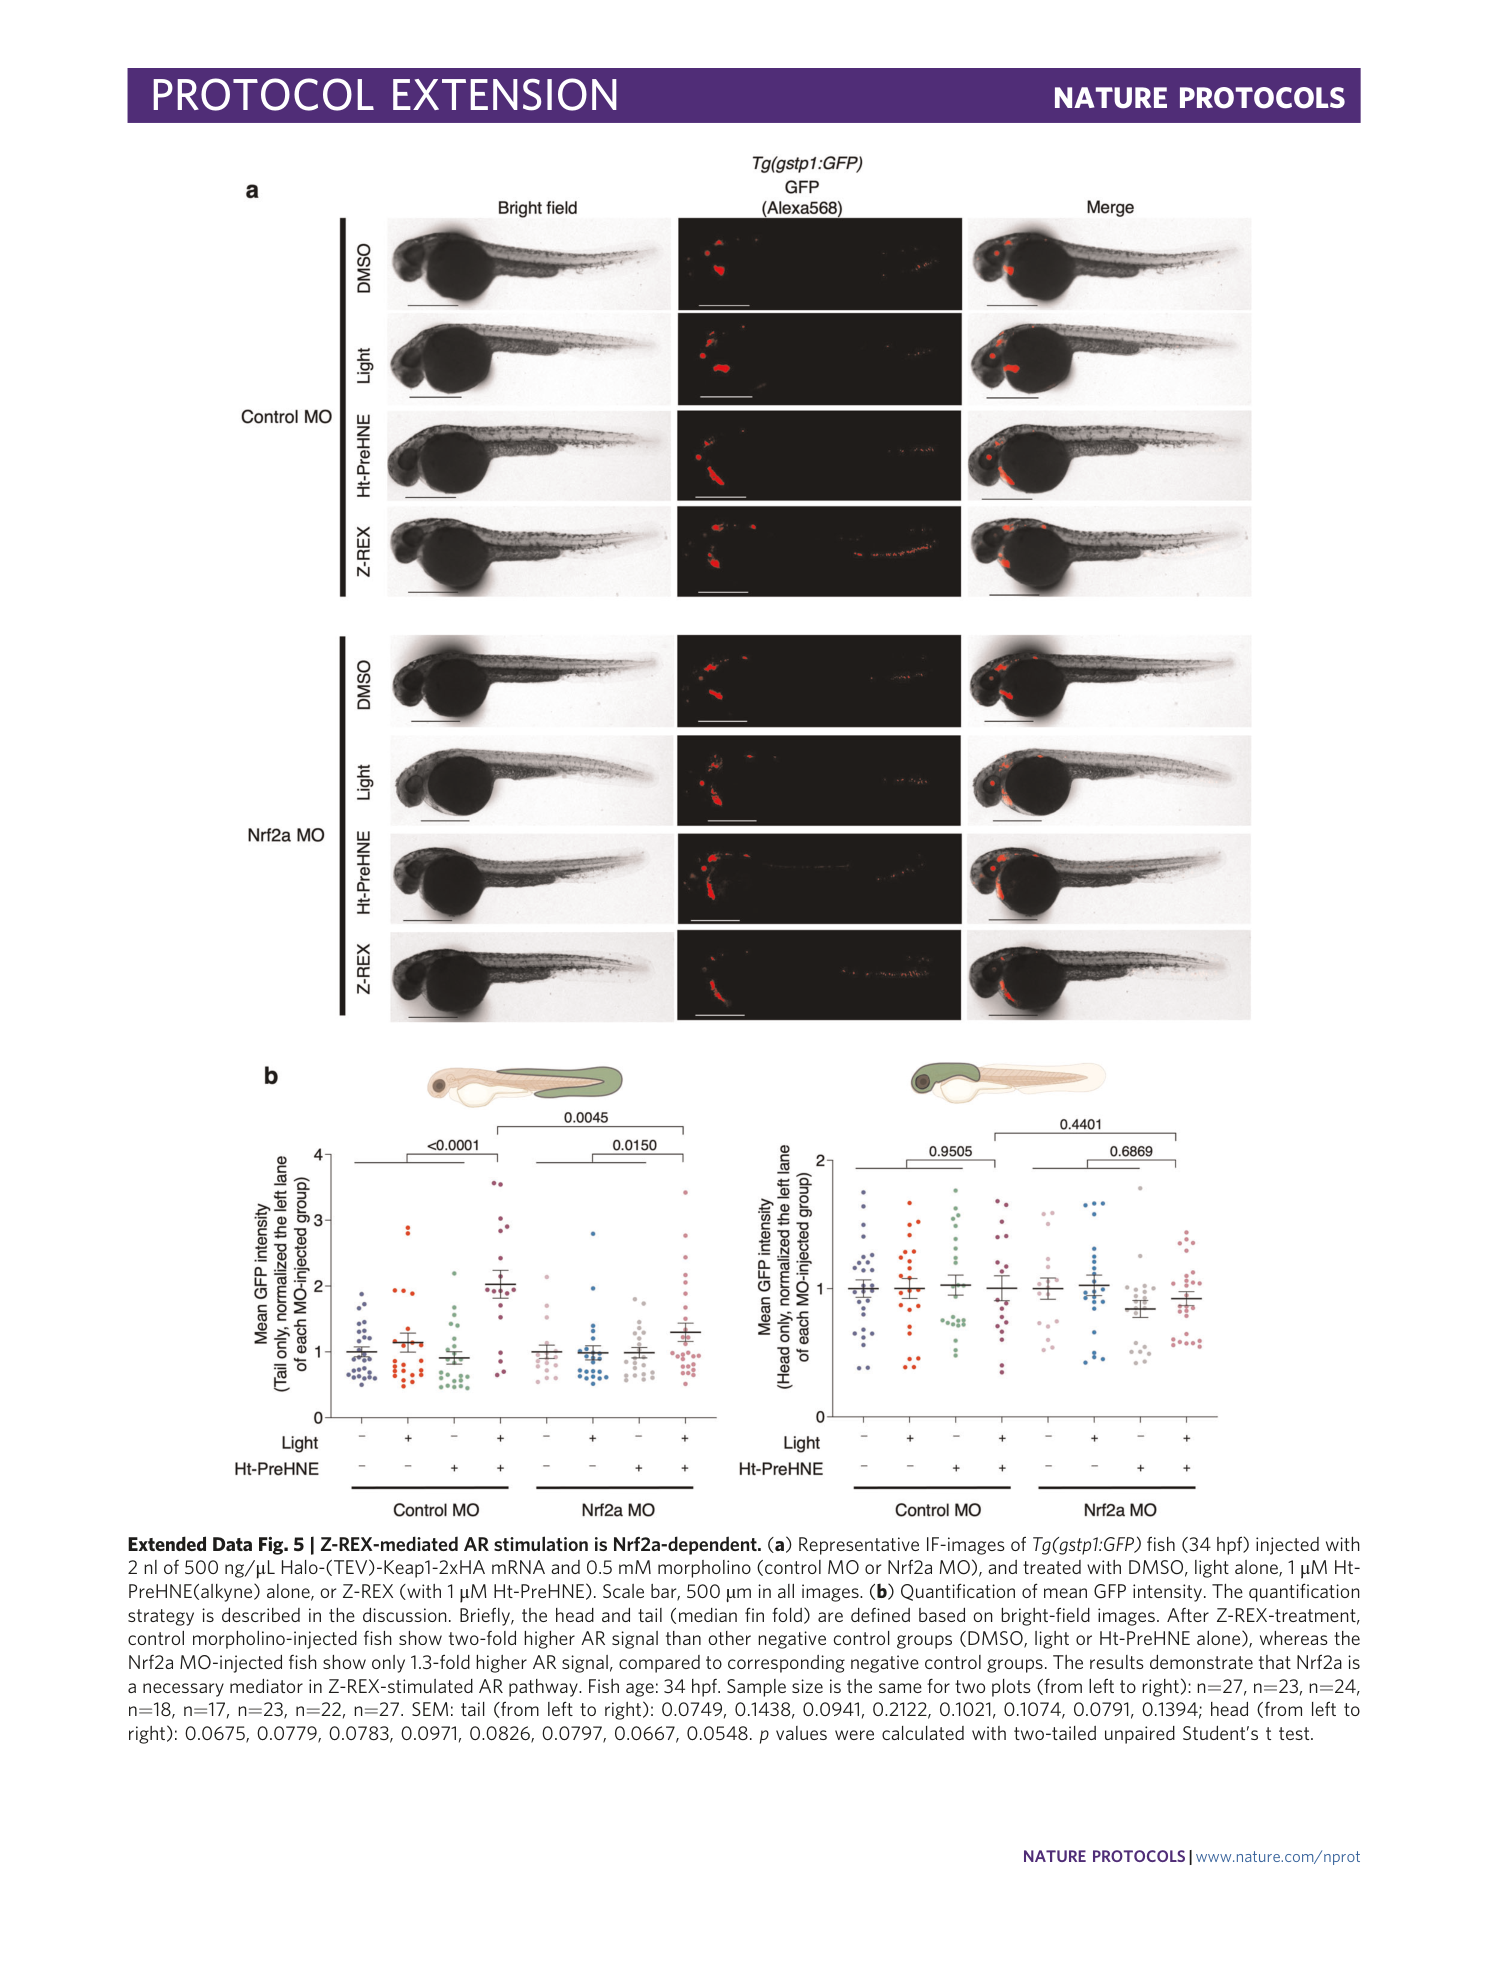
Extended Data Fig. 5 Z-REX-mediated AR stimulation is Nrf2a-dependent.
( a ) Representative IF-images of Tg(gstp1:GFP) fish (34 hpf) injected with 2 nl of 500 ng/μL Halo-(TEV)-Keap1-2xHA mRNA and 0.5 mM morpholino (control MO or Nrf2a MO), and treated with DMSO, light alone, 1 μM Ht-PreHNE(alkyne) alone, or Z-REX (with 1 μM Ht-PreHNE). Scale bar, 500 µm in all images. ( b ) Quantification of mean GFP intensity. The quantification strategy is described in the discussion. Briefly, the head and tail (median fin fold) are defined based on bright-field images. After Z-REX-treatment, control morpholino-injected fish show two-fold higher AR signal than other negative control groups (DMSO, light or Ht-PreHNE alone), whereas the Nrf2a MO-injected fish show only 1.3-fold higher AR signal, compared to corresponding negative control groups. The results demonstrate that Nrf2a is a necessary mediator in Z-REX-stimulated AR pathway. Fish age: 34 hpf. Sample size is the same for two plots (from left to right): n=27, n=23, n=24, n=18, n=17, n=23, n=22, n=27. SEM: tail (from left to right): 0.0749, 0.1438, 0.0941, 0.2122, 0.1021, 0.1074, 0.0791, 0.1394; head (from left to right): 0.0675, 0.0779, 0.0783, 0.0971, 0.0826, 0.0797, 0.0667, 0.0548. p values were calculated with two-tailed unpaired Student’s t test.
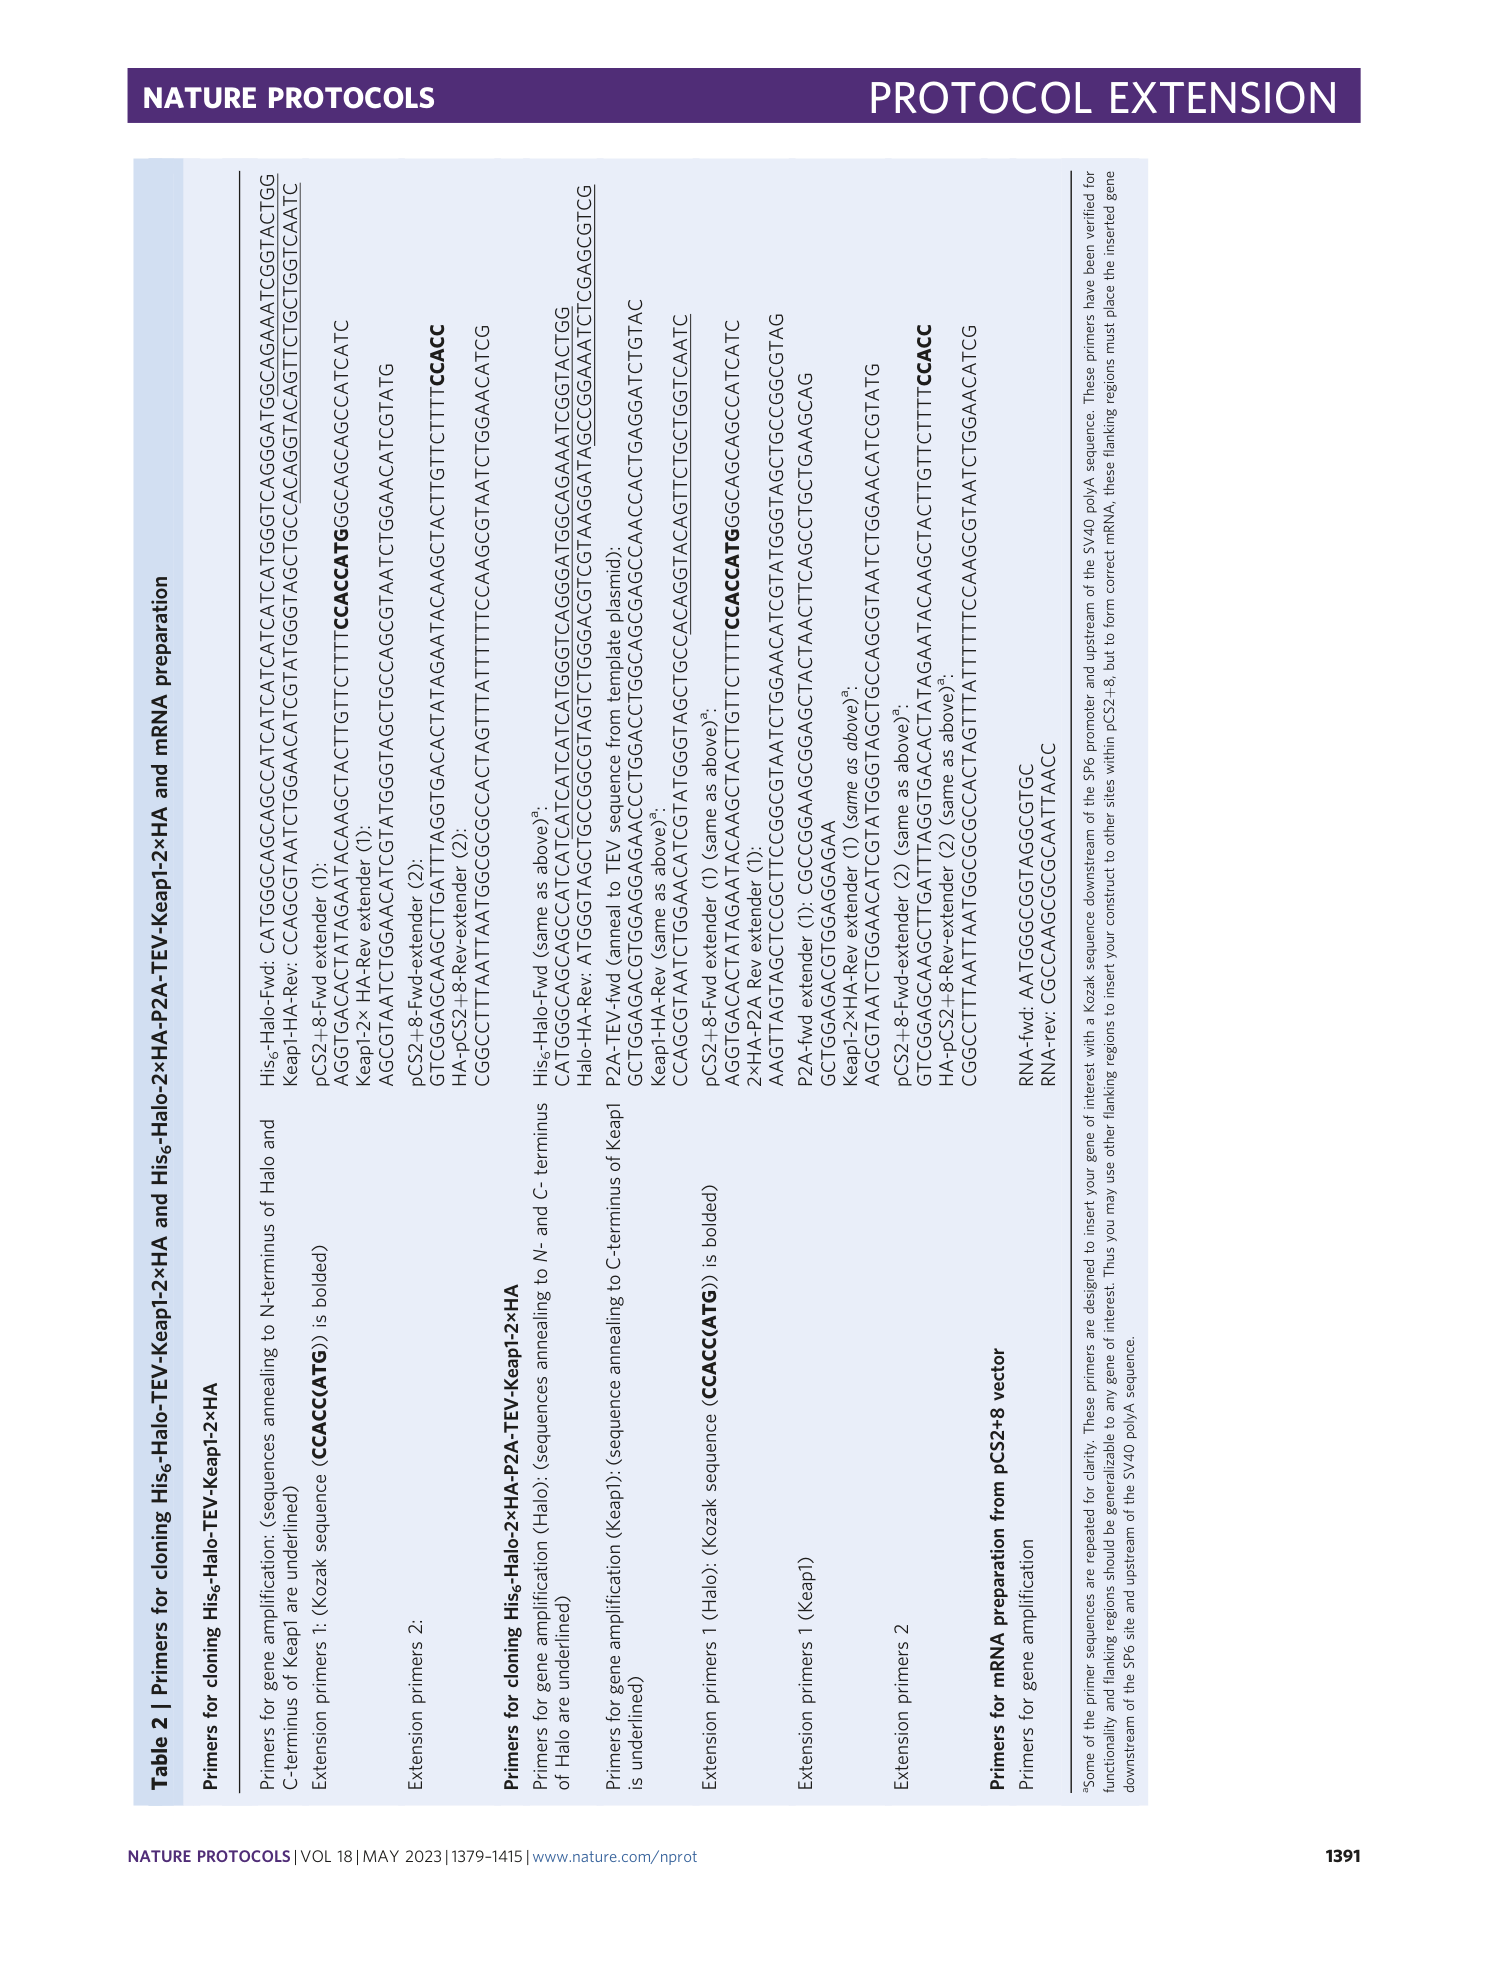
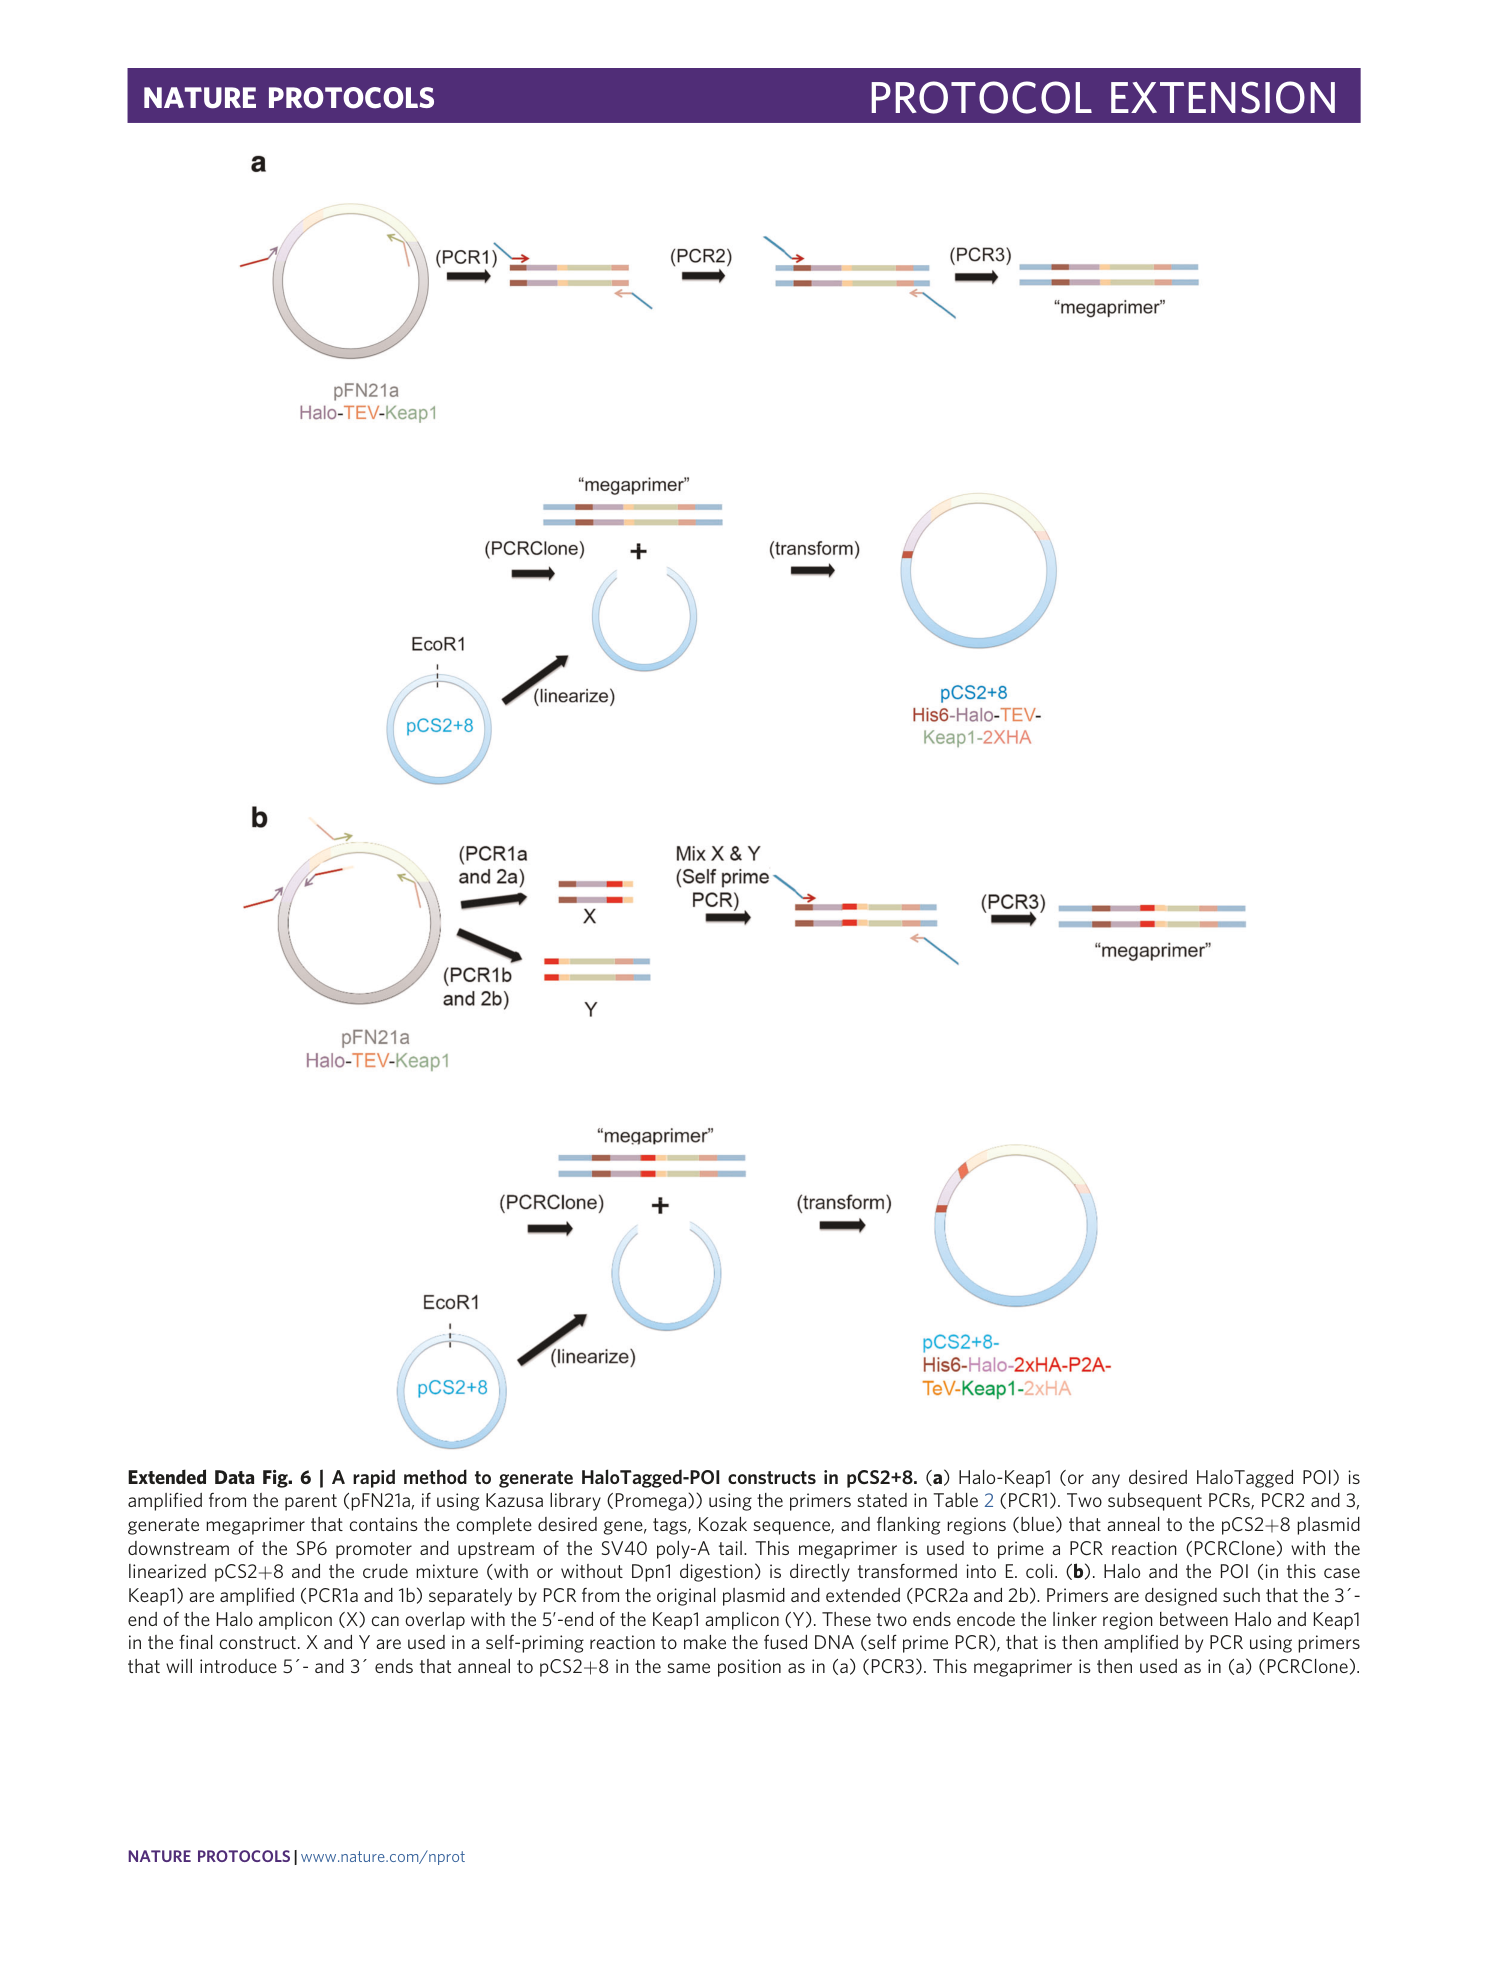
Extended Data Fig. 6 A rapid method to generate HaloTagged-POI constructs in pCS2+8.
( a ) Halo-Keap1 (or any desired HaloTagged POI) is amplified from the parent (pFN21a, if using Kazusa library (Promega)) using the primers stated in Table 2 (PCR1). Two subsequent PCRs, PCR2 and 3, generate megaprimer that contains the complete desired gene, tags, Kozak sequence, and flanking regions (blue) that anneal to the pCS2+8 plasmid downstream of the SP6 promoter and upstream of the SV40 poly-A tail. This megaprimer is used to prime a PCR reaction (PCRClone) with the linearized pCS2+8 and the crude mixture (with or without Dpn1 digestion) is directly transformed into E. coli. ( b ). Halo and the POI (in this case Keap1) are amplified (PCR1a and 1b) separately by PCR from the original plasmid and extended (PCR2a and 2b). Primers are designed such that the 3´-end of the Halo amplicon (X) can overlap with the 5’-end of the Keap1 amplicon (Y). These two ends encode the linker region between Halo and Keap1 in the final construct. X and Y are used in a self-priming reaction to make the fused DNA (self prime PCR), that is then amplified by PCR using primers that will introduce 5´- and 3´ ends that anneal to pCS2+8 in the same position as in (a) (PCR3). This megaprimer is then used as in (a) (PCRClone).
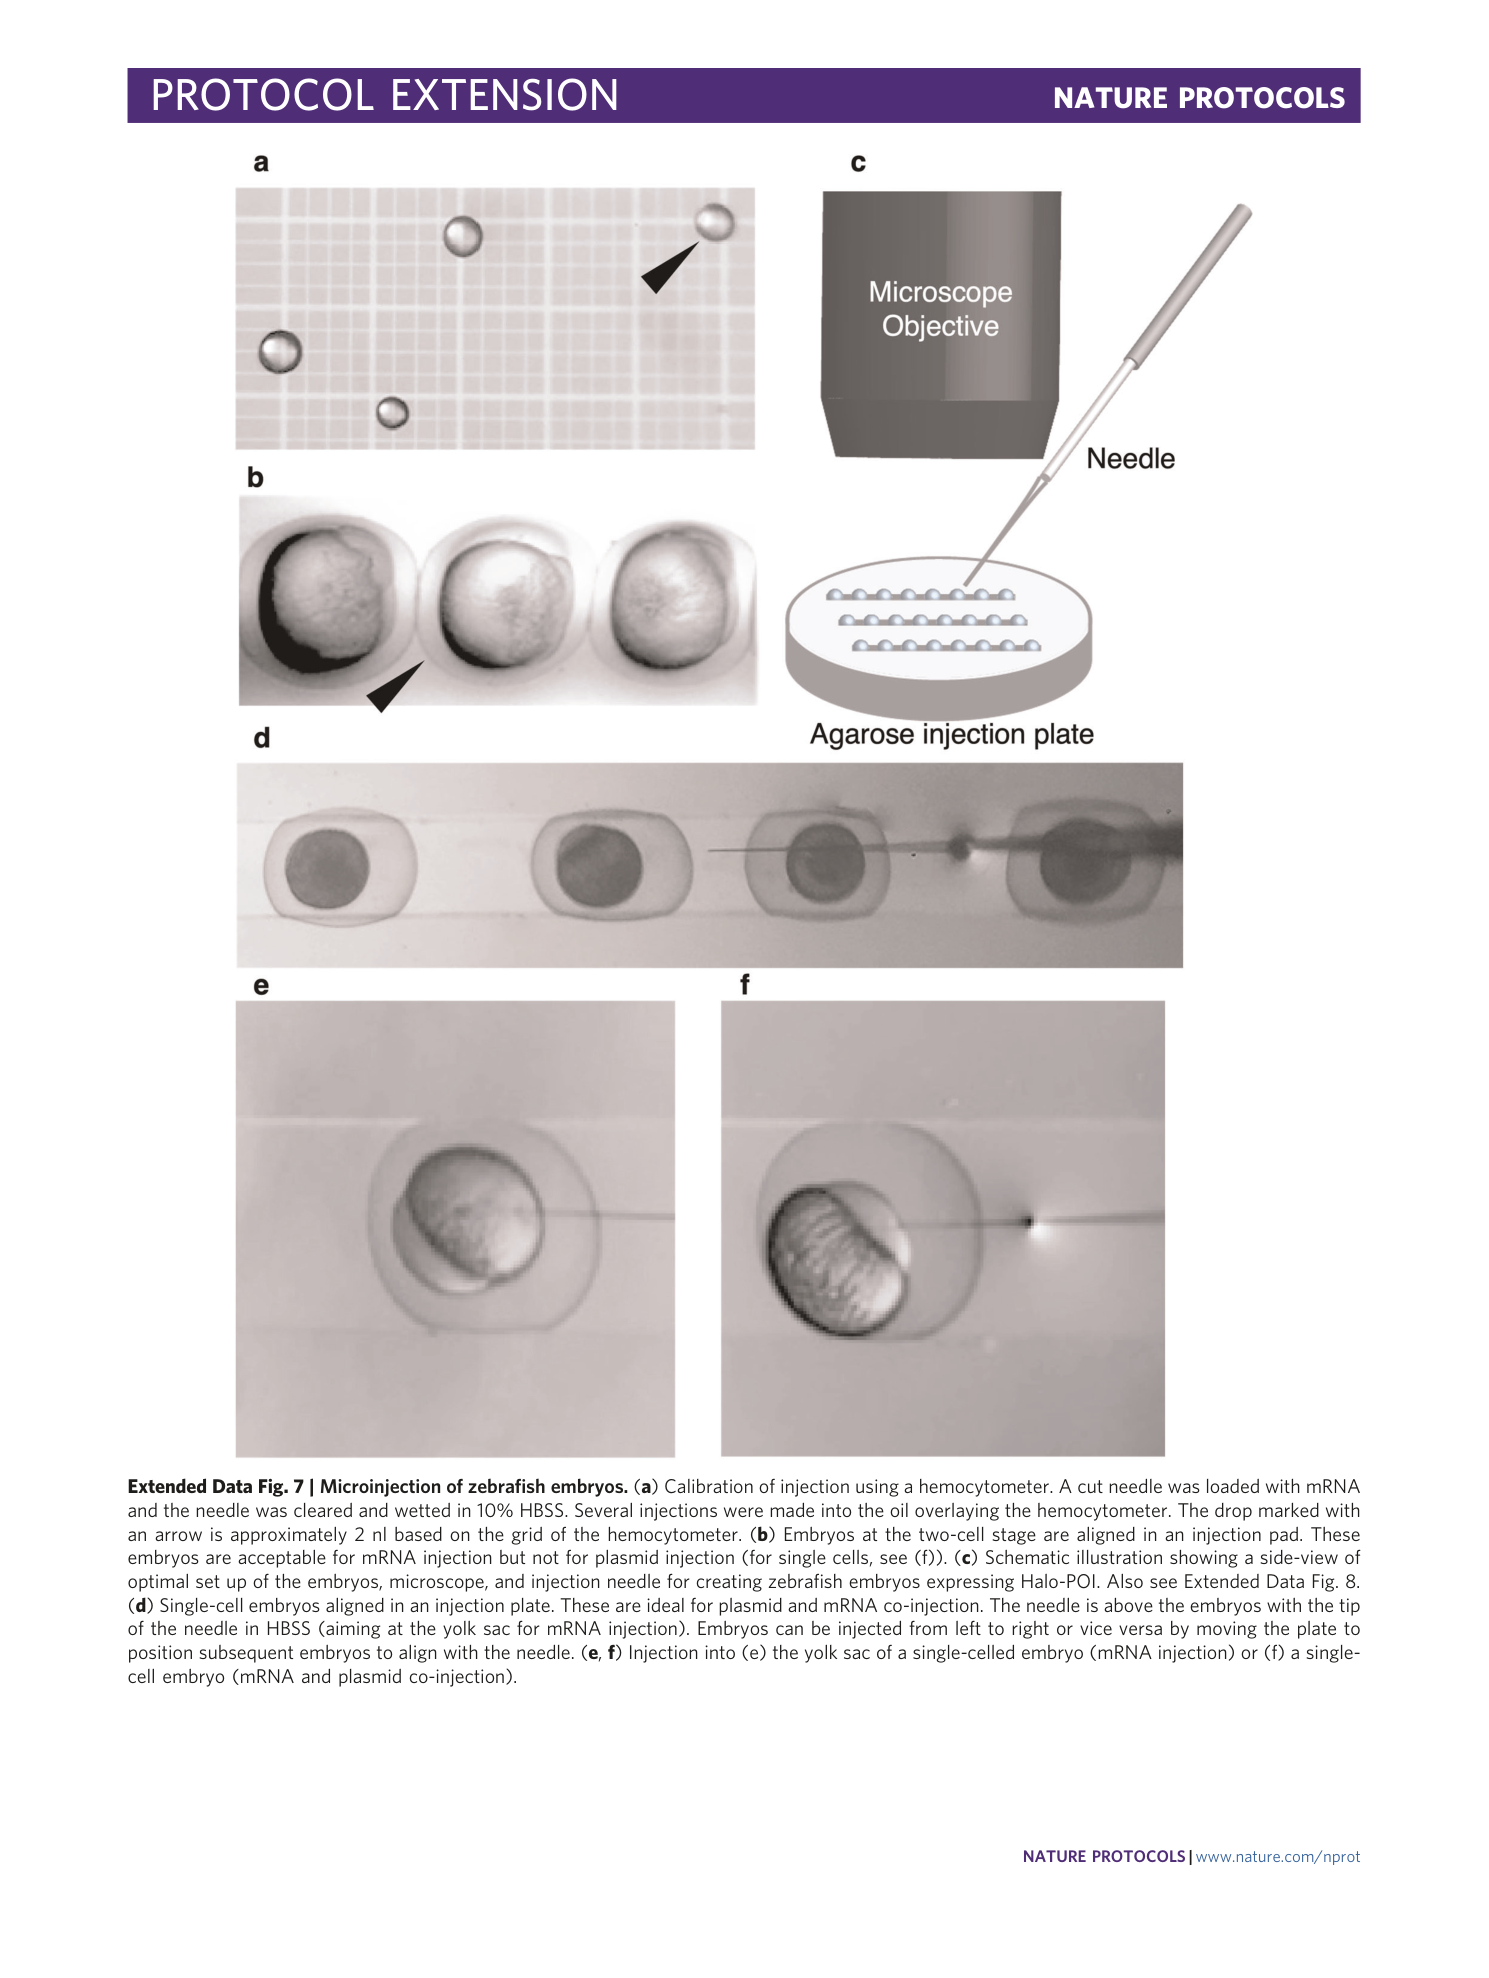
Extended Data Fig. 7 Microinjection of zebrafish embryos.
( a ) Calibration of injection using a hemocytometer. A cut needle was loaded with mRNA and the needle was cleared and wetted in 10% HBSS. Several injections were made into the oil overlaying the hemocytometer. The drop marked with an arrow is approximately 2 nl based on the grid of the hemocytometer. ( b ) Embryos at the two-cell stage are aligned in an injection pad. These embryos are acceptable for mRNA injection but not for plasmid injection (for single cells, see (f)). ( c ) Schematic illustration showing a side-view of optimal set up of the embryos, microscope, and injection needle for creating zebrafish embryos expressing Halo-POI. Also see Extended Data Fig. 8 . ( d ) Single-cell embryos aligned in an injection plate. These are ideal for plasmid and mRNA co-injection. The needle is above the embryos with the tip of the needle in HBSS (aiming at the yolk sac for mRNA injection). Embryos can be injected from left to right or vice versa by moving the plate to position subsequent embryos to align with the needle. ( e , f ) Injection into (e) the yolk sac of a single-celled embryo (mRNA injection) or (f) a single-cell embryo (mRNA and plasmid co-injection).
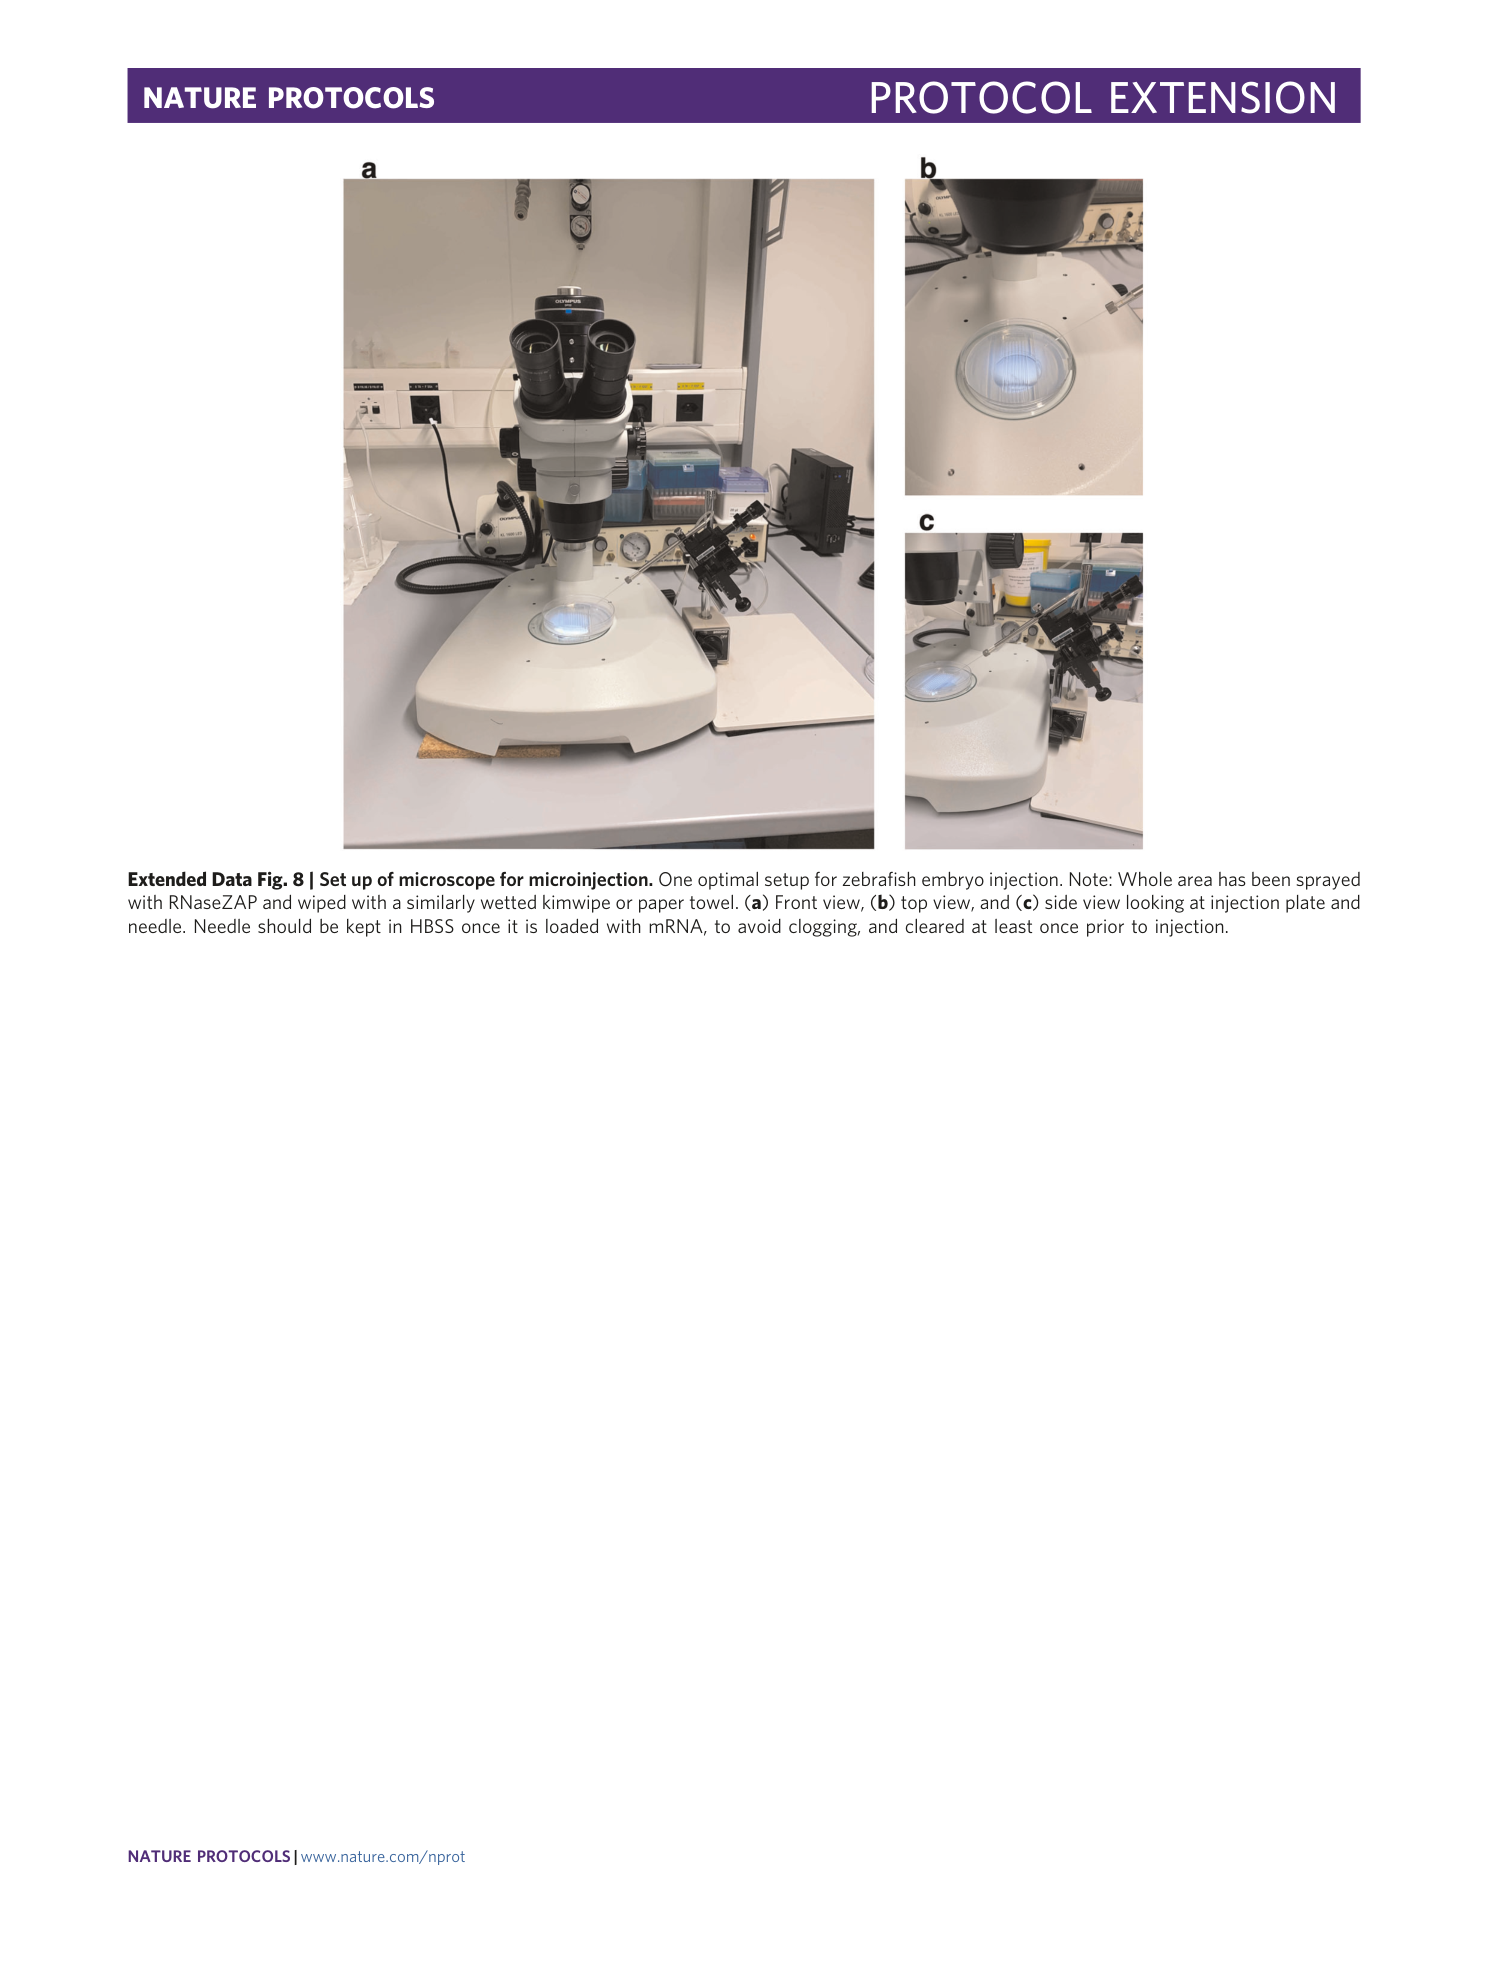
Extended Data Fig. 8 Set up of microscope for microinjection.
One optimal setup for zebrafish embryo injection. Note: Whole area has been sprayed with RNaseZAP and wiped with a similarly wetted kimwipe or paper towel. ( a ) Front view, ( b ) top view, and ( c ) side view looking at injection plate and needle. Needle should be kept in HBSS once it is loaded with mRNA, to avoid clogging, and cleared at least once prior to injection.
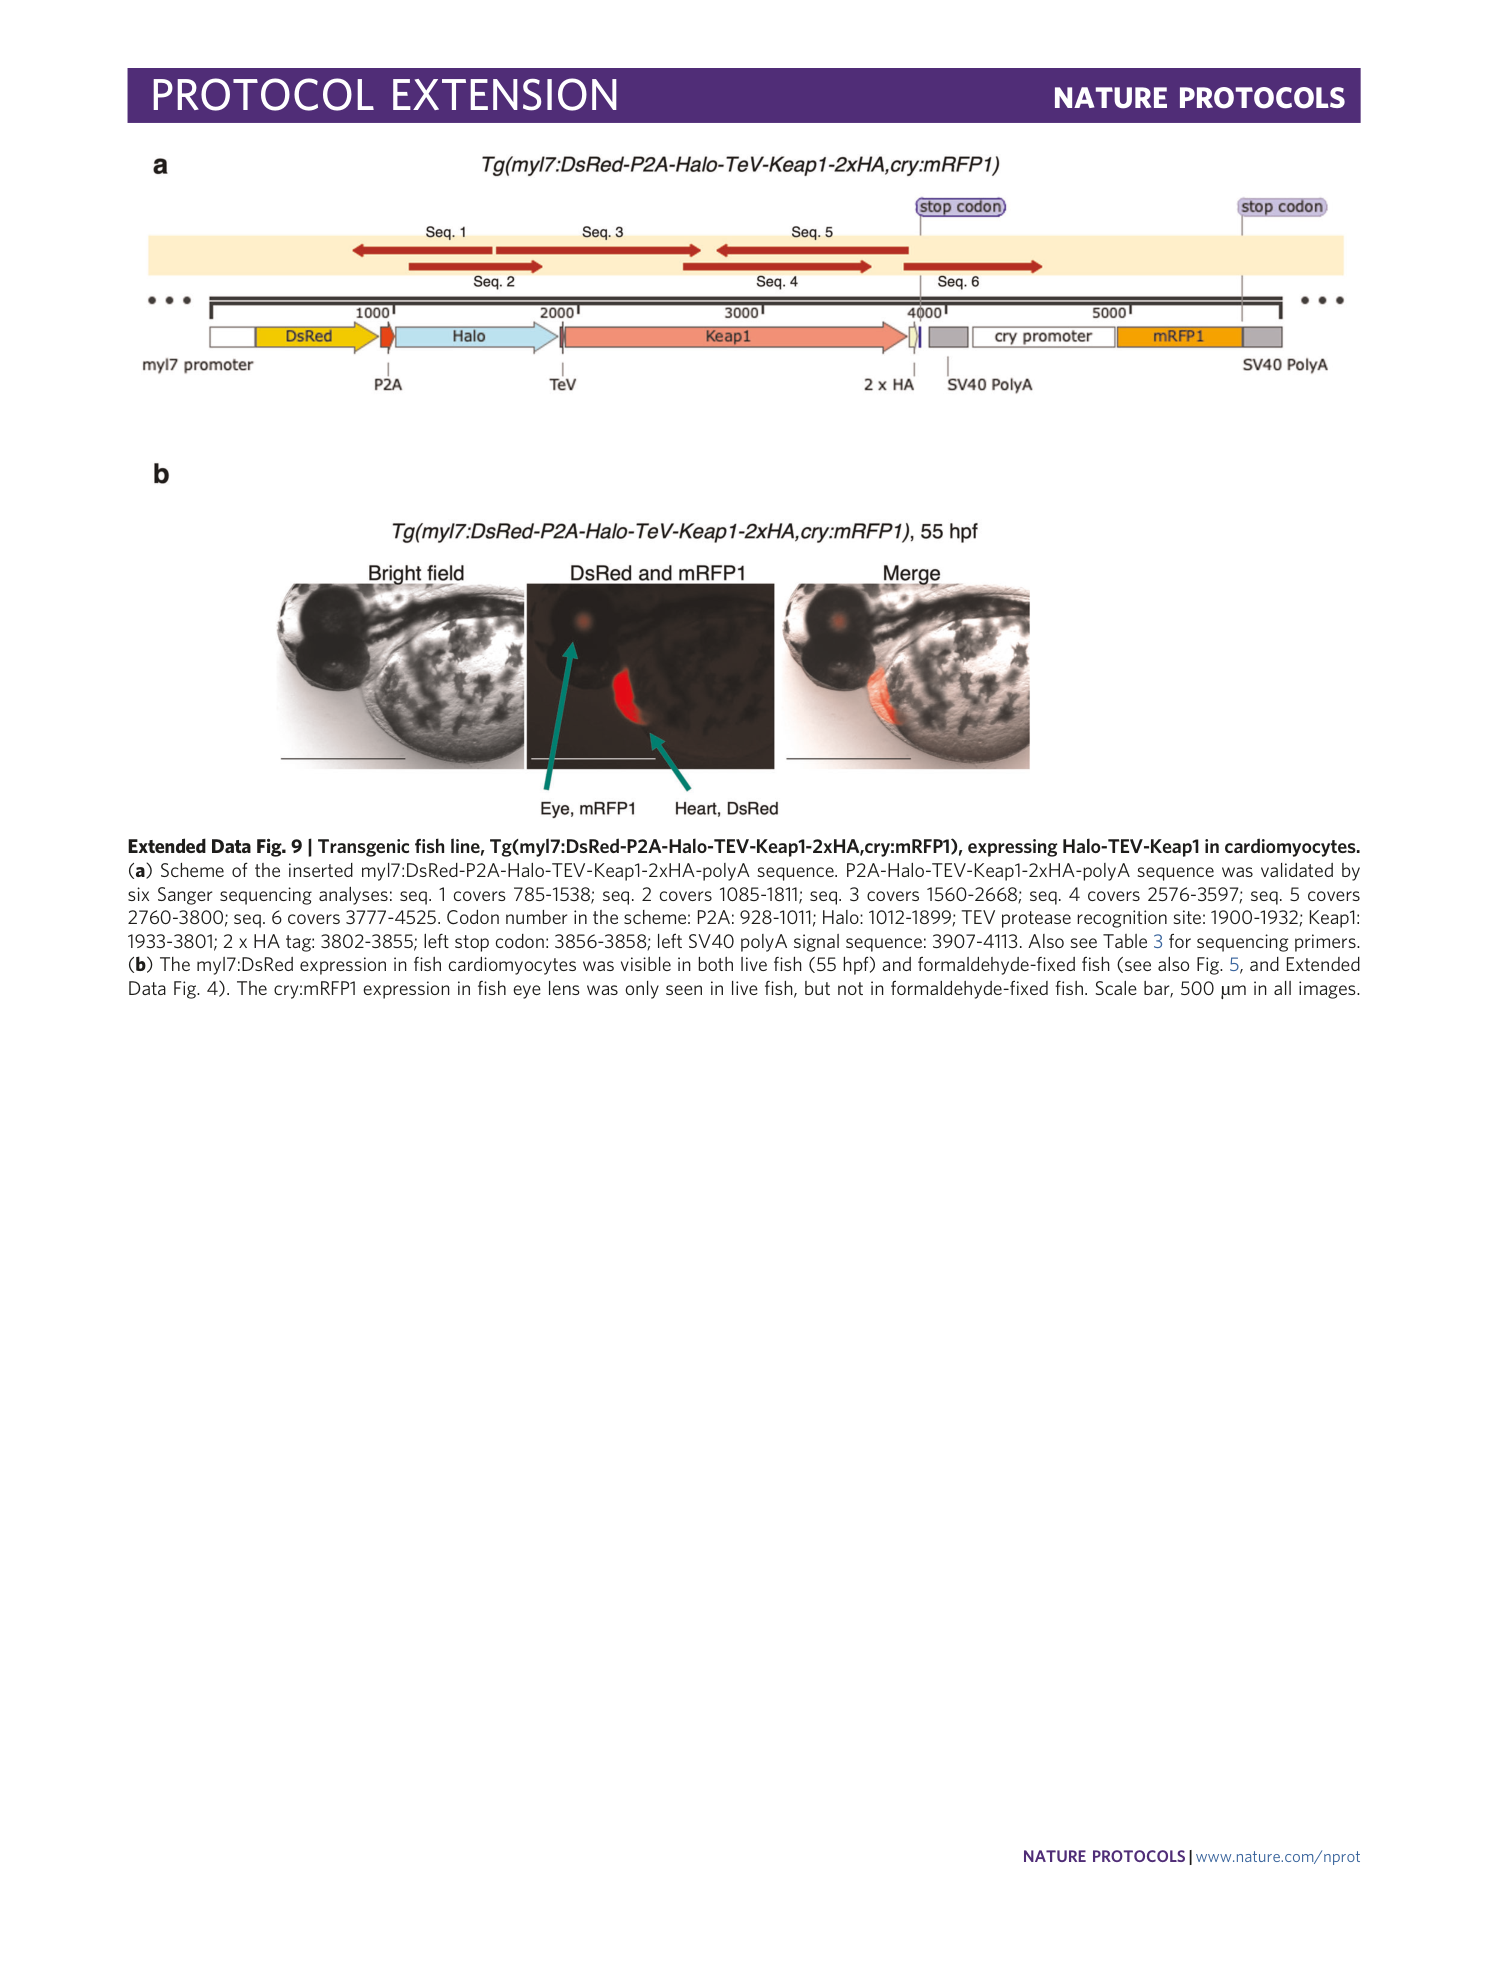
Extended Data Fig. 9 Transgenic fish line, Tg(myl7:DsRed-P2A-Halo-TEV-Keap1-2xHA,cry:mRFP1), expressing Halo-TEV-Keap1 in cardiomyocytes.
( a ) Scheme of the inserted myl7:DsRed-P2A-Halo-TEV-Keap1-2xHA-polyA sequence. P2A-Halo-TEV-Keap1-2xHA-polyA sequence was validated by six Sanger sequencing analyses: seq. 1 covers 785-1538; seq. 2 covers 1085-1811; seq. 3 covers 1560-2668; seq. 4 covers 2576-3597; seq. 5 covers 2760-3800; seq. 6 covers 3777-4525. Codon number in the scheme: P2A: 928-1011; Halo: 1012-1899; TEV protease recognition site: 1900-1932; Keap1: 1933-3801; 2 x HA tag: 3802-3855; left stop codon: 3856-3858; left SV40 polyA signal sequence: 3907-4113. Also see Table 3 for sequencing primers. ( b ) The myl7:DsRed expression in fish cardiomyocytes was visible in both live fish (55 hpf) and formaldehyde-fixed fish (see also Fig. 5 , and Extended Data Fig. 4 ). The cry:mRFP1 expression in fish eye lens was only seen in live fish, but not in formaldehyde-fixed fish. Scale bar, 500 µm in all images.
