Visualizing Human Protein-Protein Interactions and Subcellular Localizations on Cell Images Through CellMap
Christian Dallago, Christian Dallago, Tatyana Goldberg, Tatyana Goldberg, Miguel Angel Andrade-Navarro, Miguel Angel Andrade-Navarro, Gregorio Alanis-Lobato, Gregorio Alanis-Lobato, Burkhard Rost, Burkhard Rost
Abstract
Visualizing protein data remains a challenging and stimulating task. Useful and intuitive visualization tools may help advance biomolecular and medical research; unintuitive tools may bar important breakthroughs. This protocol describes two use cases for the CellMap (http://cellmap.protein.properties) web tool. The tool allows researchers to visualize human protein-protein interaction data constrained by protein subcellular localizations. In the simplest form, proteins are visualized on cell images that also show protein-protein interactions (PPIs) through lines (edges) connecting the proteins across the compartments. At a glance, this simultaneously highlights spatial constraints that proteins are subject to in their physical environment and visualizes PPIs against these localizations. Visualizing two realities helps in decluttering the protein interaction visualization from “hairball” phenomena that arise when single proteins or groups thereof interact with hundreds of partners. © 2019 The Authors.
Basic Protocol 1 : Visualizing proteins and their interactions on cell images
Basic Protocol 2 : Displaying all interaction partners for a protein
INTRODUCTION
Experimental evidence for protein subcellular localization [also referred to as “cellular component” (The Gene Ontology Consortium, 2019) or “location”] and protein-protein interactions (PPIs) is steadily increasing in big protein databases, e.g., UniProt (The UniProt Consortium, 2019). Even for proteins still lacking reliable experimental annotations, many prediction tools exist (Almagro Armenteros, Sønderby, Sønderby, Nielsen, & Winther, 2017; Cong, Anishchenko, Ovchinnikov, & Baker, 2019; Kovács et al., 2019). With increasing availability and abundance of these data, interactive and intuitive ways of visualization on a system level—i.e., for larger data sets rather than individual proteins—become increasingly important, both for research and educational purposes. Too often, visualizations fall short on displaying system-wide phenomena, as the number of display items greatly exceed the boundaries of intuitiveness that visualization tools aim to deliver. The main goal of CellMap is the visualization of PPI data constrained by protein localization. CellMap works by placing proteins onto representations of cell images, decluttering the view from PPI “hairballs,” and describing the interaction of, e.g., three proteins in a pathway that interact with hundreds of others. The inspiration came from the way people are displayed on a city map. However, each person has a unique localization at any given time, whereas those individual resolutions are not available for proteins, which can simultaneously occupy different localizations (several copies of protein X) or move around/migrate over the course of processes without giving the investigator knowledge of where they are at a particular time point. These facts represent a challenge when visualizing PPIs and localization, with a plethora of approaches to ultimately address the problem.
The following protocols outline one solution for visualizing complex PPI networks that is deliberately meant to remain simple, namely CellMap. Basic Protocol 1 describes steps on how to find proteins, add them to a PPI visualization, and display lines (interactions) between them. Basic Protocol 2 describes how to load many proteins onto the PPI visualization at once and how to display lines connecting all of them.
Basic Protocol 1: VISUALIZING PROTEINS AND THEIR INTERACTIONS ON CELL IMAGES
CellMap (http://cellmap.protein.properties) visualizes proteins by their subcellular localizations on images of cells—optionally provided by the user—users can submit images of cells on the web server and perform the remainder of steps described in this protocol using the image provided. On top, CellMap displays lines (edges) between proteins that interact according to the PPI database HIPPIE (Alanis-Lobato, Andrade-Navarro, & Schaefer, 2017). This protocol explains (1) where to navigate to open up CellMap; (2) what identifiers are needed to use the system; (3) how to add proteins to the viewer; and (4) how to make the visualization clearer (optional); (5) how to move proteins across localizations (optional); and (6) how to display lines connecting the proteins (optional). We also include an extra step (7) to change the cell image underlying the visualization.
Materials
- Users will need a computer, tablet, or smartphone with an active internet connection. An up-to-date browser is required to operate CellMap. At least for first-time use, we suggest access on a desktop computer through Chrome/Chromium (v50+).
1.Open the protein-protein interaction view in CellMap by navigating to https://cellmap.protein.properties/ppi. Once open, the viewer displays a full-screen image of a cell.
2.Identify proteins of interest : To begin using CellMap, you need an identifier (or accession number) from UniProt [RRID:SCR_002380, (The UniProt Consortium, 2019)] or a primary gene/protein name of one or several proteins of interest.
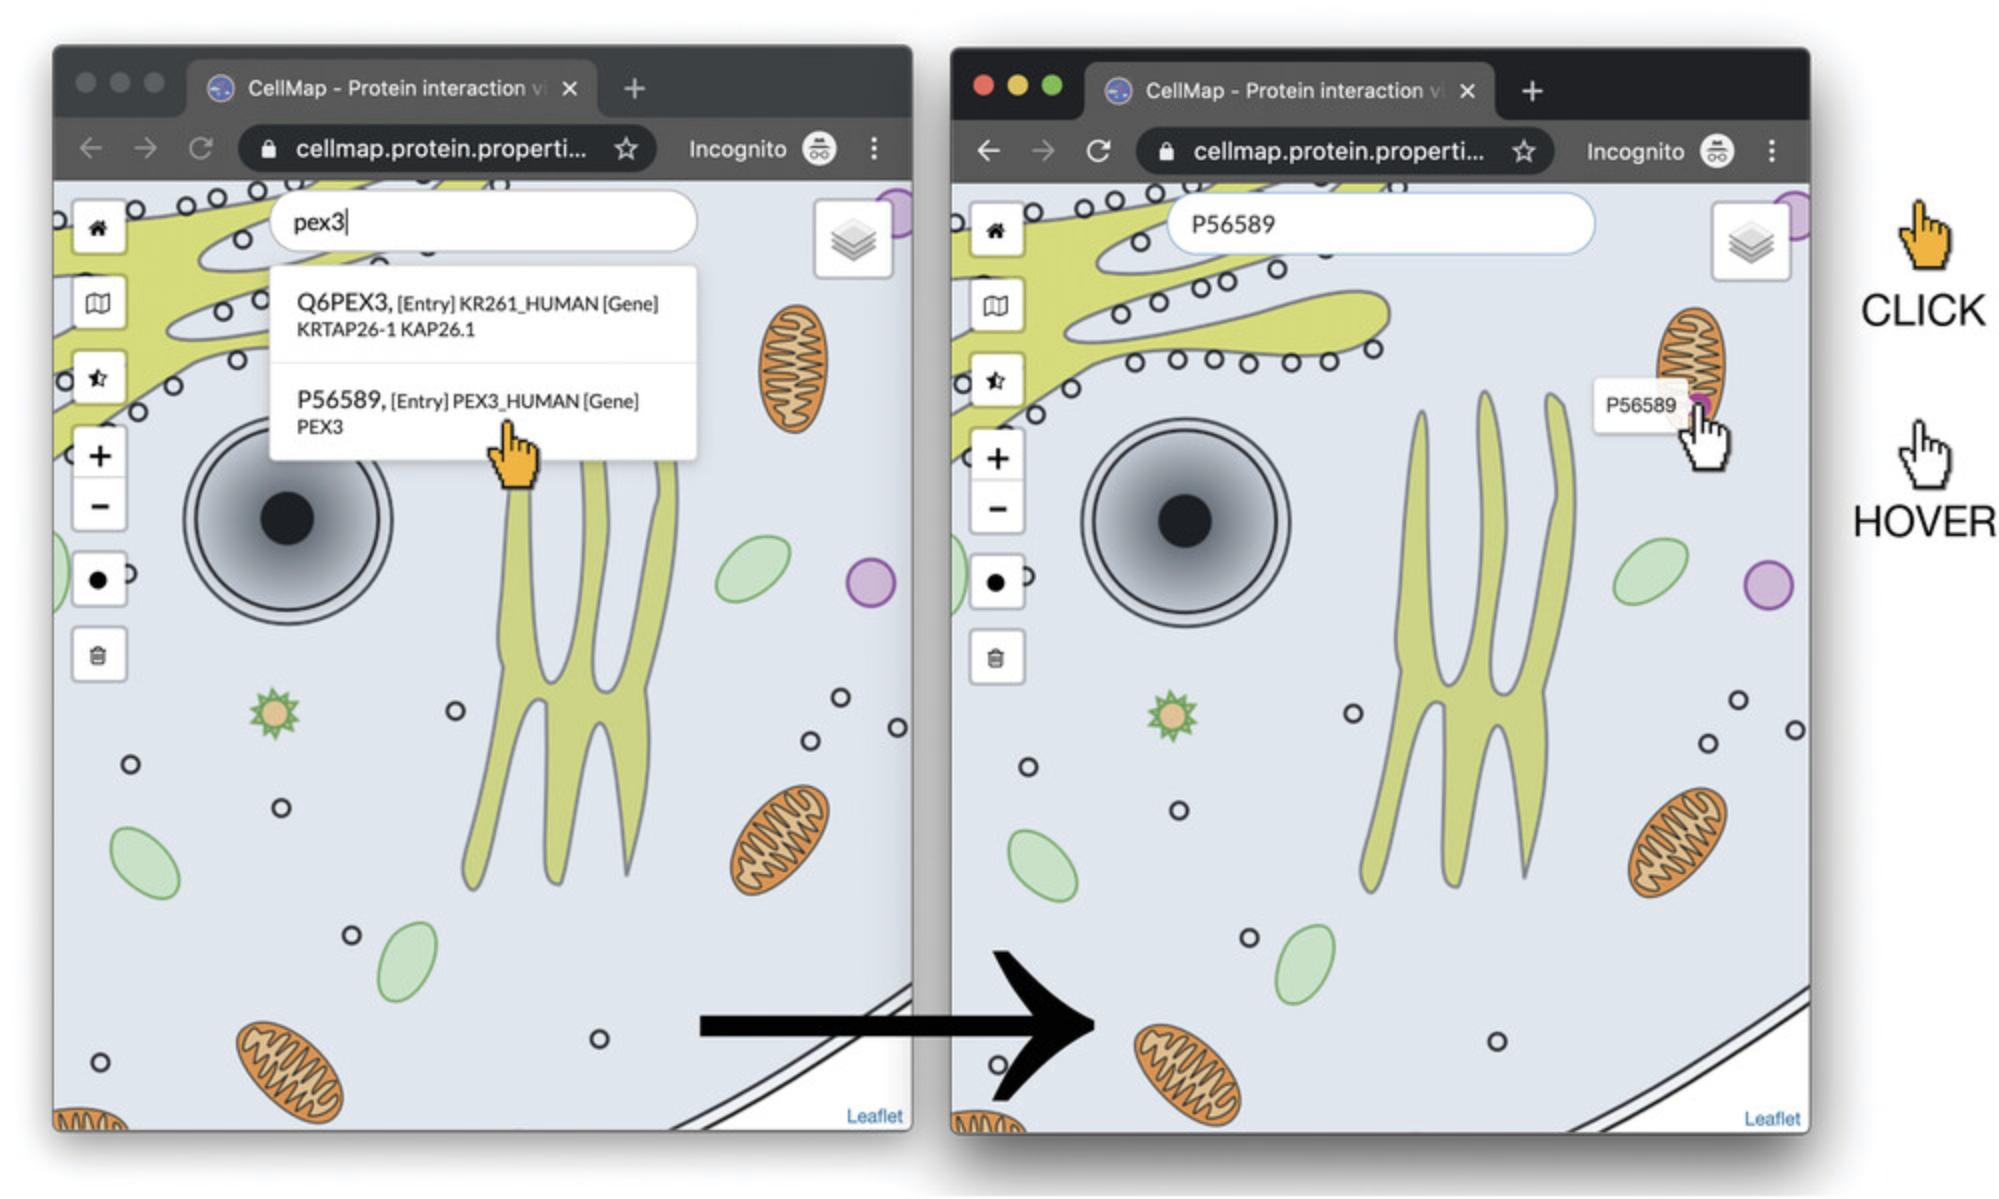
3.Add PEX3 (UniProt P56589) to the PPI viewer by inserting the UniProt accession number or gene identifier into the “Search protein” (gray font) input bar found at the center-top of the PPI viewer (results will populate as you type). Once the desired protein is listed in the drop-down list that appears, click on the item in the drop-down list to add the protein to the view. The protein will be displayed as a dot (disk drawn on cell, Figure 1 for PEX3).
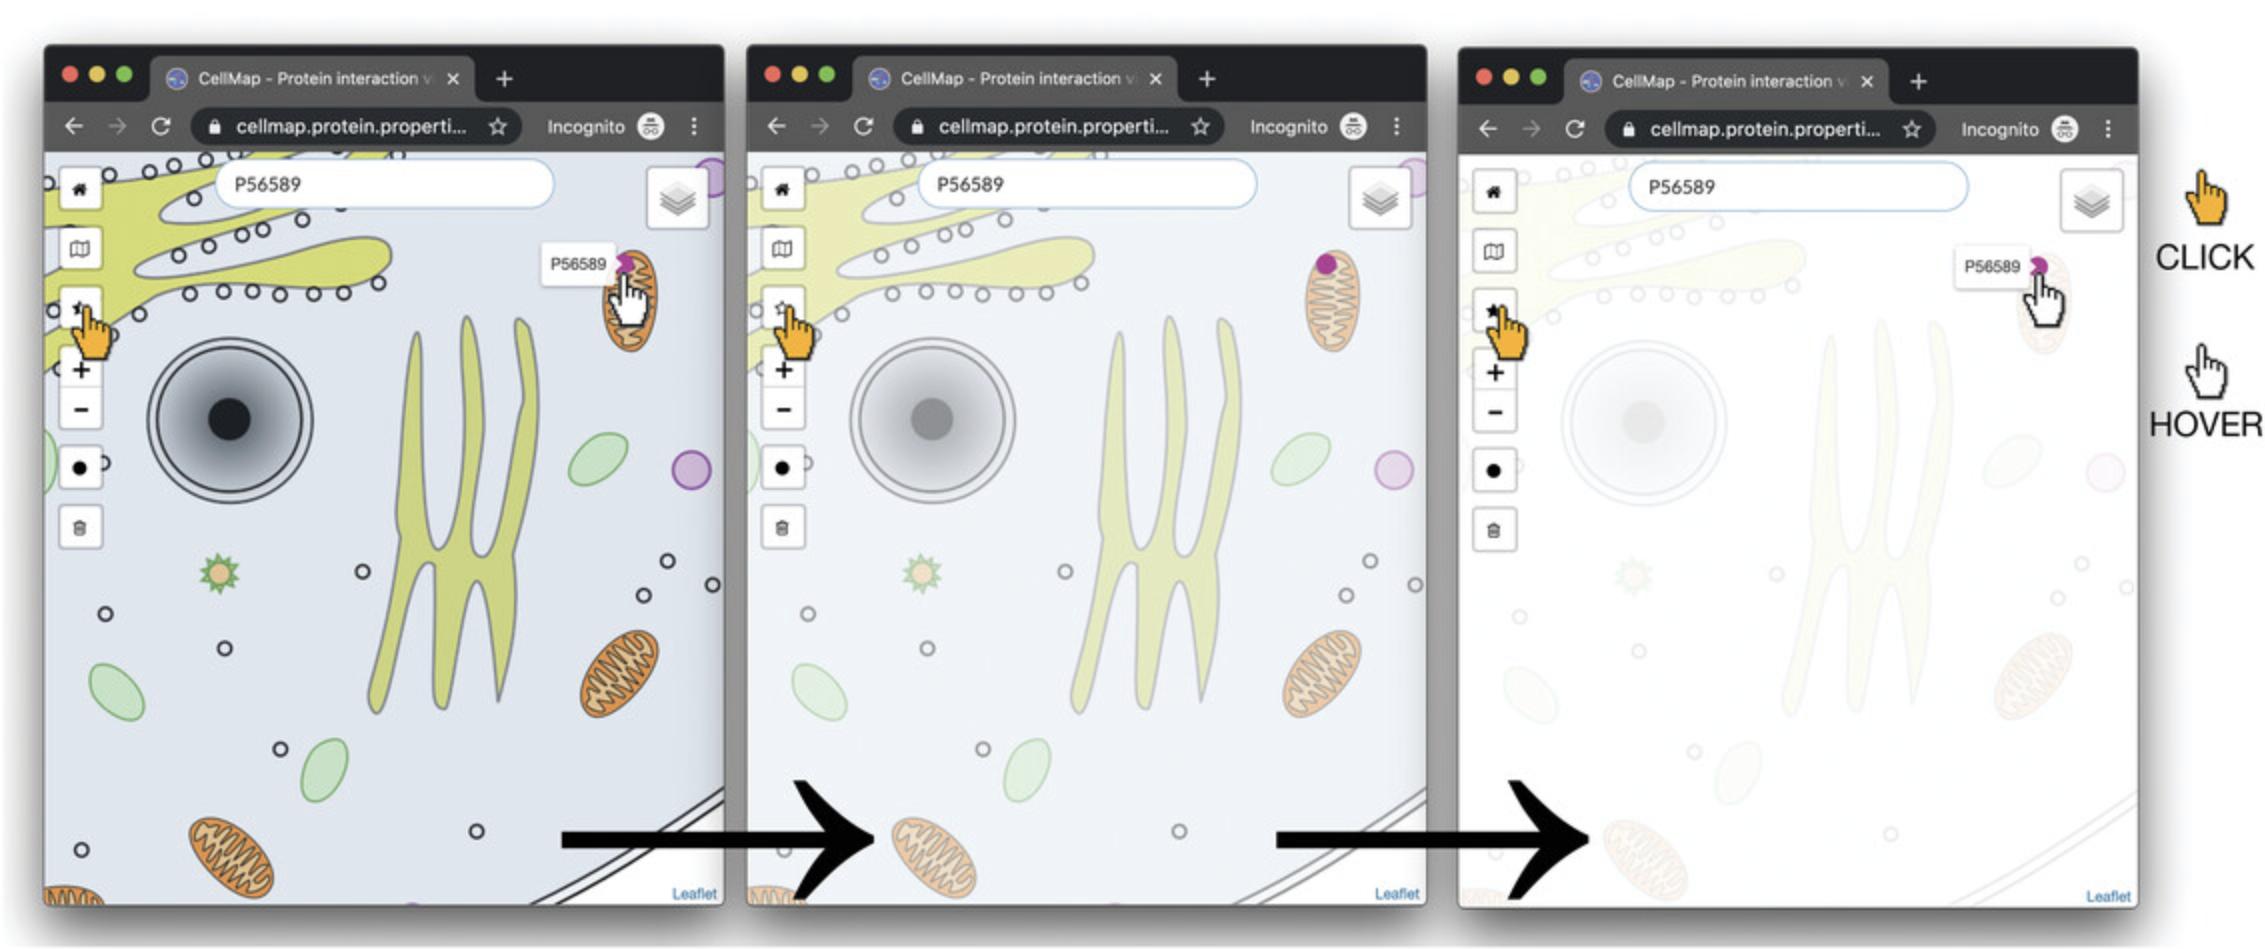
4.Optional : As the cell is in color, users can highlight protein “dots” to enhance visualization by decreasing the cell image opacity while maintaining the intensity of the protein dots (Fig. 2). To utilize this feature, click the half-filled star on the left side of the PPI viewer. There are three opacity levels to select from: click the button repeatedly until the desired opacity is found.
5.Move PEX3 from one localization to another in the viewer by clicking on the protein dot of P56589 in the mitochondrion. A tool tip with a drop-down menu “New localization” will appear. Select “peroxisome membrane” from the drop-down menu. Once “Peroxisome membrane” is selected, the dot will move from the mitochondrion to the peroxisome membrane (Fig. 3). The color of the dot will have changed according to the color legend.

6.Add an additional protein, PEX19 (UnitProt P40855), to the PPI viewer via the search bar as described in step 3.
7.Display a line between P40855 (PEX19) and P56589 (PEX3) by clicking any of the protein dots in the PPI viewer. Hovering over the dots will display their UniProt identifiers. Clicking on a dot will display a line (edge) between the two proteins along with a floating-point value. The value represents the interaction score according to HIPPIE [the interaction score is the confidence of experimentally measured interactions: from low confidence (0) to high confidence (1) (Alanis-Lobato et al., 2017)]. Scrolling down the page, a table listing the proteins currently in the view, with their respective subcellular localizations, is presented (“mapped” meaning available on the graphic; “unmapped” meaning not available through the selected graphic; Fig. 4).
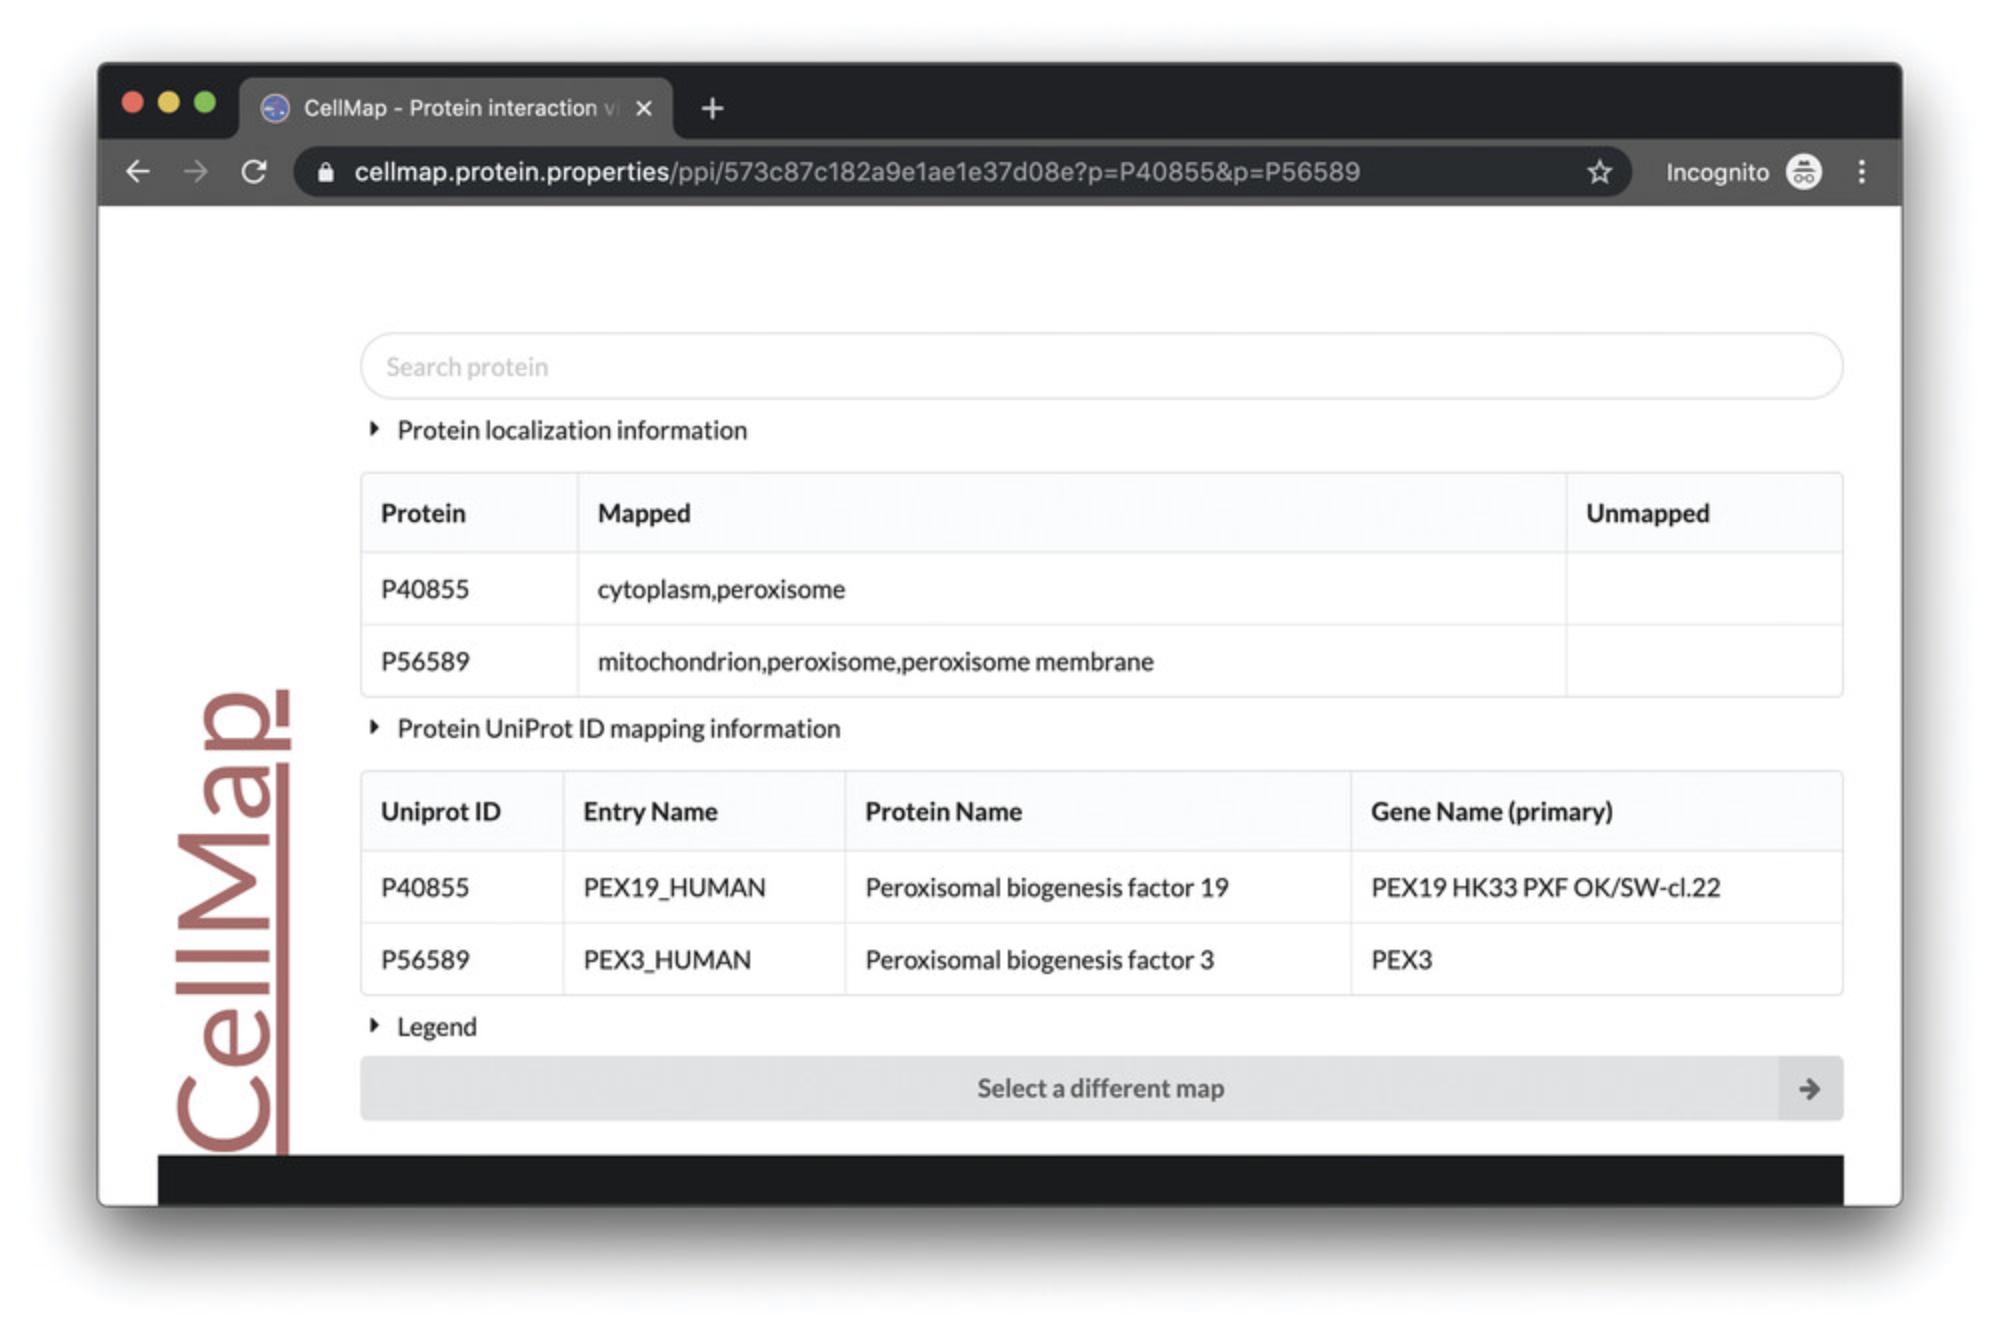
8.Optional : Users may select a different cell map (cell image) by scrolling down the browser page and clicking on the gray button “Select a different map” at the bottom (Fig. 4). This will open a page displaying several images of cells or sections thereof. Users can select one of these maps by hovering over one image and clicking on the “Protein-Protein Interactions” menu item. This will open the new map and load the proteins which were being visualized prior.
9.Optional : To discard the visualization, click the trashcan icon in the controls to the left of the PPI viewer.
Basic Protocol 2: DISPLAYING ALL INTERACTION PARTNERS FOR A PROTEIN
This protocol showcases the display of all known interaction partners of a protein. We will use PEX19 (peroxisomal biogenesis factor 19; HGNC:9713; UniProt identifier P40855) as starting point and visualize its interaction partners according to HIPPIE (Alanis-Lobato et al., 2017).
Materials
- Users will need a computer, tablet, or smartphone with an active internet connection. An up-to-date browser is required to operate CellMap. At least for the first-time use, we suggest access on a desktop computer through Chrome/Chromium (v50+).
1.Navigate to the homepage of CellMap (https://cellmap.protein.properties) to open a protein-centric page. Utilize the search functionality on this page (second from the top; left panel of Fig. 5) by entering the full or partial UniProt identifier (e.g., P408) or gene name (e.g., pex). The page will populate with squares containing the UniProt identifiers of possible hits. These squares will contain localization data as represented by smaller colored squares on the top left of a protein square, and the number of interaction partners at the bottom right of the protein square. For our example, we type “pex19,” which will display a single result “P40855,” i.e., the protein product of PEX19 in Human (NCBI:txid9606) according to UniProt, which interacts with 234 other proteins (number in lower right of box), and is located in red (cytoplasm) and green (peroxisome) (Fig. 5). Clicking in the center of the square will open the protein-centric page.
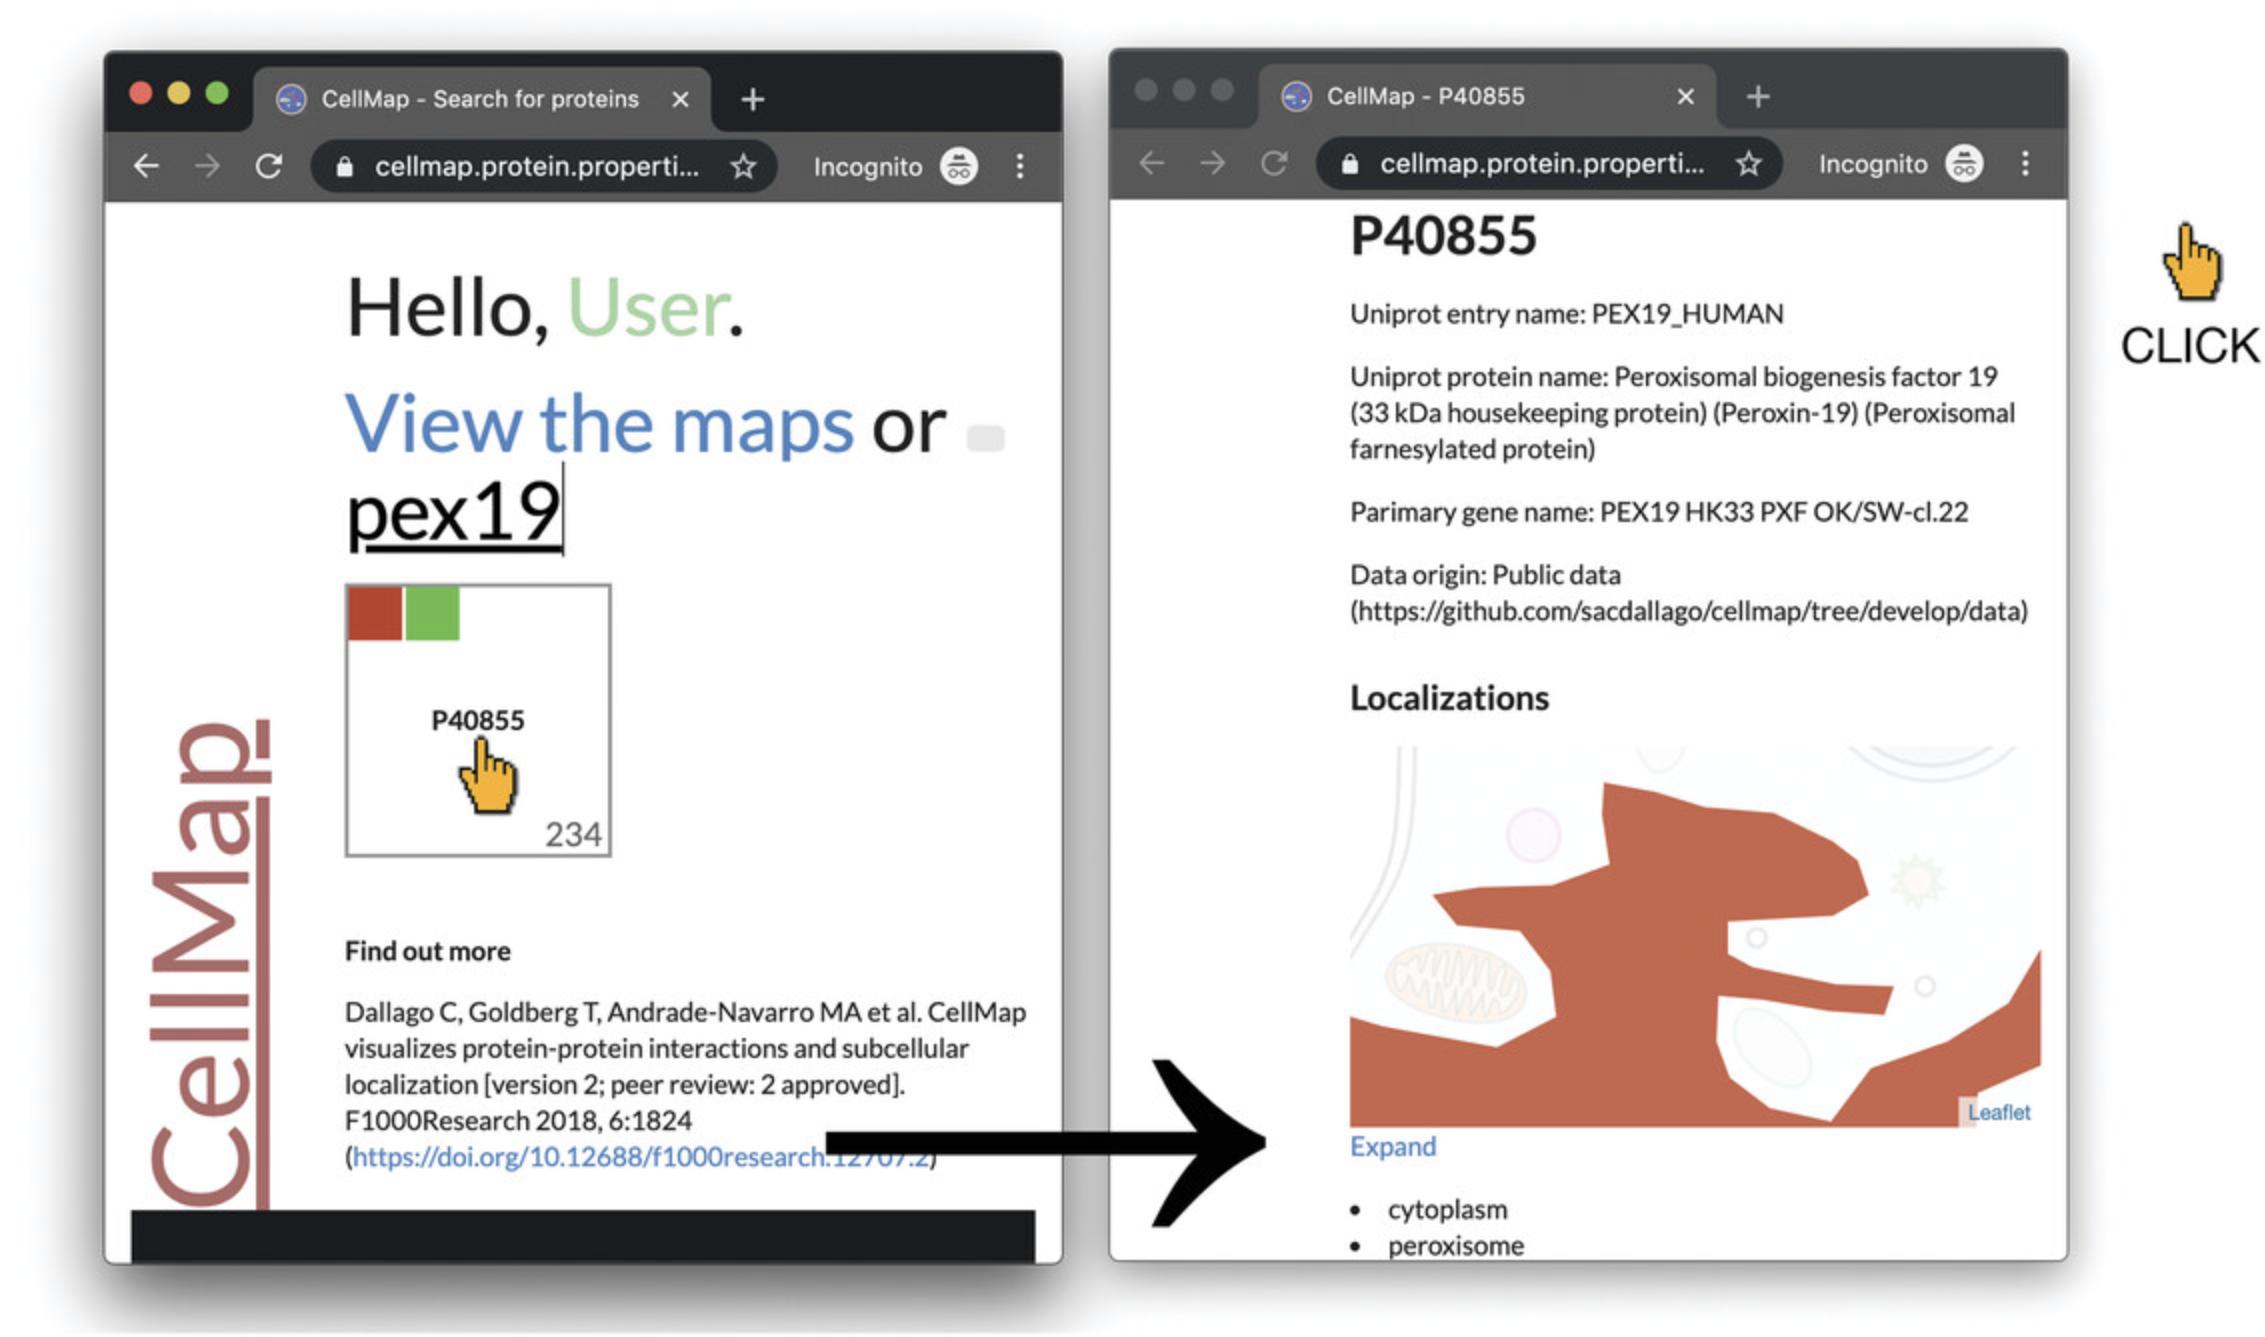
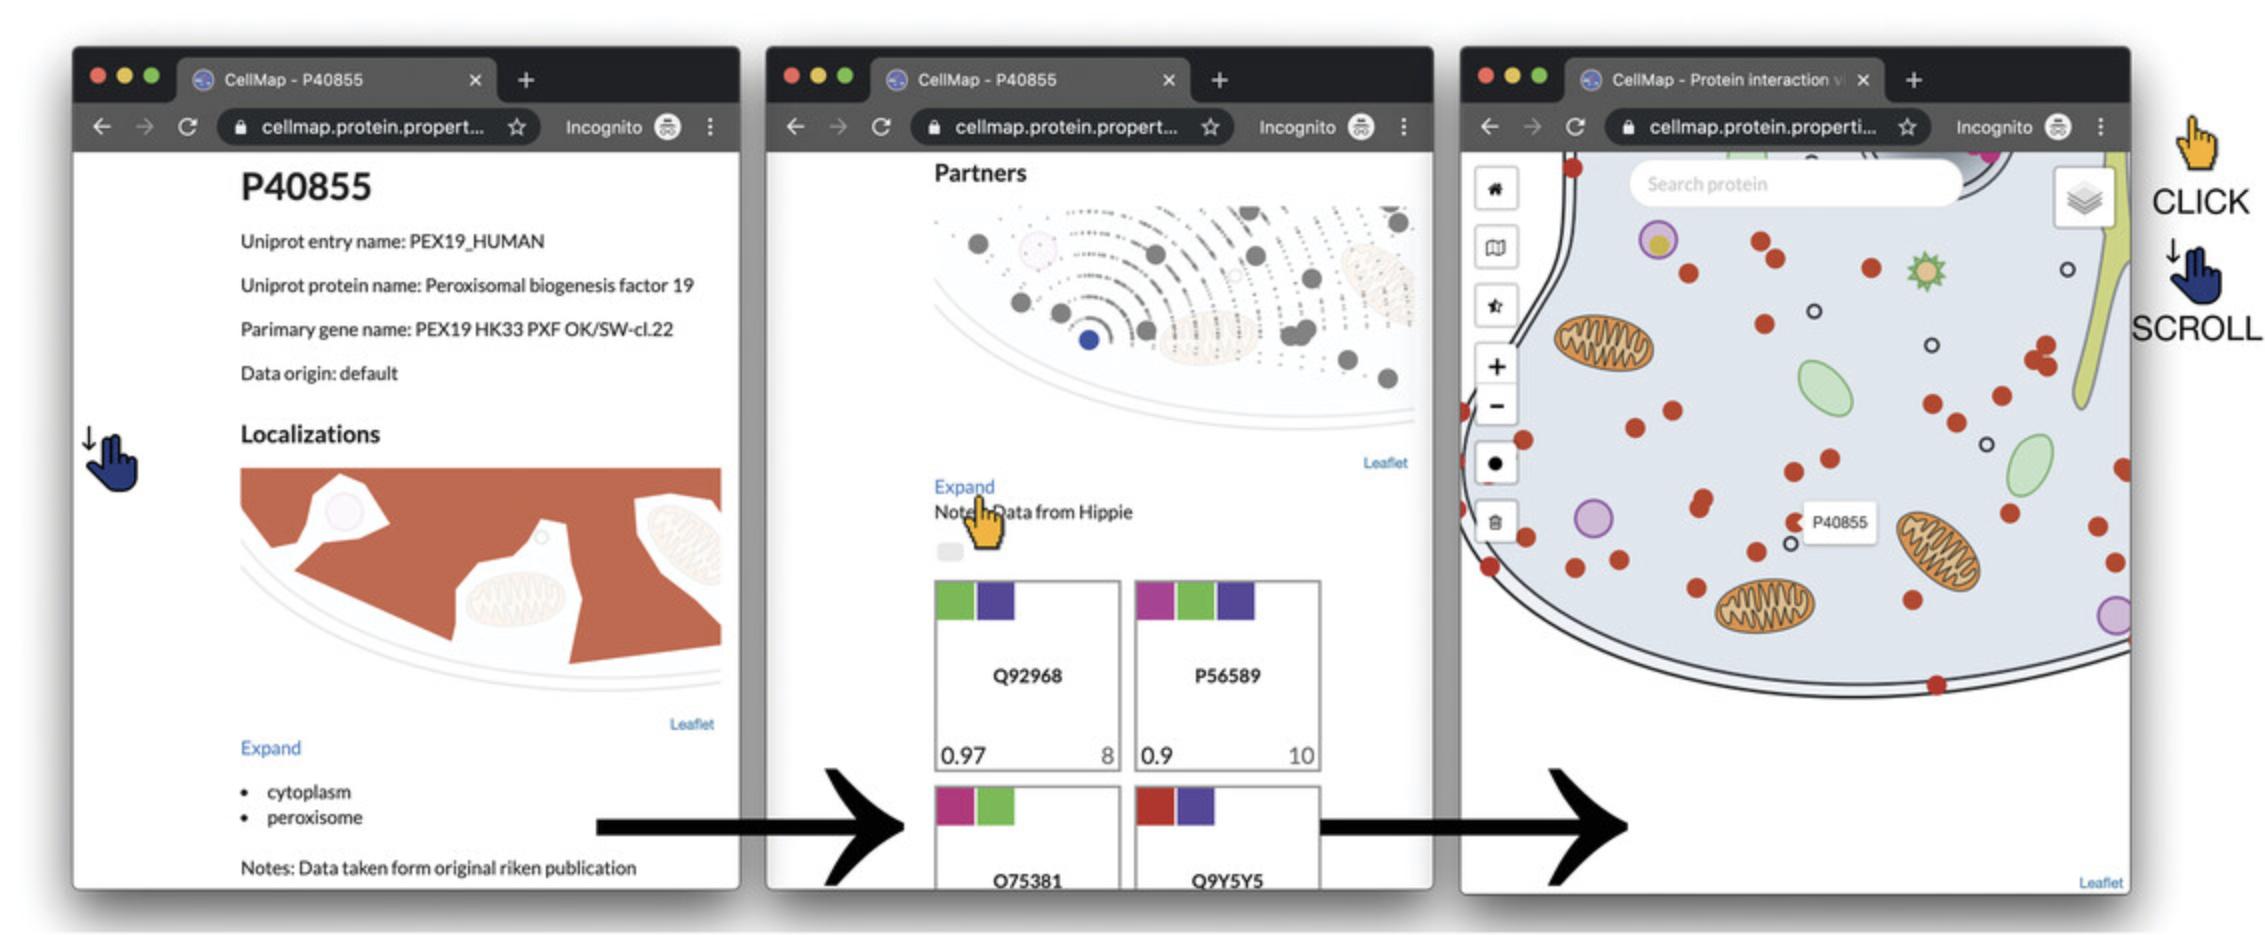
2.To navigate from the protein-centric page for PEX19 (P40855) to the visualization of its interaction partners, scroll to the section titled “Partners” on the protein-centric page. This section gives a graphical preview of PPI partners of the query protein (Fig. 6, middle panel, top half), as well as a list of squares of interaction partners (Fig. 6, middle panel, bottom half). Click on the “Expand” link between the preview and the list to open the PPI viewer, similar to what is described in Basic Protocol 1.Here, PEX19 (P40855) will be highlighted and all its interaction partners loaded (Fig. 6, right panel).
3.The one-against-all/pairwise interactions display in the PPI viewer shows all known PPI partners of a query protein, selectable by clicking on any dot in the visualization (PEX19 in Fig. 7, left panel).

4.To display the all-against-all PPI visualization/complete local PPI network, which displays all known interactions between all of the proteins shown in the map, click on the black filled circle on the left menu of the viewer (below the zoom-in/zoom-out, and above the trashcan icons).
5.To navigate the visualization, use the ± buttons on the left-hand controls in the PPI view to zoom in and out, and click-drag the cell image with the mouse to move the focus. This allows one to explore smaller neighborhoods in greater detail and to declutter, at least to some extent, the “hairballs” of greatly connected networks.
COMMENTARY
Background Information
Systematic predictions and experimental evidence of protein subcellular localization and protein-protein interactions usually reside in databases or text files, with conflicting annotations. For instance, at the inception of CellMap in 2015, we noticed that the best way to learn about a protein's localization was to scavenge the web for specific annotations in databases and publications. This hindered systematic automated approaches, required laborious research analysis to validate findings, and ultimately resulted in enough obstacles to provide a frustrating experience for the majority of users unfamiliar with different types of protein identifiers and databases. Today, UniProt [RRID:SCR_002380 (The UniProt Consortium, 2019)] is very well known in the biological community, and integrates COMPARTMENTS (Binder et al., 2014) for the visualization of protein subcellular localization directly on a protein's details page, from an experimental source when available, or predicted if not. Additionally, several alternative tools for protein localization visualization exist, making it far easier to access this information quickly and in an intuitive way than in the past. Nevertheless, PPI visualization remains very challenging and is not directly available on popular databases, e.g., UniProt. Simple PPI network visualization can be achieved with Cytoscape (Shannon et al., 2003), the de facto standard tool for general-purpose network visualizations. Cytoscape.js (Franz et al., 2016) offers a similar interface to Cytoscape, without the need to install software on the computer. These tools come with many customization parameters, ultimately allowing users to achieve somewhat similar visualizations to those generated by CellMap (and much more). However, getting there requires coding skills or deep knowledge of the software. To date, and to the best of our knowledge, only one alternative to the simplicity of CellMap exists, namely CellNetVis (Heberle, Carazzolle, Telles, Meirelles, & Minghim, 2017), developed and published around the same time as CellMap. CellNetVis explores an idea similar to CellMap, with the difference that localization and interaction annotations must be submitted by users themselves upon visualization. STRING (Szklarczyk et al., 2019) can be used to quickly query a protein's PPI network and visualize the results on a cytoscape.js visualization. While STRING data may be complete, and may cover more organisms than CellMap, it is not always reliable. With growing number of display items, visualizations quickly get crowded, and in the absence of mechanisms to cope with this (e.g., by clustering proteins by their subcellular localizations, like CellMap/CellNetVis does), PPI visualization is not adding value. STRING only displays a set number of interactions to make visualizations clearer, and offers to add more items to the visualization via the click of a button. We believe that CellMap offers reliable annotations and a limited scope, serving the purpose of PPI visualization better by visualizing all interactions at once and somewhat decluttering the PPI “hairballs.”
CellMap is designed to be a simple and well-scoped system: a general visualization tool for protein-protein interactions constrained by protein localization. The first version of CellMap built upon a reliable dataset with multi-localization annotations for the human proteome (Ramilowski et al., 2015) assembled from the Human Protein Atlas [HPA (Uhlén et al., 2015)], Swiss-Prot [RRID:SCR_002380 (The UniProt Consortium, 2019)], and, when unavailable, from either homology or predictions (Goldberg et al., 2014). Experimental PPI interactions were taken from HIPPIE (Alanis-Lobato et al., 2017), providing an estimate for the reliability of PPI annotations. While both the visualization tool and the web server may be extended greatly, and users may employ different data sources, the public instance of CellMap (http://cellmap.protein.properties) fulfills this purpose to date. For this protocol, many small tweaks have been implemented in the user interface, based on feedback from 3 years of running the system. Additionally, the dataset has been updated with the latest annotations from HIPPIE (Alanis-Lobato et al., 2017) and enriched with annotations for binary interactions from APID (Alonso-López et al., 2019). We have removed the HIPPIE (Alanis-Lobato et al., 2017) interactions with score below 0.01 to make sure that only reliable PPIs are presented. To the best of our efforts, we could not find a multi-compartment protein subcellular location dataset that was significantly better than previous work from former lab members (Ramilowski et al., 2015).
Critical Parameters
The most important parameter in CellMap is the choice of underlying data. This applies both to protein annotations, and “cell maps,” i.e., cell images. The public instance of CellMap (http://cellmap.protein.properties) provides data for human and a few hand-picked cell cartoons. Users interested in different data may do so by deploying their own instance of CellMap and supplying it with their data. This can be done via Docker and by preparing a dataset containing annotations for proteins and their localizations plus interaction partners (instructions on GitHub; see https://github.com/sacdallago/cellmap).
Troubleshooting
CellMap might take a long time to process protein-specific pages for proteins with hundreds of interaction partners. Users noticing blank pages or page reloads are advised to just let the browser reload the page until no elements are loading (as indicated by a loading bar atop the page). Another limitation pertains to the number of interactions that can be displayed in the PPI viewer: for proteins with over 450 interaction partners, the link to the PPI viewer will load only the first 450 partners (“first” in this context refers to the 450 interaction partners with the highest interaction score according to HIPPIE).
Time Considerations
Visualization of protein localization and protein-protein interactions has been crafted to be as fast as possible, with immediate visualization of protein localization for a single protein, 2 to 3 s for 300 proteins, and about 5 s to overlay an all-against-all interaction network for a big (450 proteins) visualization (ballpark estimates). The two most resource intensive activities are: loading the data and overlaying the interaction network.
Acknowledgment
This work was supported by the Deutsche Forschungsgemeinschaft (DFG)—project number 5091000—and by the Bundesministerium für Bildung und Forschung (BMBF)—project number 5091157. Thanks primarily to Tim Karl (TUM) for invaluable help with hardware and software and to Inga Weise (TUM) for support with many other aspects of this work. We thank the team behind the APID database, Prof. De Las Rivas and Prof. Vidal, for making this resource available. Last, but not least, thanks to all those who deposit their experimental data in public databases, and to those who maintain these databases. In particular, thanks to the Ioanis Xenarios (SIB, Univ. Lausanne), Matthias Uhlen (Univ. Upssala), and their teams at Swiss-Prot and HPA.
Literature Cited
- Alanis-Lobato, G., Andrade-Navarro, M. A., & Schaefer, M. H. (2017). HIPPIE v2.0: Enhancing meaningfulness and reliability of protein-protein interaction networks. Nucleic Acids Research , 45(D1), D408–D414. doi: 10.1093/nar/gkw985.
- Almagro Armenteros, J. J., Sønderby, C. K., Sønderby, S. K., Nielsen, H., & Winther, O. (2017). DeepLoc: Prediction of protein subcellular localization using deep learning. Bioinformatics , 33(21), 3387–3395. doi: 10.1093/bioinformatics/btx431.
- Alonso-López, D., Campos-Laborie, F. J., Gutiérrez, M. A., Lambourne, L., Calderwood, M. A., Vidal, M., & De Las Rivas, J. (2019). APID database: Redefining protein-protein interaction experimental evidences and binary interactomes. Database , 2019, baz005. doi: 10.1093/database/baz005.
- Binder, J. X., Pletscher-Frankild, S., Tsafou, K., Stolte, C., O'Donoghue, S. I., Schneider, R., & Jensen, L. J. (2014). COMPARTMENTS: Unification and visualization of protein subcellular localization evidence. Database , 2014, bau012. doi: 10.1093/database/bau012.
- Cong, Q., Anishchenko, I., Ovchinnikov, S., & Baker, D. (2019). Protein interaction networks revealed by proteome coevolution. Science , 365(6449), 185–189. doi: 10.1126/science.aaw6718.
- Dallago, C., Goldberg, T., Andrade-Navarro, M. A., Alanis-Lobato, G., & Rost, B. (2018). CellMap visualizes protein-protein interactions and subcellular localization. F1000Research , 6, 1824. doi: 10.12688/f1000research.12707.2.
- Fabregat, A., Jupe, S., Matthews, L., Sidiropoulos, K., Gillespie, M., Garapati, P., … D'Eustachio, P. (2018). The reactome pathway knowledgebase. Nucleic Acids Research , 46(D1), D649–D655. doi: 10.1093/nar/gkx1132.
- Franz, M., Lopes, C. T., Huck, G., Dong, Y., Sumer, O., & Bader, G. D. (2016). Cytoscape.Js: A graph theory library for visualisation and analysis. Bioinformatics (Oxford, England) , 32(2), 309–311. doi: 10.1093/bioinformatics/btv557.
- Fujiki, Y., Matsuzono, Y., Matsuzaki, T., & Fransen, M. (2006). Import of peroxisomal membrane proteins: The interplay of Pex3p- and Pex19p-mediated interactions. Biochimica et Biophysica Acta—Molecular Cell Research , 1763(12), 1639–1646. doi: 10.1016/j.bbamcr.2006.09.030.
- Goldberg, T., Hecht, M., Hamp, T., Karl, T., Yachdav, G., Ahmed, N., … Rost, B. (2014). LocTree3 prediction of localization. Nucleic Acids Research , 42(W1), W350–W355. doi: 10.1093/nar/gku396.
- Heberle, H., Carazzolle, M. F., Telles, G. P., Meirelles, G. V., & Minghim, R. (2017). CellNetVis: A web tool for visualization of biological networks using force-directed layout constrained by cellular components. BMC Bioinformatics , 18(10), 395. doi: 10.1186/s12859-017-1787-5.
- Kovács, I. A., Luck, K., Spirohn, K., Wang, Y., Pollis, C., Schlabach, S., … Barabási, A.-L. (2019). Network-based prediction of protein interactions. Nature Communications , 10(1), 1–8.
- May, B. (2018). PEX19: Class I PMP binds PEX3, reactome, version 70 released on September 9, 2019, StableID: R-HSA-9603784. June 11, 2019. Retrieved from https://reactome.org/PathwayBrowser/#/R-HSA-9603798&SEL=R-HSA-9603784&PATH=R-HSA-9609507.
- Ramilowski, J. A., Goldberg, T., Harshbarger, J., Kloppmann, E., Lizio, M., Satagopam, V. P., … Forrest, A. R. R. (2015). A draft network of ligand-receptor-mediated multicellular signalling in human. Nature Communications , 6(1), 1–12.
- Shannon, P., Markiel, A., Ozier, O., Baliga, N. S., Wang, J. T., Ramage, D., … Ideker, T. (2003). Cytoscape: A software environment for integrated models of biomolecular interaction networks. Genome Research , 13(11), 2498–2504. doi: 10.1101/gr.1239303.
- Szklarczyk, D., Gable, A. L., Lyon, D., Junge, A., Wyder, S., Huerta-Cepas, J., … von Mering, C. (2019). STRING V11: Protein-protein association networks with increased coverage, supporting functional discovery in genome-wide experimental datasets. Nucleic Acids Research , 47(D1), D607–D613. doi: 10.1093/nar/gky1131.
- The UniProt Consortium. (2019). UniProt: A worldwide hub of protein knowledge. Nucleic Acids Research , 47(D1), D506–D515. doi: 10.1093/nar/gky1049.
- The Gene Ontology Consortium. (2019). The gene ontology resource: 20 years and still GOing strong. Nucleic Acids Research , 47(D1), D330–D338. doi: 10.1093/nar/gky1055.
- Uhlén, M., Fagerberg, L., Hallström, B. M., Lindskog, C., Oksvold, P., Mardinoglu, A., & Pontén, F. (2015). Tissue-based map of the human proteome. Science , 347(6220), 1260419.
Internet Resources
CellMap web server.
CellMap code base.
CellMap docker image.
Citing Literature
Number of times cited according to CrossRef: 4
- Vivian Robin, Antoine Bodein, Marie-Pier Scott-Boyer, Mickaël Leclercq, Olivier Périn, Arnaud Droit, Overview of methods for characterization and visualization of a protein–protein interaction network in a multi-omics integration context, Frontiers in Molecular Biosciences, 10.3389/fmolb.2022.962799, 9 , (2022).
- Ge Wang, Min-Qi Xue, Hong-Bin Shen, Ying-Ying Xu, Learning protein subcellular localization multi-view patterns from heterogeneous data of imaging, sequence and networks, Briefings in Bioinformatics, 10.1093/bib/bbab539, 23 , 2, (2022).
- Tobias Olenyi, Céline Marquet, Michael Heinzinger, Benjamin Kröger, Tiha Nikolova, Michael Bernhofer, Philip Sändig, Konstantin Schütze, Maria Littmann, Milot Mirdita, Martin Steinegger, Christian Dallago, Burkhard Rost, LambdaPP: Fast and accessible protein‐specific phenotype predictions, Protein Science, 10.1002/pro.4524, 32 , 1, (2022).
- Michael Bernhofer, Christian Dallago, Tim Karl, Venkata Satagopam, Michael Heinzinger, Maria Littmann, Tobias Olenyi, Jiajun Qiu, Konstantin Schütze, Guy Yachdav, Haim Ashkenazy, Nir Ben-Tal, Yana Bromberg, Tatyana Goldberg, Laszlo Kajan, Sean O’Donoghue, Chris Sander, Andrea Schafferhans, Avner Schlessinger, Gerrit Vriend, Milot Mirdita, Piotr Gawron, Wei Gu, Yohan Jarosz, Christophe Trefois, Martin Steinegger, Reinhard Schneider, Burkhard Rost, PredictProtein - Predicting Protein Structure and Function for 29 Years, Nucleic Acids Research, 10.1093/nar/gkab354, 49 , W1, (W535-W540), (2021).

