Quantifying Synaptic Colocalizations with SynBot (ilastik Thresholding)
Justin T Savage, Juan Ramirez, Dolores Irala, Cagla Eroglu
Abstract
Protocol for quantifying synapse numbers using the ilastik thresholding method in SynBot.
Steps
Installation
Install/Update FIJI. The newest version of Fiji can be found at https://fiji.sc/ Some features may not function properly if your Fiji is not up to date.
Visit the Syn_Bot GitHub repository (https://github.com/Eroglu-Lab/Syn_Bot) and download the ilastik4ij_Syn_Bot-1.8.2-SNAPSHOT.jar file.
Navigate to your Fiji application and open the package contents
Navigate to the plugins folder of your Fiji application
Copy the ilastik4ij_Syn_Bot-1.8.2-SNAPSHOT.jar file into the plugins folder
Be sure to close and reopen Fiji after installing any plugins. You should now see SynBot listed in the Plugins drop-down menu.
ilastik Installation
Go to https://www.ilastik.org/download.html and download and install the most recent, stable version of ilastik for your OS.
Within FIJI, go to Help-> Update…
Click “Manage update sites” in the popup window
Scroll down and click the checkbox next to ilastik
Click “Apply Changes”
Be sure to close and reopen Fiji after installing any plugins. You should now see ilastik listed in the Plugins drop-down menu
Generating a Training Set
Create a folder on your computer that contains a haphazard sample of images that you want to analyze for this experiment (~6 images should be enough). It is best if these images represent the range of intensity values in the data set and come from each of your conditions. This folder will be your training set.
Create an empty folder to store the red channel images of your training set and an empty folder to store the green channel images of your training set.
Open FIJI and click and drag the extract_channels.ijm macro to open it in the script editor
Click the run button in the bottom left of the window
Select the training set folder of images, the red channel images folder, and then the green channel folder in the ImageJ file explorer prompts.
ImageJ will now generate your single-channel images which can be used to train ilastik.
ilastik Model Training
Open your ilastik application.
Under "Create New Project", click the Pxel Classification option.
Choose a location to save your ilastik project. You should name your project something that corresponds to the channel and conditions of your training data.
On the left of the screen you will see the basic steps of the ilastik workflow.
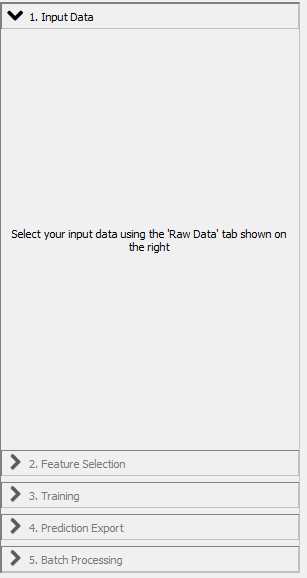
With "Input Data" selected in the workflow menu, click the "Add New" button. In the dropdown menu select "add separate image(s)".
Select all of your red channel images from your training set.
Click the "Feature Selection" tab in the workflow menu.
Click "Select Features"
Select which image features to use for thresholding in the "Features" pop-up window.
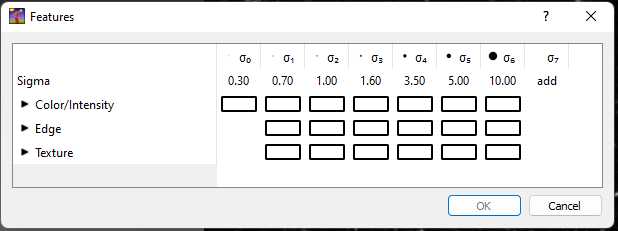
For cell culture images where there are fewer synapses and less noise, we recommend using Ctrl+A to select all of the image features. For images from mouse tissue sections, we recommend selecting the Color/Intensity features with Sigma values of 0.30, 0.70, 1.00, and 1.60.
Once image features are selected, you can click on the feature names in the lower left "Features" box to view what these image features look like for your images.
Click the "Training" button in the workflow menu.
You will now see the training options in the workflow menu
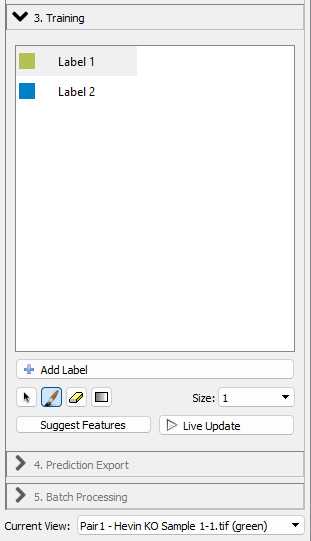
With "Label 1" selected, you can annotate examples of foreground pixels (i.e. synaptic puncta) in your images. With the "Label 2" selected, you can annotate examples of background in your images. You can use the "Size" dropdown to change the size of your annotation to make sure they are accurate.
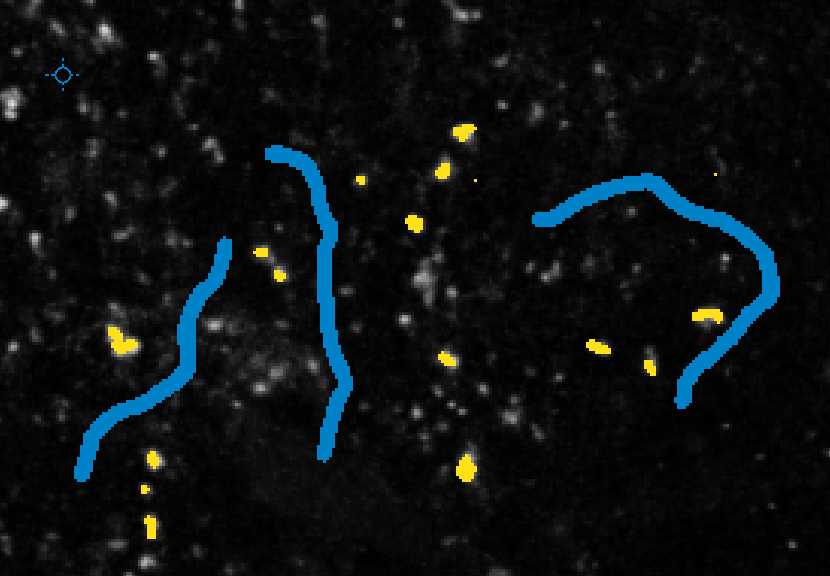
Annotate approximately 20 examples of foreground objects (i.e. synaptic puncta) in your image with the Label 1 selected. You can use Shift_++ to zoom in your image if necessary. You can also use the - key to zoom out.+
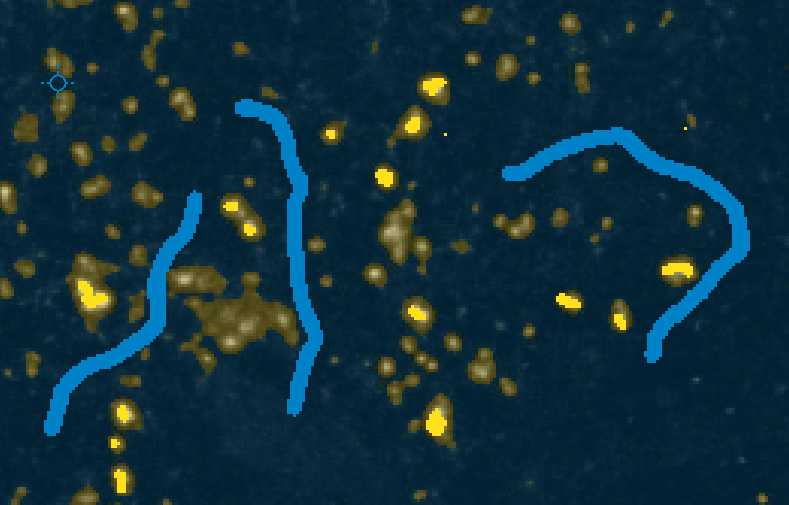
Annotate some background in your images using the Label 2. This can be done by increasing the size of your annotation and clicking and dragging to annotate a line of background. Your annotated image should now look something like the example below.
Now click the "Live Update" button in the workflow menu. This will give you a preview of how your ilastik model will threshold your image.
With Live Update turned on, you can continue to annotate your image until the preview looks accurate.
Once the preview looks accurate for the first image, use the "Current view" dropdown in the workflow menu to switch to the next image in your training set. Check the preview on this image and make additional annotations if necessary. Repeat with the rest of the images in the training set.
Once you are satisfied with the Live Update preview for all of your images, save the ilastik project using Ctrl+S. You can then close ilastik without continuing to the "Prediction Export" or "Batch Processing" section of the workflow as these steps will be handled by SynBot.
Repeat the above steps to train a model for your green channel training set.
Preparing your images for SynBot
Before running SynBot, it is recommended to convert your images into the Tiff format, though SynBot can run on a variety of file types, this is a frequent source of error. (See the extra_code folder at https://github.com/Eroglu-Lab/Syn_Bot for example image type conversion macros).
Create a folder for your experiment with subfolders for experimental groups. Each experimental group folder should contain only image files. Multiple experimental groups are not required, but your files must follow the Experiment/Group/Image structure.


Running SynBot
Open your version of FIJI where you installed the ilastik4ij_Syn_Bot-1.8.2-SNAPSHOT.jar file.
Visit the Syn_Bot GitHub repository (https://github.com/Eroglu-Lab/Syn_Bot) and download the Syn_Bot.ijm file.
Click and drag the Syn_Bot.ijm file into FIJI to open it in the FIJI script editor.
Click the run button on the bottom left corner of the script editor to run the macro.
Once the macro begins running, the following start-up menu will appear:
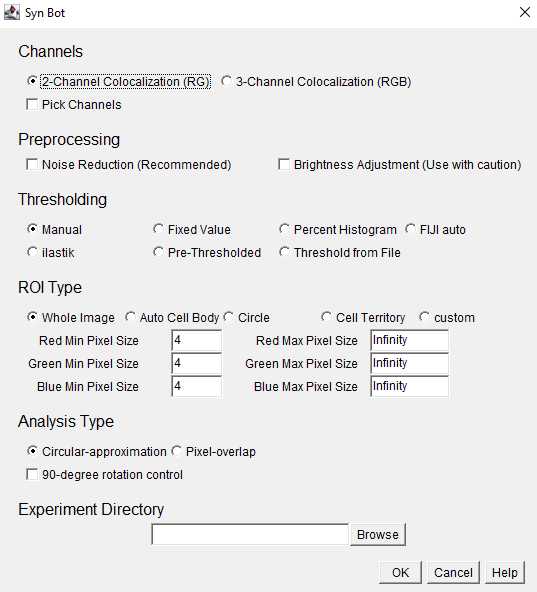
Channels: Select the appropriate number of channels to be analyzed (2 or 3). Images will be converted to the RedGreenBlue (RGB) format and the Red and Green channels will be analyzed for 2-Channel Colocalization and the Red, Green, and Blue channels will be analyzed for 3-Channel Colocalization. If necessary, image channels can be changed to fit these colors using the Pick Channels option.
Preprocessing: Select whether or not to use the noise reduction or brightness adjustment preprocessing functions. Noise reduction is recommended for most in vivo imaging applications. Brightness Adjustment is not recommended unless absolutely necessary since it alters the intensity of the original images, but can be helpful if all images are uniformly dim.
Thresholding: Select the desired thresholding method from the provided options. This protocol will focus on the ilastik thresholding option where each channel of each image is assigned a threshold by ilastik.
ROI Type: Select the desired region of interest (ROI) type from the provided options. Whole Image should be selected unless there is a specific ROI within the image to focus analysis around.
Within ROI Type, the user also selects minimum and maximum pixel values for each channel. These are the bounds on the area (in pixel units) of the smallest and largest puncta to be included in the analysis.
Analysis Type: Select either the circular-approximation or pixel-overlap analysis modes. The pixel-overlap method is recommended for most applications and uses the individual pixels of each channel to determine colocalizations. The circular-approximation mode uses the area and location of the puncta for each channel to approximate each puncta as a circle and then determine if the circles from each channel are overlapping and is only recommended when comparing to results obtained with previous algorithms that used circular-approximation (such as Puncta Analyzer).
Experiment Directory: Click the browse button and select the Experiment level folder that we set up earlier. You must select the Experiment-level folder rather than the Group-level folder or image files.
Once the desired settings have been entered, click the OK button to begin running SynBot
ilastik Thresholding
With the ilastik threshold mode selected, a pup-up window called "Select ilastik files" will allow you to choose the location of your ilastik application and ilastik project files.
Click the first browse button and select the ilastik application. On Mac, this will simply be the ilastik app in your Applications folder. On Windows, you should select the ilastik.exe file within the ilastik folder where the application is installed. This ilastik folder will most likely be in your Program Files folder.
Use the second and third browse buttons to select the red and green ilastik project (ilp) files that you created earlier.
Click OK once all file locations have been filled in.
SynBot will now run on your images using the provided ilastik projects. No more user input is required. You can monitor SynBot's progress in the "Log" window. Once SynBot is finished running, it will print "done" and the time that it took to run as well as displaying the Summary output results window.
Data Outputs
Once thresholding all images is completed, a results file called Summary.csv will be displayed. This file is automatically saved within the Experiment-level folder selected earlier and can be closed.
Navigate to the Group-level folders within the Experiment-level folder selected earlier. These Group folders will now each contain an Output folder which includes several useful outputs:
- A copy of the original image converted to RGB (i.e. image_1.tif)
- A copy of the original image with white overlays labeling each counted colocalization (i.e. image_1_colocs.tif)
- The thresholded image for each channel (i.e. image_1_redThresholded_0.tiff)
- The full set of measurements of each punctum counted for each channel (i.e. image_1_redResults_0.csv) These files should be reviewed to ensure the program is counting colocalizations as desired.
Returning to the Experiment-level folder shows the Summary.csv file which includes the summary statistics for each image that serve as the primary outputs of the SynBot analysis including:
- Puncta counts for each channel
- Colocalized puncta count
- Min Pixel values used
