Quantifying Synaptic Colocalizations with SynBot (Manual Thresholding)
Justin T Savage, Juan Ramirez, Dolores Irala, Cagla Eroglu
Abstract
Protocol for quantifying synapse numbers using the manual thresholding method in SynBot.
Steps
Installation
Install/Update FIJI. The newest version of Fiji can be found at https://fiji.sc/ Some features may not function properly if your Fiji is not up to date.
Visit the Syn_Bot GitHub repository (https://github.com/Eroglu-Lab/Syn_Bot) and download the ilastik4ij_Syn_Bot-1.8.2-SNAPSHOT.jar file.
Navigate to your Fiji application and open the package contents
Navigate to the plugins folder of your Fiji application
Copy the ilastik4ij_Syn_Bot-1.8.2-SNAPSHOT.jar file into the plugins folder
Be sure to close and reopen Fiji after installing any plugins. You should now see Syn_Bot listed in the Plugins drop-down menu (It will probably be at the end of the list).
Preparing Your Images
Before running SynBot, it is recommended to convert your images into the Tiff format, though SynBot can run on a variety of file types, this is a frequent source of error. (See the extra_code folder at https://github.com/Eroglu-Lab/Syn_Bot for example image type conversion macros).
Create a folder for your experiment with subfolders for experimental groups. Each experimental group folder should contain only image files. Multiple experimental groups are not required, but your files must follow the Experiment/Group/Image structure.


Running SynBot
Open your version of FIJI where you installed the ilastik4ij_Syn_Bot-1.8.2-SNAPSHOT.jar file.
Visit the Syn_Bot GitHub repository (https://github.com/Eroglu-Lab/Syn_Bot) and download the Syn_Bot.ijm file.
Click and drag the Syn_Bot.ijm file into FIJI to open it in the FIJI script editor.
Click the run button on the bottom left corner of the script editor to run the macro.
Once the macro begins running, the following start-up menu will appear:
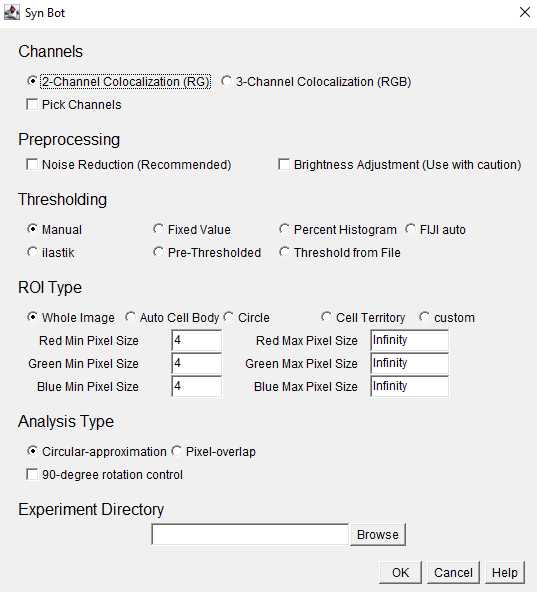
Channels: Select the appropriate number of channels to be analyzed (2 or 3). Images will be converted to the RedGreenBlue (RGB) format and the Red and Green channels will be analyzed for 2-Channel Colocalization and the Red, Green, and Blue channels will be analyzed for 3-Channel Colocalization. If necessary, image channels can be changed to fit these colors using the Pick Channels option.
Preprocessing: Select whether or not to use the noise reduction or brightness adjustment preprocessing functions. Noise reduction is recommended for most in vivo imaging applications. Brightness Adjustment is not recommended unless absolutely necessary since it alters the intensity of the original images, but can be helpful if all images are uniformly dim.
Thresholding: Select the desired thresholding method from the provided options. This protocol will focus on the manual thresholding option where each channel of each image is assigned a threshold by the user.
ROI Type: Select the desired region of interest (ROI) type from the provided options. Whole Image should be selected unless there is a specific ROI within the image to focus analysis around.
Within ROI Type, the user also selects minimum and maximum pixel values for each channel. These are the bounds on the area (in pixel units) of the smallest and largest puncta to be included in the analysis.
Analysis Type: Select either the circular-approximation or pixel-overlap analysis modes. The pixel-overlap method is recommended for most applications and uses the individual pixels of each channel to determine colocalizations. The circular-approximation mode uses the area and location of the puncta for each channel to approximate each puncta as a circle and then determine if the circles from each channel are overlapping and is only recommended when comparing to results obtained with previous algorithms that used circular-approximation (such as Puncta Analyzer).
Experiment Directory: Click the browse button and select the Experiment level folder that we set up earlier. You must select the Experiment-level folder rather than the Group-level folder or image files.
Once the desired settings have been entered, click the OK button to begin running SynBot
Manual Thresholding
Once preprocessing has been completed, the first channel of the first image will appear. Adjust the sliders in the Threshold box until the foreground pixels are kept while excluding most of the background pixels. Typically only the lower threshold will be adjusted with the upper threshold remaining at the maximum value of 255. Click OK once the desired threshold is chosen.
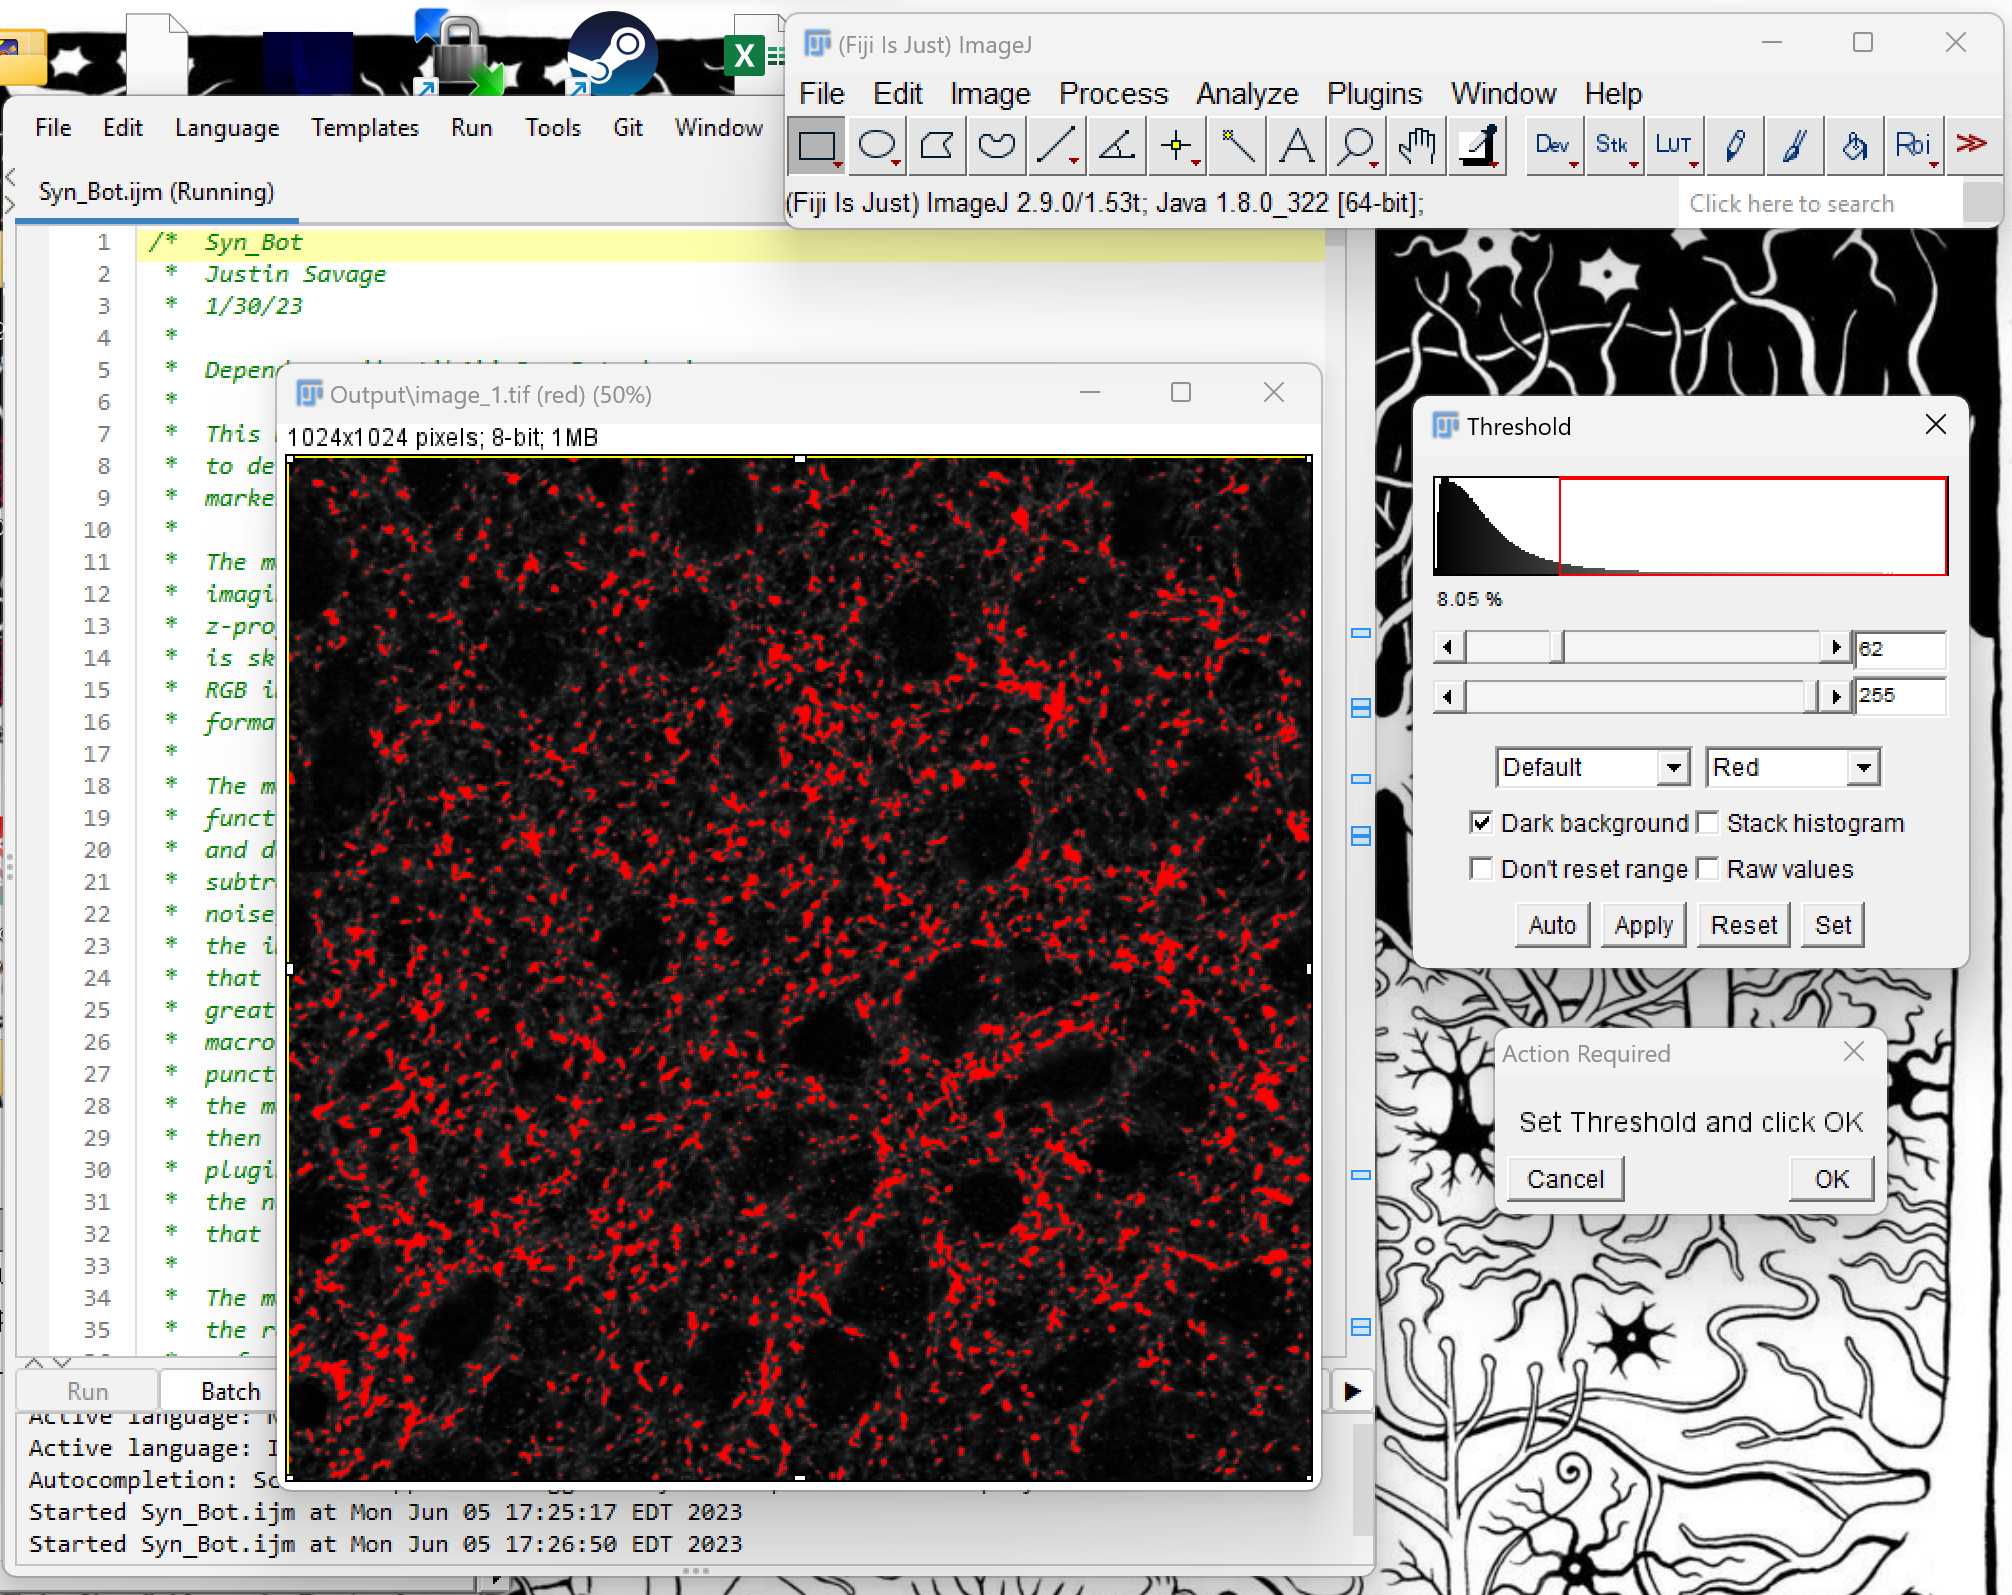
Next, the macro will display the green channel of the image. Threshold this image using the Threshold sliders as you did in the previous step.
Repeat Manual Thresholding for each image in the data set.
Data Outputs
Once thresholding all images is completed, a results file called Summary.csv will be displayed. This file is automatically saved within the Experiment-level folder selected earlier and can be closed.
Navigate to the Group-level folders within the Experiment-level folder selected earlier. These Group folders will now each contain an Output folder which includes several useful outputs:
- A copy of the original image converted to RGB (i.e. image_1.tif)
- A copy of the original image with white overlays labeling each counted colocalization (i.e. image_1_colocs.tif)
- The thresholded image for each channel (i.e. image_1_redThresholded_0.tiff)
- The full set of measurements of each punctum counted for each channel (i.e. image_1_redResults_0.csv) These files should be reviewed to ensure the program is counting colocalizations as desired.
Returning to the Experiment-level folder shows the Summary.csv file which includes the summary statistics for each image that serve as the primary outputs of the SynBot analysis including:
- Puncta counts for each channel
- Colocalized puncta count
- Thresholds used
- Min Pixel values used
