Measuring Cytoskeletal Mechanical Fluctuations and Rheology with Active Micropost Arrays
Yu Shi, Yu Shi, Shankar Sivarajan, Shankar Sivarajan, John C. Crocker, John C. Crocker, Daniel H. Reich, Daniel H. Reich
Abstract
The dynamics of the cellular actomyosin cytoskeleton are crucial to many aspects of cellular function. Here, we describe techniques that employ active micropost array detectors (AMPADs) to measure cytoskeletal rheology and mechanical force fluctuations. The AMPADS are arrays of flexible poly(dimethylsiloxane) (PDMS) microposts with magnetic nanowires embedded in a subset of microposts to enable actuation of those posts via an externally applied magnetic field. Techniques are described to track the magnetic microposts’ motion with nanometer precision at up to 100 video frames per second to measure the local cellular rheology at well-defined positions. Application of these high-precision tracking techniques to the full array of microposts in contact with a cell also enables mapping of the cytoskeletal mechanical fluctuation dynamics with high spatial and temporal resolution. This article describes (1) the fabrication of magnetic micropost arrays, (2) measurement protocols for both local rheology and cytoskeletal force fluctuation mapping, and (3) special-purpose software routines to reduce and analyze these data. © 2022 The Authors. Current Protocols published by Wiley Periodicals LLC.
Basic Protocol 1 : Fabrication of magnetic micropost arrays
Basic Protocol 2 : Data acquisition for cellular force fluctuations on non-magnetic micropost arrays
Basic Protocol 3 : Data acquisition for local cellular rheology measurements with magnetic microposts
Basic Protocol 4 : Data reduction: determining microposts’ motion
Basic Protocol 5 : Data analysis: determining local rheology from magnetic microposts
Basic Protocol 6 : Data analysis for force fluctuation measurements
Support Protocol 1 : Fabrication of magnetic Ni nanowires by electrodeposition
Support Protocol 2 : Configuring Streampix for magnetic rheology measurements
INTRODUCTION
The mechanics of the actomyosin cytoskeleton is crucial to many aspects of cellular function, and the study of its dynamics is critical to advancing the understanding of mechanobiology. The cytoskeleton is an active material that can generate forces internally from the action of myosin motors. It is thus essential to characterize both its rheological properties and the dynamical fluctuations of the forces generated in its various component structures, such as stress fibers and the cortex. A variety of approaches are available to measure cellular mechanical properties, including atomic force microscopy (Hecht et al., 2015; Kilpatrick, Revenko, & Rodriguez, 2015; Li, Dang, Liu, Xi, & Wang, 2017; Smith, Tolloczko, Martin, & Grutter, 2005), magnetic twisting cytometry (Fabry et al., 2001; Massiera, Van Citters, Biancaniello, & Crocker, 2007), and active microrheology using internalized probe particles (Wei et al., 2008; Hoffman, Massiera, Van Citters, & Crocker, 2006). Quasi-static cellular force generation (e.g., traction forces and contractility) is commonly measured by techniques such as traction force microscopy (Plotnikov, Sabass, Schwarz, & Waterman, 2014) and micropost array detectors (MPADs) (du Roure et al., 2005; Geng & Wang, 2016; Tan et al., 2003), but as commonly applied, these techniques have not enabled access to cytoskeletal force fluctuations. There is growing recognition, however, of the importance of measuring the active dynamics and mechanics of cytoskeletal traction force processes such as during cell spreading (Lohner et al., 2019; Wolfenson et al., 2016) and in recently observed rearrangements in the actomyosin cortex termed cytoquakes (Alencar et al., 2016; Floyd, Levine, Jarzynskie, & Papoian, 2021; Shi et al., 2021; Shi, Porter, Crocker, & Reich, 2019). Passive microrheology on internalized probe particles (Guo et al., 2014) or cellular organelles (Lau, Hoffman, Davies, Crocker, & Lubensky, 2003) can give information on the spectrum of cytoskeletal force fluctuations. However, it is not always clear what portion of the cytoskeleton is being probed. Furthermore, number of probes that can be embedded may be limited, limiting the ability to map spatial variations in force fluctuations.
In this protocol, we describe the fabrication and use of active micropost array detectors (AMPADs), which are MPAD devices with magnetic nanowires embedded in a subset of the microposts to enable the actuation of those posts for studies of the local rheology of the cytoskeleton. Techniques are described to track the microposts’ motions with nanometer precision at high speed to enable measurements of the local cellular rheology at well-defined positions. When applied to the full array of microposts in contact with a cell, high-precision tracking techniques also allow mapping of the cytoskeletal mechanical fluctuation dynamics with unprecedented spatial and temporal resolution.
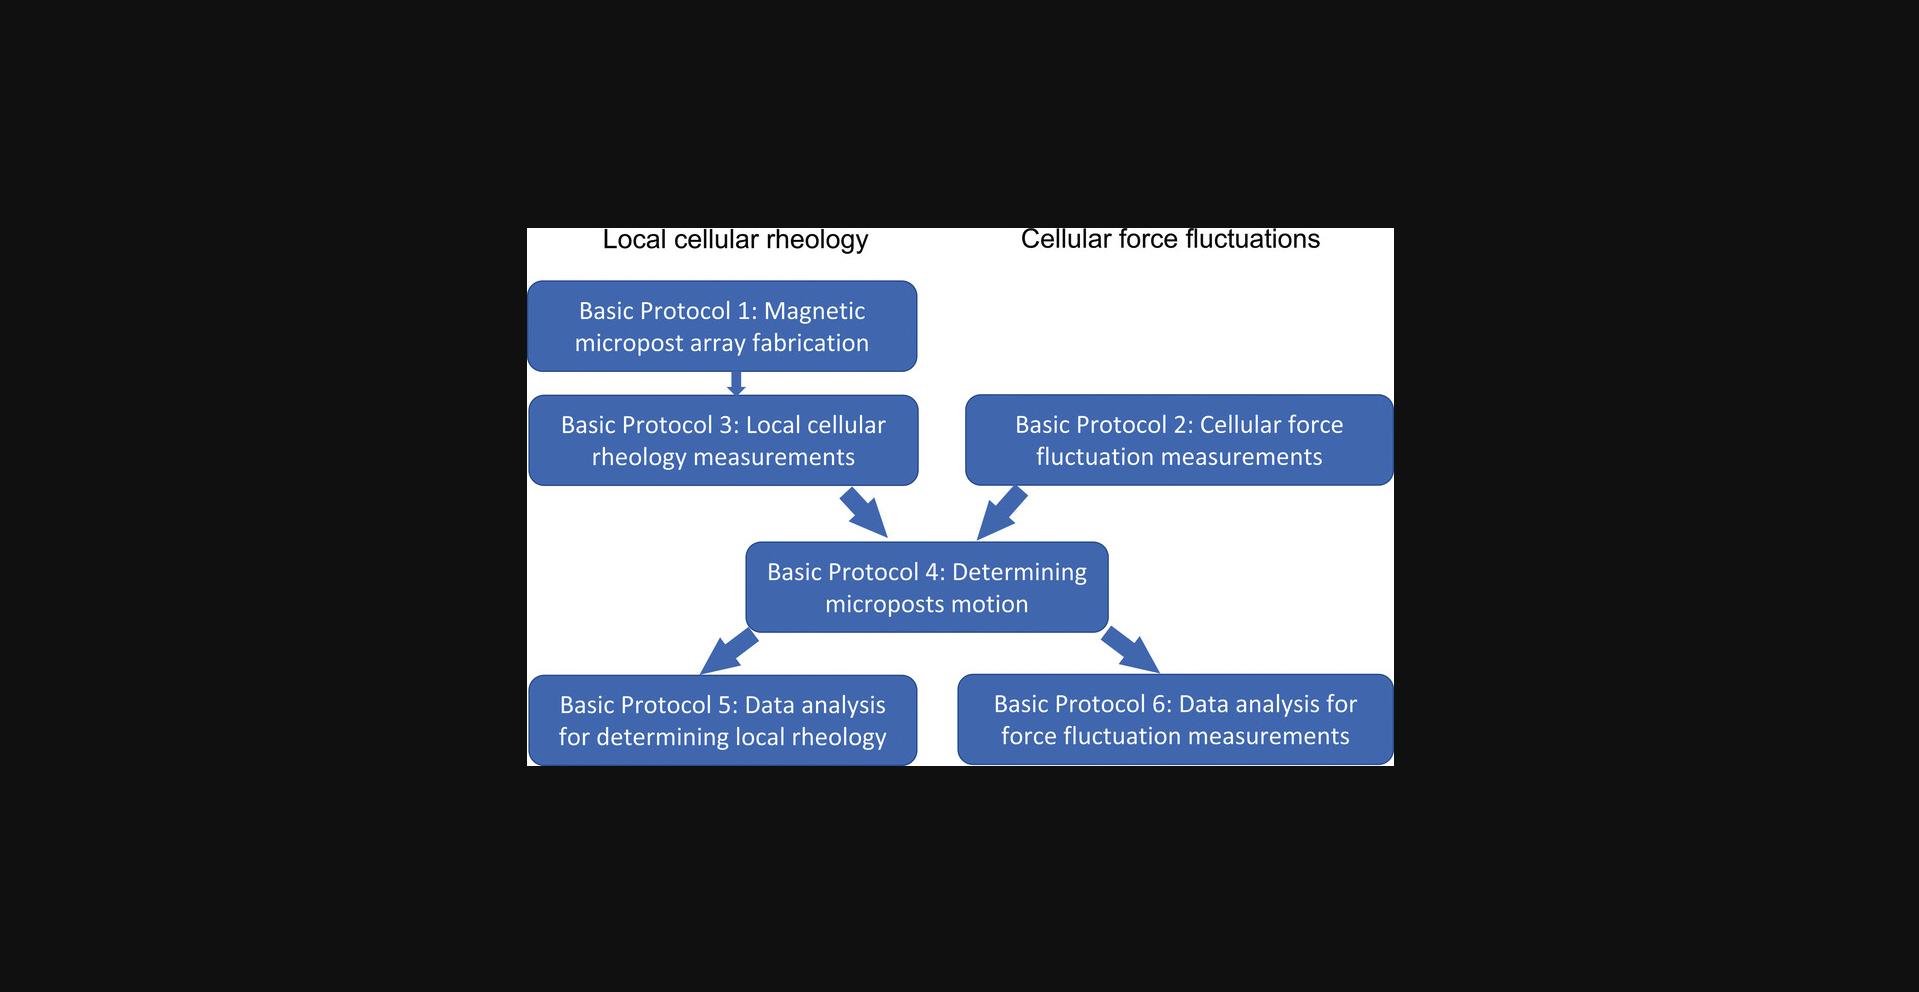
The techniques described in this article are organized into six basic protocols, as outlined in Figure 1. Approaches for producing poly(dimethylsiloxane) (PDMS) MPAD arrays via replica molding have been described in detail (Fu et al., 2010; Tan et al., 2003; Weng & Fu, 2011; Yang, Fu, Wang, Desai, & Chen, 2011), and so Basic Protocol 1 describes only the key additional steps for producing AMPAD arrays with embedded magnetic Ni nanowires. We then focus on the high-speed measurement techniques and associated data analysis approaches needed to study cytoskeletal rheology and mechanical fluctuations. Basic Protocol 2 describes data acquisition for cellular force fluctuations on non-magnetic micropost arrays. Basic Protocol 3 describes data acquisition for local cellular rheology measurements with magnetic microposts. Basic Protocol 4 illustrates the use of high-resolution particle tracking techniques (Crocker & Grier, 1996) to extract the microposts’ positions versus time for both magnetic and non-magnetic posts. Basic Protocol 5 describes converting such data for magnetic posts to frequency-dependent local cellular rheology. Basic Protocol 6 describes the analysis of the motion of non-magnetic posts, focusing on the posts’ mean squared displacements (MSDs) to yield maps of the fluctuations and identify those posts coupled to different components of the cytoskeleton such as the stress fibers and the actomyosin cortex. Support Protocol 1 describes the fabrication of magnetic nanowires via electrodeposition in nanoporous templates. Support Protocol 2 describes how to configure the specific video acquisition software (Streampix) we employ for the magnetic rheology measurements. Note that Basic Protocols 4-6 are described in the context of special-purpose software written in Igor Pro (Wavemetrics) (available as an online resource on Github). However, overviews of the principles involved are also provided should researchers wish to implement these protocols in other programming environments.
Basic Protocol 1: FABRICATION OF MAGNETIC MICROPOST ARRAYS
This protocol uses replica molding techniques to fabricate PDMS micropost arrays with magnetic Ni nanowires embedded in individual microposts. These nanowires have diameters of 350 nm, lengths of 5 μm, and average low-field magnetic moments μ = 0.15 pA m2, aligned along their long axes (Hultgren et al., 2005; Hultgren, Tanase, Chen, & Reich, 2004). This protocol assumes the user can follow published protocols to make, or has access to, “master” versions of the arrays, which are typically made on silicon wafers by photolithographic techniques (Fu et al., 2010; Yang et al., 2011), and has followed published methods to cast “negative” PDMS molds of the desired micropost arrays (Tan et al., 2003; Yang et al., 2011). To make magnetic micropost arrays, magnetic Ni nanowires are positioned in the post forms (holes) in the negative molds. PDMS is then cast around them, embedding the nanowires in the posts. The nanowires must be shorter than the length of the microposts, or the magnetic microposts may be too stiff to bend in response to magnetic torques applied to the nanowires. The procedures described will yield approximately 1% of the posts containing magnetic nanowires for post arrays with 1.8 μm post diameters and 4 μm center-to-center post spacing (Shi et al., 2019). Note that the magnetic microposts will be randomly distributed within the arrays. After the arrays are fabricated, they are removed from the molds in ethanol and dried using a critical point dryer to avoid collapsing the posts (Yang et al., 2011). The tips of the posts are functionalized with the extracellular matrix protein fibronectin via microcontact printing to promote cell adhesion to the micropost tips (Tan et al., 2003; Yang et al., 2011). Fibronectin works well for various cell types, but other ECM proteins can be used if needed. The sides of the posts and the regions in between are then blocked from cell adhesion by coating with Pluronics F-127.This is important as the conversion of micropost deflection to force depends on the cells’ forces being restricted to the posts’ tips (Fu et al., 2010; Tan et al., 2003). We note that non-magnetic micropost arrays, produced via published protocols (Yang et al., 2011), are also used for some of the measurements described below.
Materials
-
Poly(dimethylsiloxane) (PDMS) and curing agent (Sylgard 184, Dow Corning)
-
Tridecafluoroctyltrichlorosilane (T2492, UCT Specialties)
-
100% ethanol
-
Magnetic Ni nanowires suspended in ethanol (106 nanowires/ml; see Support Protocol 1)
-
Small metal spatula
-
50-ml centrifuge tubes
-
Centrifuge (Thermo Centra CL2, or equivalent)
-
50-mm square polystyrene weighing dishes (Southern Labware, or equivalent)
-
Vacuum desiccator (Bel-Art Products)
-
Vacuum pump for degassing PDMS (Ningbo Maisi Model TC-100, or equivalent)
-
70°C Oven (VWR ShelLab Model 1310, or equivalent)
-
Oxygen plasma etcher (Technics PE II-A, or equivalent)
-
Vacuum desiccator for silanization (Bel-Art Products)
-
Vacuum pump for silanization (FJC Products, Model VP 5.0, or equivalent).
-
Standard cover glasses (22 mm × 22 mm)
-
UV/Ozone treater (UVO Cleaner Model 42, Jelight)
-
Plastic Petri dishes (Fisherbrand 100 mm × 15 mm polystyrene)
-
Tweezers (metal, Techni-Tool)
-
Ultrasonic agitator (Branson 1510, or equivalent)
-
Vortex shaker (VWR model 100, or equivalent)
-
Micropipette, 200 µl capacity (Eppendorf Research, or equivalent)
-
200 µl pipette tips (USA Scientific TipOne)
-
Rectangular rare-earth magnets with their magnetic poles perpendicular to the large faces (K&J Magnetics BC-82; Dimensions 1.9 cm × 1.3 cm × 0.32 cm (¾'' × ½'' × 1/8'')
1.Treat the molds with an oxygen plasma under a pressure of 450 mTorr at 100 W power for 90 s.
2.Transfer the molds to a vacuum desiccator with a few drops of tridecafluoroctyltrichlorosilane on a glass coverslip. Pump to a rough vacuum and let stand overnight.
3.Select a pre-prepared solution of nanowires of the desired dimensions at a concentration of 106 /ml in ethanol.
4.Sonicate the nanowire solution for 5 min.
5.Agitate the nanowire suspension in a vortex shaker for a few seconds.
6.Arrange PDMS molds in a plastic Petri dish (one mold per array desired).
7.Place rectangular rare-earth magnets under the Petri dish, one under each mold.
8.Pipette 30 μl of nanowire solution onto each mold.
9.Wait for the solution to evaporate (20-30 min).
10.Pipette another 30 μl of nanowire solution onto each mold and wait for it to evaporate.
11.Repeat until 180 μl of nanowire solution has been pipetted onto each mold.
12.Mix PDMS and curing agent in a 10:1 ratio in a Styrofoam cup.
13.Stir the mixture with a spatula for about 3-4 min.
14.Pour the mixture into a 50-ml centrifuge tube and centrifuge for 5 min at 104 m/s2 (5k rpm on the above system).
15.Arrange cover glasses (one for each micropost array desired) on a plastic Petri dish and treat with ultraviolet (UV)/ozone for 7 min.
16.Add a drop of PDMS to each mold from step 11.
17.Press a UV-treated cover glass onto each of the molds.
18.Degas the molds in a vacuum desiccator for 5 min.
19.Bake the molds at 65°C on a hot plate for 1 hr.
20.Remove the magnets.
21.Flip the molds over so the cover glasses are on the bottom.
22.Bake the dish with the cover glasses in a curing oven set to 70°C overnight.
23.Remove the Petri dish and devices from the oven, allow to cool, and add 100% ethanol to the dish until the cover glasses are completely immersed.
24.Use tweezers to twist the molds off the cover glasses.
25.Dry the arrays in a critical point dryer
26.Stamp fibronectin on the post tips via micro-contact printing and coat the non-stamped regions of the arrays with F127 Pluronic.
27.Store fibronectin and Pluronic coated arrays in PBS until used.
Support Protocol 1: FABRICATION OF MAGNETIC NI NANOWIRES BY ELECTRODEPOSITION
This protocol describes the fabrication of the nickel nanowires used to make the microposts magnetic. The nanowires are made by electrodeposition in nanoporous templates (Felton, 2009; Hultgren et al., 2005; Kramer, 2009; Rovner, 2013). The templates are commercial 60-µm thick alumina filter membranes. These membranes have nominal pore diameters of 100 nm but only have this diameter in a small region 3-5 µm thick near the bottom of the membrane. For most of their length, their diameter is 350 nm, which sets the diameter of the nanowires. The length of the nanowires is controlled by how much Ni is deposited into the pores. For the microposts described in this protocol, the desired nanowire length is 5 µm. (The deposition procedure typically allows the length to be controlled to ±10%.) A copper film is sputter-deposited onto the bottom of the filter membranes to seal the ends of the pores in the template and serve as a working electrode for the electrodeposition. Note that thermal evaporation of Cu has been found inadequate to seal the pores. A thin layer of Cu is electrodeposited first to fill the narrow (100 nm diameter) end sections of the pores, and then Ni is deposited to produce the desired magnetic nanowires. The Cu is removed using a copper etchant, and the template is dissolved in KOH to release the nanowires. The wires may be stored for extended periods in ethanol or isopropanol before use.
Materials
-
Alumina filter membranes, nominal pore size 100 nm, 60 µm thickness (Anodisc 47, Whatman)
-
Copper sputter target
-
Argon gas
-
Acetone
-
Isopropanol
-
Cu plate, 0.25″ thick, approx. 2.5″ square
-
DI water
-
Copper electrodeposition solution: 125 g/L CuSO4 •5H2O, 30 g/L H3BO3, 20 g/L NaCl in DI water.
-
Nickel electrodeposition solution: 514 g/L Ni(SO3NH2)2•4H2O, 20 g/L NiCl2•6H2O, 20 g/L H3BO3 in DI water.
-
0.5 M KOH solution in DI water
-
Glass vials or glass test tubes
-
Sputter deposition system
-
Teflon electrodeposition chamber (cylinder with open bottom)
-
Spring clamp
-
Blow torch
-
Pt counter electrode, consisting of Pt mesh attached to a Pt wire
-
Ag/AgCl reference electrode (Bioanalytical Systems, Inc. MF-2052)
-
Potentiostat (Princeton Applied Research, model 263A or equivalent)
-
Computer to control potentiostat
-
Single-edge razor blades
-
Temperature-controlled water bath (Neslab RTE-211, or equivalent)
-
Sonicator (Branson 1510, or equivalent)
1.Clean alumina templates by rinsing in acetone and isopropanol.
2.Sputter deposit a layer of Cu 500 nm thick on the side of the alumina templates with the nominal pore diameter (the back side).
3.Rub one side of the Cu plate thoroughly with sandpaper to remove its surface oxide.
4.Rinse the Cu plate with DI water.
5.Place the filter template Cu-side down on the Cu plate.
6.Rinse a rubber o-ring with DI water and place it on the top of the filter template.
7.Place the Teflon electrodeposition chamber on the o-ring and clamp it to the Cu plate with a spring clamp.
8.Rinse the chamber with DI water.
9.Fill the chamber with Cu electrodeposition solution.
10.Preclean the Pt counter electrode by placing it briefly in the flame of a blow torch and then washing it in DI water.
11.Insert an Ag/AgCl electrode in the deposition solution to serve as a reference electrode.
12.Connect the Pt electrode, Ag/AgCl reference electrode, and the Cu plate to the potentiostat.
13.Deposit Cu to fill the bottom 3-5 µm of the pores, using a reference potential of −0.2 V.
14.Pour off the spent Cu deposition solution and rinse the deposition chamber and electrodes in DI water to remove any remaining electrolytes.
15.Fill the chamber with the Ni deposition solution.
16.Deposit Ni into the pores to the desired length of the nanowires, using a reference potential of -1 V.
17.Pour off the spent Ni deposition solution and rinse the deposition chamber and electrodes in DI water.
18.Remove the filter membrane from the apparatus.
19.Cut away the sections of the filter template that were not electrodeposited with a razor blade.
20.Place the section of the filter membrane containing the nanowires in a Petri dish, Cu side up.
21.Rub the filter membrane with a Q-tip soaked in a Cu etching solution to remove the Cu. Repeat until all traces of the Cu are gone.
22.Place the template with the nanowires in a glass vial or test tube.
23.Fill the vial (or test tube) with 0.5 M KOH in water.
24.Seal the vial with parafilm and place the vial in a water bath at 60°C for 4-6 hr or overnight.
25.Sonicate the vial and nanowire suspension for 10 min.
26.Place one or more rare earth magnets against the side of the vial for ∼5 min.
27.Decant the KOH solution and replace it with a fresh KOH solution while keeping the magnet against the side of the vial.
28.Reseal the vial with parafilm and place the vial in a water bath at 60°C for another 4-6 hr.
29.Sonicate the vial for 10 min and shake gently by hand.
30.Collect and immobilize the nanowires again by placing one or more rare earth magnets against the side of the vial for ∼5 min.
31.Decant the solution and replace it with DI water to wash the nanowires.
32.Repeat steps 29-31 five times.
33.Collect and immobilize the nanowires again.
34.Decant the DI water and rinse the nanowires once in acetone.
35.Repeat step 30 and replace the acetone with ethanol.
36.Inspect the nanowires with an SEM or an optical microscope after fabrication.
Basic Protocol 2: DATA ACQUISITION FOR CELLULAR FORCE FLUCTUATIONS ON NON-MAGNETIC MICROPOST ARRAYS
This protocol describes how to use video microscopy to measure the time-dependent displacements of microposts in contact with cells. The resulting data are of sufficient quality that the positions of the microposts can be measured with nanometer accuracy at up to 100 video frames per second, using the image analysis procedures described in Basic Protocol 4.This protocol is used for data acquisition for cellular force fluctuations on non-magnetic micropost arrays. Many of the steps described here are also needed for local cell rheology measurements with magnetic micropost arrays (Basic Protocol 3.) This protocol includes instructions for seeding and culturing cells on the micropost arrays before the measurements. These are, of necessity, somewhat generic and may have to be modified depending on the specific cell type used. When imaging a cell, it is important to have it sufficiently centered in the field of view to have a border of at least 3-4 rows and columns of microposts that are not engaged with the surrounding cell. Data from these “background” microposts are used in the data reduction (Basic Protocol 4) to compensate for any overall drift in the array's position and to determine the undeflected positions of the posts in contact with the cell. The data from the background posts also provide a measure of imaging noise in the system. Note that in this protocol, there will be a free liquid-air interface from the cell culture medium to the optical path. This has not proven to be a problem for experiments such as those described in (Shi et al., 2019; Shi et al., 2021). However, if needed, it is possible to eliminate this potential source of noise in the post tracking by using a dish such as that described in Basic Protocol 3 that eliminates the liquid-air interface.
Materials
-
Micropost arrays, functionalized to promote cell adhesion on the post tips, as described in Basic Protocol 2.
-
Cells in culture ready to be passaged
-
Cell culture medium with serum, antibiotics, etc., to culture cells under study.
-
Disposable, sterile 5 and 1 ml pipettes (Falcon, ThermoFisher, etc.)
-
5% premixed CO2 gas
-
Biosafety cabinet (Labconco Purifier BSC Class II, or equivalent)
-
Glass-bottomed P35 culture dishes (Thermo Scientific)
-
Sterilized tweezers
-
Pipettor (Falcon Express)
-
Tissue culture incubator (Sanyo Model MCO-17A, or equivalent)
-
Cell culture inspection microscope (Nikon TS-100, or equivalent)
-
Inverted microscope (Nikon TE-2000E or equivalent)
- 10×, NA = 0.3 air objective (Nikon Plan Fluor)
- 40×, NA = 0.6, extra-long working distance air objective with correction collar (Nikon Plan Fluor).
- 100 W halogen illuminator
- long-working distance condenser with NA = 0.52.
-
Ultraviolet (UV) (Edmund Optics cat. no. 64-667) and infrared (Edmund Optics cat. no. 47-303) filters
-
Microscope enclosure incubator with an on-stage environmental chamber (In Vivo Scientific, Model CH.HC5.SAT, or equivalent)
-
Microscope stage heating plate (20/20 Technologies, Model TC-500, or equivalent)
-
Computer equipped with hardware to support Norpix Streampix software and camera
-
Norpix Streampix software (Version 5.16 or later)
-
Gigabit Ethernet camera (Allied Vision GX1050, or equivalent)
Seeding cells onto an MPAD array
1.Prepare a cell suspension in culture medium.
2.Preheat to 37°C and add 2 ml cell culture medium to a glass-bottom P35 culture dish.
3.Transfer an MPAD array from PBS to the P35 dish with tweezers.
4.Pipette 200 μl of cells in suspension at the desired concentration into the dish.
5.Inspect the culture dish with a microscope.
6.Incubate MPADs overnight in a tissue culture incubator at 37°C and the CO2 level appropriate for the cells in use.
7.Remove air bubbles from under the MPAD using tweezers.
Data acquisition
8.Switch on the hot plate and microscope stage and allow to equilibrate at 37°C.
9.Put the environmental chamber onto the stage and connect it to the airflow control unit.
10.Start the flow of 5% premixed CO2 with an influx of 200 cm3/min.
11.Transfer the dish with cells seeded on an MPAD to the microscope's incubator and place it in the environmental chamber.
12.Wait until the medium in the dish warms to 37°C.
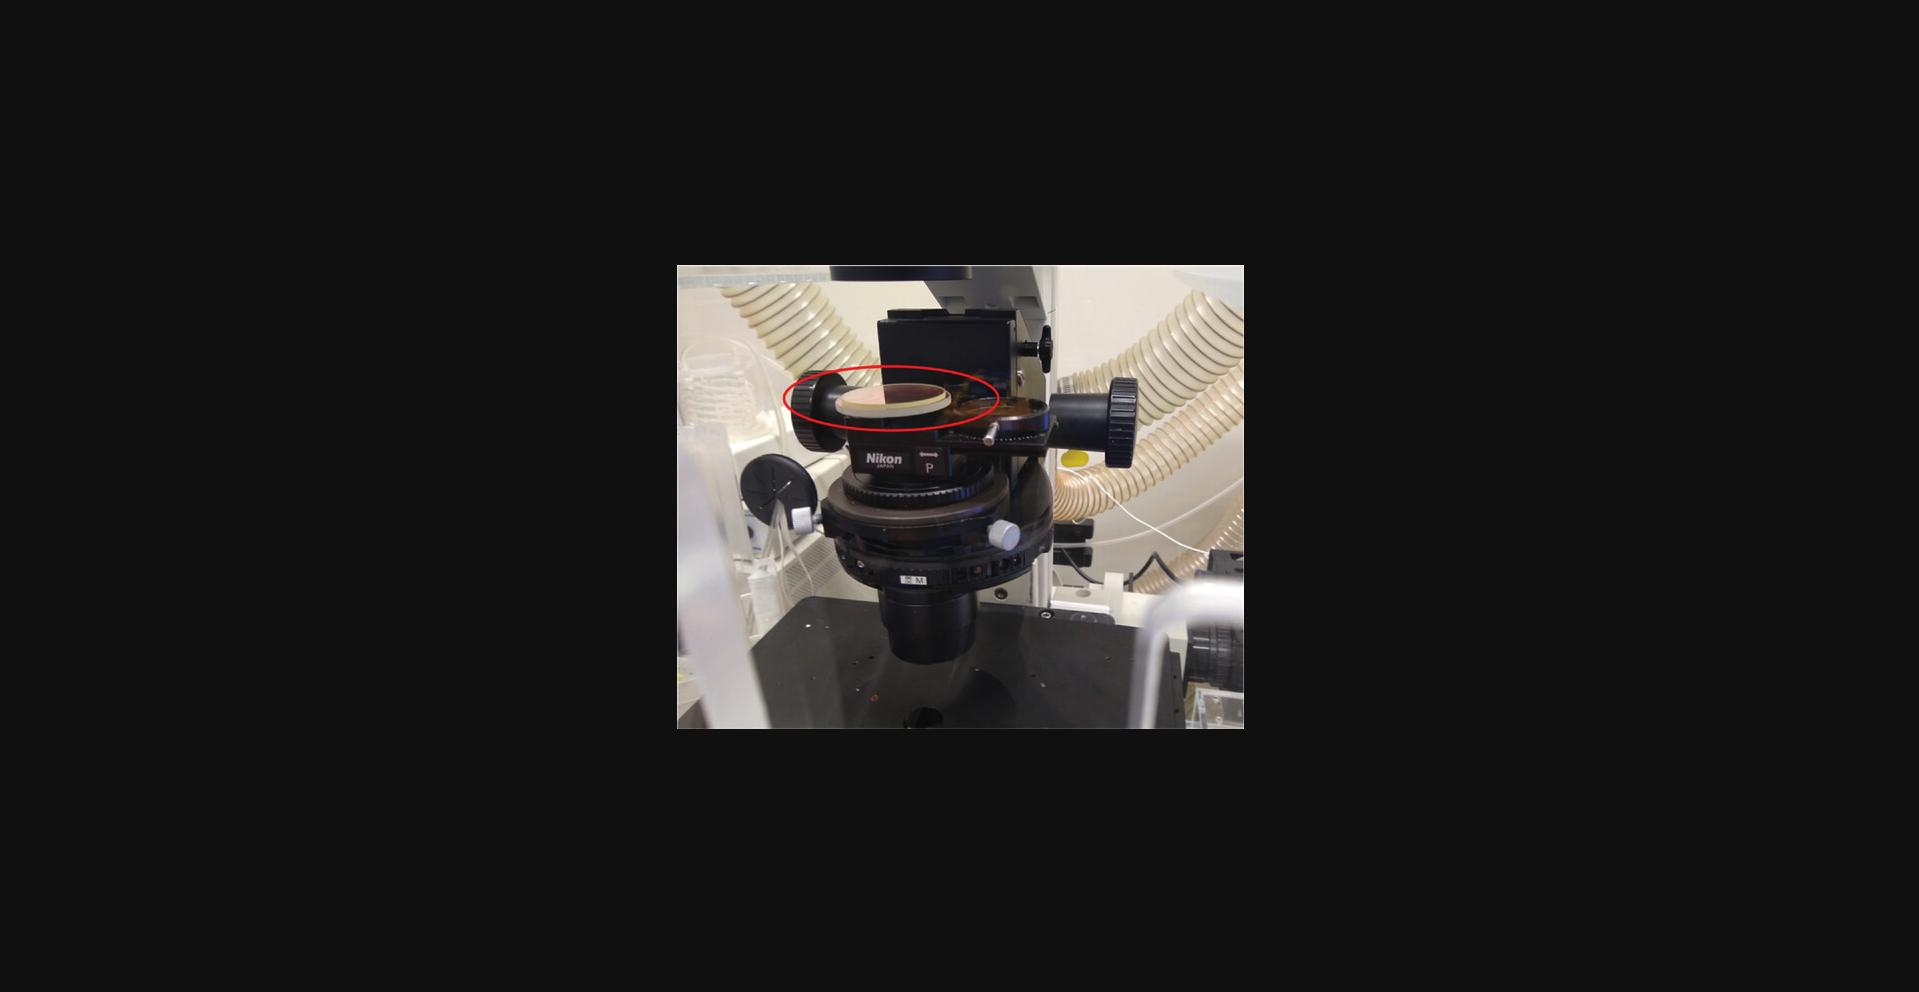
13.Position the UV and infrared filters in the incident light path of the microscope (Fig. 2) and switch on the illuminator. Position the microscope's green interference filter (GIF) in the light path.
14.Open the condenser aperture fully and ensure no other optical elements, such as phase rings, are in the light path through the condenser.
15.Adjust the microscope for Kohler illumination.
16.Using a 10× objective, center the field of view on a cell.
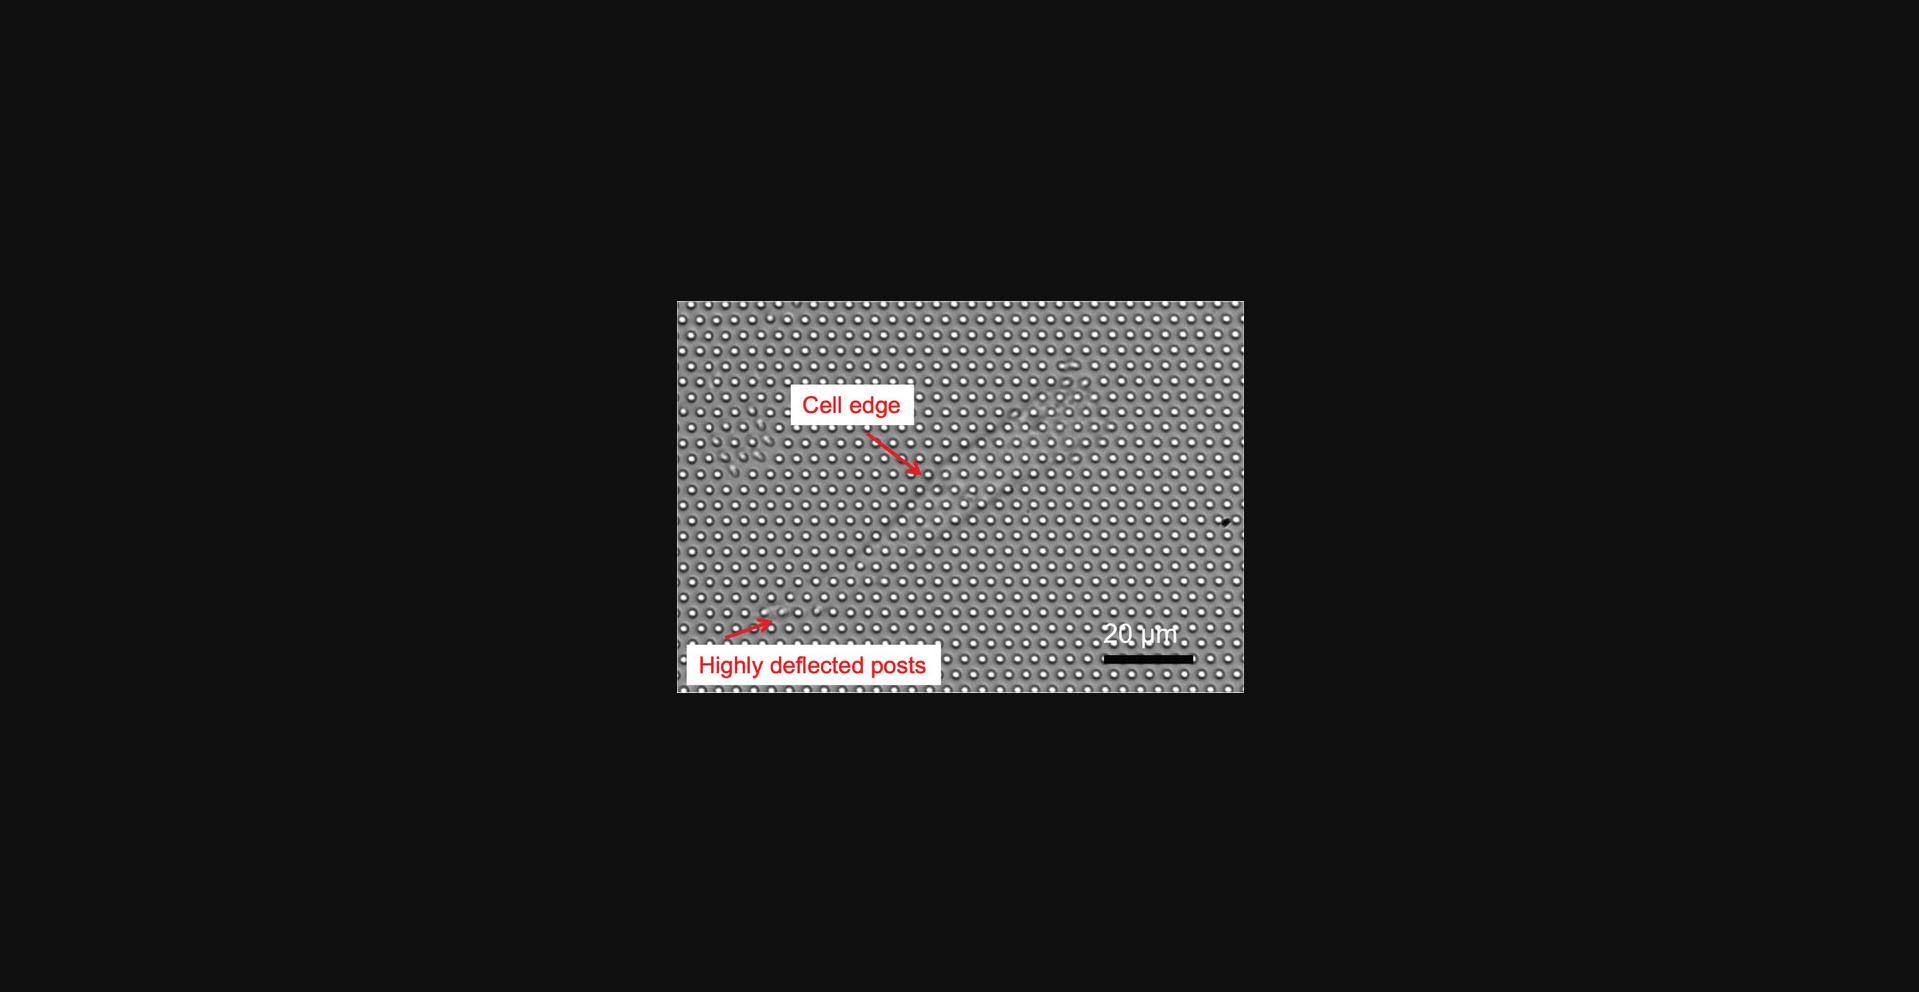
17.Rotate the sample dish so that rows of posts (in the hexagonal grid) are aligned with the horizontal (x translation axis) of the microscope stage (see Fig. 3).
18.Switch to the 40× objective.
19.Switch on the camera in the Norpix software.
20.Focus the camera on the plane of the tips of the posts (see Fig. 3).
21.Optimize the image quality using the objective's correction collar.
22.Set the gain to 1 in Norpix to avoid amplifying camera noise, and set the exposure time [Live Adjustments > Grabber Properties > Exposure (μs)]. Increase the illuminator intensity to maximize image intensity without saturating the image.
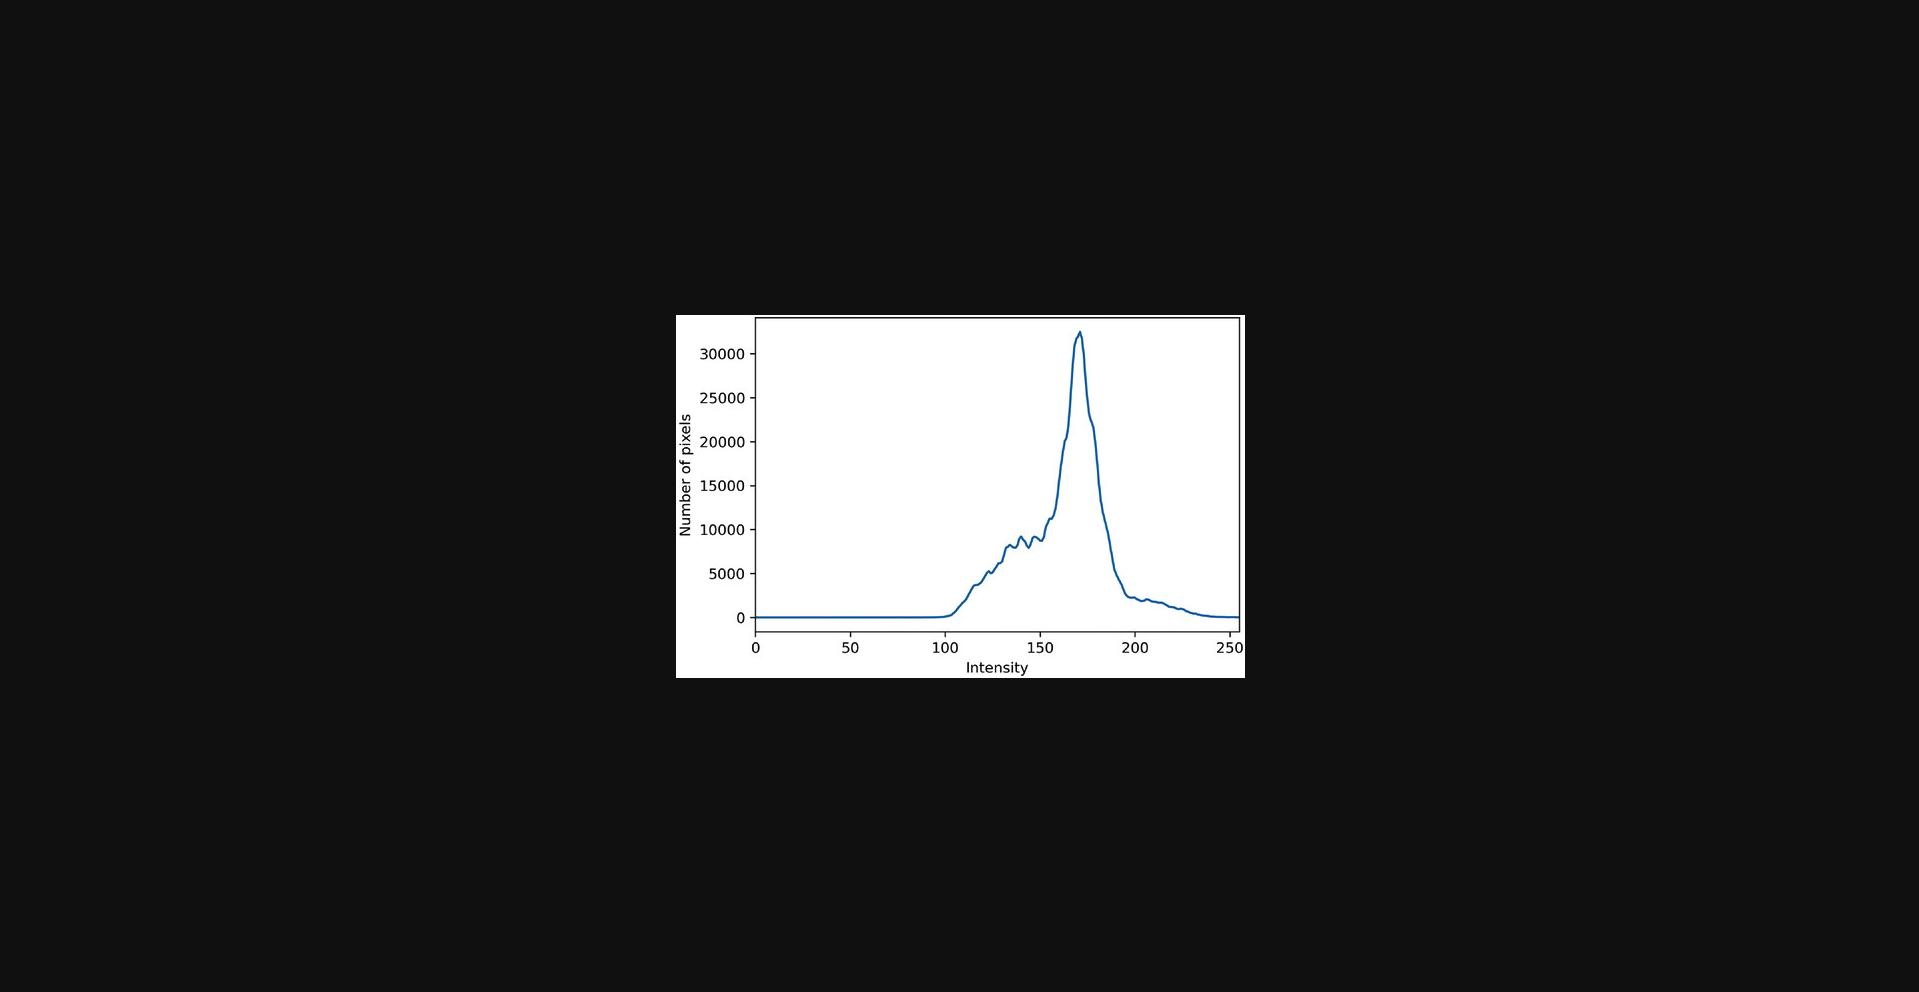
23.Record the cell at 100 fps for the desired time. In Norpix, these images are saved as lossless AVI files.
24.Change the field of view to center on another cell and repeat for as many cells as needed.
Basic Protocol 3: DATA ACQUISITION FOR LOCAL CELLULAR RHEOLOGY MEASUREMENTS WITH MAGNETIC MICROPOSTS
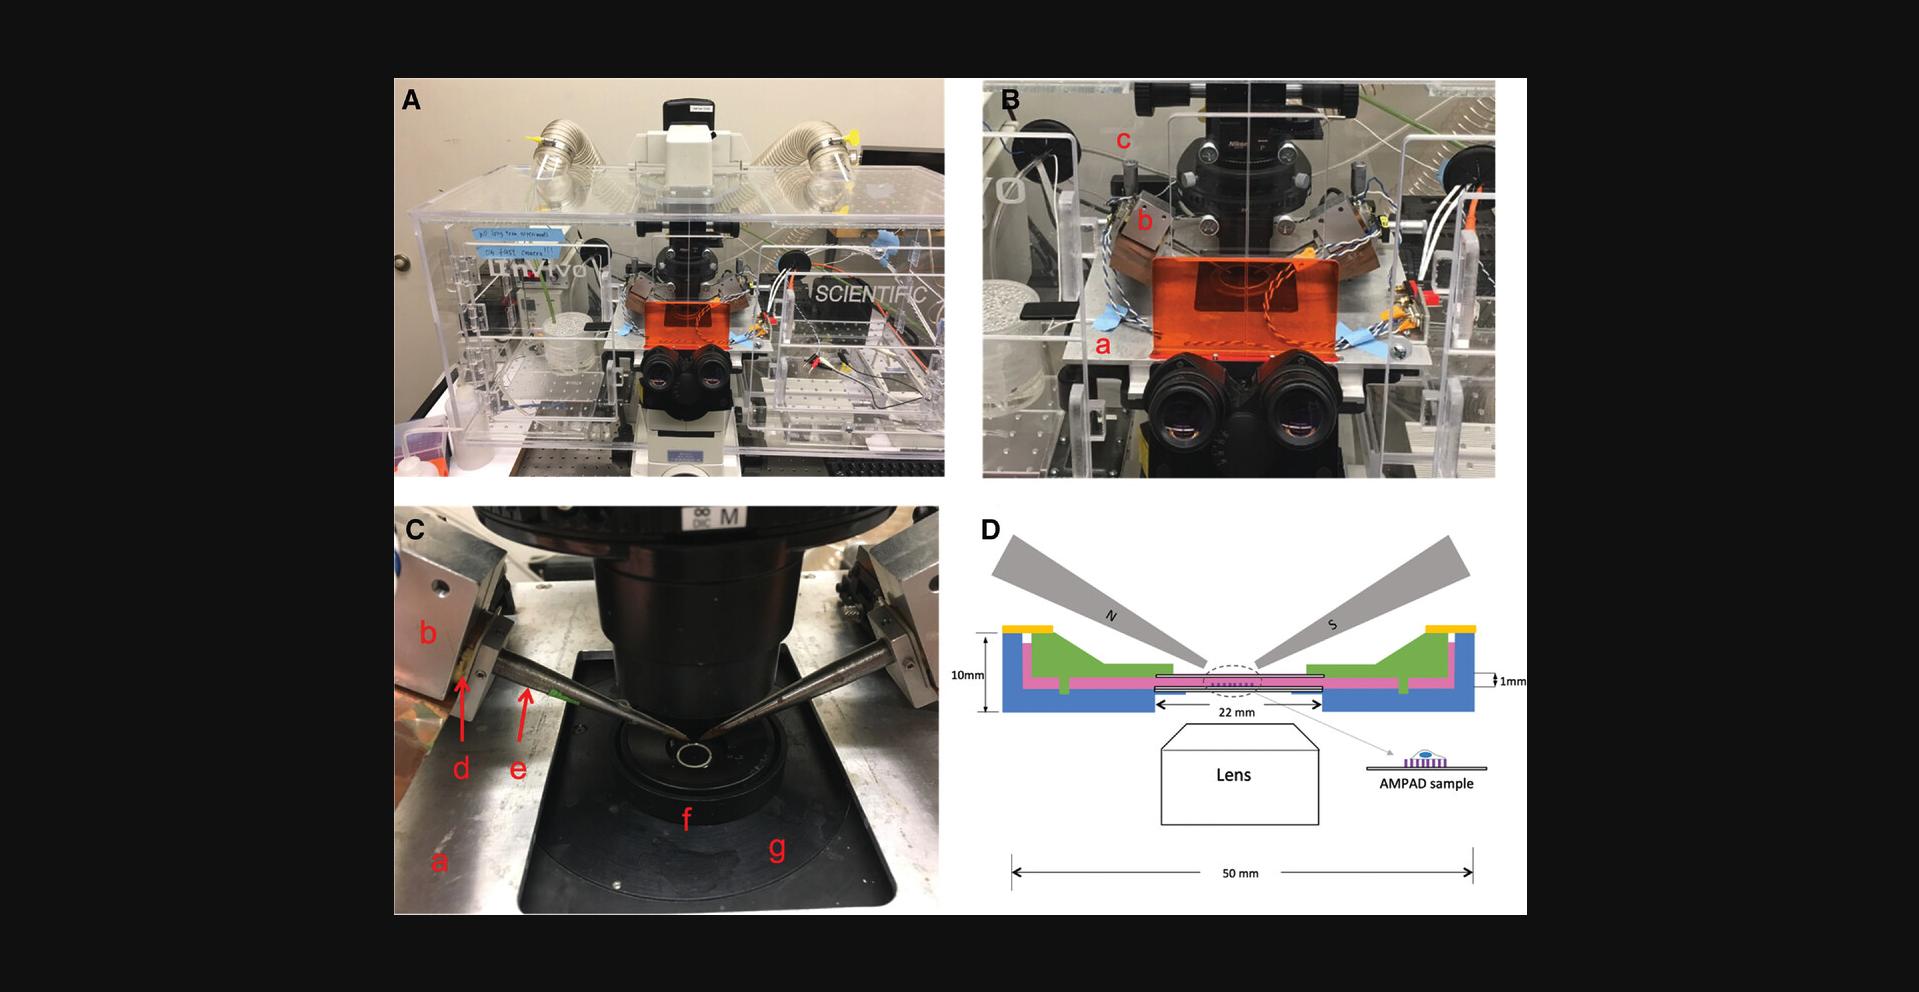
This protocol describes measurements of the local rheology of a cell by actuating a magnetic micropost with an AC magnetic field and recording the resulting motion of the post. For the Ni nanowires described here, this requires the ability to apply an AC magnetic field in the range of 10 mT to ensure a linear response. The system described operates from 0.1 Hz to over 100 Hz to enable robust measurement of the frequency-dependent rheology. It employs a dual magnetic tweezer (Fig. 5) to ensure that only one cell is exposed to the magnetic field at a time, but if this is not a consideration, then alternative approaches may be employed to generate the needed field. Detailed information on the construction of a magnetic tweezer system is provided in several publications (Bose, Huang, Eyckmans, Chen, & Reich, 2018; Kramer, 2009; Lin, Kramer, Chen, & Reich, 2012; Zhao, Boudou, Wang, Chen, & Reich, 2014).
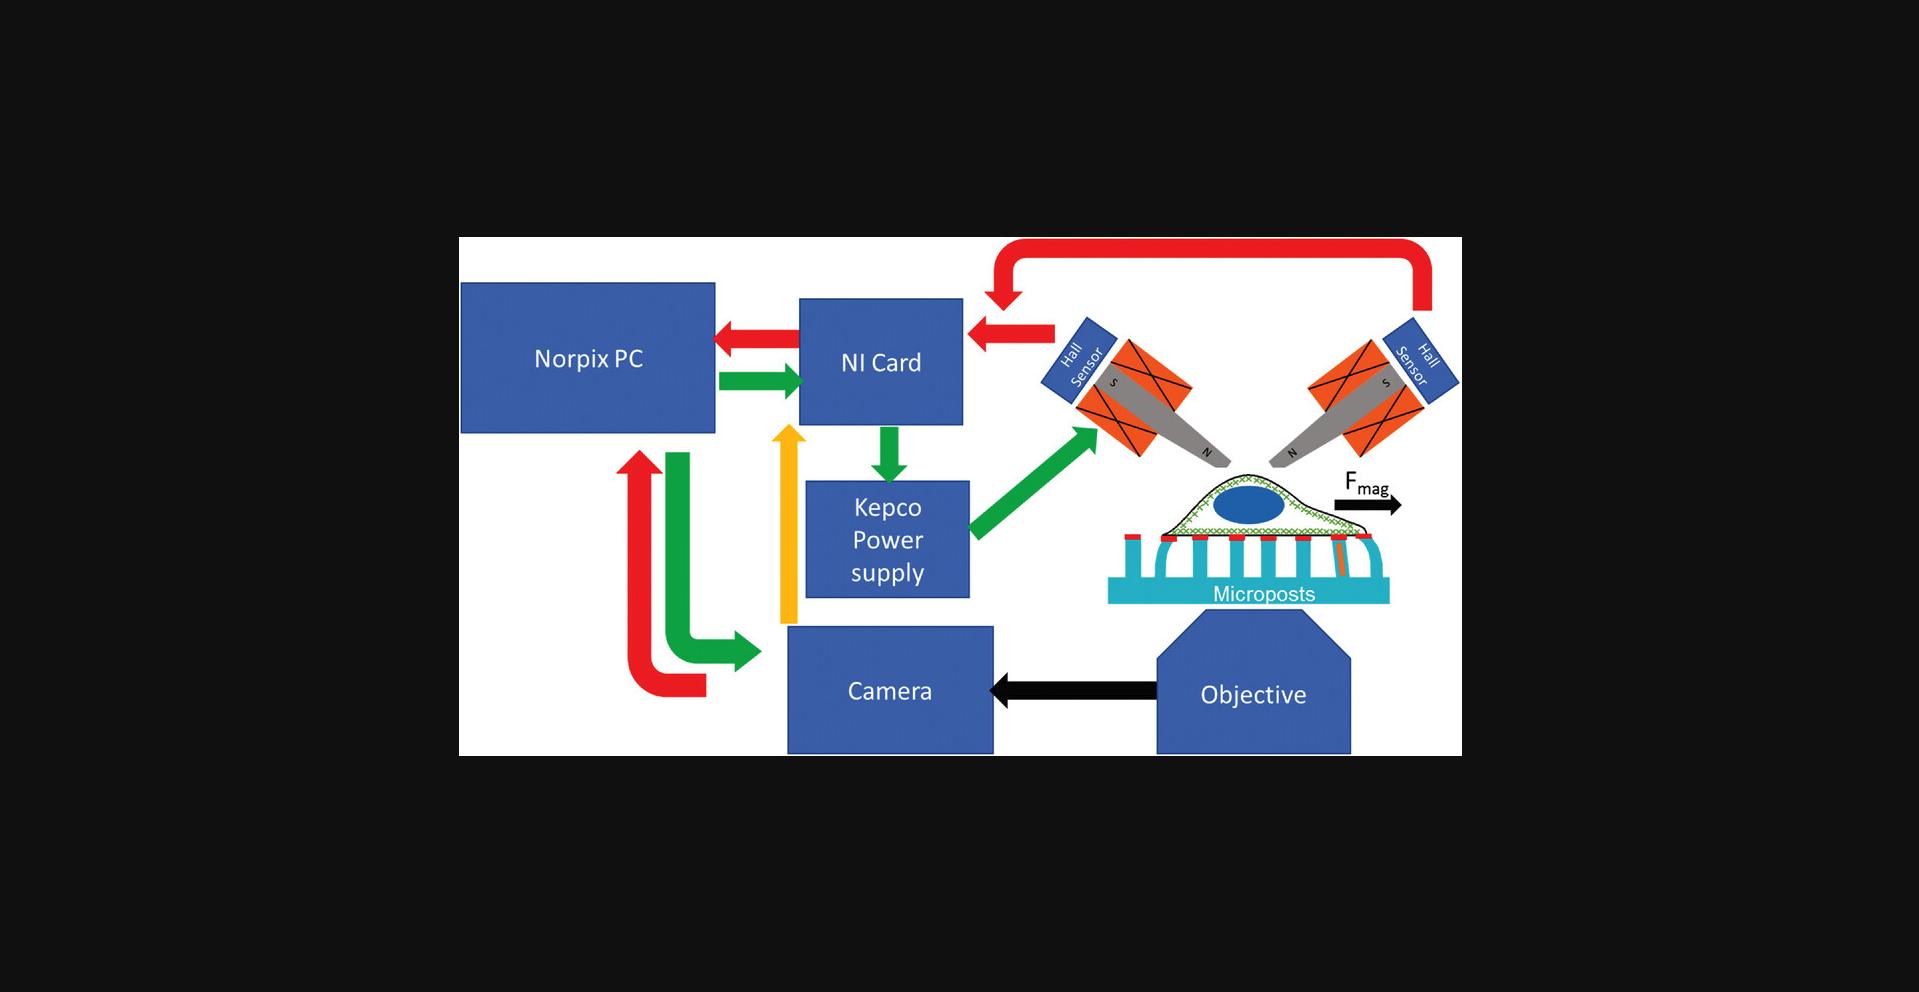
A block diagram of the magnetic actuation and video microscopy measurement system is shown in Figure 6.A PC running the Streampix (Norpix, version 5.16) video acquisition software is equipped with a National Instruments (NI) DAQ card. To produce the AC magnetic field, sinusoidal voltage waves from the NI card provide programming voltages to a Kepco BOP AC power supply operating in current-control mode, which provides current to drive a dual magnetic tweezer system mounted on an inverted microscope (green arrows). Hall sensors at the back end of the tweezers’ cores monitor their magnetic field, and the Hall voltages are read by the DAQ card and recorded by the PC (red arrow). The PC also controls a CCD camera on the microscope, recording the microposts’ motion (black arrow). To ensure the Hall voltages are measured simultaneously with the video frames, digital pulses from the camera when each frame is captured are used to trigger the measurements of the Hall sensors by the NI card (yellow arrow).
Materials
-
Gibco CO2 independent culture media (Thermo Fisher cat. no. 18045088)
-
5% Trypsin-EDTA (Corning)
-
PBS
-
Biosafety cabinet (Labconco Purifier BSC Class II, or equivalent)
-
Magnetic tweezers: two solenoids filled with iron cores, mounted on 3-axis micromanipulator stages
-
Sample dish with indented lid; custom-built, details provided below
-
PDMS ring to seal sample dish; details provided below
-
Computer configured to support Streampix software and equipped with National Instruments PCIe-6231 DAQ card
-
Norpix Streampix software (Version 5.16 or later)
-
Gigabit Ethernet camera (Allied Vision GX1050, or equivalent)
-
Kepco BOP 50-2M power supply.
-
Hall sensors (Lakeshore HGT-2101)
-
Inverted microscope (Nikon TE-2000E or equivalent)
- 10×, NA = 0.3 air objective (Nikon Plan Fluor)
- 40×, NA = 0.6, extra-long working distance air objective with correction collar (Nikon Plan Fluor).
- 100 W halogen illuminator
- long-working distance condenser with NA = 0.52.
-
Ultraviolet (UV) (Edmund Optics, cat. no. 64-667) and infrared (Edmund Optics, cat. no. 47-303) filters
-
Microscope enclosure incubator (In Vivo Scientific, Inc. Model CH.HC5.SAT, or equivalent)
-
Microscope stage heating plate (20/20 Technologies, Model TC-500, or equivalent)
-
Pipettes (200 and 20 µl)
-
Vacuum grease
-
UV cabinet (Model KT-16DC, Foshan Shunde South Electric Appliance, or equivalent)
-
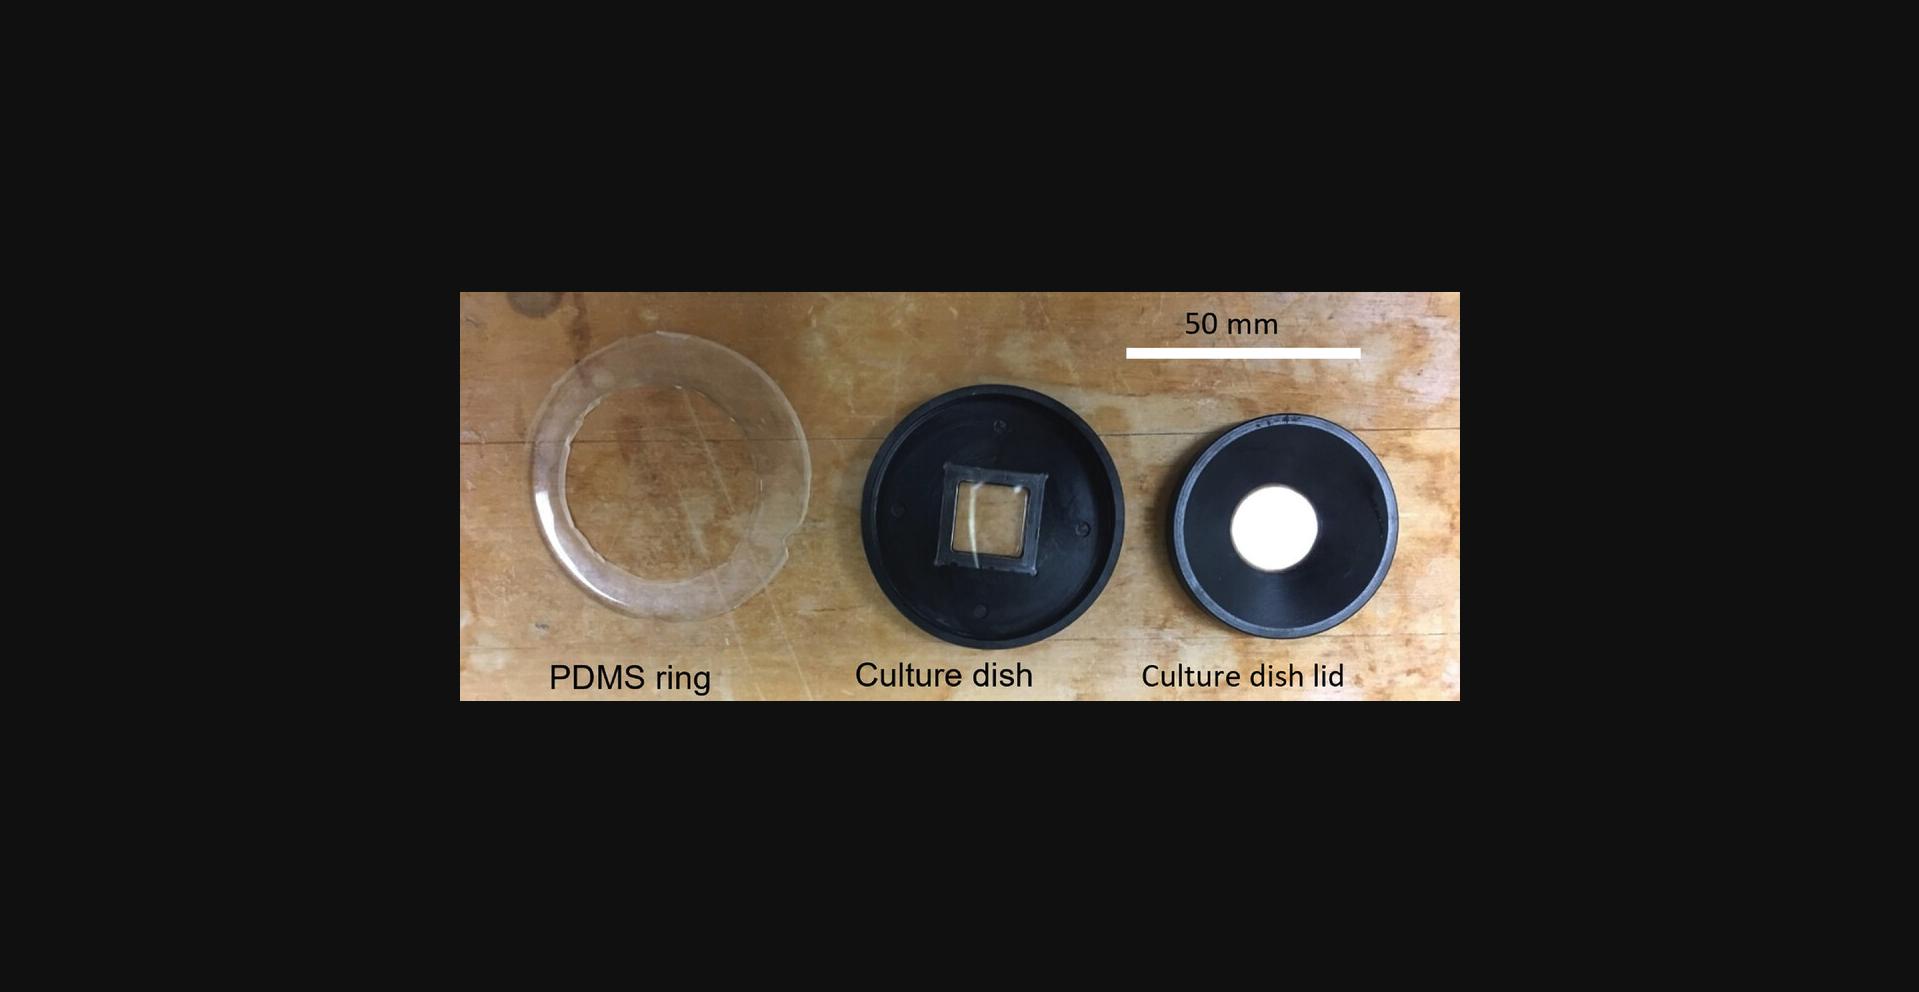
Further information on the sample dish used for cell rheology measurements : as shown in Figures 5D and 7 , a 50-mm culture dish is fabricated out of acetal plastic. A standard square coverslip (22 mm width × 0.17 mm thick) (shown edge-on in Fig. 5D ) is glued with PDMS into a cutout in the dish to allow optical access. A micropost substrate with adhered cells mounted on a similar coverslip fits into the cutout on top of the first coverslip. An acetal lid (green in Fig. 5D ) with a beveled top allows the magnetic tweezer tips (gray) to be brought within 1 mm of the cells without contacting the culture media (pink in Fig. 5D ). The lid has a coverslip glued into it to allow illumination, and the culture media should fill the volume between the dish and the lid. The lid has four 2-mm posts in a square pattern that fit into corresponding indentions in the dish to prevent motion of the lid. A PDMS ring (orange in Fig. 5D ) covers the open area between the edge of the lid and the dish to reduce media evaporation. The PDMS ring may be cast in a suitably sized Petri dish with a cylindrical insert (metal or plastic) to define the inner radius of the ring. The dish, lid, and PDMS ring are shown in Figure 7.
1.Configure the microscope for white light imaging of the magnetic microposts as described in Basic Protocol 2, steps 8-15.
2.Mount the dual magnetic tweezers onto the microscope. (Fig. 5)
3.Pre-heat the system with the stage incubator to 37°C.
4.Set up the Streampix software as described in Support Protocol 2.
5.Use a tweezer to add a drop of autoclaved vacuum grease at each corner of the custom glass-bottom dish. Place a magnetic AMPAD sample seeded with cells onto the glass bottom of the custom-built sample dish (Fig. 7) and ensure firm contact between the glass bottom of the sample dish and AMPAD.
6.Immediately add 1 ml of CO2 -independent culture media into the dish and place the custom culture dish lid (Fig. 7) over the sample.
7.Seal the sample dish with a PDMS ring.
8.Raise the tips of the magnetic tweezers and slide the sample dish under the tweezer tips.
9.Using the 40× objective, adjust the focus of the microscope until the tops of the posts are in focus, rotate the sample dish so that rows of posts (in the hexagonal grid) are aligned horizontally (see Basic Protocol 2, Section 2.2, step 10), and then raise the focal plane of the microscope by 1 mm above the tops of the posts.
10.Switch to the 4× objective and lower the tweezer tips until they are in focus.
11.Switch to the 10× objective. Adjust the lateral position of the tweezer tips until they are in the middle of the field of view and 500 µm apart.
12.Lower the tweezer tips by 200 µm.
13.Switch back to the 40× objective.
14.Switch on the camera in the Norpix software.
15.Find a cell with one or more magnetic microposts underneath it.
16.Optimize the image quality and set the Norpix gain as described in Basic Protocol 2, steps 18-22.
17.Start the Kepco power supply and click on the Record button in Streampix. The software will drive the magnetic tweezer automatically and carry out measurements at a set of frequencies between 0.1 and 135 Hz (0.1, 0.2, 0.5, 0.8, 1, 2, 4, 5, 8, 10, 20, 35, 55, 80, 95, 115, and 135 Hz). The movie taken at each frequency will be saved in a separate AVI file.
18.After finishing recording, shut down the Kepco power supply, move the file(s) with the readout from the Hall sensors into the same folder with the AVI files, and repeat steps 15-17 for additional cells as desired.
19.When finished with data acquisition, raise the tweezer tips and take out the sample dish.
20.Open the lid of the sample dish and rinse the MPAD array with 1 ml of PBS.
21.Add 1 ml of trypsin-EDTA preheated to 37°C into the dish and leave for 5 min to allow the cells to be removed from the microposts. Then pipette out the remaining solution inside the dish and refill with DI water at 37°C.
22.Put the lid back on to the sample dish.
23.Repeat steps 7 to 19 to measure all the fields of view where cells were measured.
24.Clean the customized dish with ethanol, then put it in the UV cabinet for 30 min.
Support Protocol 2: CONFIGURING STEAMPIX FOR MAGNETIC RHEOLOGY MEASUREMENTS
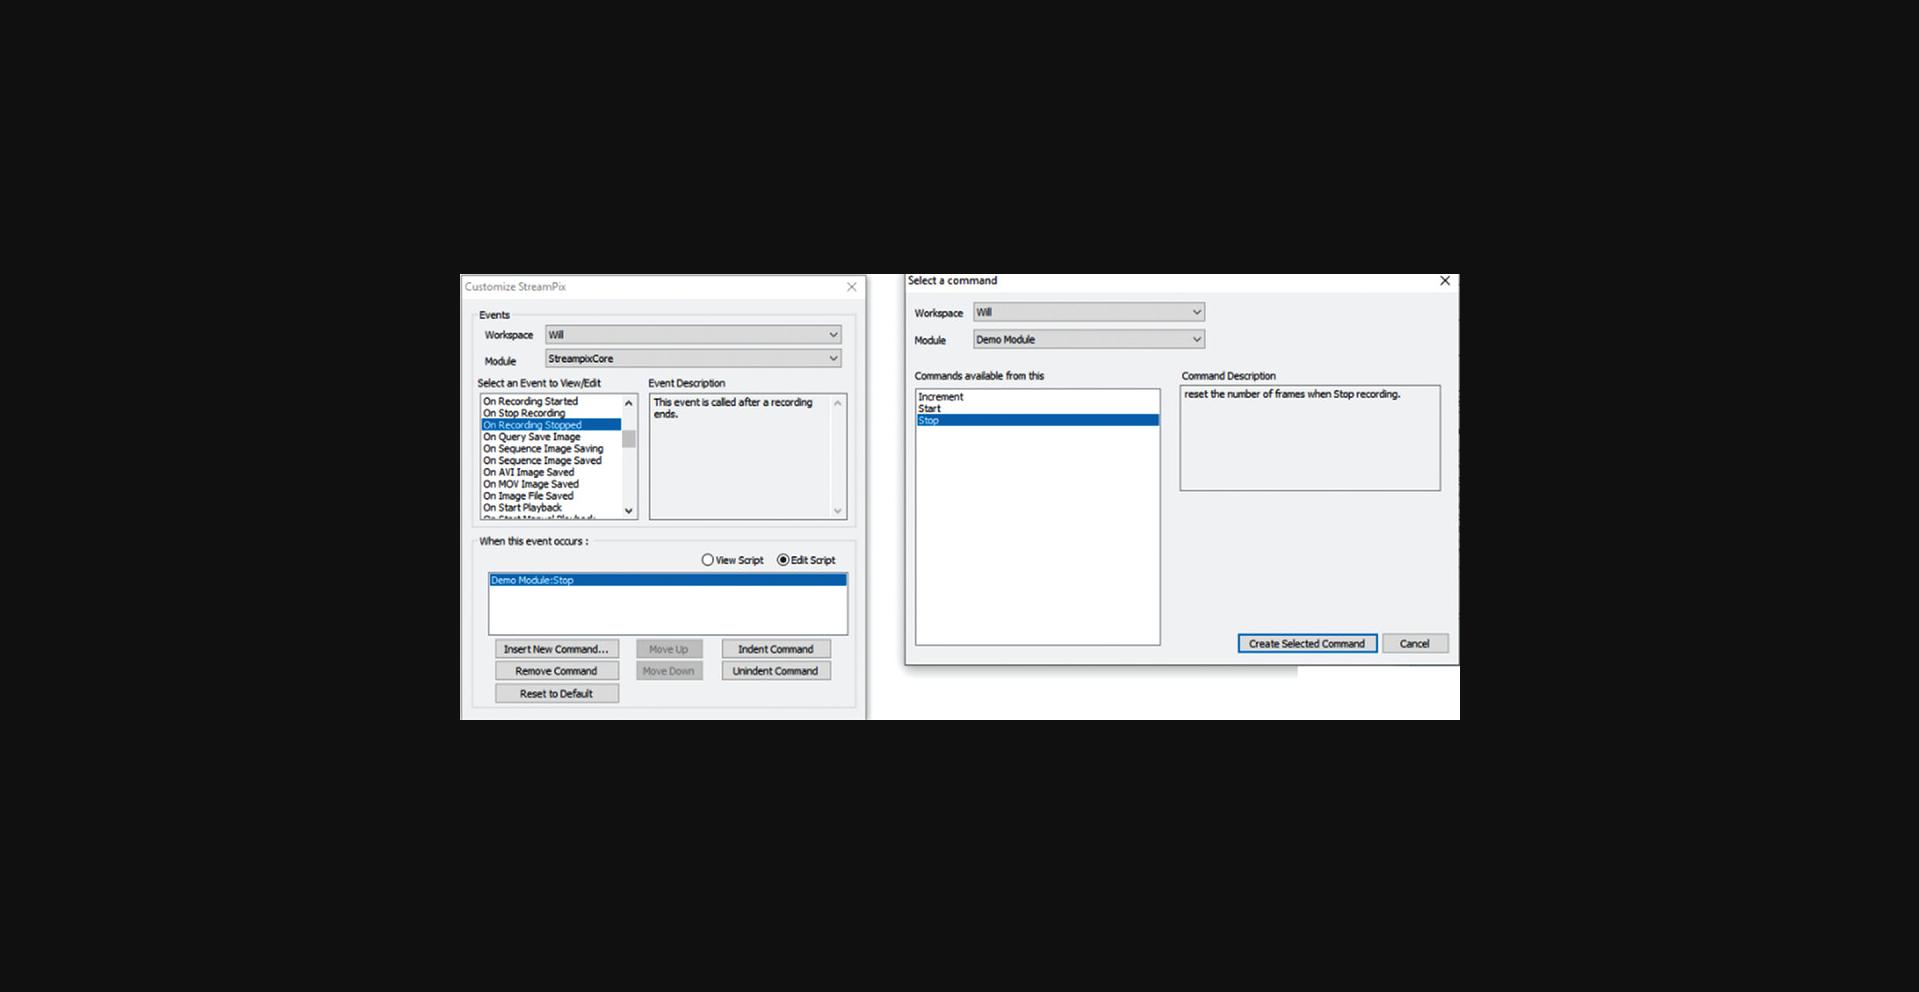
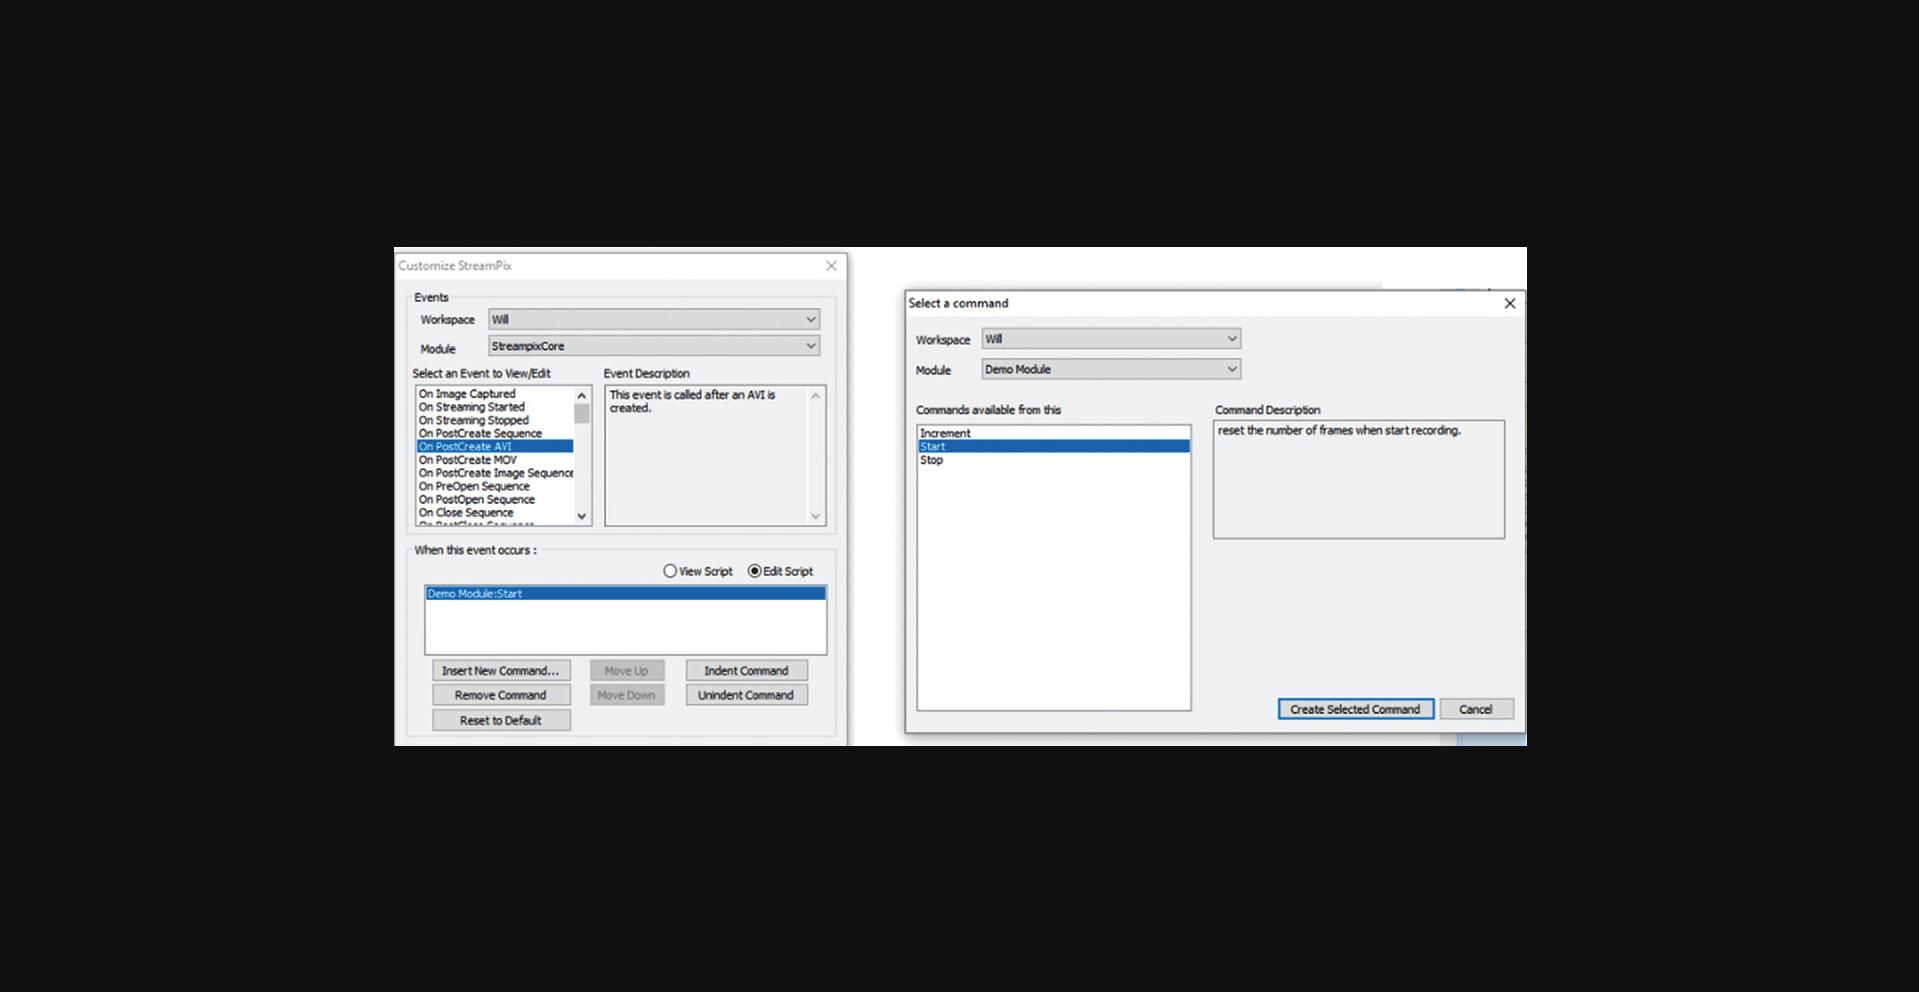
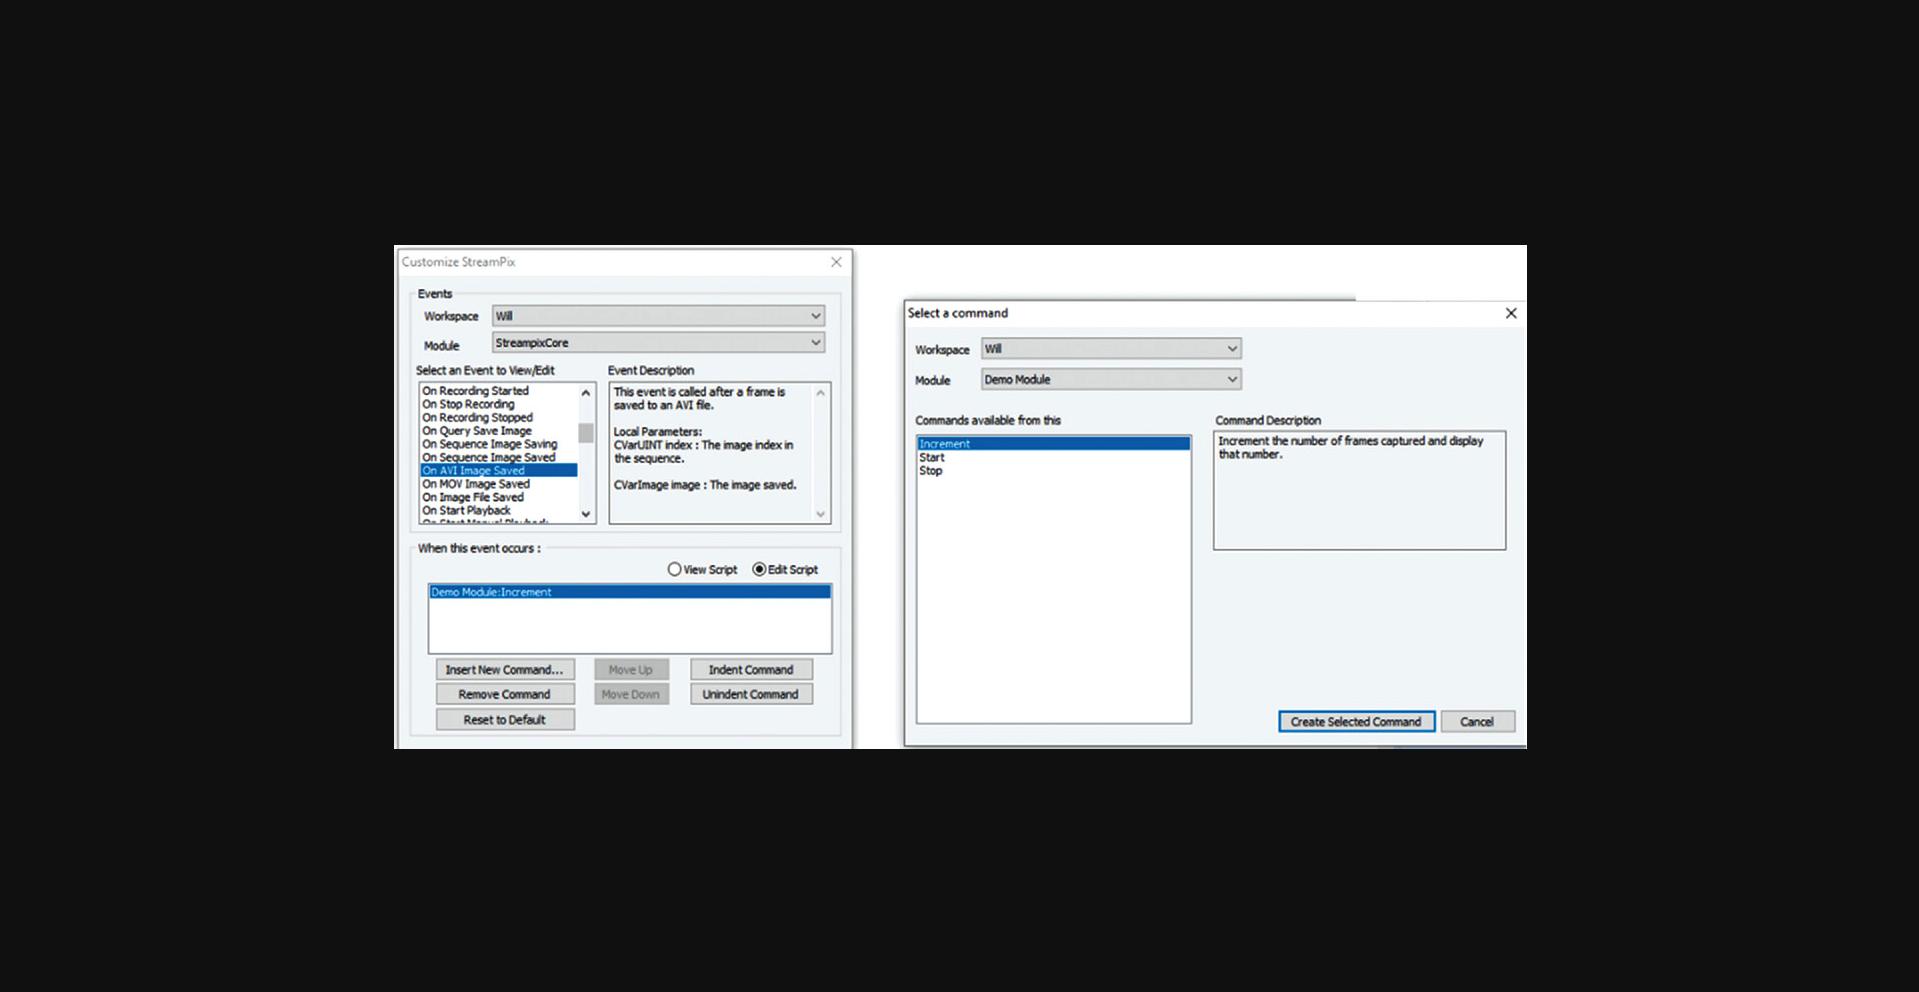
This support protocol describes the procedures for setting up Streampix to load modules that drive the dual magnetic tweezers with varying frequency magnetic fields, measure Hall voltages from the tweezers, and perform image acquisition simultaneously. It assumes one uses Streampix 5.16 to drive the camera on the microscope and that the user has access to our custom software modules. Once a video file is created, the driving module will run its “Start” command and generate a sinusoidal wave composed of a signal frequency ranging from 0.1 to 135 Hz and a reference frequency at 7 Hz in the output channel of a NI DAQ card. Then, whenever an image frame gets recorded, the module will run its “Increment command,” which will read the magnetic field from the Hall sensor. Finally, when the recording stops, the driving module will run its “Stop” command, which shuts down the NI card's input and output channels. These 3 steps continue iteratively until all frequencies to be measured are covered.
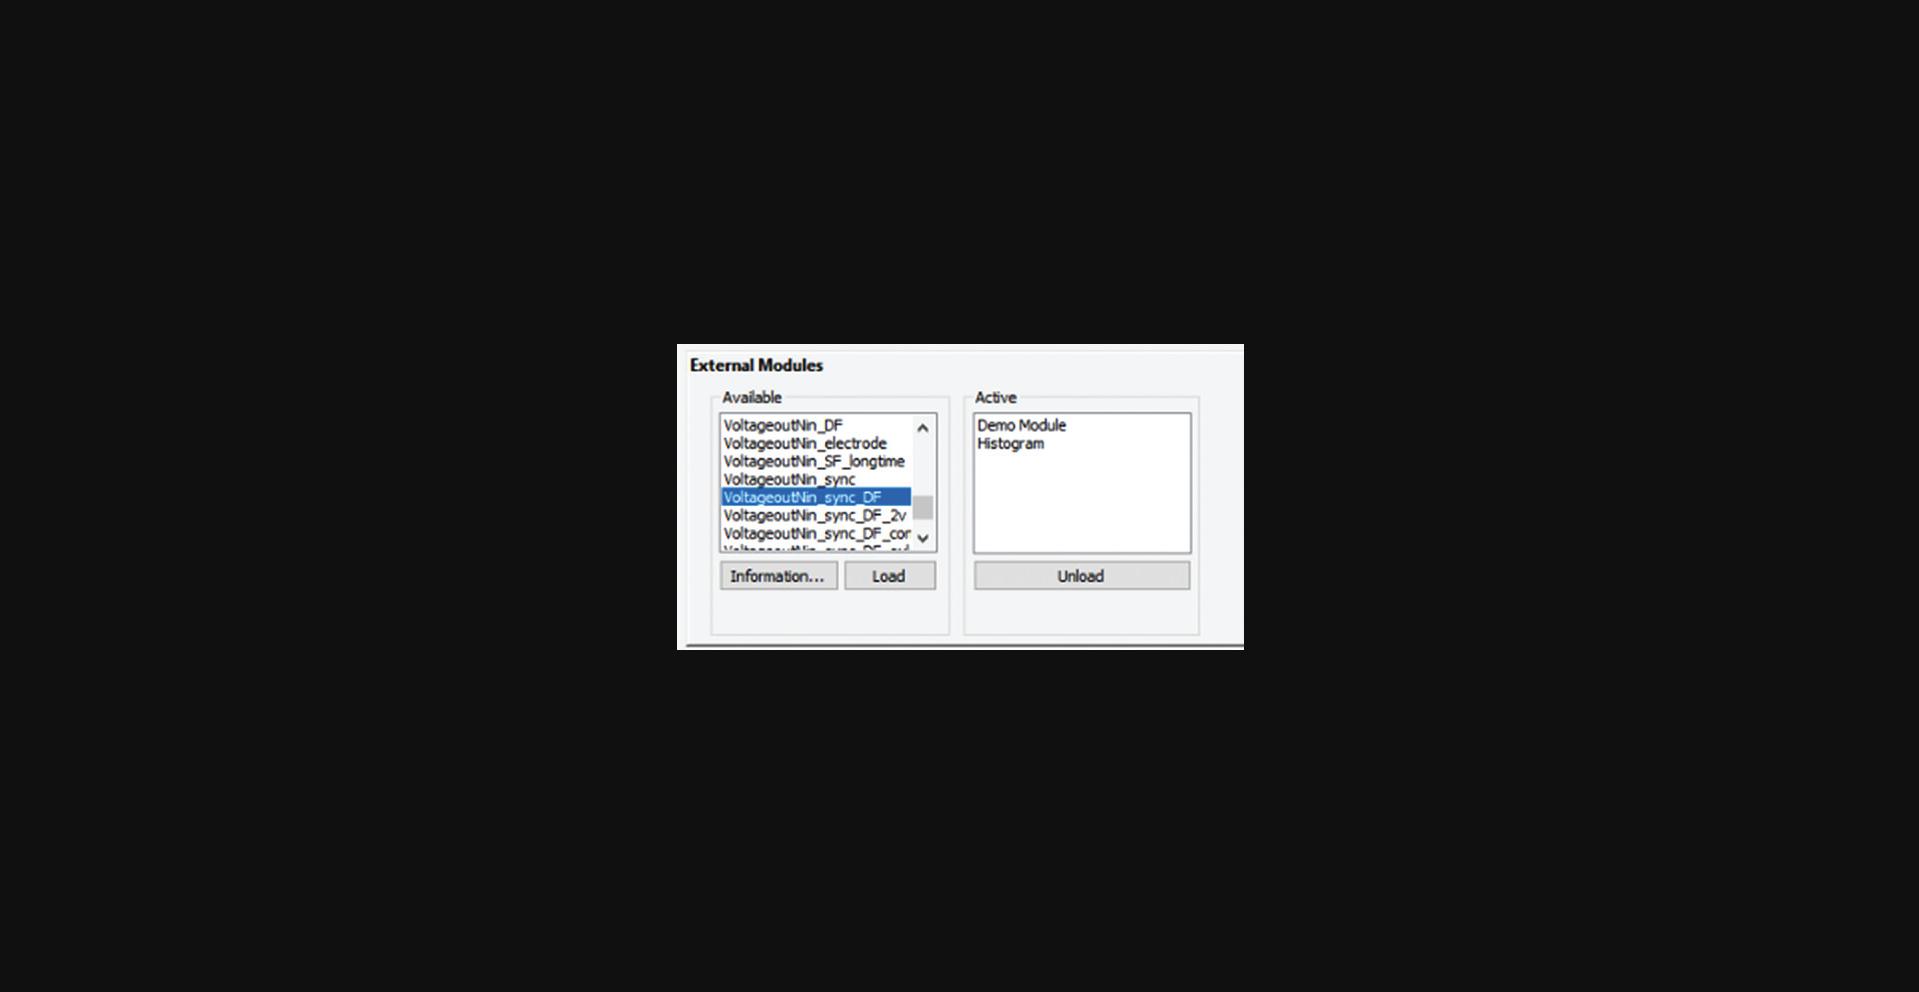
1.Open Streampix (the camera driving software), load the module “VoltageoutNin_sync_DF” (Fig. 8), then under the Tools panel in Streampix, click “reload saved script”.
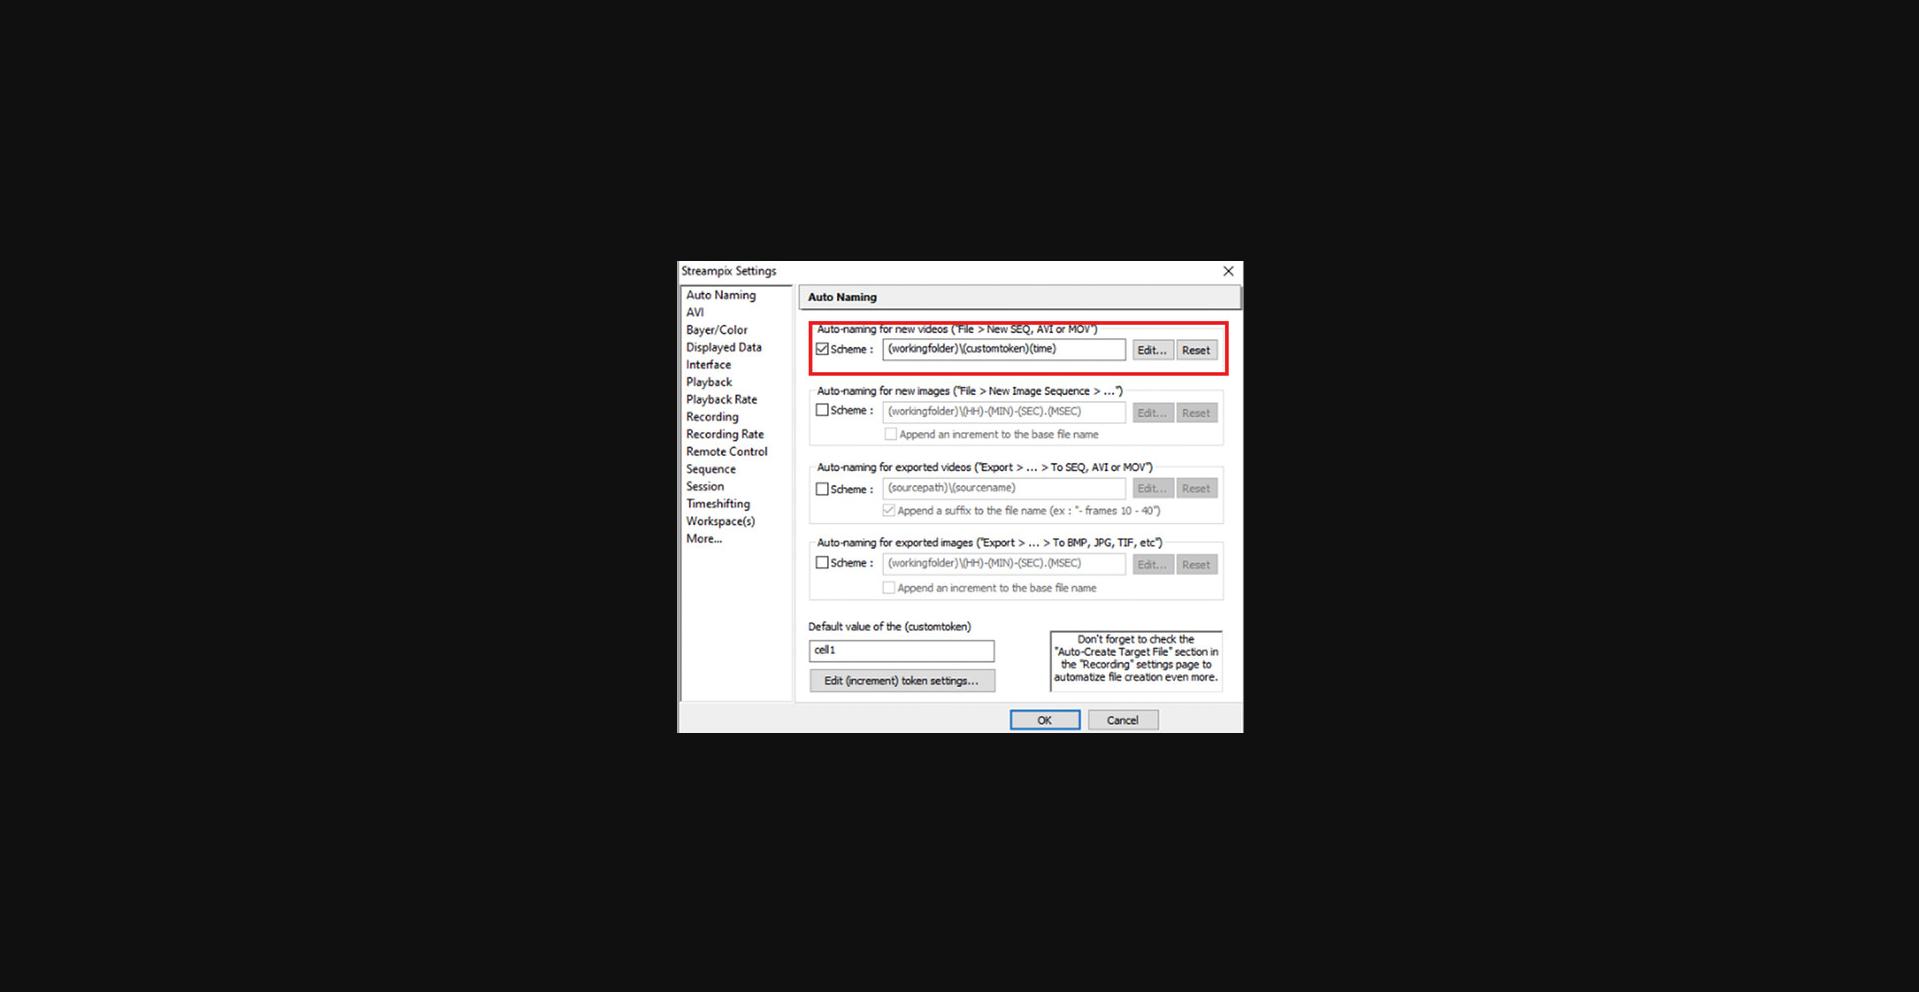
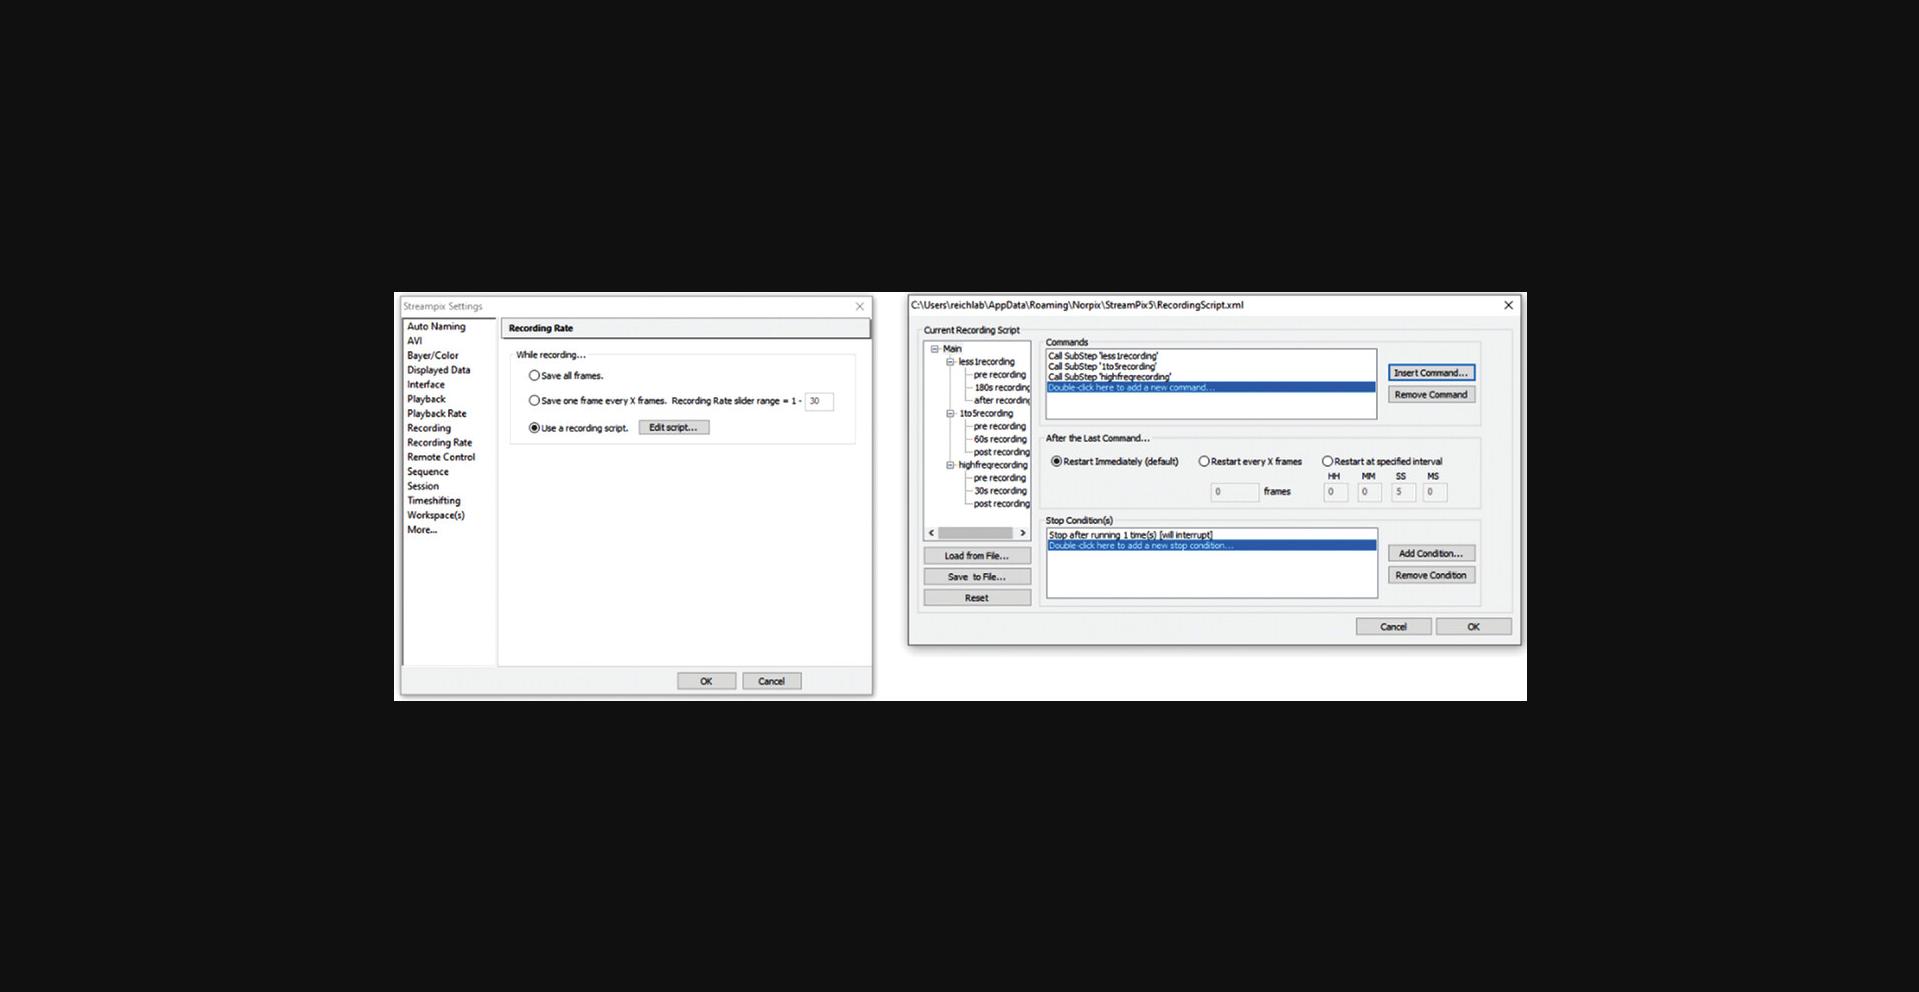
2.In Streampix Settings, in the Auto Naming panel, check “Auto naming new videos” (Fig. 12). Then under the Recording Rate panel, set it to “Use a recording script” (Fig. 13) and load the script “synchronizedscript”.
Basic Protocol 4: DATA REDUCTION: DETERMINING MICROPOSTS’ MOTION
The data acquisition of either non-magnetic or magnetic measurements results in videos of the microposts’ motion at up to 100 fps for each cell measured. This protocol describes a procedure to reduce these raw data to obtain the position of the center of each micropost in each video frame to allow the construction of position versus time traces for each post. This protocol uses a centroid-based particle tracking algorithm (Crocker & Grier, 1996) widely used in the microrheology literature. The custom version used, written in Igor Pro, takes advantage of the known underlying lattice of the posts. One begins by using a visual inspection of the first frame of the movie to define an initial mask that classifies the posts as either “cell posts” that are in contact with the cell, “background” posts that are not in contact with the cell, or “ignored” posts. The ignored posts are not analyzed and should include broken or bent posts and posts that may be under cells in the field of view other than the one to be analyzed. The distinction between cell posts and background posts is initially provisional and will be refined in subsequent stages of the analysis. Frame-to-frame drift is accounted for by measuring the average displacement in each frame relative to the first frame for all the background posts and subtracting this from each post's trajectory. To avoid including cell posts in the dedrifting calculation, it is thus better to err initially on the side of classifying posts near the cell as cell posts rather than as background. The undeflected positions of the cell posts are then determined by interpolation based on the positions of the background posts in corresponding rows and columns of the post lattice. The undeflected positions are subtracted from the raw positions to yield the posts’ deflections versus time for subsequent analysis. Note that long movies at high frame rates can be time-consuming to process.
Materials
- PC or Macintosh computer (e.g., Dell Precision Tower 5810)
- Igor Pro Software (Wavemetrics, Inc, version 8 or higher)
- Custom Igor Procedure Files (See Internet Resources)
1.Launch Igor Pro, load the procedure file Centroid_Fit_Main_V11.ipf, and compile it.
2.Run the function GfitGridAllM() from the Igor Pro command line to open the main graphical user interface (GUI) (Fig. 14)
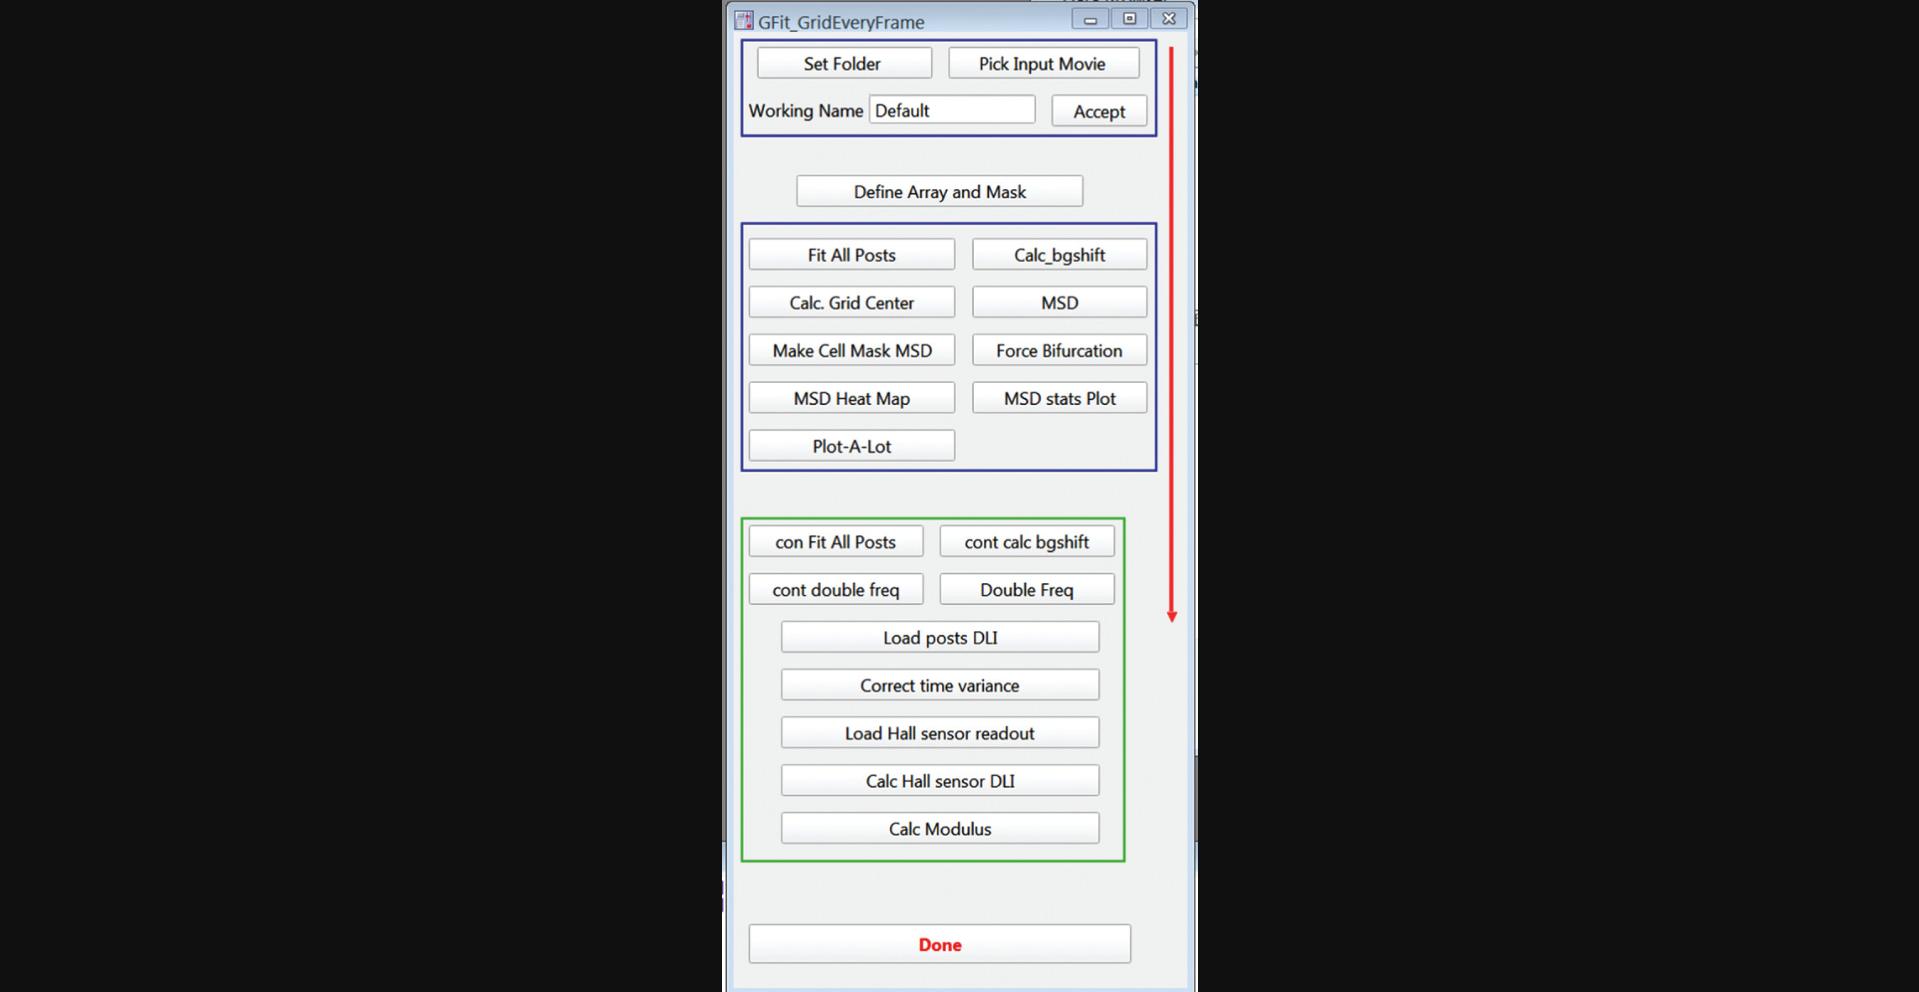
3.Click the “Set Folder” button and choose the folder where the data video file to be analyzed is stored.
4.Click “Pick Input Movie” and load the video file to be analyzed. You may have to set the Data Files file type to “all files.”
5.In the “Working Name” field, enter a new folder name. This will create a folder with the name you enter, and results from all following analyses will be stored there. Click Accept.
6.Click the “Define Array and Mask” button to open the GUI (Fig. 15) for defining the set of microposts to be analyzed and setting up the initial mask classifying the posts as cell-associated, background, or ignored for subsequent analysis.
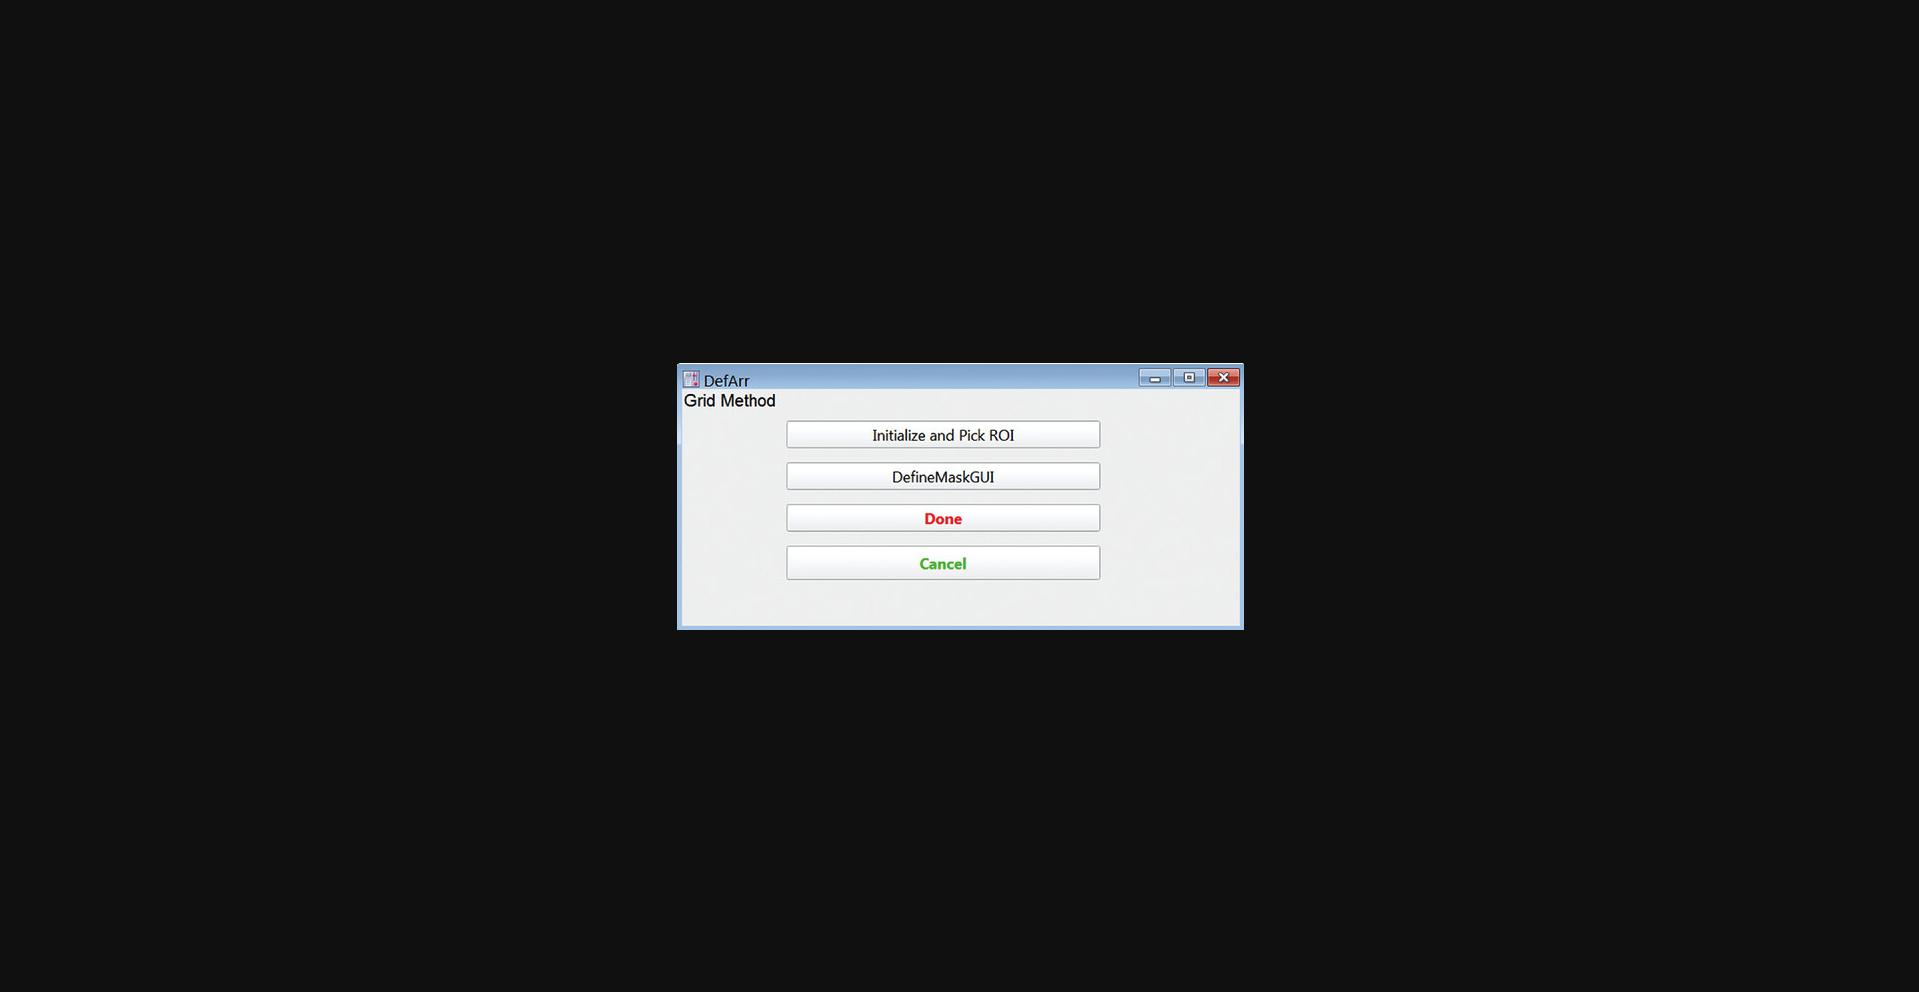
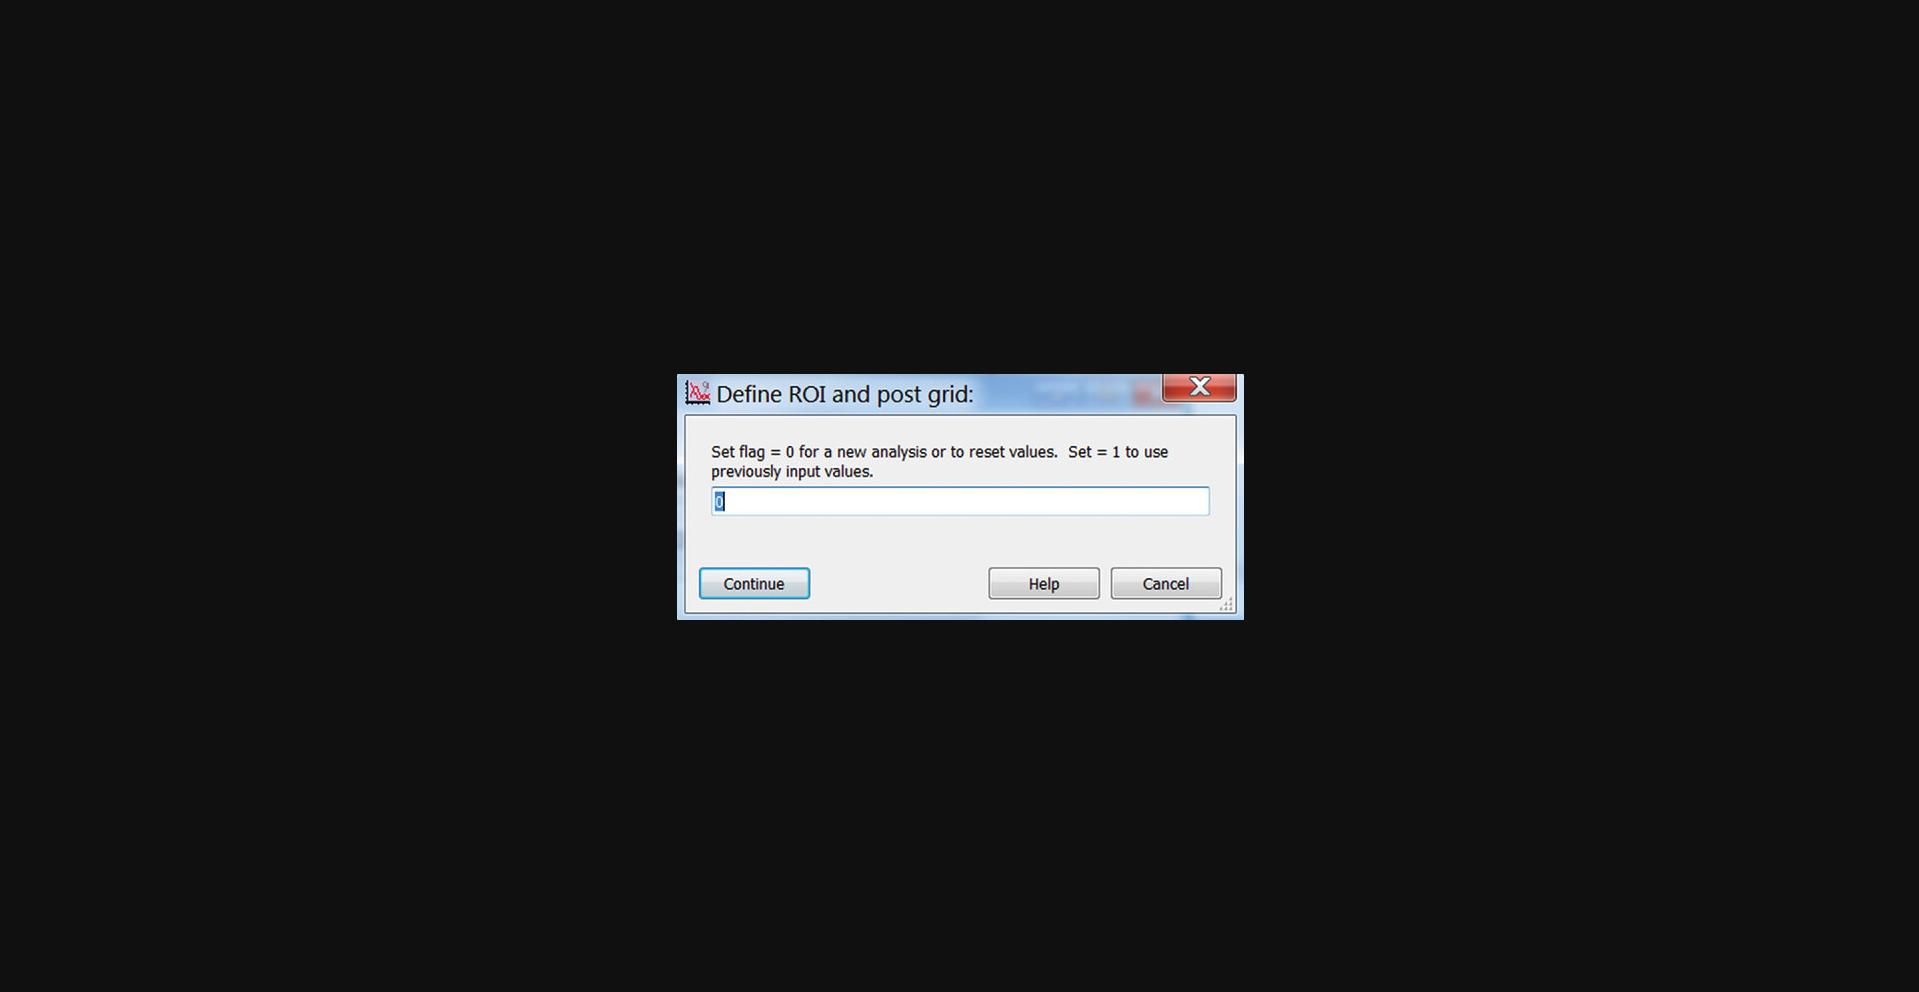
7.Click Initialize, Pick ROI, and enter “0” in the pop-up panel (Fig. 16) to start a new analysis. Click Continue.
8.The Input Parameters GUI (Fig. 17A) and an image of the movie's first frame should now be open. Rotate the image (positive for clockwise) so that the horizontal axis of the hexagonal grid of posts aligns with the horizontal axis of the image frame by entering an angle in the “Angle (degrees)” box and clicking Rotate to carry out the rotation.
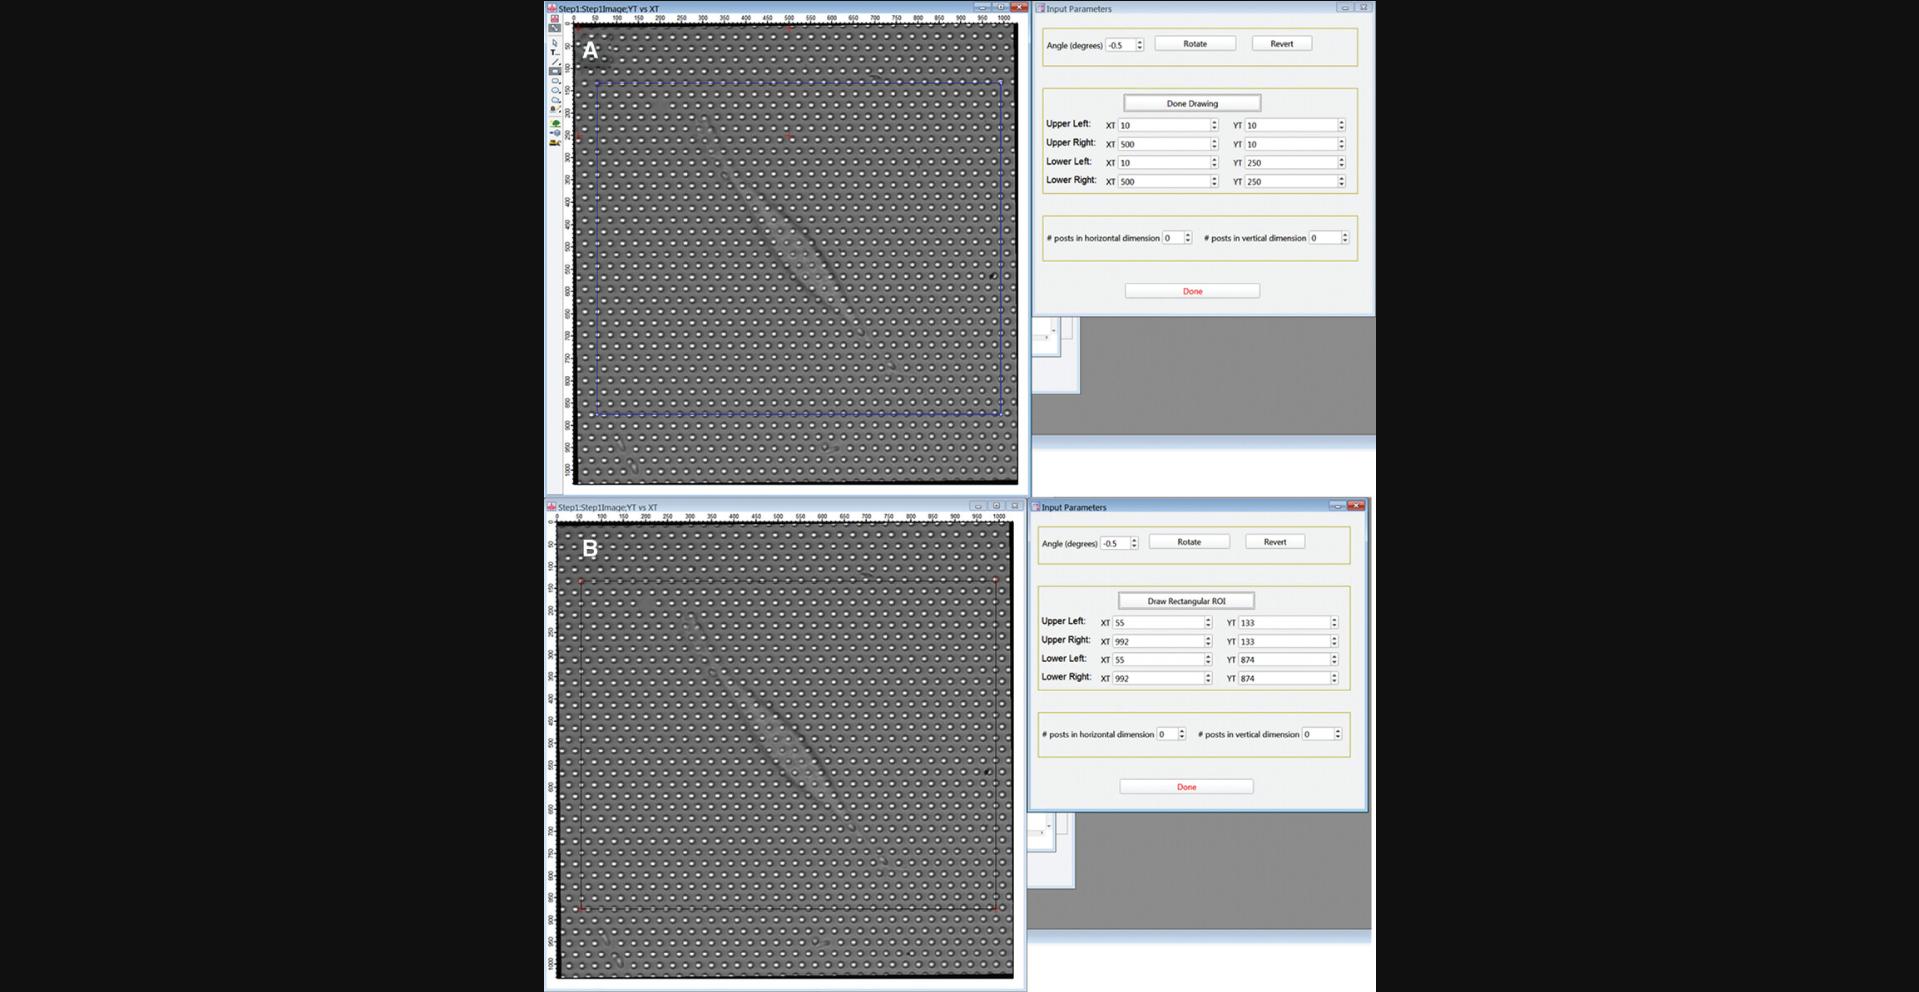
9.Define the region of interest (ROI) around the target cell to be analyzed. This is a two-step process. First, draw a rectangle to roughly define your ROI. Click Draw Rectangular ROI. Click Draw Mode in the upper left of the image frame, select the Rectangle tool and draw a rectangle to define the ROI containing the cell you wish to analyze. Center the upper left corner of this rectangle on a micropost.
10.Click Done Drawing in the GUI. The positions of the corners of the rectangle you drew should appear in the boxes labeled XT and YT, and the red crosses in the image will move to the corners of the rectangle in the image (Fig. 17B).
11.Adjust the positions of the red crosses using the up- and down-arrows by the x- and y-position values in the GUI to center them on posts. All the crosses should end up within 2 pixels of a post center. First, if necessary, adjust the upper left red cross.
12.Next, adjust the position of the upper right red cross to center it on a post in the same row as the upper left cross. Count the number of posts between the two upper crosses, including the posts under both crosses, and enter this number in the “# posts in horizontal dimension” box.
13.Now position the lower-left cross. Count from row to row down the image from the upper left cross following a zig-zag path like the one shown in green in Figure 18.Enter the number of rows in the “# posts in vertical dimension” box. Again, include both the starting and ending rows in your count.
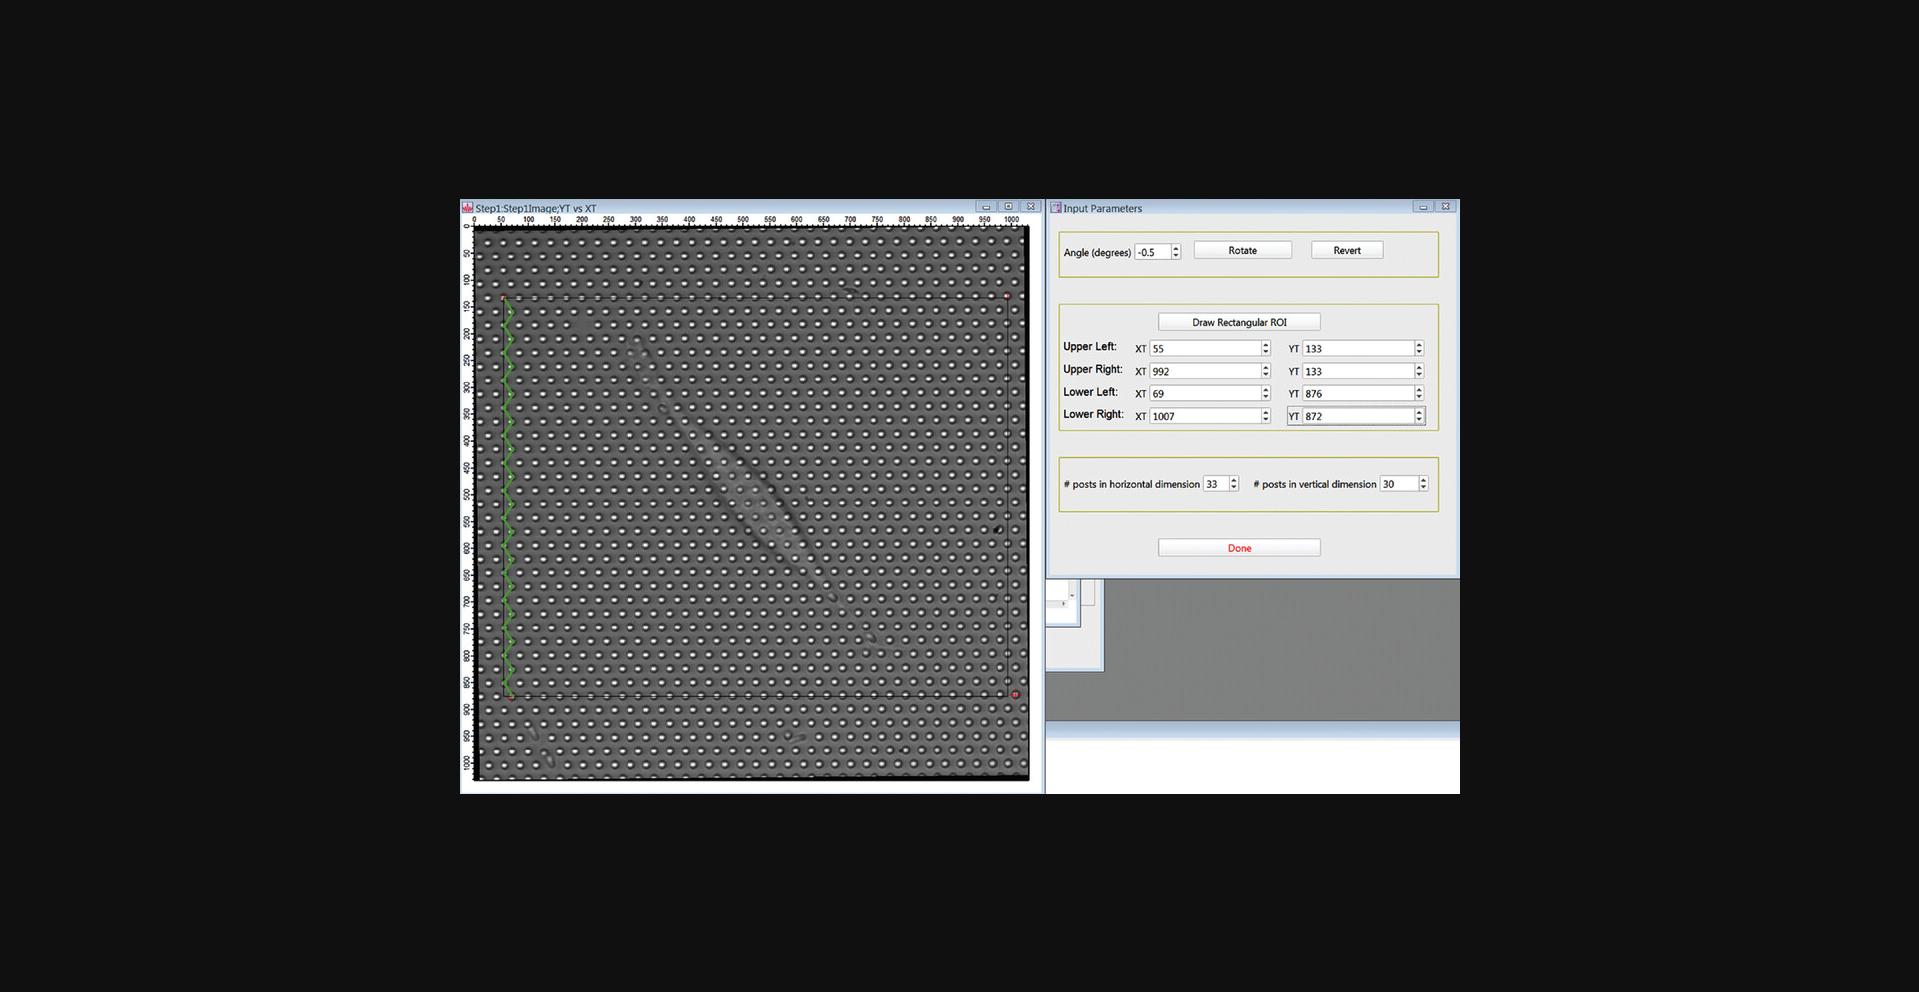
14.Finally, position the lower-right cross. This can be done either by counting horizontally from the lower-left cross or vertically from the upper-right cross.
15.Press Done when finished.
16.Click the “DefineMaskGUI” button to open the SetMaskPanel GUI for defining post types. Enter 0 in the popup window (not shown) to use the first frame in the movie to set the mask.
17.Click Continue. In the first frame image, a red cross should appear over each post in your RO (Fig. 19). This is the default identifier for a background post. The locations of these crosses will be used as the initial guesses for the positions of the centroids of the posts when fitting the first frame. If the crosses are not well reasonably lined up with the posts, you will have to go back to Step 6 and re-define the ROI and numbers of posts.
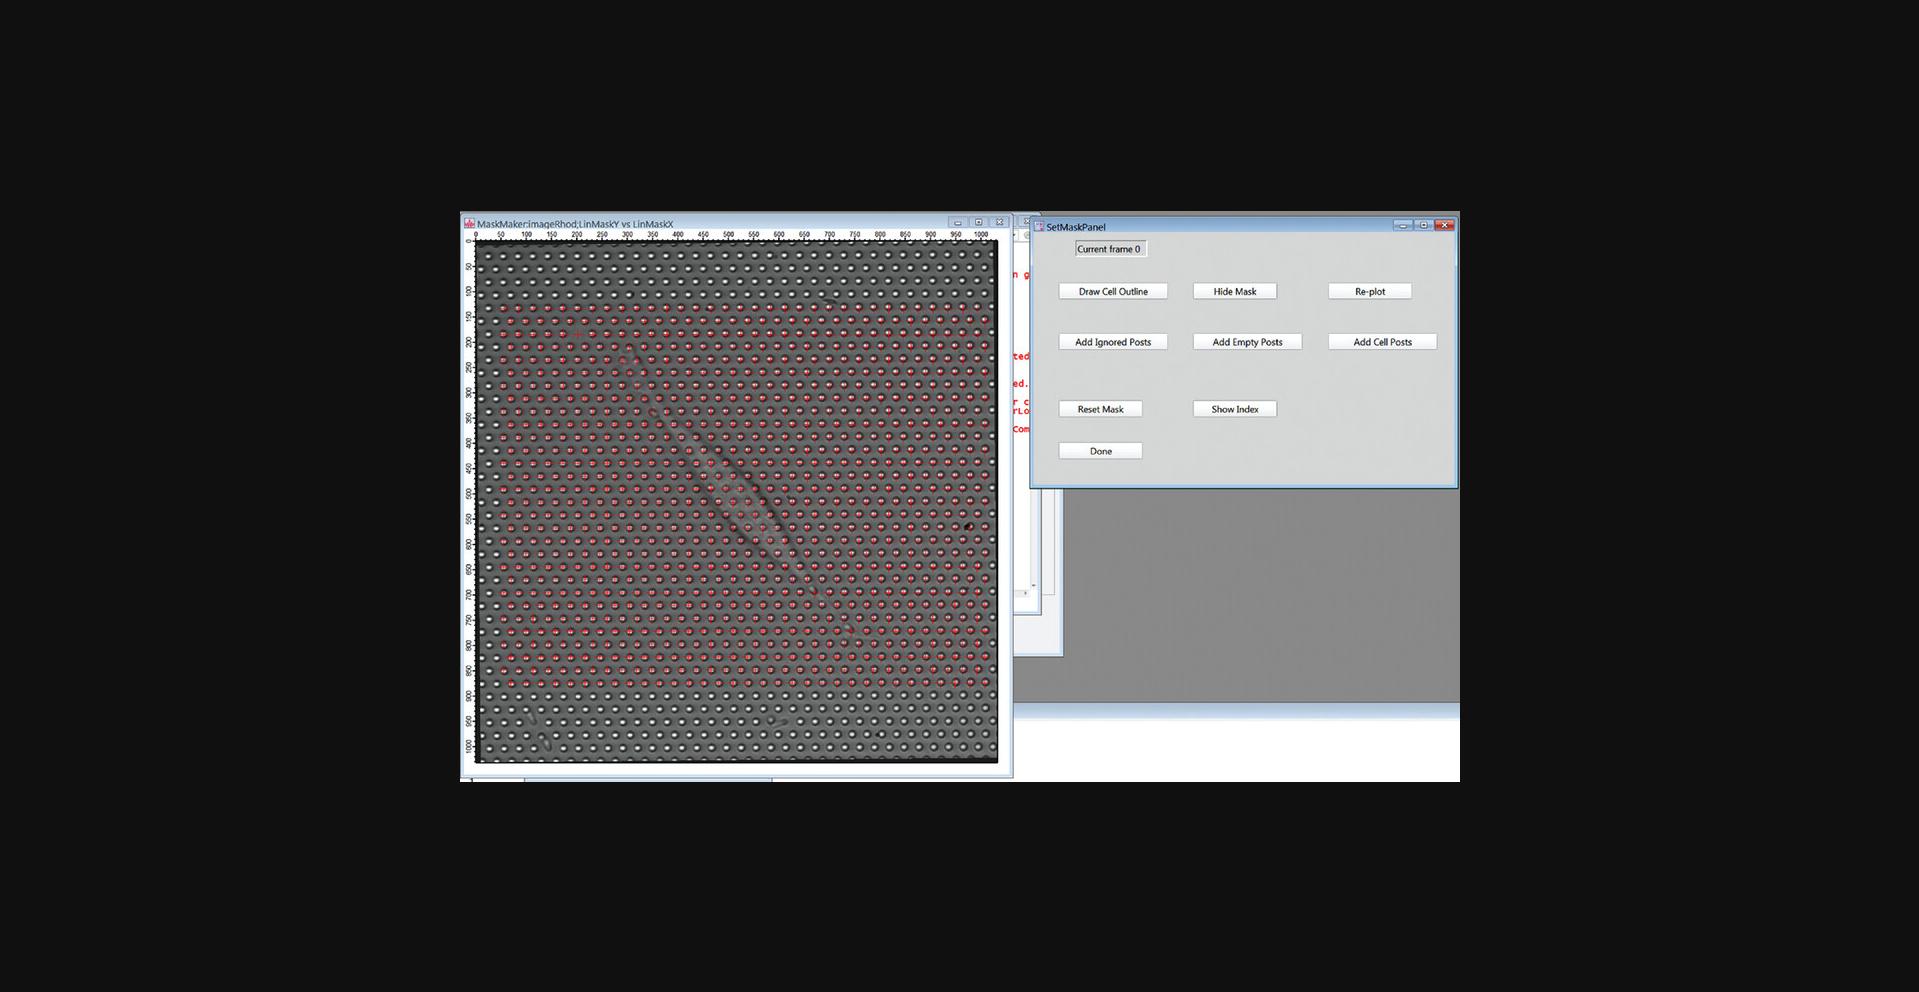
18.Identify the cell-associated posts (“cell posts”) by clicking the “Draw Cell Outline” button. Click on the Draw Mode button in the upper left of the image frame, select the Polygon tool and draw a polygon enclosing the cell (Fig. 20). When finished, click the “Done Drawing” button, and then in the pop-up window, enter 1 to identify all posts inside the polygon as cell posts. Click Continue.
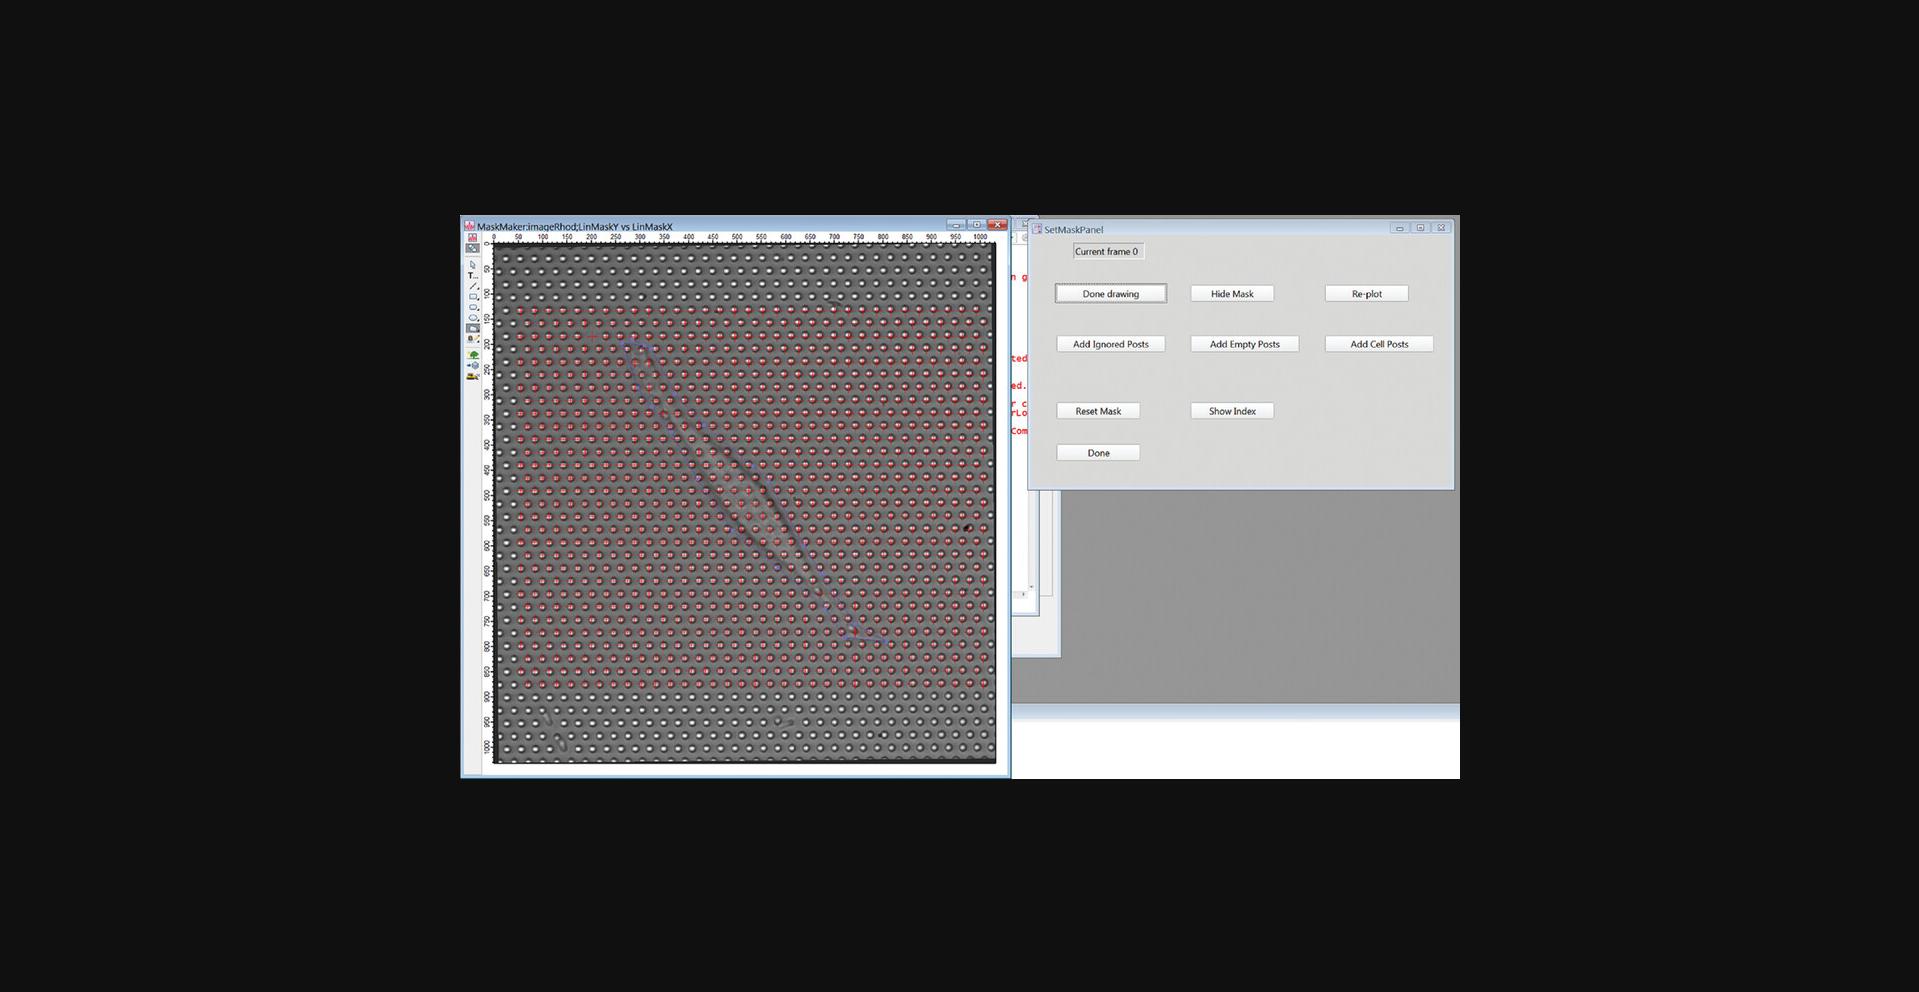
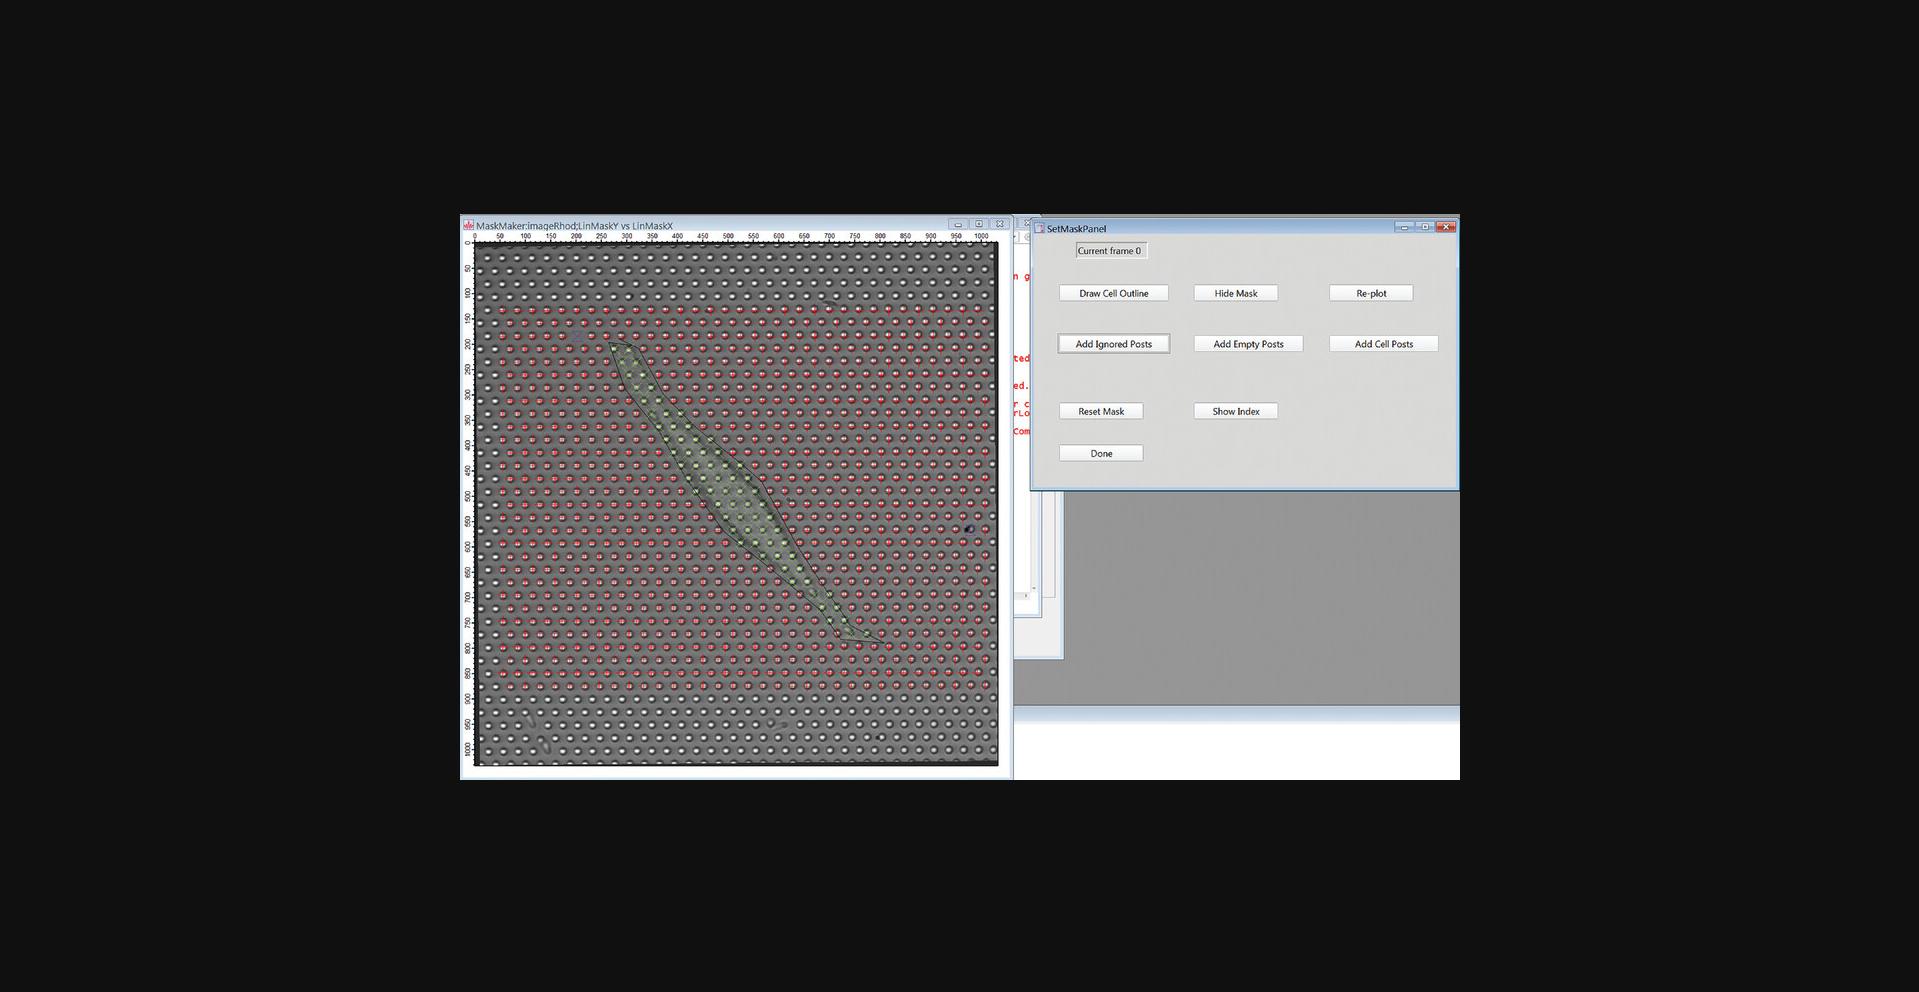
19.Click “Add Ignored Posts”, then click on any posts in the image frame that you do not want to analyze. This should include any posts that are missing or collapsed, plus any posts that are under cells other than the cell to be analyzed. When finished, click on the “Done Adding” button.
20.Adjust the mask further as needed using the “Add Cell Posts”, “Add Empty Posts”, and “Add Ignored Posts” buttons, followed by clicking on the image frame to change posts to cell, background (empty), and ignored respectively. Click “Done Adding” after working with each post type.
21.Click “Done” in the “SetMaskPanel” GUI (Fig. 21) and in the “DefArr” GUI (Fig. 15) to finish defining the mask.
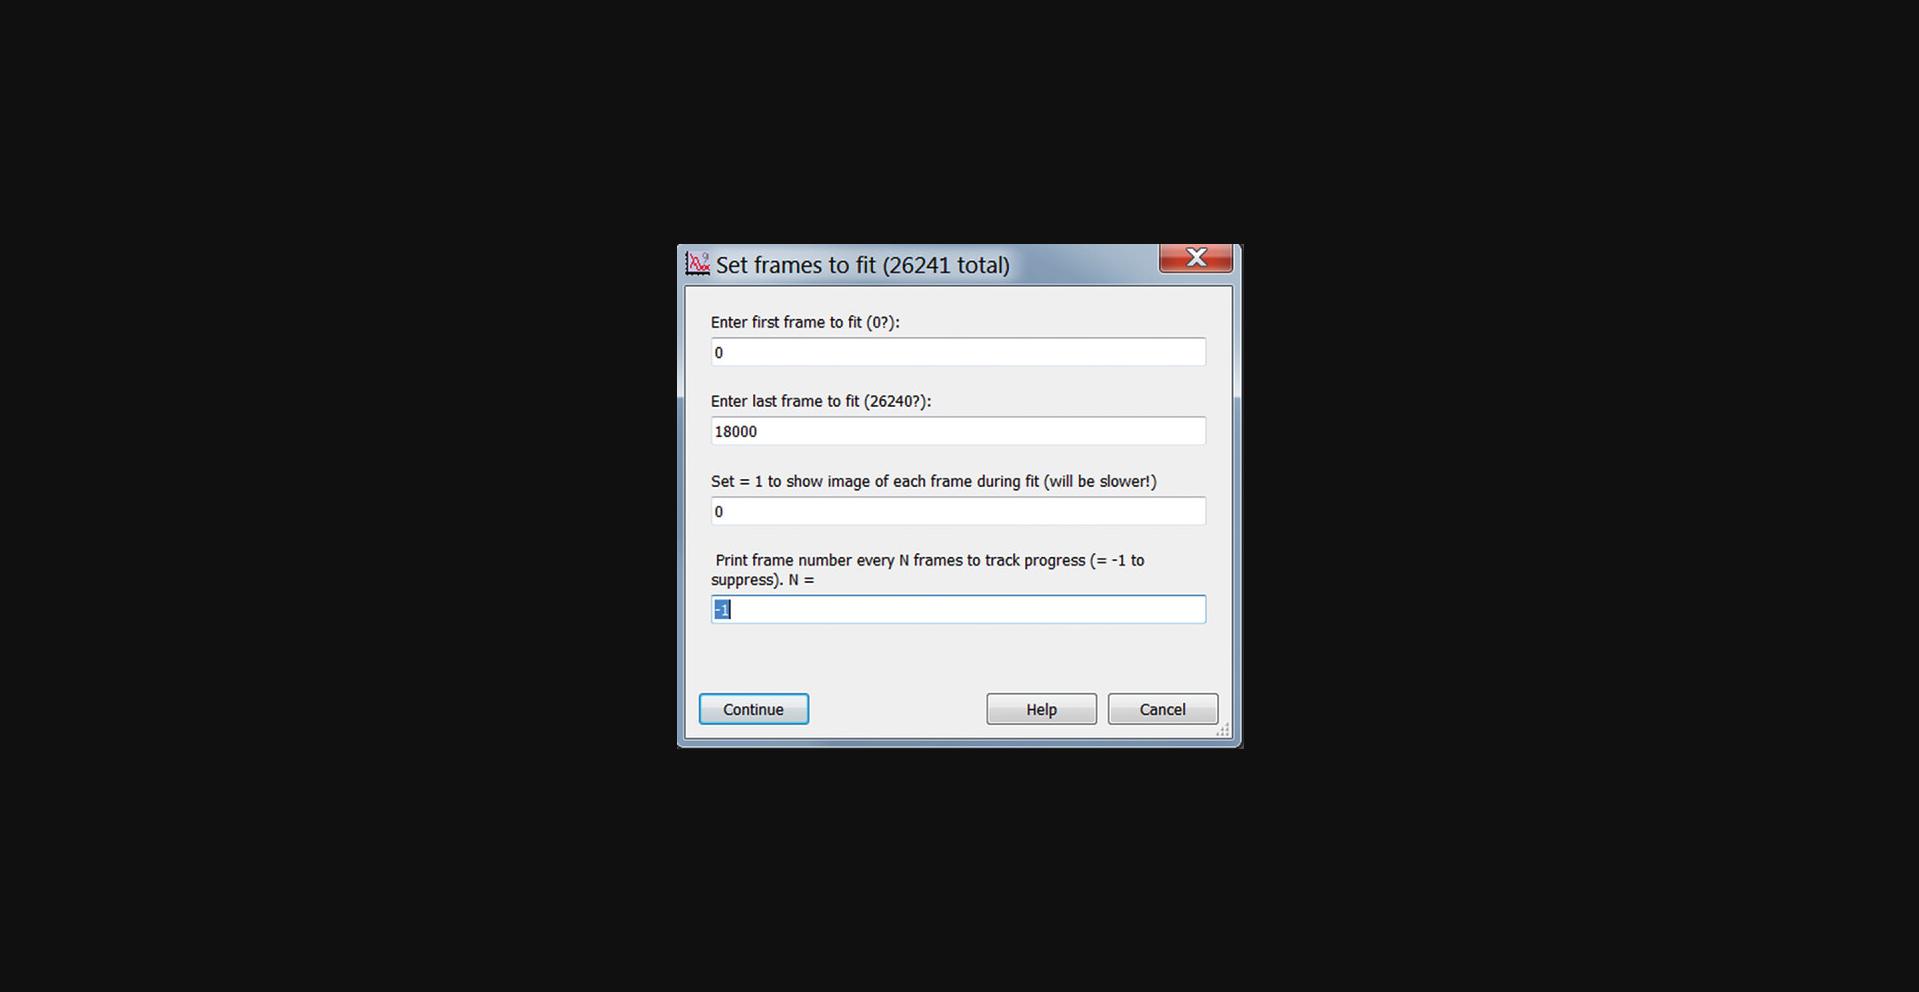
22.Click “Fit All Posts” in the main GUI (Fig. 14) to start centroid fitting of all the posts’ trajectories. In the pop-up window, enter the number of the first and last frames to be analyzed (Fig. 22). You can choose whether to have an image of each frame shown as it is analyzed. (Use this for diagnostic purposes only, as this will be slower). You can also have the current frame number printed periodically to track progress as the analysis runs. The fit post centers will be stored in units of pixels in the 3D wave FitRes_XXX, where “XXX” is the string entered in the Working Name field. The Layer dimension is the frame number.
23.Click the “Calc_bgshift” button in the main GUI (Fig. 14) to correct for frame-to-frame background drift. For the initial analysis, choose “manual” in the pop-up window.
24.Click the “Calc Grid Center” button in the main GUI (Fig. 14) to calculate the undeflected positions of the posts. In the pop-up window, enter the same number of frames analyzed in Fit All Posts in step 22.
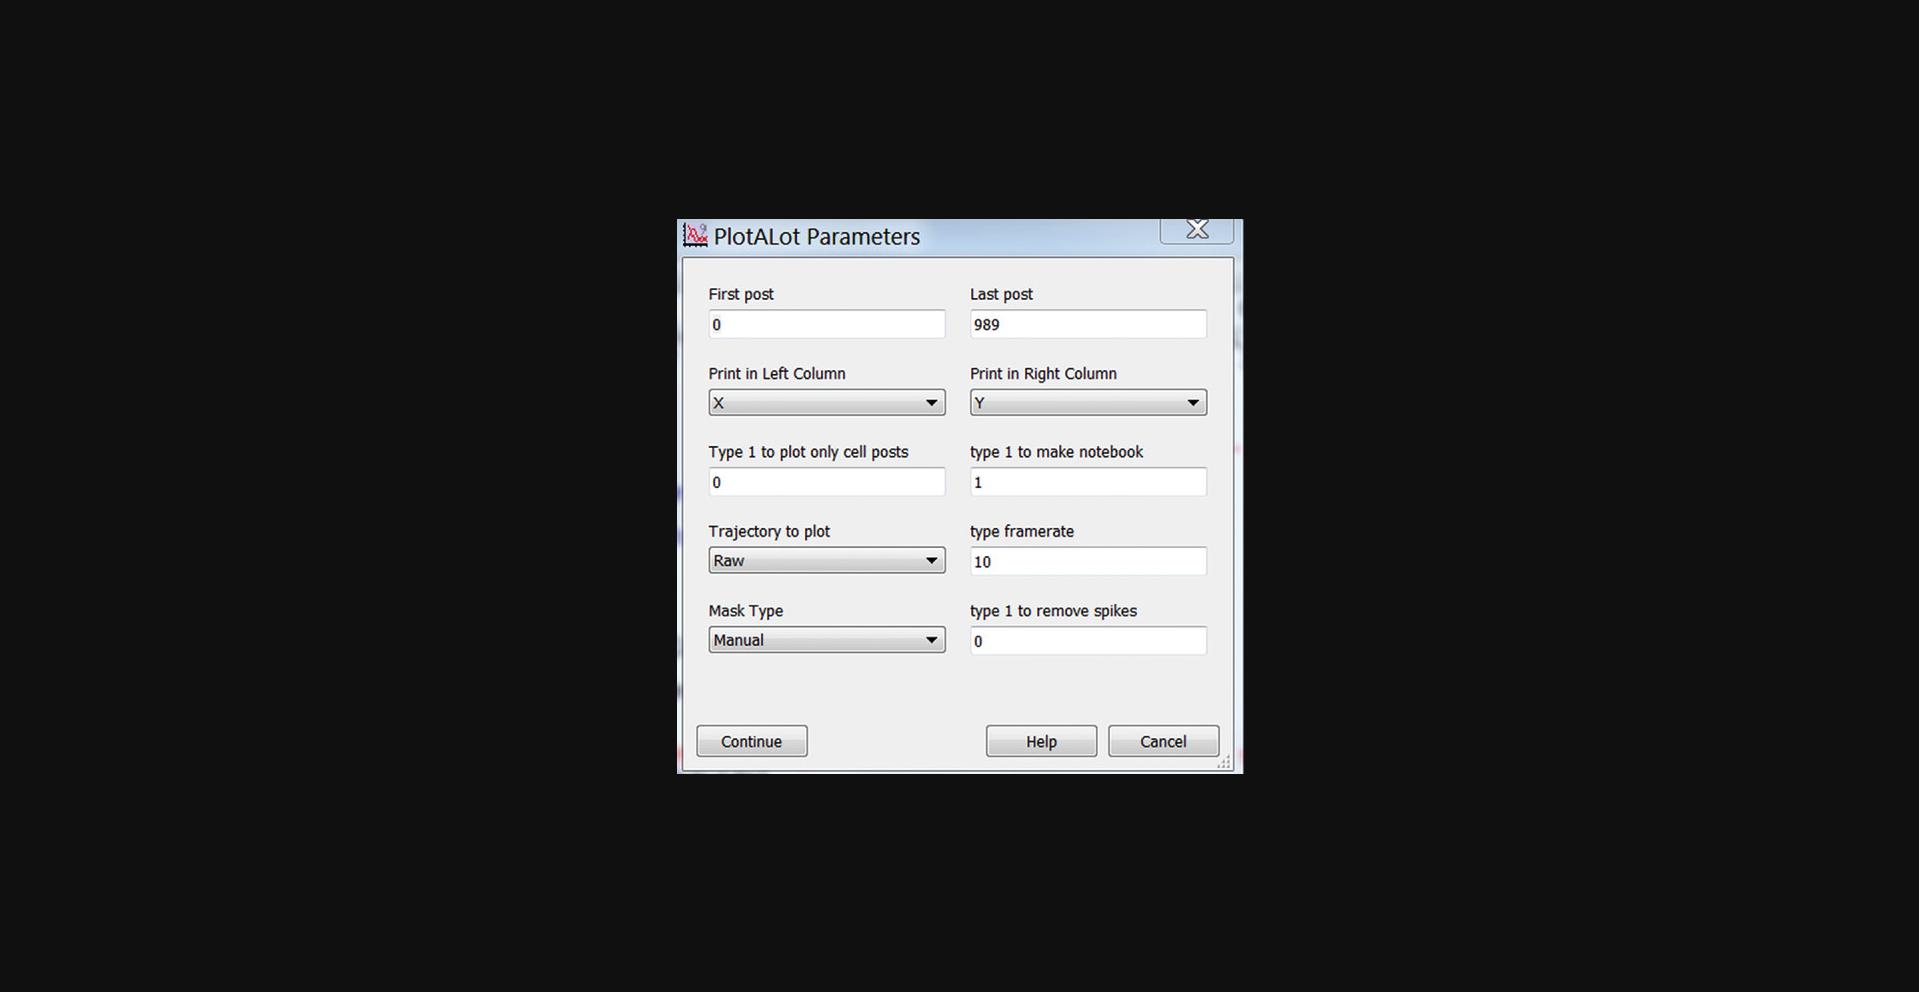
25.As desired, use the “Plot-A-Lot” button to view the trajectories of the posts. The popup window for this function is shown in Figure 23.You must use Manual in the Mask Type dropdown menu at this stage of the analysis.
Basic Protocol 5: DATA ANALYSIS: DETERMINING LOCAL RHEOLOGY FROM MAGNETIC MICROPOSTS
This protocol extracts the frequency dependence of the cellular rheology from the motion of the magnetic microposts in response to AC magnetic fields. The centroid-based particle tracking algorithm (Crocker & Grier, 1996) used in Basic Protocol 4 is used again, but the software is modified to handle the sequence of recordings at different magnetic field frequencies generated in Basic Protocol 3.Then digital lock-in analysis is applied to extract the response of each post at the (variable) drive frequency f and the reference frequency fR. Magnetic posts are identified by their large response compared to non-magnetic background posts. To account for time-dependence in the amplitude of the response at the drive frequency, the signals are broken up into 10 s intervals, and the average of the ratios of the displacements x(f)/x(fR) are computed (see Commentary). The driving force is deduced from the magnitude of the magnetic fields and used to calculate the modulus k(ω). As this is the combined response of the cell plus the post itself, k(ω) is also computed for data obtained after removing the cells (see Basic Protocol 3), and then the two results are subtracted to obtain k(ω) for the cell alone.
Materials
- PC or Macintosh computer (e.g., Dell Precision Tower 5810).
- Igor Pro Software (Wavemetrics, version 8 or higher)
- Custom Igor Procedure Files (See Internet Resources)
1.Follow steps 1 to 21 in Basic Protocol 4 to define the analysis ROI, post types, and initial guesses for the post positions.
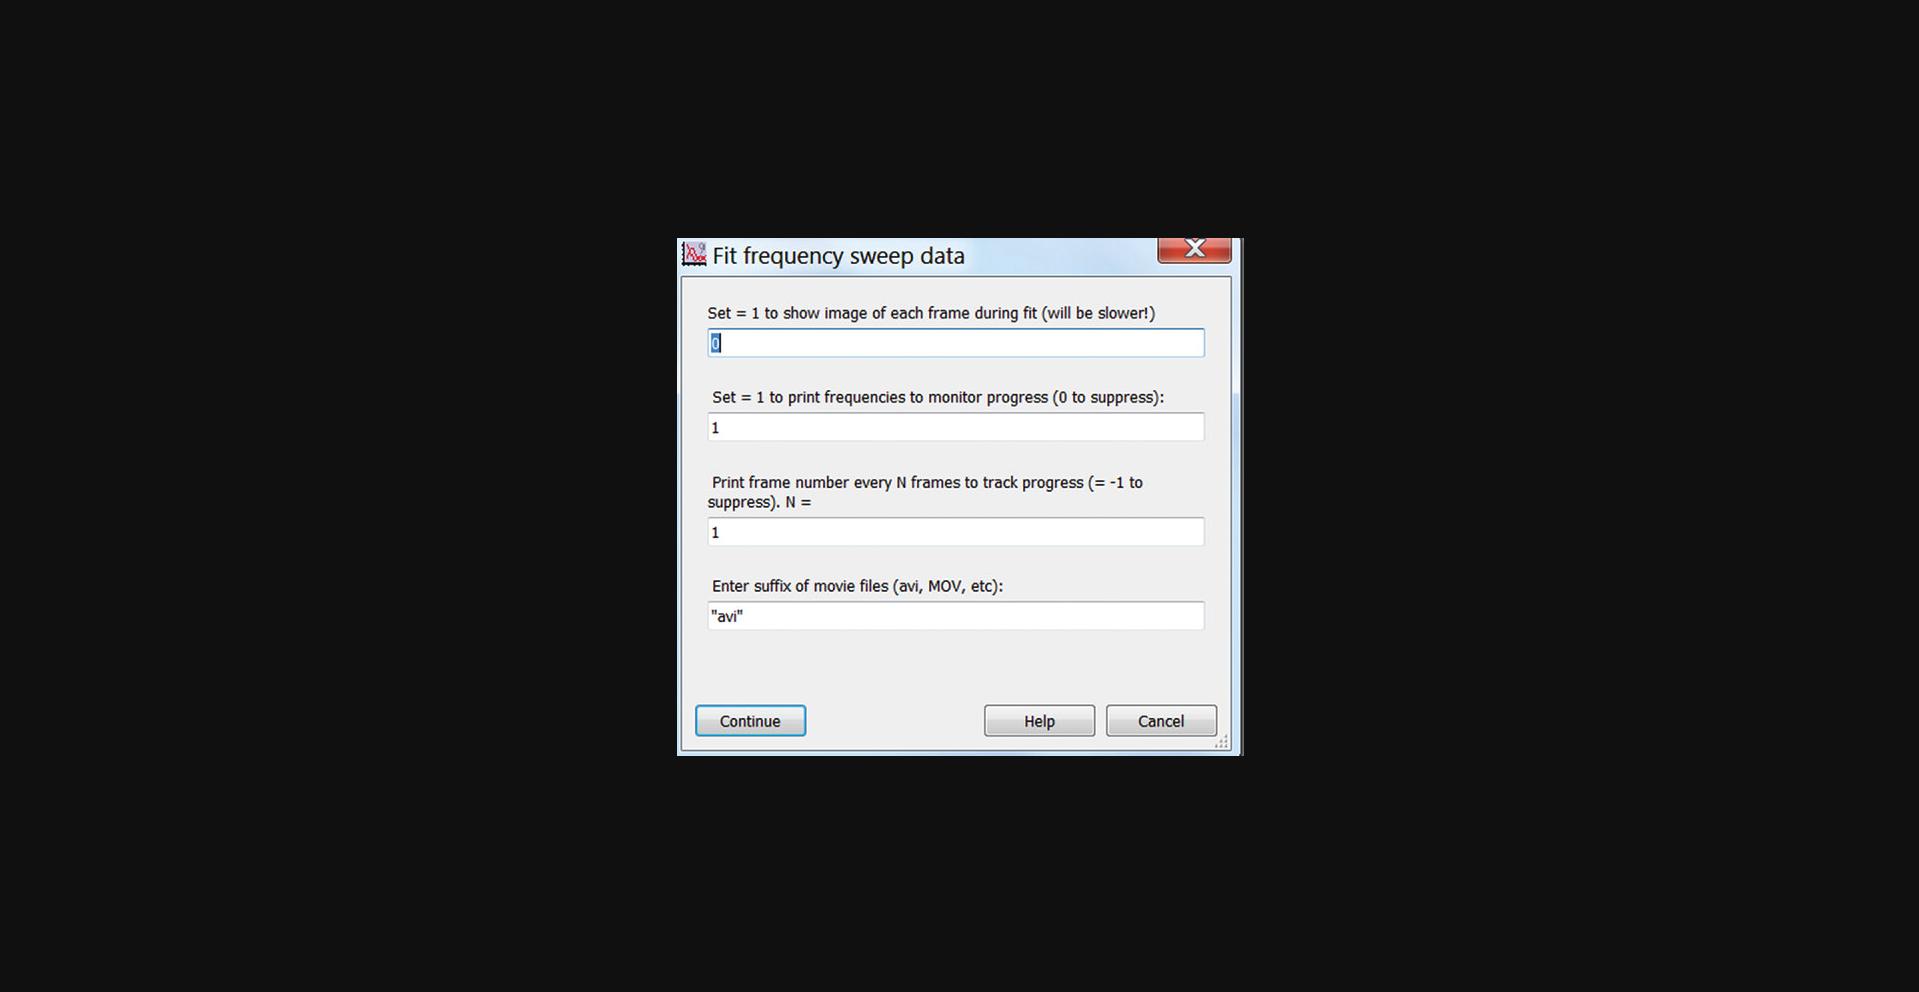
2.Click “con fitAllPosts” to track the trajectories of all microposts at each of the 17 frequencies measured in Protocol 3 (Fig. 24). As in Basic Protocol 4, you can choose whether to have an image of each frame shown as it is analyzed in the pop-up window; however, this will be slow, so use this for diagnostic purposes only. You can also choose to have the measuring frequency and current frame number printed periodically to track progress as the analysis runs. The fit post centers will be stored in units of pixels in the 3D wave FitRes_XXX_Nhz, where “XXX” is the string entered in the Working Name field and “N” is the frequency. The Layer dimension is the frame number.
3.Click “cont calc bgshift” to perform the background drift correction.
4.Click “cont double frequency” to perform the digital lock-in (DLI) calculation.
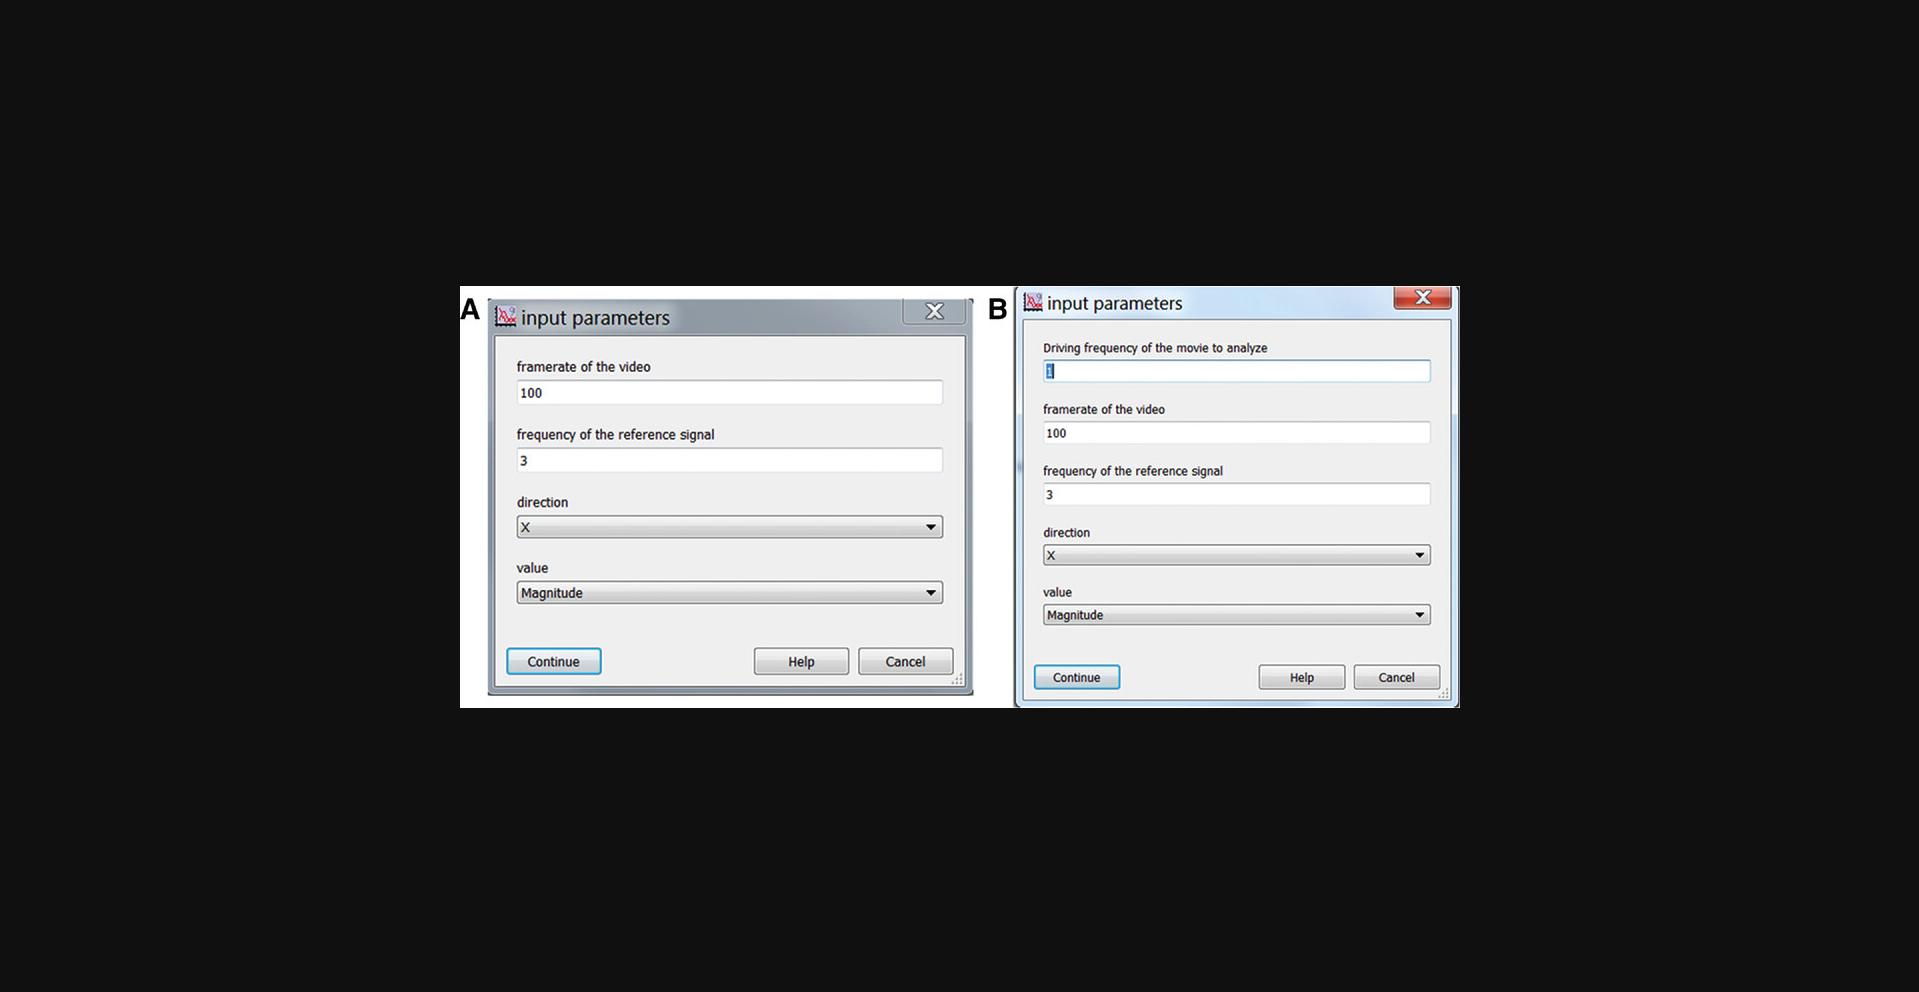
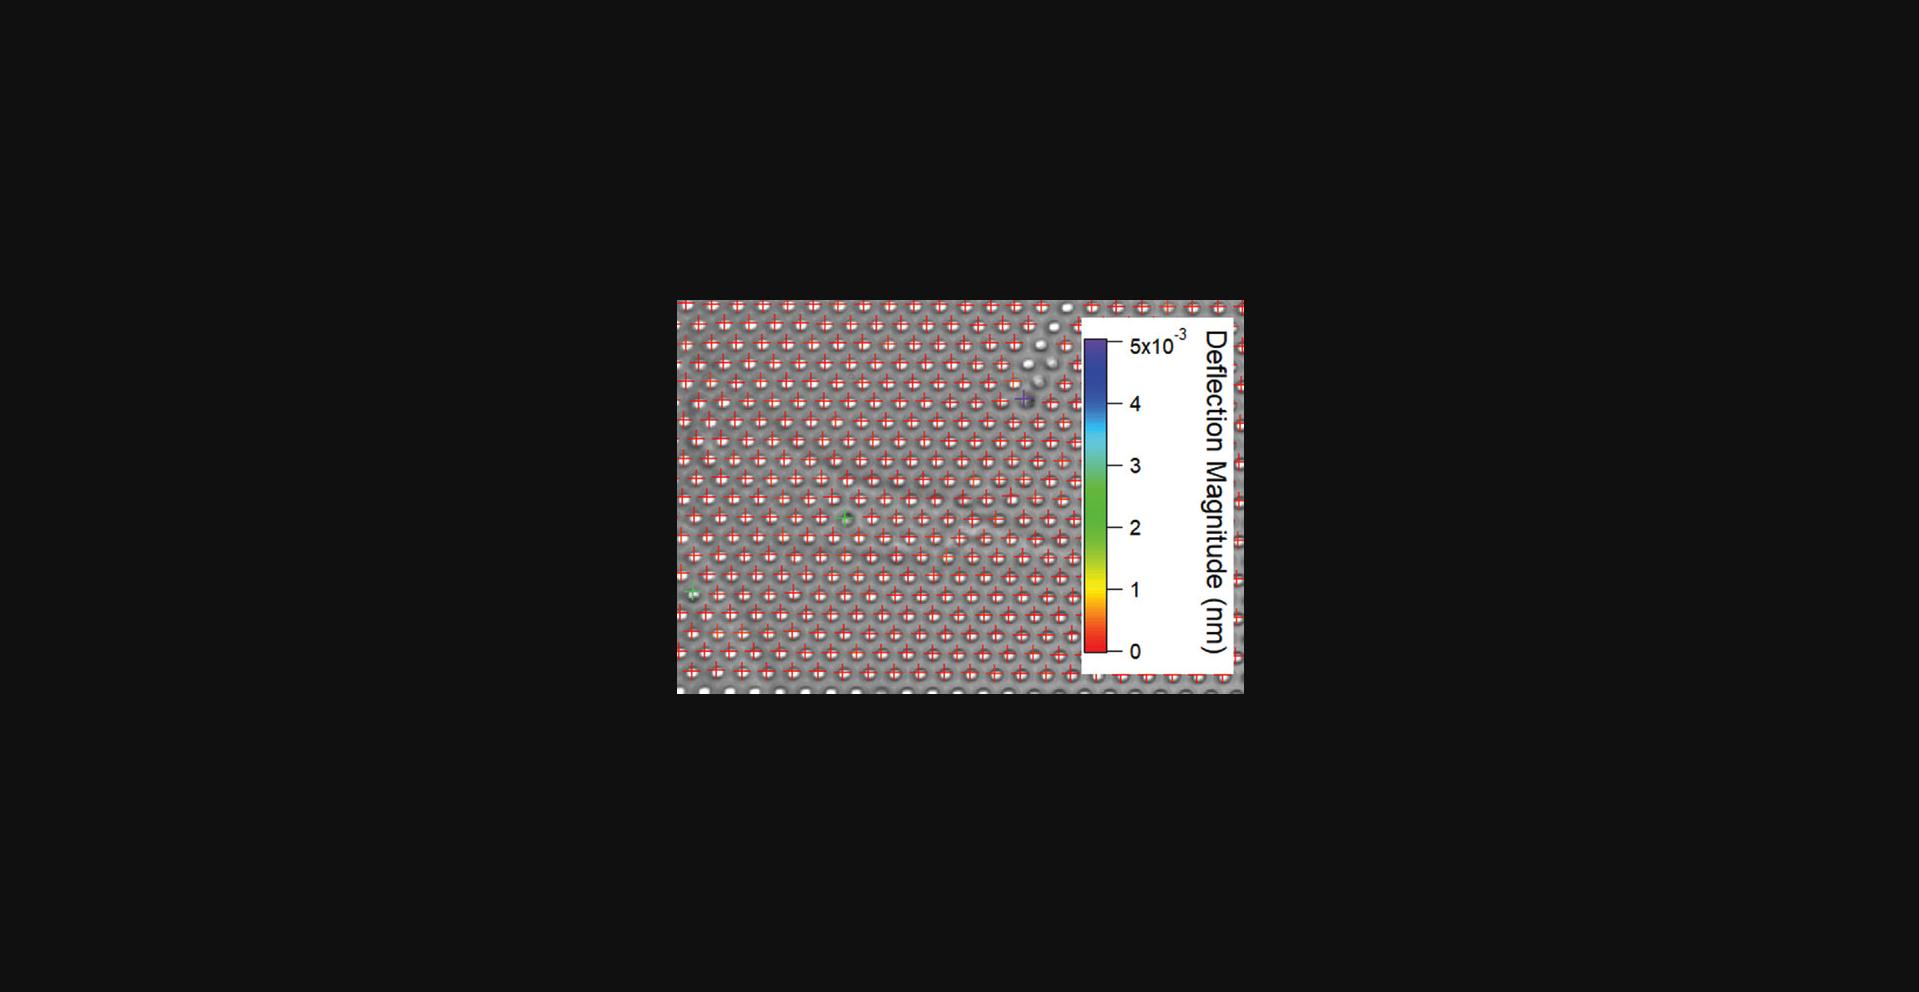
5.Confirm that the magnetic posts are present by checking the deflection magnitude from the Digital Lock-in result. Normally, deflections of magnetic posts will be larger than 1 nm, whereas the magnitude from a non-magnetic post is ∼0.1 nm.
6.Click “Load posts DLI” to load all digital lock-in results.
7.Click “Correct time variance” to calculate the frequency dependence of deflection magnitude after correcting for temporal variation based on reference frequency (Fig. 5.4).
8.Click “Load Hall sensor readout” to load all readouts from the hall sensor.
9.Click “Calc Hall sensor DLI” to perform a digital lock-in calculation on the magnetic field.
10.Click “Calc Modulus” to calculate k(ω) for all detected magnetic posts.
11.Follow steps 1-11 to calculate kpost(ω) for all detected magnetic posts after cells are removed.
12.Open up the two Igor projects in the same field of view with and without cells attached. Calculate the difference kcell(ω) = k(ω) – kpost(ω) (Equation 1) by subtracting the frequency dependence of modulus magnitude (data in the first layer of the modulus_w wave) of the same post in the two projects.
Basic Protocol 6: DATA ANALYSIS FOR FORCE FLUCTUATION MEASUREMENTS
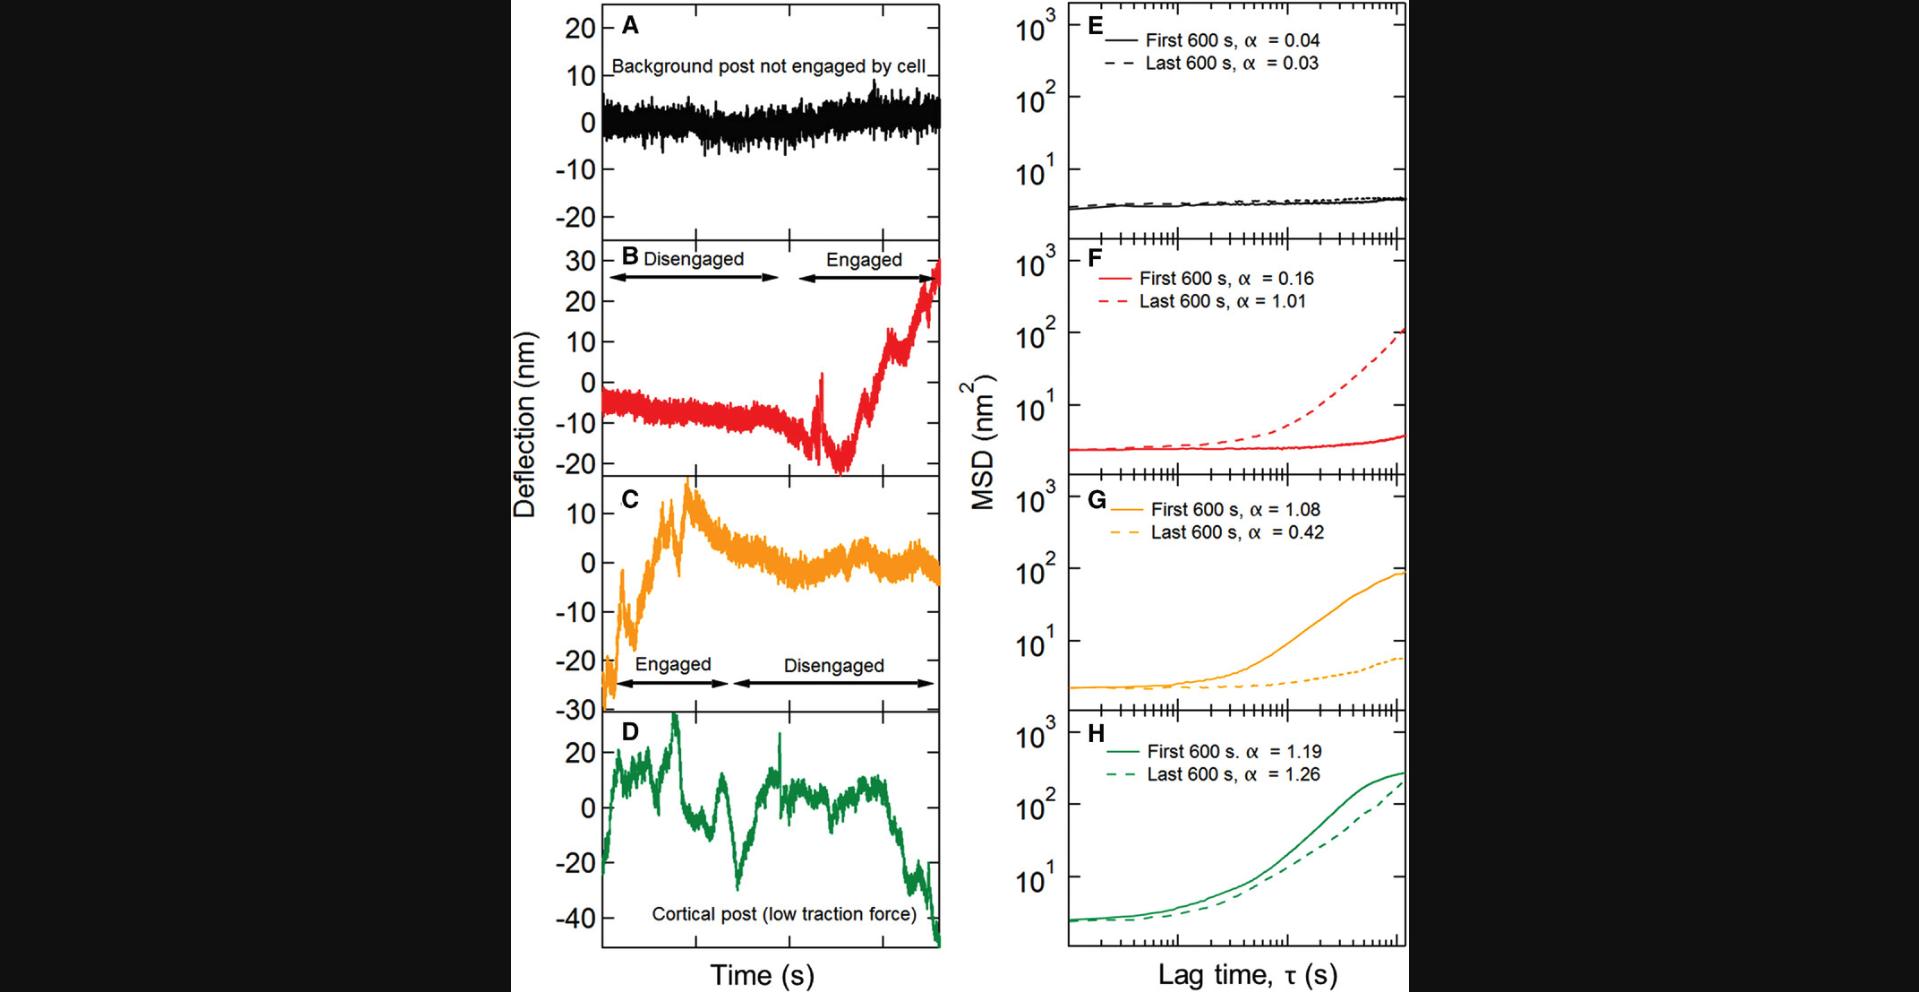
Measurements with non-magnetic microposts result in time traces that record the mechanical fluctuations of the cell. These are conveniently characterized using the mean squared displacement (MSD) <Δr2(τ)> = <(r(t+τ) - r(t))2> (Equation 2), where τ is the lag time. The MSD typically shows a power-law dependence MSD ∼ τα over a range of lag times from roughly 1 to 100 s. A procedure is described to extract the MSD exponent α by first subtracting the background noise floor and then fitting the logarithmic time derivative of the resultant subtracted MSD. The MSD exponent can then be used for multiple forms of analysis. Background posts that are not connected to a cell typically show much smaller MSD exponents α than do posts that are connected to a cell, and so the criterion α < 0.2 provides a means to identify the background posts. For long measurement times (e.g., up to half an hour), cell motility can lead to microposts near the edge of the cell being connected to the cell only over a part of the measurement interval as the cell moves. To identify such posts, the MSD may be calculated for the first and last thirds of each time trace, and the requirement that the corresponding exponents α1 and α3 both be > 0.5 can be used to identify posts that are connected to the cell throughout the measurement interval. Only these posts are used in subsequent analysis (unless one is interested in tracking motility). Procedures are described to bifurcate the population of cell posts into subpopulations associated with stress fibers and those associated with the cortex based on the average traction force produced on the posts.
Materials
- Igor Pro Software (Wavemetrics, Inc, version 8 or higher)
- PC or Macintosh computer (e.g., Dell Precision Tower 5810)
- Custom Igor Procedure files (See Internet Resources)
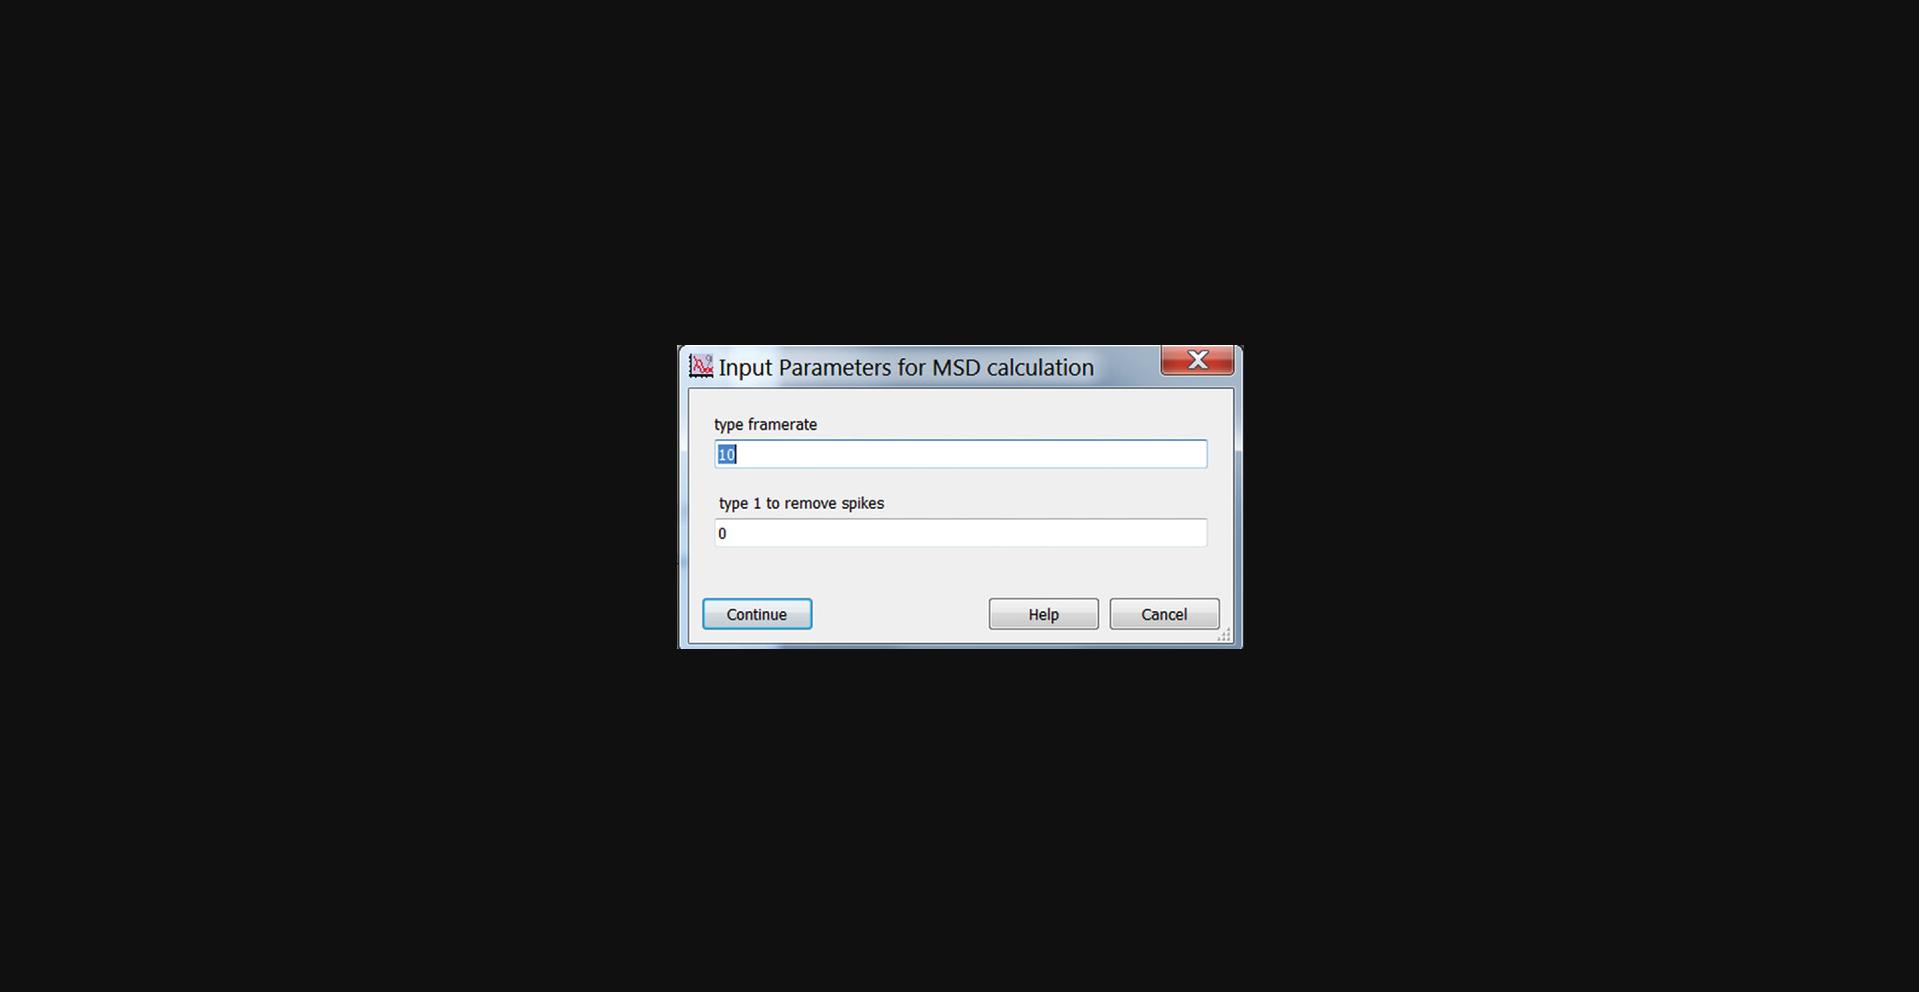
1.In the main GUI panel (Fig. 14), click the “MSD” button to open a pop-up window for calculating the MSD. (Fig. 27). Enter the video framerate (In frames/s). Set the spike removal flag to 0 initially. Click “Continue”. This will calculate the MSD for the x-component of the motion only. The y-component is not analyzed. The MSD is calculated in units of nm2.
2.As desired, the MSD results can be surveyed using “Plot-A-Lot”. Choose “MSD” in the Print in Right Column dropdown menu.
3.When finished with the MSD analysis, click “Make Cell Mask MSD” in the main panel to identify posts associated with the cell based on the MSD exponent. (Fig. 28).
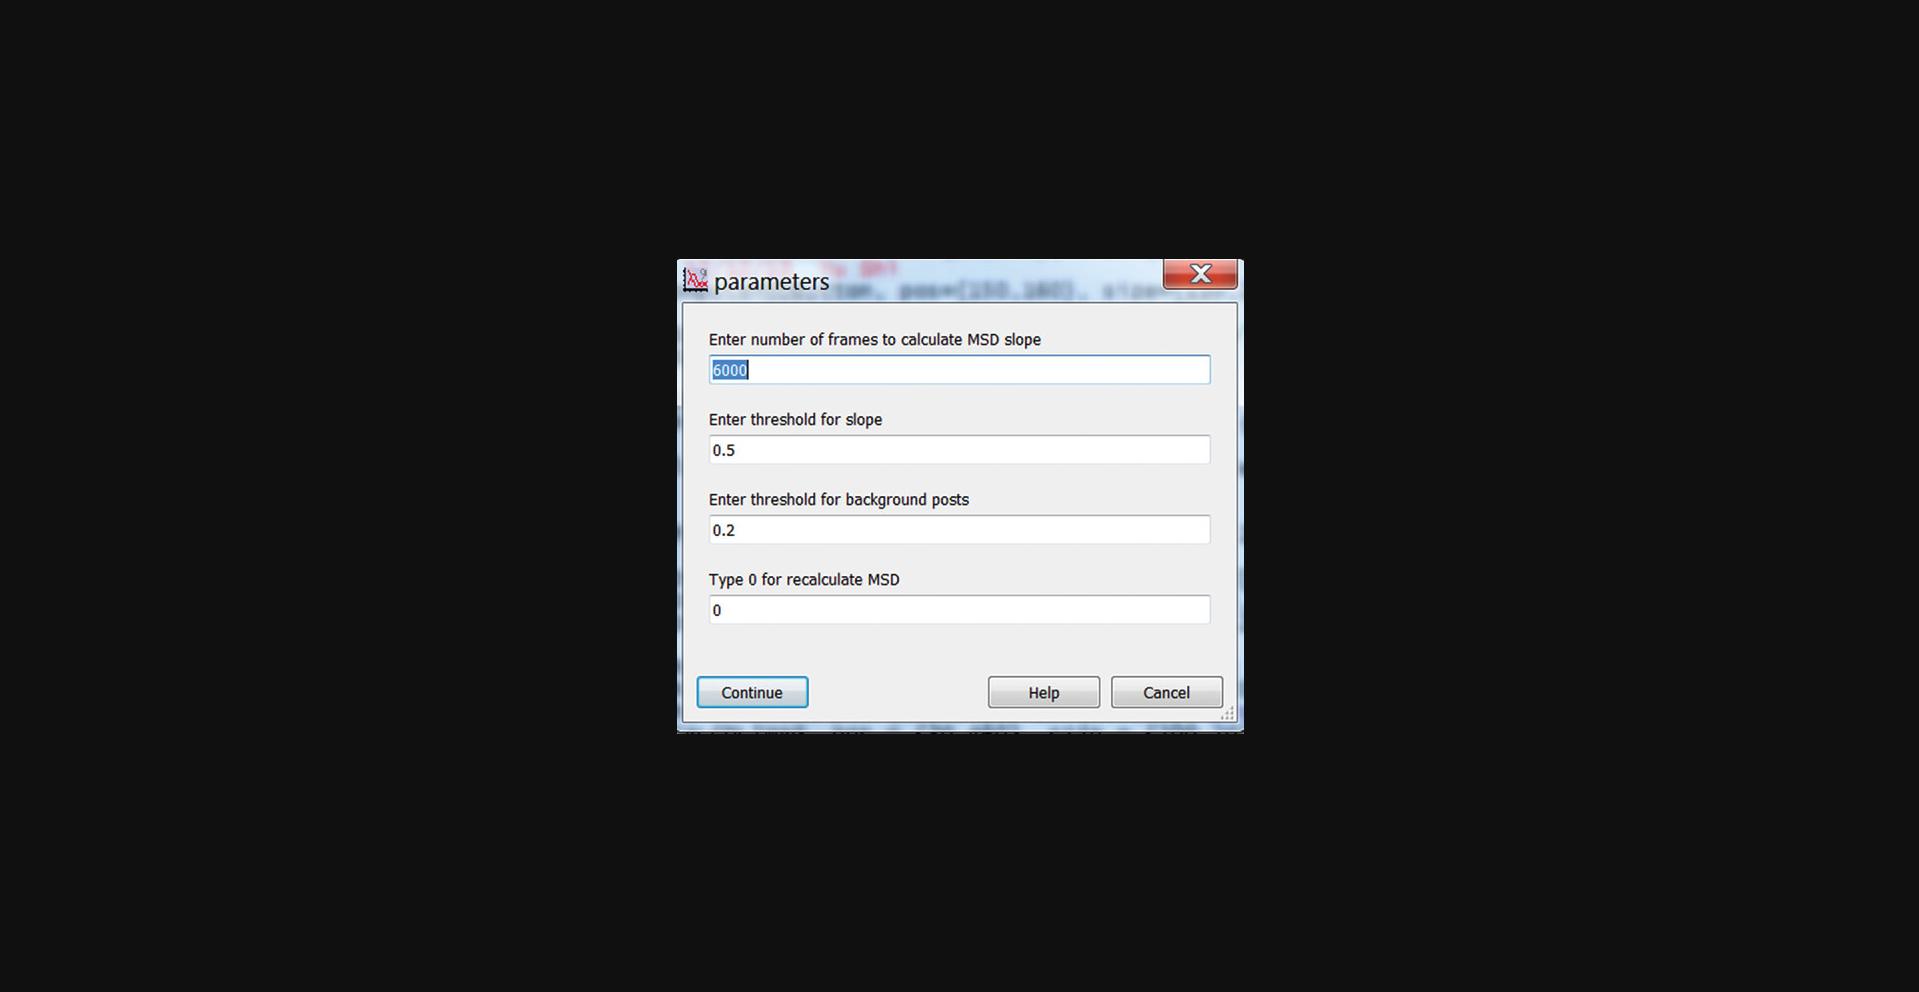
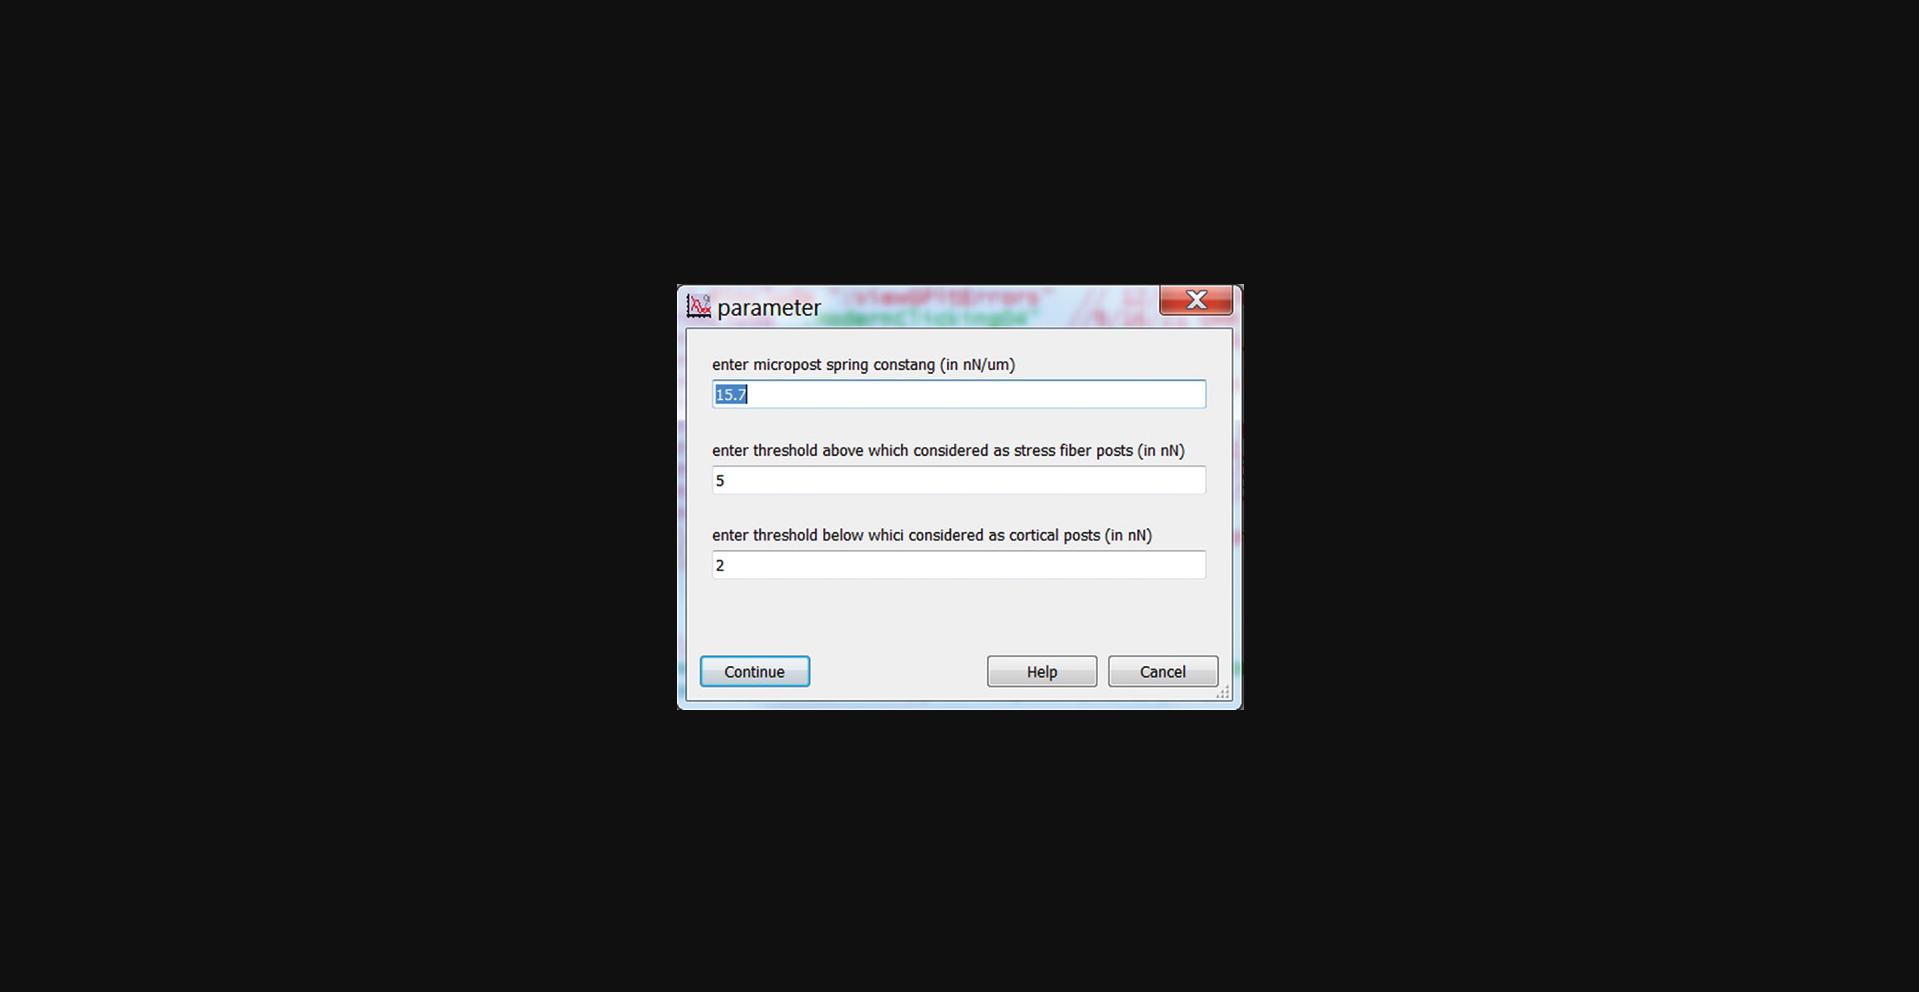
4.Click the “Force Bifurcation” button in the main panel and enter post stiffness (in nN/µm) and thresholds for identifying stress fiber and cortical-associated posts to run the code that identifies posts associated with the actomyosin cortex or with stress fibers (Fig. 29).
5.Click the “MSD Heat Map” button; this will generate panels C-E as in Figure 30, which are the heatmaps for the MSD exponent, the MSD magnitude at τ = 10 s, and the traction force map, respectively.
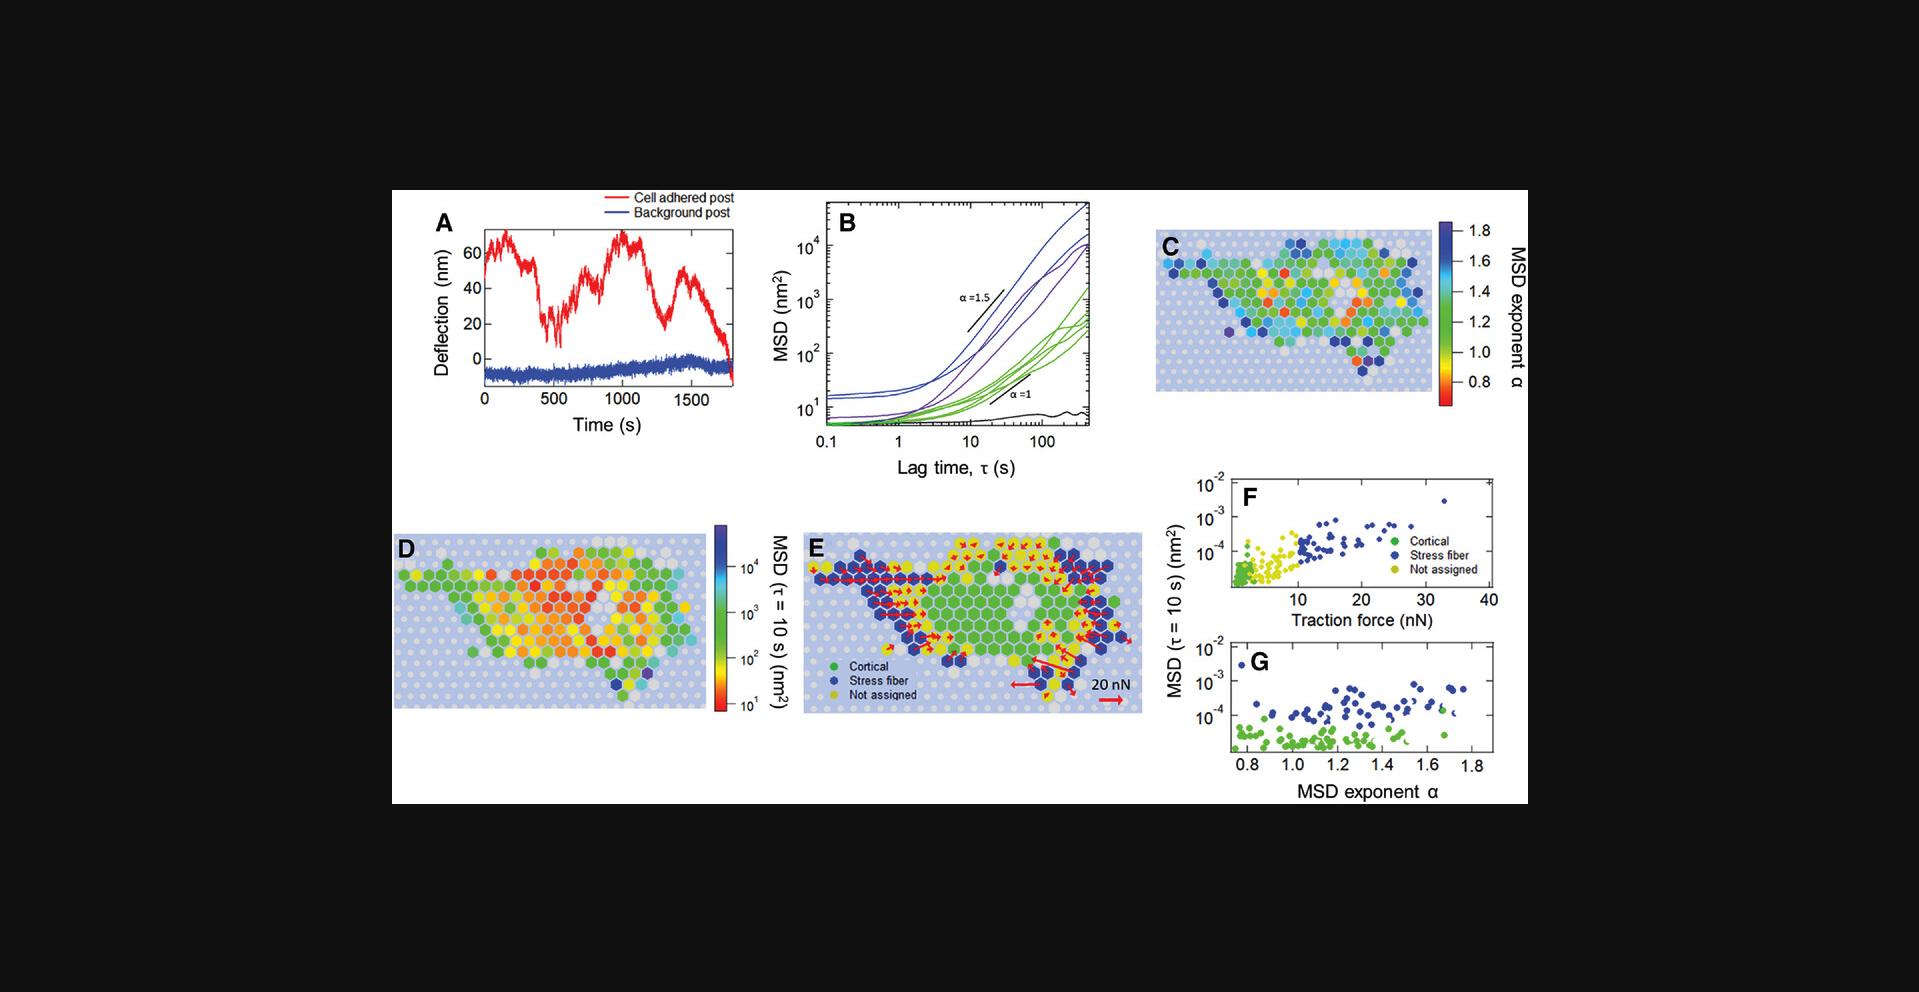
6.Click the “MSD Scatter Plot” button; this will generate panels F and G in Figure 30, which show the scatter plot of the MSD magnitude at τ = 10 s against MSD exponent and traction force magnitude, respectively.
COMMENTARY
Background Information
Thanks to the development of microfabrication techniques and the ability to engineer the mechanical properties of substrate materials for cell culture, a variety of approaches have been developed to probe mechanotransduction in cells at various scales (Martino, Perestrelo, Vinarsky, Pagliari, & Forte, 2018; Mohammed et al., 2019). PDMS micropost array detectors (MPADs) are one of the important techniques that have been applied to measure cellular traction forces (du Roure et al., 2005; Geng & Wang, 2016; Tan et al., 2003; Wolfenson et al., 2016). By coating the microposts’ tips with fibronectin or other suitable ECM proteins via microprinting, one can achieve controlled coupling between the posts’ tips and the cytoskeleton via cellular focal adhesions. For small deflections, the deformation of the microposts in response to cellular traction forces can be modeled by beam bending theory, which provides a method to directly transform the microposts deflections from their resting positions into the cellular traction force field (Fu et al., 2010; Tan et al., 2003). Further, embedding magnetic nanowires into the microposts provides an approach to applying mechanical perturbations to cells through these same focal adhesion linkages by magnetic actuation (Shi et al., 2019; Sniadecki et al., 2007; Sniadecki, Lamb, Liu, Chen, & Reich, 2008). Another widely used technique to probe cellular traction force is traction force microscopy (TFM), which employs flat substrates with embedded microbead tracers (Plotnikov et al., 2014). The cellular traction force field can be obtained by measuring the beads' displacement field. Since the TFM tracers are affected non-locally by the cellular traction field, obtaining the traction forces in TFM is mathematically more complicated than the conversion between displacement and traction force for MPAD arrays. Both TFM and MPADs have advantages: TFM allows cells to grow on a continuous substrate of variable stiffness with high probe particle densities. MPADs form a lattice of independent force probes underneath the cell. The effective stiffness of the substrate can be varied by changing the geometry of the individual microposts (Fu et al., 2010). Of course, like all techniques based on cell culture in two dimensions, TFM and MPADs cannot reproduce the 3D cellular environment. However, the challenges associated with 3D approaches to measuring cellular traction forces mean that the 2D techniques can be expected to continue to have utility for the foreseeable future.
The protocols described herein focus on applying active MPADS (AMPADs) (MPADs with embedded magnetic nanowires) to enable high-precision measurements of both cellular passive and active microrheology rather than the static traction force or cells’ response under large-scale external mechanical perturbations (Sniadecki et al., 2007; Trepat et al., 2007). A dual magnetic tweezer system actuates microposts with magnetic nanowires to measure local cellular rheology, while all the microposts serve as probes for measuring cellular fluctuations at high spatial and temporal resolution. Compared with other methodologies for performing cellular microrheology, AMPADs have the following advantages: first, compared with other active microrheology techniques, coating microposts tips with fibronectin enables controlled coupling of posts to cellular actomyosin network through focal adhesion; second, AMPADs provide an organized mapping of cytoskeletal fluctuations of different subcellular architectures with high spatial and temporal resolution. Moreover, compared with TFM, the independent nature of the micropost probes allows one to study their correlations, and the capability of embedding magnetic nanowires inside the microposts enables one to perform active and passive microrheology with the same system.
Basic Protocol Basic Protocol 1.This protocol describes how to extend replica molding techniques for fabricating MPAD arrays (Fu et al., 2010; Yang et al., 2011) to embed magnetic Ni nanowires in individual microposts (Shi et al., 2019). The original work describing magnetic micropost array fabrication (Sniadecki et al., 2007; Sniadecki et al., 2008) used Co nanowires instead of Ni. While Co has a larger magnetic moment than Ni and hence can, in principle, provide larger magnetic actuation forces on individual microposts, some issues are associated with the use of Co that make Ni preferable. First, and most importantly, Co metal dissolves in culture media and is toxic to cells. In the original work of Sniadecki et al., the larger micropost sizes used (4 µm diameter) enabled the nanowires to be sufficiently well encased in the PDMS posts to minimize such issues. In contrast, Ni is not dissolved in culture media and is not measurably toxic in cell culture at the concentrations used in the experiments described here over the relevant exposure durations of a few days (Zhao, Boudou, Wang, Chen, & Reich, 2013). In addition, the magnetic properties of Co mean that Co nanowires do not form permanent magnets and so behave somewhat like superparamagnetic particles in a field perpendicular to their long axis (as one has here). As a result, microposts with Co nanowires can only be deflected in a single direction from their resting position, regardless of whether the applied magnetic field changes sign (Sniadecki et al., 2007; Sniadecki et al., 2008). Ni nanowires, in contrast, are good permanent magnets, so their actuation is bi-directional, following the direction of the applied field.
Basic Protocol Basic Protocol 2.To optimize imaging of the microposts for the particle tracking analysis, this protocol employs imaging procedures that maximize both resolution and signal-to-noise while maintaining cell viability. Therefore, the microscope's condenser aperture is maximized to optimize resolution, and the illumination intensity is adjusted to maximize intensity in the captured frames without saturating the camera. The camera's digital gain is turned off to minimize camera noise. To capture bright-field movies at 100 fps, the exposure time is adjusted to 4.5 ms, so there is a gap in time between successive exposures to ensure no correlation between neighboring frames. To account for phototoxicity due to high illumination intensity, ultraviolet and infrared filters restrict the wavelength to 425 nm < λ < 700 nm. The microscope's built-in green interference filter also helps to minimize photodamage. Post-tracking accuracy is extremely sensitive to focus drift and thermal fluctuations. An enclosed incubator and stage-mounted heating plate are used to keep the culture dish and its surroundings at 37°C. For long, multi-hour runs on the microscope to record force fluctuations for multiple cells, an on-stage environmental control chamber is used and filled with 5% premixed CO2 gas to help maintain cell viability. It is also important to allow sample dishes with cells on MPADs to stabilize at 37°C for 30 min in the enclosure prior to imaging to minimize thermal fluctuations that can arise when transferring cell culture dishes from the culture incubator to the microscope stage.
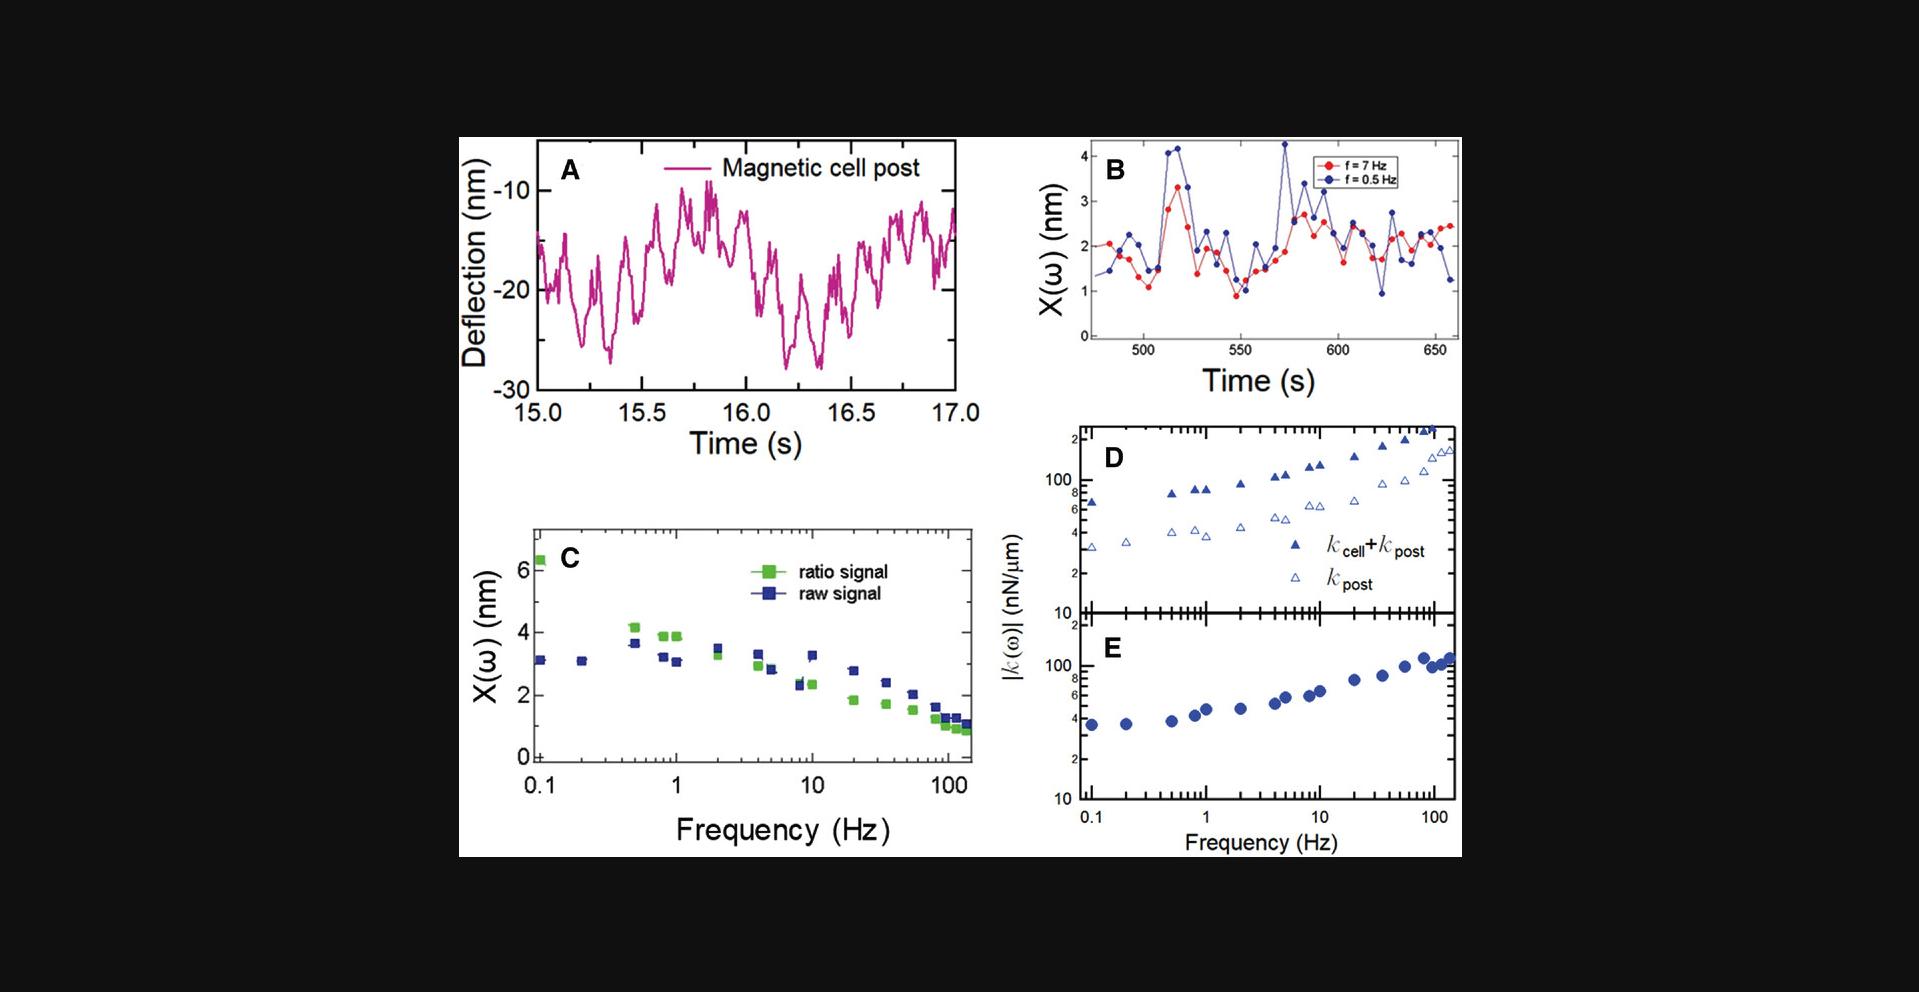
Basic Protocol Basic Protocol 3. Several experimental considerations must be addressed to acquire accurate data for the frequency dependence of the local cellular rheology with magnetic nanowires embedded in microposts and a magnetic tweezer system (Bose et al., 2018; Kramer, 2009; Lin et al., 2012; Zhao et al., 2014). To minimize evaporation and thermal fluctuations, we describe a customized sample chamber that allows the tips of the magnetic tweezer poles to be brought within 2 mm of the AMPAD array without contacting the culture media (Shi et al., 2019). This chamber greatly improves cell viability and decreases fluctuational noise in the measurements. A sinusoidal magnetic field results in micropost deflections of only a few nanometers. This does not interrupt normal cellular activity and keeps the measurements in the linear range. To account for time variance in the deflection magnitude associated with cellular activity (Massiera et al., 2007), such as time-dependent coupling of the posts to the cytoskeleton, the actuating magnetic field is composed of a superposition of two frequencies: one frequency varies from 0.1 to 135 Hz to measure the frequency dependence of cellular stiffness, and the other is kept fixed (at 7 Hz in our case) to measure the time variance in deflection magnitude (Fig. 31A) (Shi et al., 2019). As the microposts themselves have a frequency-dependent viscoelastic response, after measuring the magnetic microposts’ motion with cells attached, cells are removed, and the same field of view is measured again. By analyzing the differences between the magnetic posts’ response with and without cells attached, one can extract the modulus of the cellular cortex (see Protocol 5).
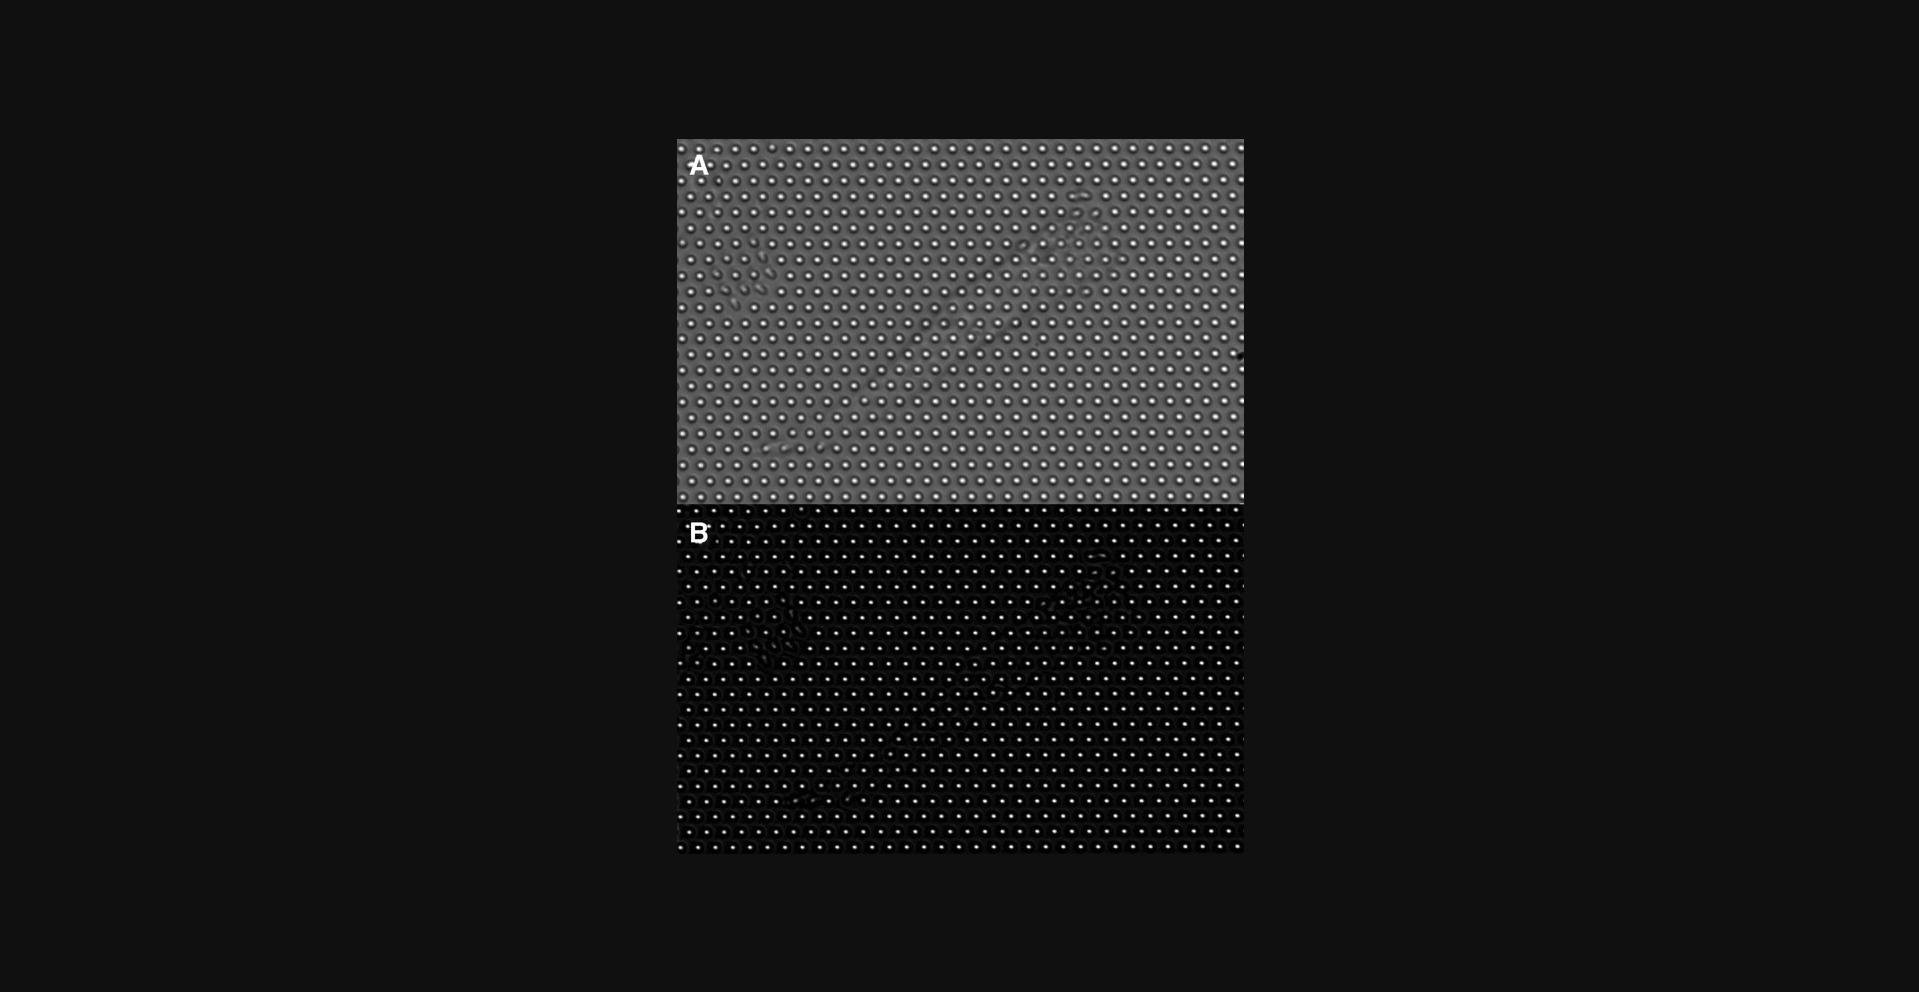
Basic Protocol Basic Protocol 4. To determine the microposts’ positions versus time from the raw data (movies), Basic Protocol 4 implements a centroid-based particle tracking algorithm (Crocker & Grier, 1996) written in Igor Pro. Each frame is processed with a 2D Gaussian filter of 3 pixels full width at half maximum and an averaging filter with the micropost diameter. The results from the averaging filter are subtracted from the results from the Gaussian filter to obtain intermediate images with enhanced contrast and subtracted background (Fig. 32). A square mask is created, centered at the initial estimated position of the micropost center with a size slightly larger than the diameter of the micropost, and the center position is recalculated based on the intensity-weighted center of all pixels within the mask (centroid fitting). The mask is shifted toward the new fitted center by the closest integer number of pixels, and this process is repeated recursively until the difference between the center of the current mask and the fitted centroid is less than 0.5 pixels. To account for frame-to-frame drift, the average displacement in each frame relative to the movie's first frame of all the background microposts (those not in contact with cells) is subtracted from each micropost's trajectory. The undeflected positions of posts in contact with cells are determined by interpolation based on the positions of the background posts in the corresponding rows and columns of the array (Sniadecki et al., 2008).
Basic Protocol Basic Protocol 5. The amplitudes and phases of the magnetic microposts’ response at measurement frequency f and reference frequency fR are found via digital lock-in analysis (Dixon & Wu, 1989) of the microposts’ positions r(t) determined from the image sequences as described in Basic Protocol 4. Due to the finite exposure time, the AC amplitude extracted from the digital lock-in analysis is reduced in a frequency-dependent manner due to its averaging effect, as shown in the formula below.
Suppose we have a sinusoidal signal written as f(t) = A cos ωt (Equation 3). In our case, A is the deflection magnitude of the magnetic micropost, and ω is the angular frequency of the magnetic field. Considering that the finite exposure time will give amplitude f(t) averaged over the exposure window, the recorded signal intensity S at the nth frame recorded at frame rate Δt (see Equation 2) over finite exposure time Te is \begin{eqnarray*} S &=& {\rm{;}}\frac{1}{{{T_e}}}\mathop \smallint \limits_{n{\rm{\Delta }}t}^{n{\rm{\Delta }}t + {T_e}} A\cos \left( {\omega t} \right)dt \\ &=& \frac{A}{{{T_e}\omega }}\left\{ {\sin \left[ {\omega \left( {n{\rm{\Delta }}t + {T_e}} \right)} \right] - \sin \left( {\omega n{\rm{\Delta }}t} \right)} \right\}\\ &=& \frac{{2A}}{{\omega {T_e}}}{\rm{;}}\sin \frac{{\omega {T_e}}}{2}\cos \left[ {\omega \left( {n{\rm{\Delta }}t + \frac{{{T_e}}}{2}} \right)} \right] \\ &=& \frac{{\sin \alpha }}{\alpha }{\rm{;}}A\cos \left[ {\omega \left( {n{\rm{\Delta }}t + \frac{{{T_e}}}{2}} \right)} \right] \end{eqnarray*}
(Equation 4), where α = ωTe/2 (Equation 5). Therefore, the amplitude is reduced by a prefactor
Another phase shift arises from the fixed lag time tlag between the camera exposure window and the sampling of the magnetic field by the DAQ card. For our system, this is tlag = 0.02 s as measured by imaging an LED driven by the DAQ card.
Data at frequencies above the Nyquist frequency fNy = fS /2 = 50 Hz (fS = 100 Hz in our system) are measured via aliasing, i.e., at apparent frequencies
Suppose a sinusoidal signal can be written as A = cos(2π ft + φ) (Equation 7), where f is the measured frequency and φ is the phase shift. Since fst = n is the index of the frame captured by the camera, it is an integer. Then when 50 Hz < f < 100 Hz, \begin{eqnarray*} {f_k} &=& {f_s} - f\\ S &=& A\cos \left( {2{\rm{;}}\pi ft + \phi } \right)\\ &=& A\cos \left( {2{\rm{;}}\pi \left( {{f_s} - {f_k}} \right)t + \phi } \right) \\ &=& A{\rm{;}}\cos \left( {2{\rm{;}}\pi {f_s}t - 2{\rm{;}}\pi {f_k}t + \phi } \right)\\ &=& A{\rm{;}}\cos \left( {2{\rm{;}}\pi {f_k}t - \phi - 2\pi n} \right) \\ &=& A\cos \left( {2{\rm{;}}\pi {f_k}t - \phi } \right) \end{eqnarray*}
(Equation 8).
This indicates that the phase is inverted from φ to –φ when measured at the apparent frequency fk over the range 50 Hz <
(Equation 9).
Therefore, no additional phase is introduced when measured at the apparent frequency if f > 100 Hz. All of these effects are accounted for in the Igor Pro code.
To estimate the resolution of the digital lock-in analysis, one can apply it to all microposts (magnetic and non-magnetic) under an AC magnetic field. We have found that the measured amplitudes of non-magnetic microposts are all < 0.5 nm, which we have taken as our AC amplitude resolution δr < 0.5 nm in our system.
To account for observed temporal fluctuations in x(ω) (Fig. 31B), one calculates the ratio \begin{eqnarray*} x\left( \omega \right) = \frac{{{x_s}\left( \omega \right)}}{{{x_R}\left( {{\omega _R}} \right)}}{\rm{;}}{\bar x_R}\left( {{\omega _R}} \right) \end{eqnarray*}
(Equation 10) (Massiera et al., 2007), where xS(ω) is the response at the variable frequency f and xR(ωR) is the response at the reference frequency fR over the same measurement interval. The ratio of these signals is multiplied by
The magnetic force F(ω) is determined from the measured magnetic field B(ω), using the nanowires’ magnetic moment and the nanowires’ and microposts’ dimensions (Sniadecki et al., 2008). The equivalent stiffness is then calculated as k(ω)= F(ω)/x(ω) (Equation 11). Post stiffness k post(ω) is determined from data obtained after removing the cells by trypsinization, and the resulting cell stiffness is computed as k cell(ω) = k(ω) – k post(ω) (Equation 12) (Fig. 31D). See also (Shi et al., 2019). Note that this effectively views the cell and the post as two viscoelastic units in parallel.
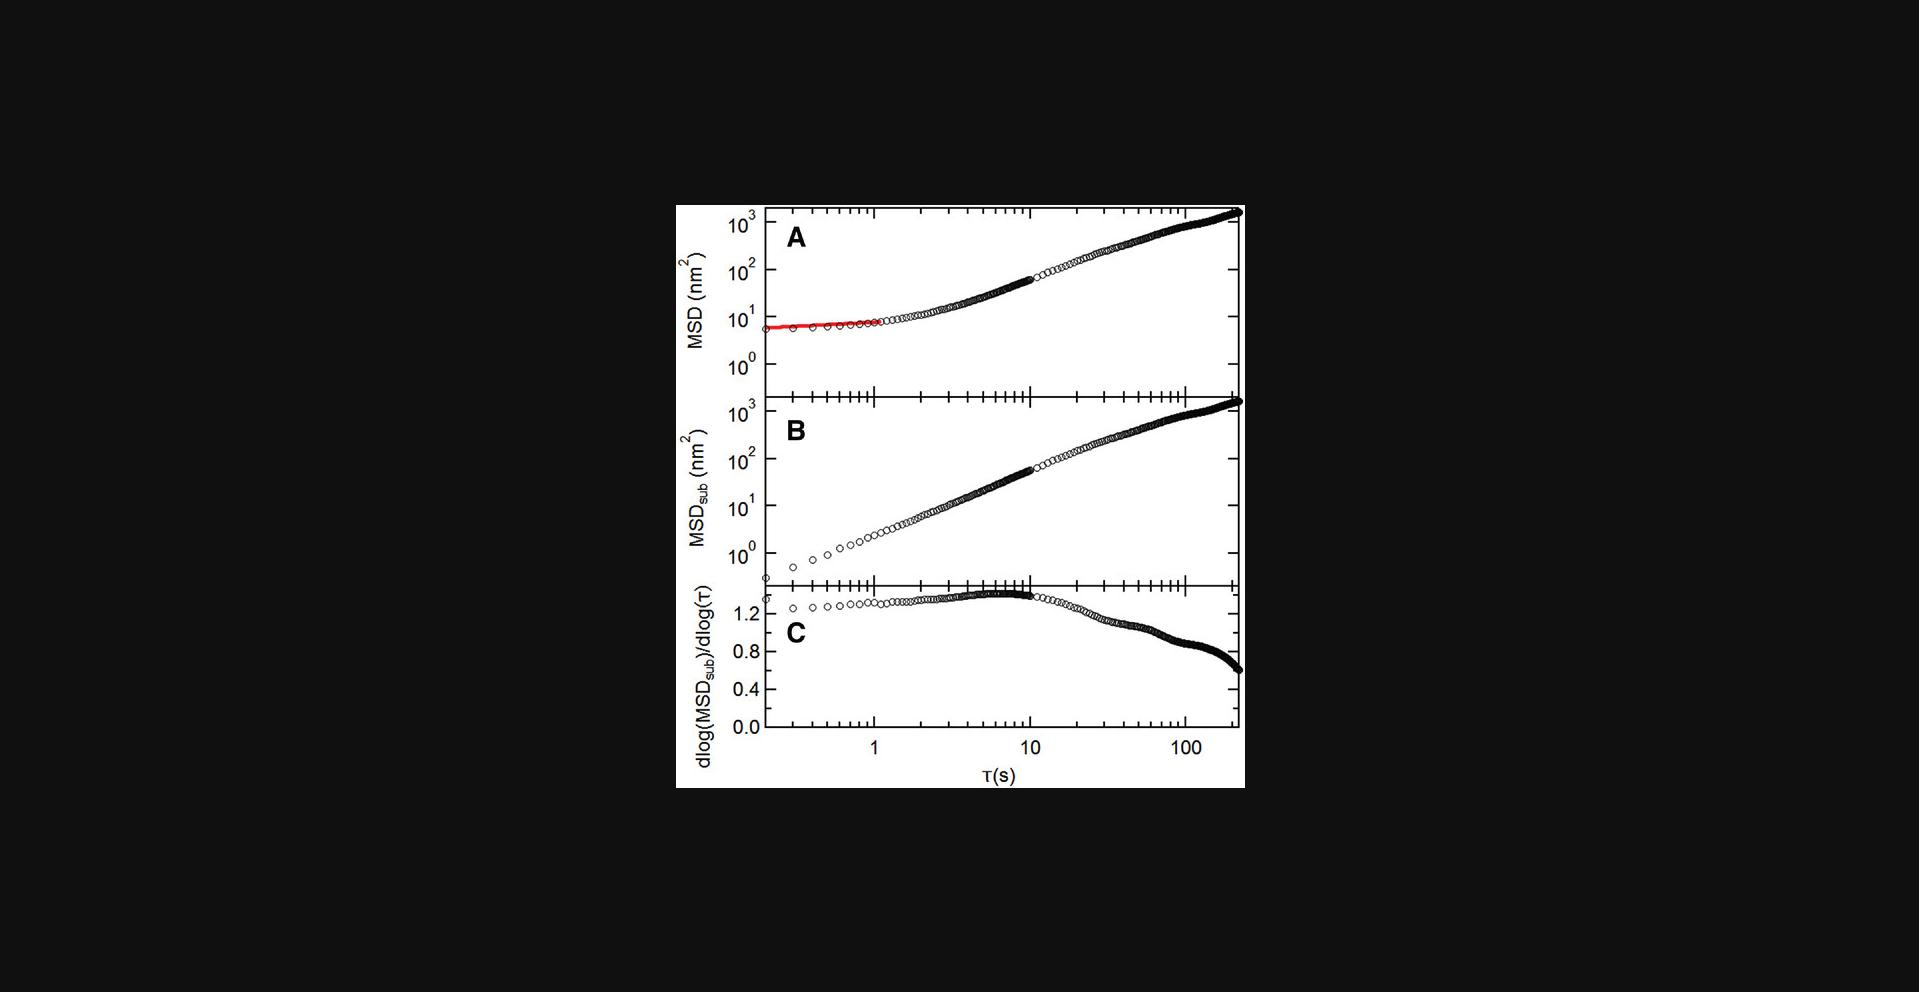
Basic Protocol Basic Protocol 6. Due to the nature of bright field imaging, it is difficult to observe the cell edges accurately. However, one can use the calculated mean square displacement (MSD) of the microposts’ trajectories to distinguish cell-associated posts from background posts. To obtain an accurate estimation of the MSD exponents α, MSDs were fitted by a power law in the form of
(Equation 14)
and uses the averaged value over the range 5 s ≤ τ ≤ 10 s as the estimation for the MSD exponents (Fig. 33). By examining microposts far from cells, we have found that their MSD exponents α are mostly less than 0.5 and use this criterion to distinguish background from cell posts.
Since cells can migrate on microposts over the typical 30-min time course of experiments using this technique, this protocol includes a procedure to identify posts associated with the cell for the full measurement interval. The trajectory of each post is broken up into three equal segments (10 min for a 30-min video), and the MSD exponent is calculated for each segment over the lag time range of 5-10 s as described above (where MSD and lag time follows a power-law relationship). To analyze cell-associated posts, we only accepted those with the first third and last third having α > 0.5. Examples of how this criterion is applied are shown in Figure 34.
Critical Parameters
Making the magnetic micropost arrays:
- 1.Ensure proper nanowire density. An excessively dense solution may result in excess nanowires in the micropost array base (not in the posts themselves), which will hinder imaging. A density that is too low may make it difficult to find cells with associated magnetic microposts.
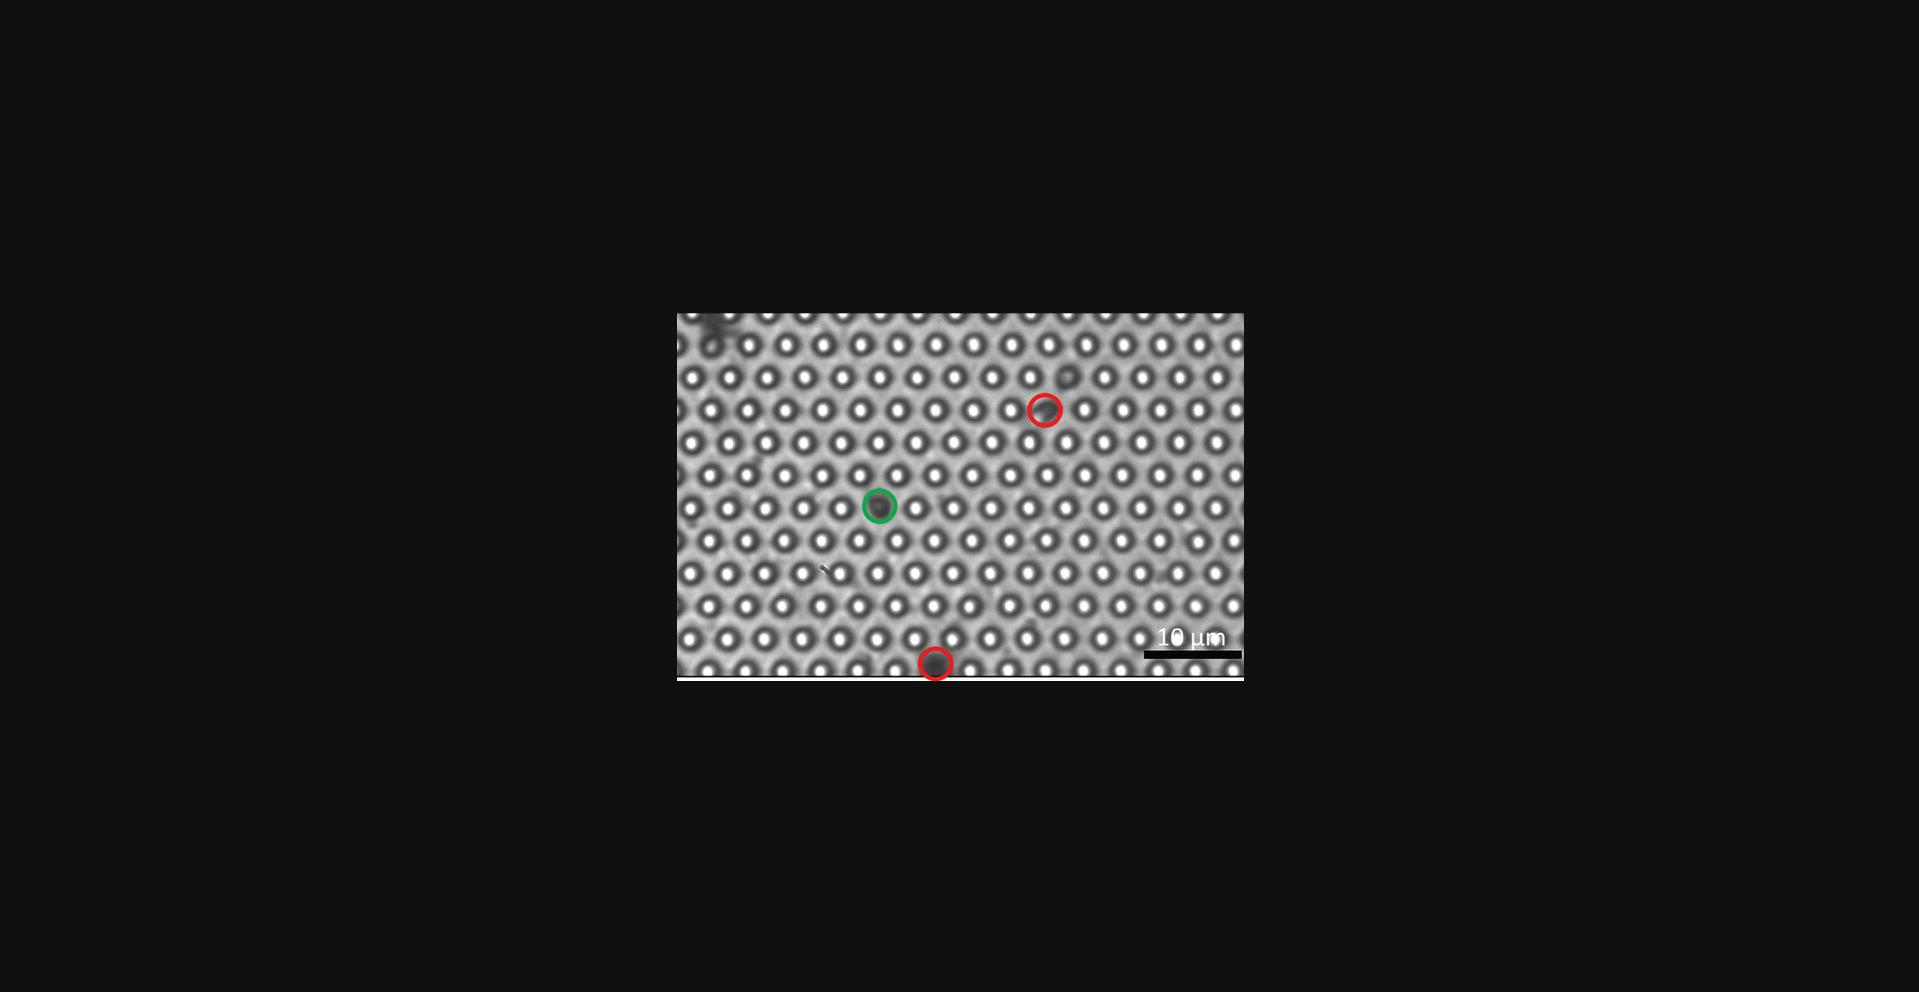
- 2.In the magnetic actuation experiments (Basic Protocol 5), one must re-locate the former positions of the cells after they have been removed to re-measure the magnetic microposts’ motion without the cells attached. Therefore, it is desirable to have reference marks of some kind in the micropost arrays to aid navigation. In arrays without such marks, it is usually best to work near the edge of the array and use the small but inevitable number of missing or collapsed posts (Fig. 35) as navigation aids to locate the magnetic posts.
Cell seeding on the arrays:
- 1.Seeding density should be set as described in the protocol, with sufficient cells but not enough to overlap.
- 2.Cells should be well spread on the microposts. When appropriate substrate stiffnesses are chosen, one can generally find microposts at the cell's periphery that are visibly bent, indicating good focal adhesion formation and mechanical contact between the cells and the microposts.
Obtaining high-quality images:
- 1.Image quality is crucial to ensuring the precision of localizing the post centers. This protocol maximizes illuminator intensity without photodamaging the cells. A sample image is shown in Figure 32A, where there is a clear contrast between the microposts’ tops and the background while ensuring that the microposts’ tops are as bright as possible without saturating the camera.
Troubleshooting
Common problems with the protocols, their causes, and potential solutions are itemized in Table 1.
| Problem | Possible Cause | Solution |
|---|---|---|
| Microposts collapsed | Microposts were allowed to dry, and forces from liquid evaporation caused posts to collapse. | Avoid letting the microposts dry out after submerging in liquid. If microposts are already collapsed, one can submerge them in ethanol and sonicate for 30 min. |
| No visible microposts with nanowires | Nanowire solution density too low | Increase nanowire solution density and/or increase volume of nanowire solution. |
| Nanowires inside base of MPAD array. | Nanowire solution density too high | Decrease nanowire solution density and/or decrease volume of nanowire solution. |
| Large drift/vibration when imaging cells on MPADs. | Air bubbles beneath coverglass | Remove air bubbles from beneath coverglass when loading MPADs into dish. |
| Focus drift over the time course of imaging. | System not in equilibrium | Wait for ∼30 min before measuring the first cell. |
Understanding Results
Basic Protocol Basic Protocol 1 should yield arrays of microposts with approximately 1% of the posts containing magnetic nanowires. An example of a portion of an array is shown in Figure 34. The “magnetic posts” are not always easy to spot with an optical microscope but frequently appear darker than the non-magnetic posts. Such a post is shown in the green circle in Figure 34. Note that when the concentration of nanowires is too high, the nanowires can become embedded in the base of the array between the microposts rather than within microposts. It can also be useful when initially fabricating magnetic post arrays to collect images of several arrays by scanning electron microscopy. The nanowires show up clearly, and their presence can be verified by energy-dispersive x-ray (EDX) compositional analysis (Sniadecki et al., 2007; Sniadecki et al., 2008).
Basic Protocol Basic Protocol 2.After incubation on the MPADs, cells should spread and adhere to the posts and exert traction forces on them (see Fig. 3). Observation of such forces has been widely discussed in the extensive literature on measuring quasi-static cellular traction forces with MPADs (Geng & Wang, 2016). In the imaging mode used here, details of the cells are not visible, but the outlines can usually be observed with practice. If sufficient traction forces are being exerted by the cells, highly deflected posts near the edges of the cells can be seen (Fig. 3). The main output of this protocol is movies of the time dependence of the fluctuating cellular forces. The fluctuations in the microposts’ positions are typically too small to observe by eye but are readily resolved with the image analysis techniques described in Basic Protocol 4.
Basic Protocol Basic Protocol 3 will yield data for the motion of the magnetic microposts under AC actuation. For larger actuations, this motion can be seen by the human eye (Supplementary Movie 1), but for local rheology measurements, the AC deflection amplitudes should be kept in the <10 nm range to remain linear. Such deflections are too small to see by eye but are readily detected upon image analysis (see Fig. 26). Movies should be obtained with cells attached to the posts and after removal of the cells to enable subtraction of the contribution from the viscoelasticity of the posts themselves. To find the same region after cell removal, we use a naming convention to indicate the approximate location of the ROI on the micropost array when the cell is taken (for example, we name cell “TLTRc1” if the cell is taken at the top right corner of the top left quadrant of the microposts array), then use nearby imperfections in the micropost array to fine-tune its location. Examples of such movies are provided in the SI.
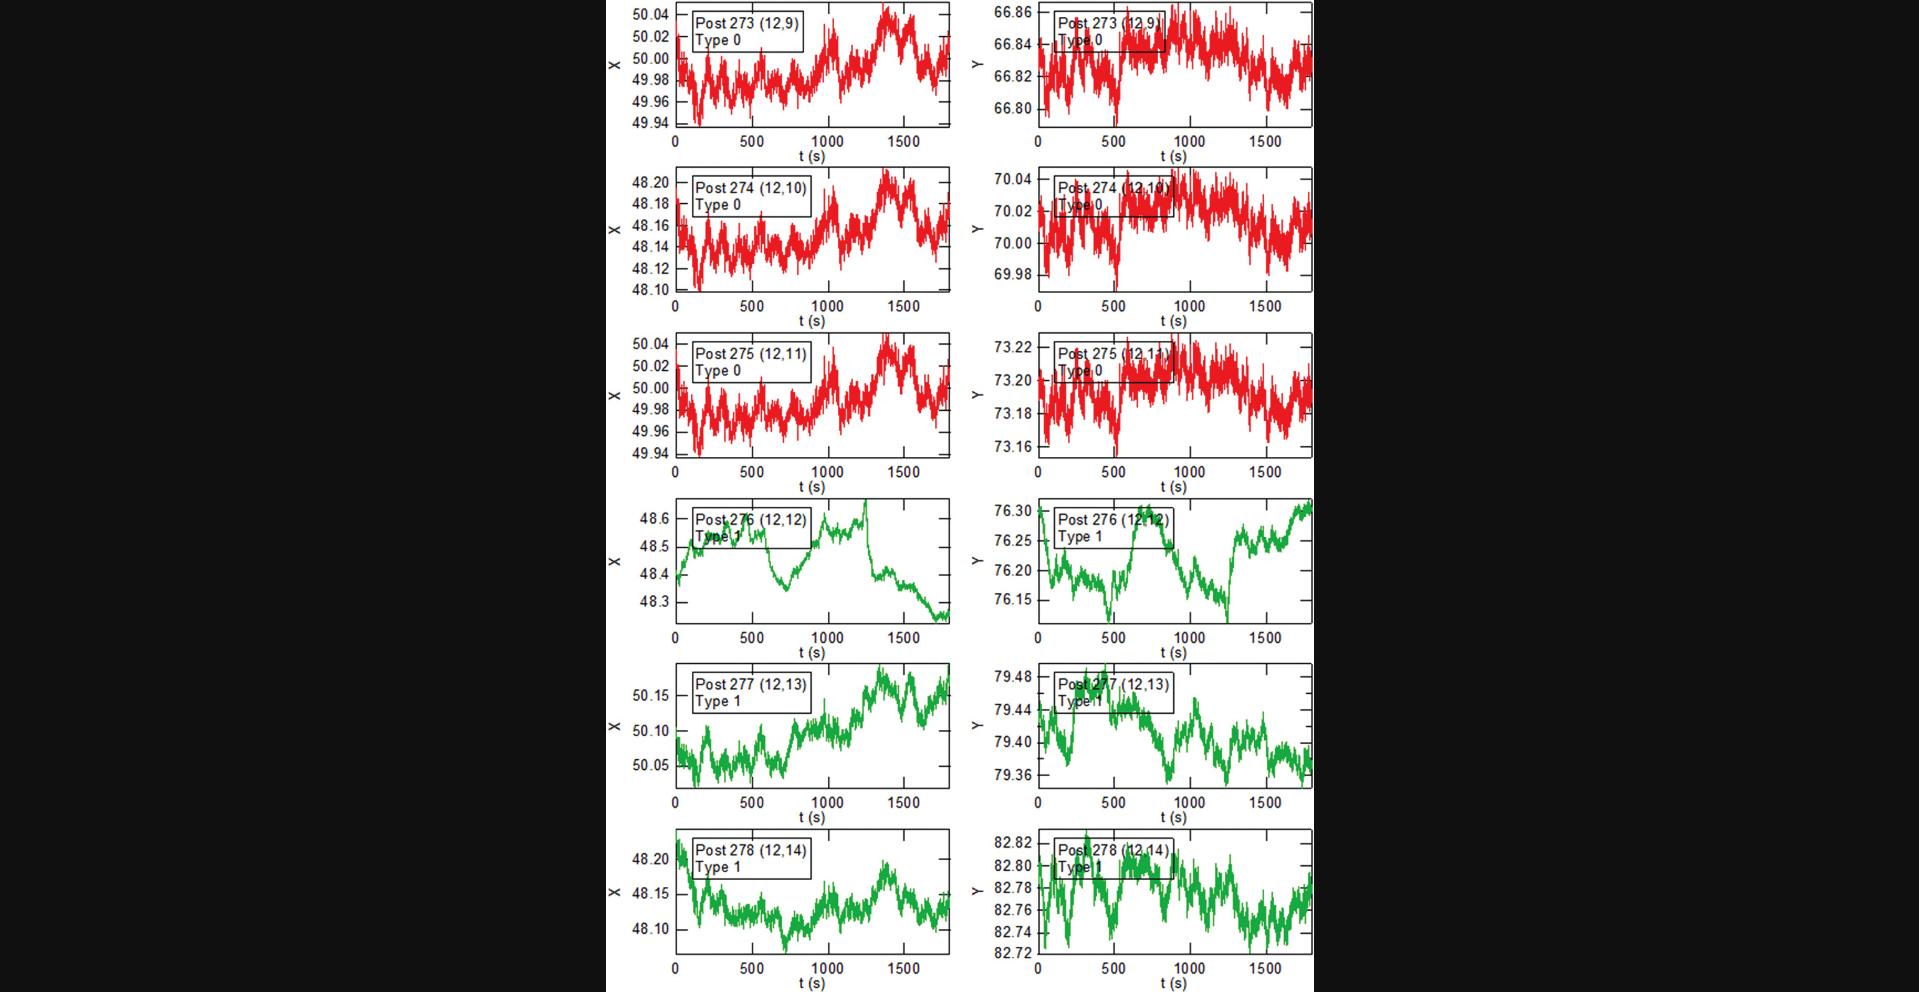
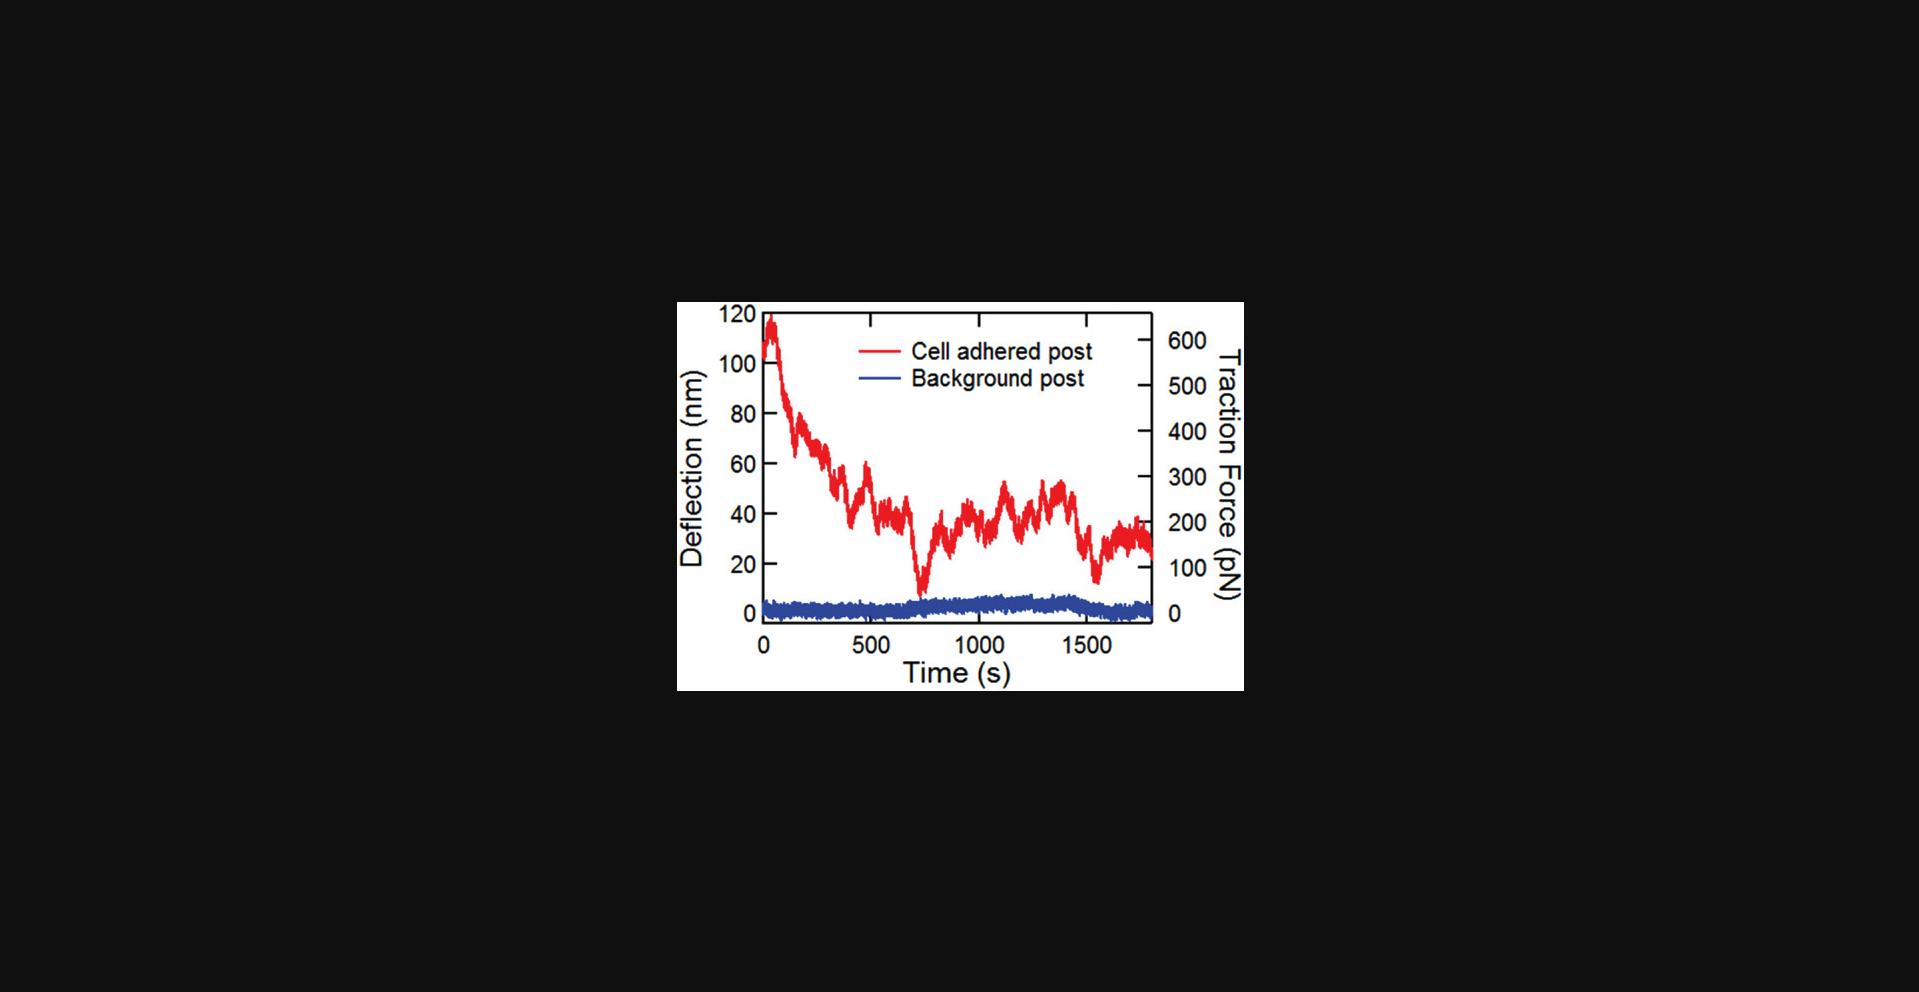
Basic Protocol Basic Protocol 4. The data reduction in this protocol proceeds in three stages. These are illustrated below using selections from the output from the “PlotALot” function in the associated analysis code, allowing one to view the x and y components of the posts’ trajectories and their MSDs (after finishing MSD analysis in Basic Protocol 6). The initial centroid-based particle tracking analysis of the image sequences (the “FIt All Posts” function in the main GUI (see Fig. 14)) yields the “raw” x and y positions of each post in each video frame in the pixel coordinates of the camera (Fig. 36). Note that the three background posts in Figure 36 have remarkably similar trajectories. This reflects the background “drift” motion of the array. The amplitude of this motion of ∼0.1 pixels (12.5 nm) is comparable to the motion of the less active cell posts (e.g., Posts 277 and 278 in Fig. 36), which illustrates the need for the dedrifting procedure (the “Calc_bgshift” function). The result of the dedrifting, which subtracts the average displacement of the background posts relative to the first frame, is illustrated in Figure 37. Note that the background posts’ residual trajectories, with amplitudes of ∼0.01 pixels (1.2 nm), are reduced by approximately a factor of 10 compared to the raw data. Finally, after subtracting each post's undeflected position from the trajectory (via the CalcGridCenter function), one obtains the deflection of each post versus time (Fig. 38) (still in pixels). These can be converted into distance from the measured array lattice constant and into force if desired from the posts’ effective spring constant for lateral deflections (Fu et al., 2010). An example of this conversion is shown for the x-component of the motion for one cell post and one background post from Figures 36-38 in Figure 39. Note that analysis of the background data such (Fig. 38) yields information on the background noise for the cell posts in such measurements. In our studies, which include slight non-linearities in the mapping from physical location to centroided position, the dedrifted background post motion over 30-min observations was ∼2-3 nm RMS when measured at 10 fps, which is small compared to the typical movement of cell-associated posts.
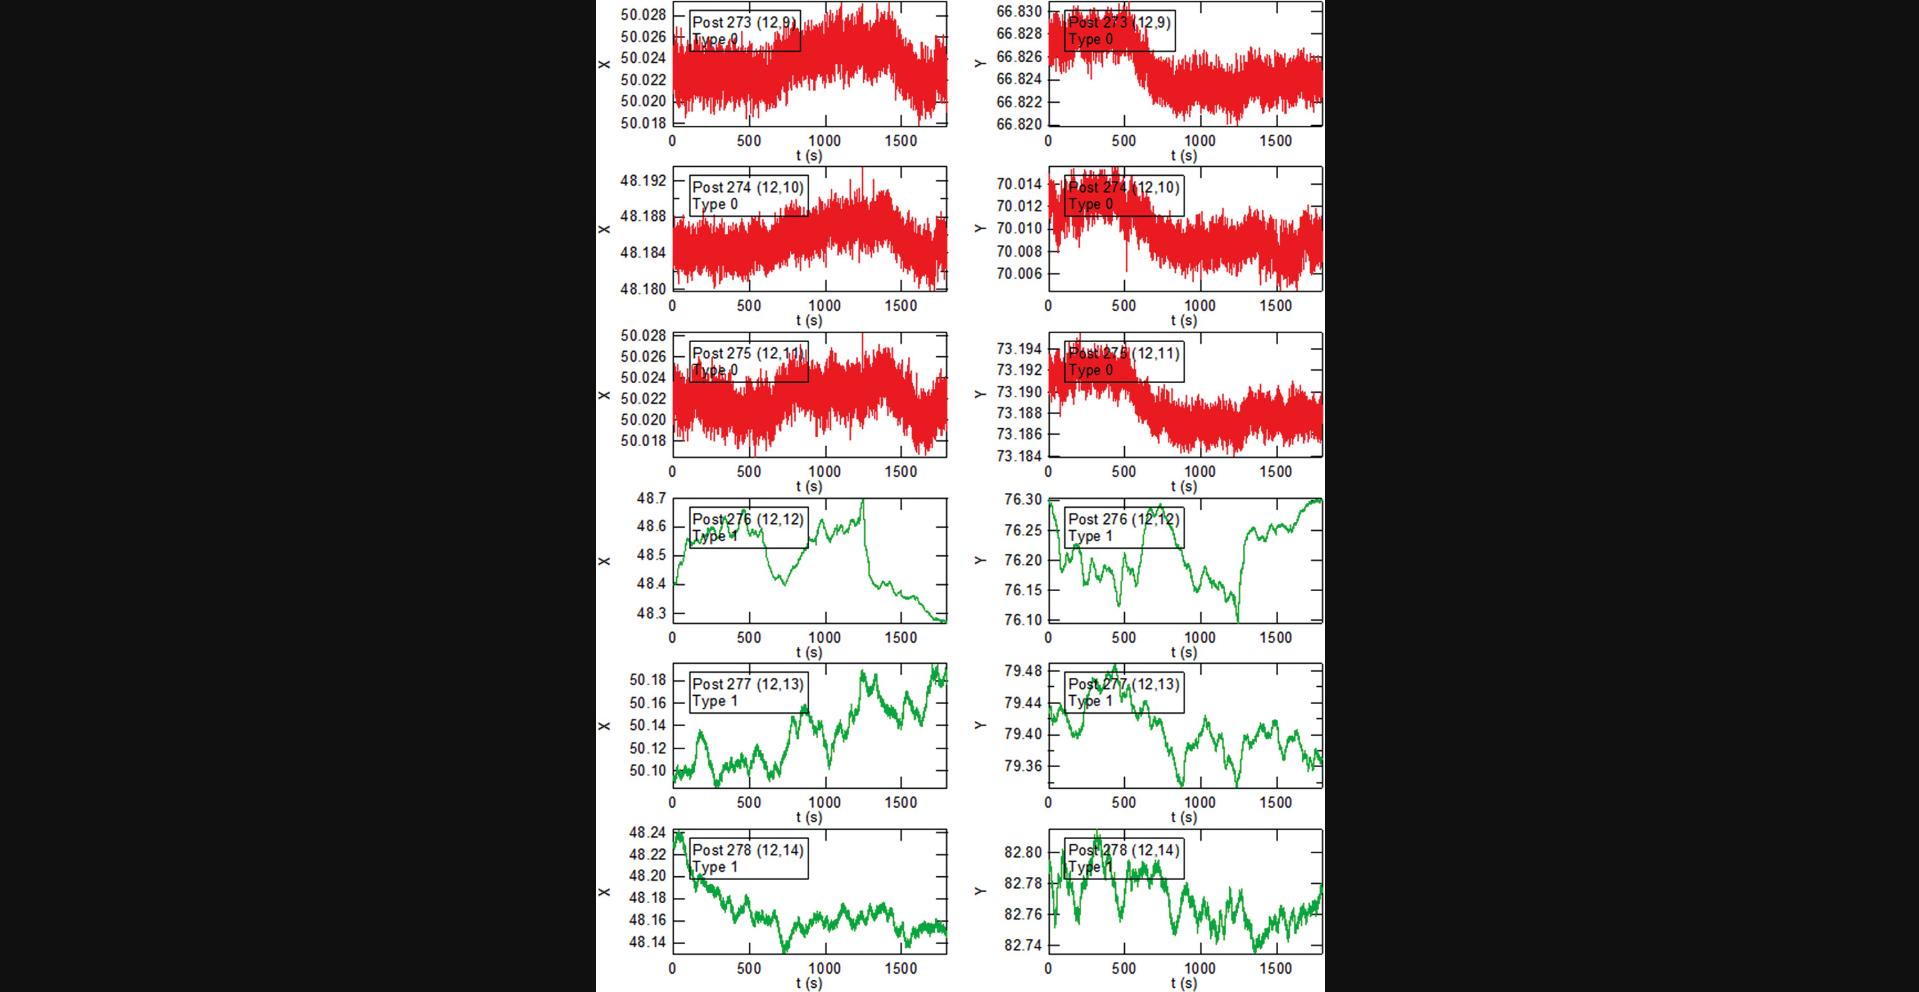
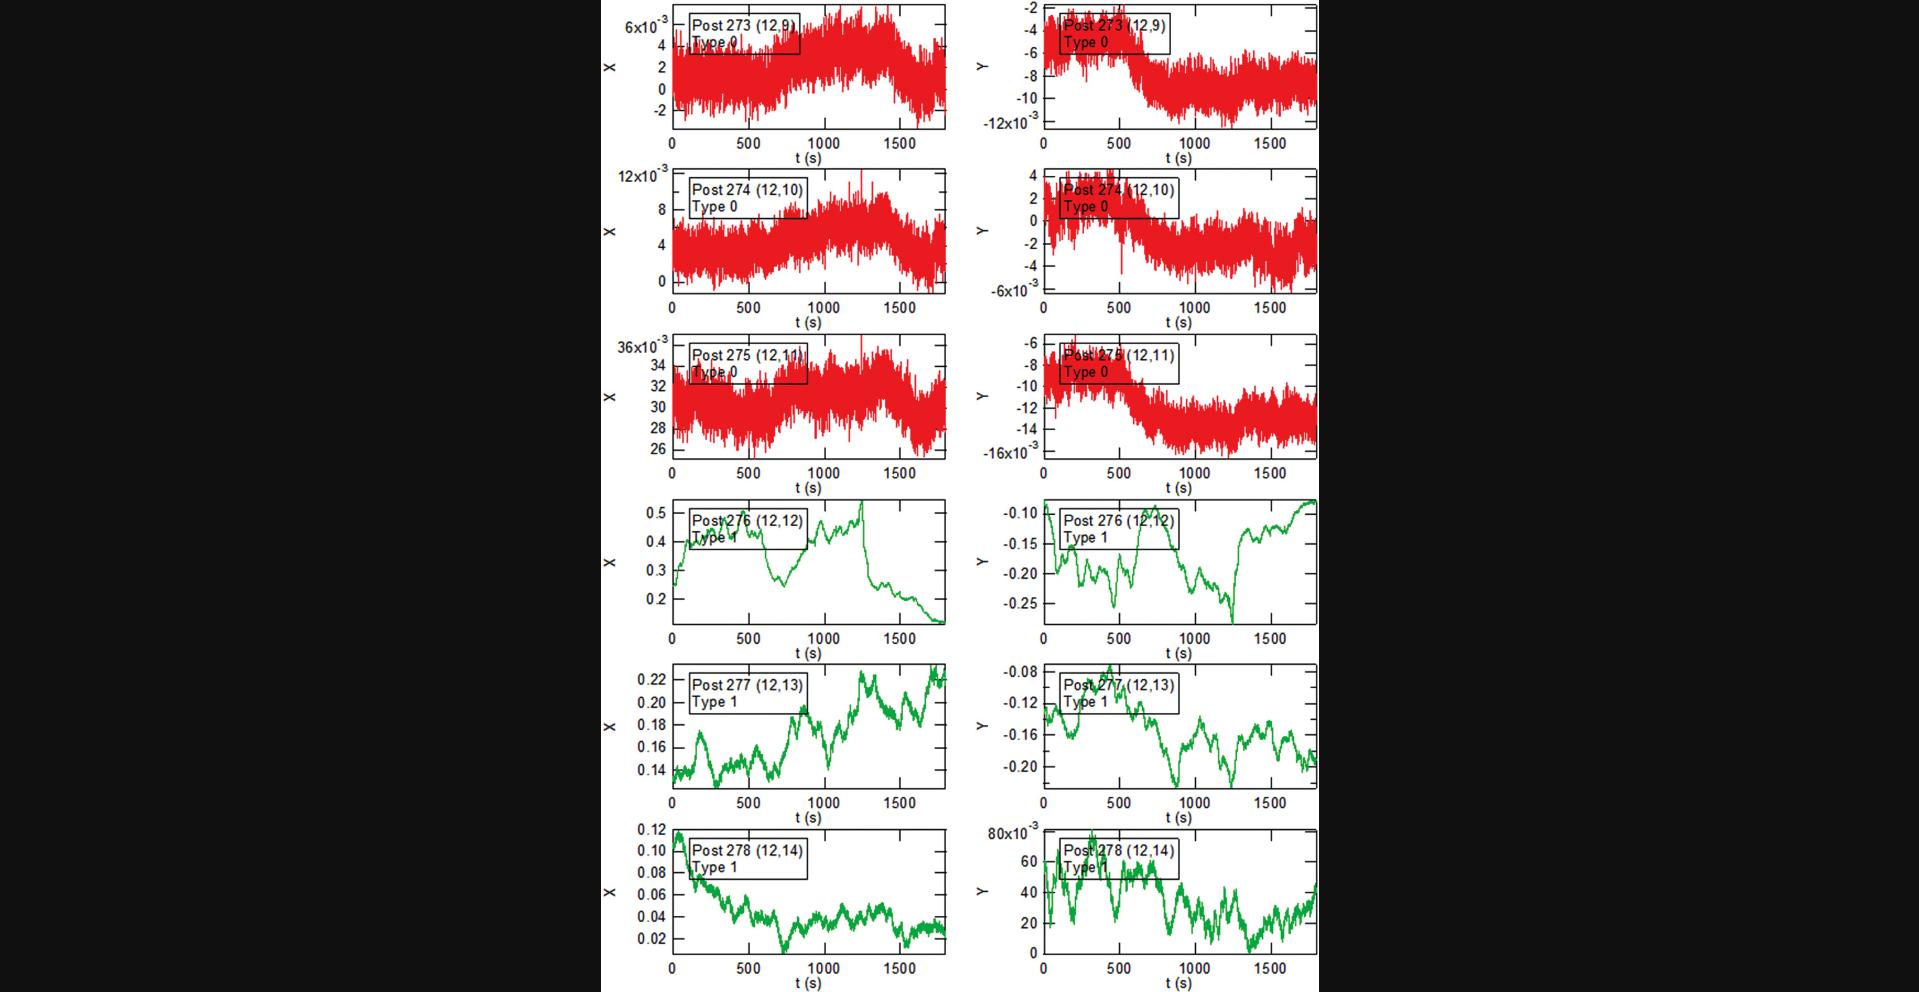
Basic Protocol Basic Protocol 5. The oscillation of a magnetic post in response to the two-frequency, sinusoidal, driving magnetic field yields post motions such as that shown in Figure 31A, where the oscillations at both frequencies can be seen over the experimental noise. Such oscillations show considerable time dependence in their amplitudes. An example of this time dependence is shown in Figure 30B, in which significant noise is produced in the measurements of the response x(ω) (Fig. 31C, raw signal). However, it is important to note that the amplitudes of the responses at the two frequencies are correlated in time, an effect that can be attributed to time dependence in the cell's coupling to the post (Massiera et al., 2007). Thus, a significant reduction in the uncertainty of the frequency dependence of x(ω) is obtained by the ratiometric analysis described above (Fig. 31C, ratio signal). The frequency-dependent stiffness of the cell + post k(ω) = F(ω)/x(ω) (Fig. 31D) is determined from x(ω) and the magnetic force. The stiffness of the post alone Kpost(ω) is determined by remeasuring the response of the post alone (Fig. 31D), and then the final result kcell(ω) is determined from the difference between these two measurements (Fig. 31E).
Basic Protocol Basic Protocol 6. The measurements of cellular fluctuations (Basic Protocols 2 and 4) yield time traces of the displacements of the microposts in contact with a cell, such as the examples shown in Figures 39 and 30A. Such fluctuating motion is typically characterized in terms of its mean square displacement (MSD) <Δr2(τ)> = <(r(t+τ) - r(t))2> (Equation 13), where τ is the lag time. Examples of typical MSDs for individual posts are shown in Figure 30B. These data display a noise floor at short τ and then power-law behavior, with the MSD ∝ τα for 1-2 decades in τ. This power-law exponent is typically > 1, with larger values for posts near the periphery of the cell. To ensure sufficient data are available for the MSDs, one should only compute the MSDs for τ up to ∼1/5 of the video length. To measure the MSD exponent α for each post, the software in Protocol 6 first obtains a post's noise floor by fitting the MSD trace for τ ≤ 1 s to the form MSD = C + Dτq (Equation 15), and then subtracts the constant C from the MSD traces to obtain the “subtracted MSD,” MSDSub. It then calculates the logarithmic time derivative
A key output of this protocol is the production of spatial maps of the MSD exponent (see Fig. 30C) and magnitude (see Fig. 30D). The output of the Basic Protocol 6 software that identifies sets of posts associated with stress fibers and the actomyosin cortex based on the posts’ average traction force is illustrated in Figure 30E-G. Here, for cells on microposts with spring constant k = 15.7 nN/µm, we identify the posts as stress fiber-associated if their average traction forces are larger than 5 nN, and as cortical posts if their maximum traction force is less than 2 nN. This bifurcation procedure provides clean data sets that can form the basis for subsequent analysis of cytoskeletal dynamics. We have used such data to study cytoquake phenomena and other aspects of cytoskeletal fluctuations (Shi et al., 2019; Shi et al., 2021).
Time Considerations
In Basic Protocol 1, embedding nanowires into micropost molds takes approximately 2-3 hr. The majority of this time is waiting for the ethanol to evaporate from the nanowire solution. Casting PDMS in molds takes 30 min, followed by baking overnight. Fabrication of magnetic nanowires takes about 30 min to set up, and the electrodeposition takes 20-30 min. Extracting nanowires takes about 1 hr of the operator's time and 12-18 hr of wait time.
In Basic Protocol 2, cell seeding takes approximately 30 min, then the cells adhere and spread on the posts overnight. Imaging takes 10-20 min to set up the microscope and optimize imaging parameters and 30 min for settling to thermal equilibrium. The actual imaging time then depends on the length of observation desired. For half-hour observations per cell, it is typically possible to measure 7 to 8 cells from a single substrate in a single day.
In Basic Protocol 3, setting up the Streampix script takes about 15 min. Microscope setup (including setting up magnetic tweezers and optimizing image parameters) takes about 30 min. Each cell takes about 30 min to scan across all frequencies from 0.1 to 135 Hz.
In Basic Protocol 4, setting up the grid for localizing micropost centers and creating hand-drawn cell masks takes about 10 min per cell. For 17 videos taken at 100 fps from 3 min to 30 s (following the recording script described in Basic Protocol 4) with ∼1000 posts (30 × 30 grid, approximately the whole ROI of our CCD camera when using a 40× objective), it will take 10 hr to analyze on a Dell Precision Tower 5810 PC.
In Basic Protocol 5, digital lock-in calculations of all micropost trajectories across all frequencies take about 30 min. Calculating the rheology curve of magnetic microposts takes about 5 min.
In Basic Protocol 6, MSD calculations take about 1 hr on the aforementioned data (180,000 frame videos). Generating a mask of cell-associated posts based on MSD exponents takes 30 min, and bifurcating cortical and stress fiber-associated posts takes about 5 min.
Acknowledgments
This work was supported by the National Heart, Lung and Blood Institute of the National Institutes of Health grant number HL-127087, and the National Science Foundation grant PHY-1915193 at Johns Hopkins University, and by the National Science Foundation grant PHY-1915174 at the University of Pennsylvania. We thank C. S. Chen for providing MPAD masters.
Author Contributions
Yu Shi : Conceptualization, Formal analysis, Investigation, Methodology, Software, Validation, Visualization, Original draft, review, and editing; Shankar Sivarajan : Investigation, Software, Validation, Visualization, Original draft, review, and editing; John C. Crocker : Conceptualization, Formal analysis, Funding acquisition, Investigation, Methodology, Project administration, Supervision, Original draft, review, and editing; Daniel H. Reich : Conceptualization, Data curation, Formal analysis, Funding acquisition, Methodology, Project administration, Software, Supervision, Original draft, review, and editing.
Conflict of Interest
The authors declare no conflict of interest.
Open Research
Data Availability Statement
The data, tools, and material (or their source) that support the protocol are available from the corresponding author upon reasonable request.
Literature Cited
- Alencar, A. M., Ferraz, M. S. A., Park, C. Y., Millet, E., Trepat, X., Fredberg, J. J., & Butler, J. P. (2016). Non-equilibrium cytoquake dynamics in cytoskeletal remodeling and stabilization. Soft Matter , 12(41), 8506–8511. doi: 10.1039/c6sm01041e
- Bose, P., Huang, C. Y., Eyckmans, J., Chen, C. S., & Reich, D. H. (2018). Fabrication and mechanical properties measurements of 3D microtissues for the study of cell-matrix interactions Methods in Molecular Biology , 1722, 303–328. doi: 10.1007/978-1-4939-7553-2_18
- Crocker, J. C., & Grier, D. G. (1996). Methods of digital video microscopy for colloidal studies. Journal of Colloid and Interface Science , 179(1), 298–310. doi: 10.1006/jcis.1996.0217
- Dixon, P. K., & Wu, L. (1989). Broad-band digital lock-in amplifier techniques. Review of Scientific Instruments , 60(10), 3329–3336. doi: 10.1063/1.1140523
- du Roure, O., Saez, A., Buguin, A., Austin, R. H., Chavrier, P., Siberzan, P., & Ladoux, B. (2005). Force mapping in epithelial cell migration. Proceedings of the National Academy of Sciences , 102(7), 2390–2395. doi: 10.1073/pnas.0408482102
- Fabry, B., Maksym, G. N., Butler, J. P., Glogauer, M., Navajas, D., & Fredberg, J. J. (2001). Scaling the microrheology of living cells. Physical Review Letters , 87(14), 148102. doi: 10.1103/PhysRevLett.87.148102
- Felton, E. J. (2009). Applications of magnetic nanostructures to cell patterning and heterotypic cell-cell interactions. (Ph.D. Ph.D.). Johns Hopkins University, Baltimore.
- Floyd, C., Levine, H., Jarzynskie, C., & Papoian, G. A. (2021). Understanding cytoskeletal avalanches using mechanical stability analysis. Proceedings of the National Academy of Sciences of the United States of America , 118(41), e2110239118. doi: 10.1073/pnas.2110239118
- Fu, J. P., Wang, Y. K., Yang, M. T., Desai, R. A., Yu, X. A., Liu, Z. J., & Chen, C. S. (2010). Mechanical regulation of cell function with geometrically modulated elastomeric substrates. Nature Methods , 7(9), 733–736. doi: 10.1038/nmeth.1487
- Geng, Y. X., & Wang, Z. J. (2016). Review of cellular mechanotransduction on micropost substrates. Medical and Biological Engineering and Computing , 54(2-3), 249–271. doi: 10.1007/s11517-015-1343-2
- Guo, M., Ehrlicher, A. J., Jensen, M. H., Renz, M., Moore, J. R., Goldman, R. D., … Weitz, D. A. (2014). Probing the stochastic, motor-driven properties of the cytoplasm using force spectrum microscopy. Cell , 158, 822–832. doi: 10.1016/j.cell.2014.06.051
- Hecht, F. M., Rheinlaender, J., Schierbaum, N., Goldmann, W. H., Fabry, B., & Schaffer, T. E. (2015). Imaging viscoelastic properties of live cells by AFM: Power-law rheology on the nanoscale. Soft Matter , 11(23), 4584–4591. doi: 10.1039/c4sm02718c
- Hoffman, B. D., Massiera, G., Van Citters, K. M., & Crocker, J. C. (2006). The consensus mechanics of cultured mammalian cells. Proceedings of the National Academy of Sciences of the United States of America , 103(27), 10259–10264. doi: 10.1073/pnas.0510348103
- Hultgren, A., Tanase, M., Chen, C. S., & Reich, D. H. (2004). High-yield cell separations using magnetic nanowires. IEEE Transactions on Magnetics , 40(4), 2988–2990. doi: 10.1109/TMAG.2004.830406
- Hultgren, A., Tanase, M., Felton, E. J., Bhadriraju, K., Salem, A. K., Chen, C. S., & Reich, D. H. (2005). Optimization of yield in magnetic cell separations using nickel nanowires of different lengths. Biotechnology Progress , 21(2), 509–515. doi: 10.1021/bp049734w
- Kilpatrick, J. I., Revenko, I., & Rodriguez, B. J. (2015). Nanomechanics of Cells and Biomaterials Studied by Atomic Force Microscopy. Advanced Healthcare Materials , 4(16), 2456–2474. doi: 10.1002/adhm.201500229
- Kramer, C. M. (2009). Probing the dynamics of cellular traction forces with magnetic and non-magnetic micropost arrays. (Ph.D. Ph.D.). Johns Hopkins University, Baltimore.
- Lau, A. W. C., Hoffman, B. D., Davies, A., Crocker, J. C., & Lubensky, T. C. (2003). Microrheology, stress fluctuations, and active behavior of living cells. Physical Review Letters , 91(19), 198101. doi: 10.1103/PhysRevLett.91.198101
- Li, M., Dang, D., Liu, L. Q., Xi, N., & Wang, Y. C. (2017). Atomic force microscopy in characterizing cell mechanics for biomedical applications: A review. Ieee Transactions on Nanobioscience , 16(6), 523–540. doi: 10.1109/Tnb.2017.2714462
- Lin, Y. C., Kramer, C. M., Chen, C. S., & Reich, D. H. (2012). Probing cellular traction forces with magnetic nanowires and microfabricated force sensor arrays. Nanotechnology , 23, 075101. doi: 10.1088/0957-4484/23/7/075101
- Lohner, J., Rupprecht, J. F., Hu, J., Mandriota, N., Saxena, M., Pitta de Araujo, D., … Sheetz, M. P. (2019). Large and reversible myosin-dependent forces in rigidity sensing. Nature Physics , 15, 689–695. doi: 10.1038/s41567-019-0477-9
- Martino, F., Perestrelo, A. R., Vinarsky, V., Pagliari, S., & Forte, G. (2018). Cellular Mechanotransduction: from tension to function. Frontiers in Physiology , 9, 824. doi: 10.3389/fphys.2018.00824
- Massiera, G., Van Citters, K. M., Biancaniello, P. L., & Crocker, J. C. (2007). Mechanics of single cells: Rheology, time dependence, and fluctuations. Biophysical Journal , 93(10), 3703–3713. doi: 10.1529/biophysj.107.111641
- Mohammed, D., Versaevel, M., Bruyere, C., Alaimo, L., Luciano, M., Vercruysse, E., … Gabriele, S. (2019). Innovative tools for mechanobiology: Unraveling outside-in and inside-out mechanotransduction. Frontiers in Bioengineering and Biotechnology , 7, 162. doi: 10.3389/fbioe.2019.00162
- Plotnikov, S. V., Sabass, B., Schwarz, U. S., & Waterman, C. M. (2014). High-resolution traction force microscopy. Quantitative Imaging in Cell Biology , 123, 367–394. doi: 10.1016/B978-0-12-420138-5.00020-3
- Rovner, J. B. (2013). The static and dynamic properties of colloidal inclusions in nematic liquid crystals. (Ph.D. Ph.D.). Johns Hopkins University, Baltimore.
- Shi, Y. (2020). Dissecting cytoskeletal dynamics with active micropost arrays. (Ph.D. Ph.D.). Johns Hopkins University, Baltimore.
- Shi, Y., Porter, C. L., Crocker, J. C., & Reich, D. H. (2019). Dissecting fat-tailed fluctuations in the cytoskeleton with active micropost arrays. Proceedings of the National Academy of Sciences , 116(28), 13839–13846. doi: 10.1073/pnas.1900963116
- Shi, Y., Sivarajan, S., Xiang, K. M., Kostecki, G. M., Tung, L., Crocker, J. C., & Reich, D. H. (2021). Pervasive cytoquakes in the actomyosin cortex across cell types and substrate stiffness. Integrative Biology , 13(10), 246–257. doi: 10.1093/intbio/zyab017
- Smith, B. A., Tolloczko, B., Martin, J. G., & Grutter, P. (2005). Probing the viscoelastic behavior of cultured airway smooth muscle cells with atomic force microscopy: Stiffening induced by contractile agonist. Biophysical Journal , 88(4), 2994–3007. doi: 10.1529/biophysj.104.046649
- Sniadecki, N. J., Anguelouch, A., Yang, M. T., Lamb, C. M., Liu, Z., Kirschner, S. B., … Chen, C. S. (2007). Magnetic microposts as an approach to apply forces to living cells. Proceedings of the National Academy of Sciences , 104(37), 14553–14558. doi: 10.1073/pnas.0611613104
- Sniadecki, N. J., Lamb, C. M., Liu, Y., Chen, C. S., & Reich, D. H. (2008). Magnetic microposts for mechanical stimulation of biological cells: Fabrication, characterization, and analysis. Review of Scientific Instruments , 79(4), 044302. doi: 10.1063/1.2906228
- Tan, J. L., Tien, J., Pirone, D. M., Gray, D. S., Bhadriraju, K., & Chen, C. S. (2003). Cells lying on a bed of microneedles: An approach to isolate mechanical force. Proceedings of the National Academy of Sciences of the United States of America , 100(4), 1484–1489. doi: 10.1073/pnas.0235407100
- Tanase, M., Felton, E. J., Gray, D. S., Hultgren, A., Chen, C. S., & Reich, D. H. (2005). Assembly of multicellular constructs and microarrays of cells using magnetic nanowires. Lab on a Chip , 5(6), 598–605. doi: 10.1039/B500243E
- Trepat, X., Deng, L. H., An, S. S., Navajas, D., Tschumperlin, D. J., Gerthoffer, W. T., … Fredberg, J. J. (2007). Universal physical responses to stretch in the living cell. Nature , 447(7144), 592–595. doi: 10.1038/nature05824
- Wei, M. T., Zaorski, A., Yalcin, H. C., Wang, J., Hallow, M., Ghadiali, S. N., … Ou-Yang, H. D. (2008). A comparative study of living cell micromechanical properties by oscillatory optical tweezers. Optics Express , 16(12), 8594–8603. doi: 10.1364/OE.16.008594
- Weng, S. N., & Fu, J. P. (2011). Synergistic regulation of cell function by matrix rigidity and adhesive pattern. Biomaterials , 32(36), 9584–9593. doi: 10.1016/j.biomaterials.2011.09.006
- Wolfenson, H., Meacci, G., Liu, S. M., Stachowiak, M. R., Iskratsch, T., Ghassemi, S., … Sheetz, M. P. (2016). Tropomyosin controls sarcomere-like contractions for rigidity sensing and suppressing growth on soft matrices. Nature Cell Biology , 18(1), 33–42. doi: 10.1038/ncb3277
- Yang, M. T., Fu, J. P., Wang, Y. K., Desai, R. A., & Chen, C. S. (2011). Assaying stem cell mechanobiology on microfabricated elastomeric substrates with geometrically modulated rigidity. Nature Protocols , 6(2), 187–213. doi: 10.1038/nprot.2010.189
- Zhao, R., Boudou, T., Wang, W. G., Chen, C. S., & Reich, D. H. (2013). Decoupling cell and matrix mechanics in engineered microtissues using magnetically actuated microcantilevers. Advanced Materials , 25(12), 1699–1705. doi: 10.1002/adma.201203585
- Zhao, R., Boudou, T., Wang, W. G., Chen, C. S., & Reich, D. H. (2014). Magnetic approaches to study collective 3D cell mechanics in long-term cultures (invited). Journal of Applied Physics , 115, 172616. doi: 10.1063/1.4870918
Internet Resources
- The Streampix module files and Igor Pro procedure files needed to run experiments and analyze data are available on Github at https://github.com/yushi1898/MPAD-Analysis-Code.

