A OneStep Solution to Fix and Stain Cells for Correlative Live and Fixed Microscopy
Katrina B. Velle, Katrina B. Velle, Carline Fermino do Rosário, Carline Fermino do Rosário, Patricia Wadsworth, Patricia Wadsworth, Lillian K. Fritz-Laylin, Lillian K. Fritz-Laylin
Abstract
Correlating the location of subcellular structures with dynamic cellular behaviors is difficult when working with organisms that lack the molecular genetic tools needed for expressing fluorescent protein fusions. Here, we describe a protocol for fixing, permeabilizing, and staining cells in a single step while imaging on a microscope. In contrast to traditional, multi-step fixing and staining protocols that take hours, the protocol outlined here achieves satisfactory staining within minutes. This approach takes advantage of well-characterized small molecules that stain specific subcellular structures, including nuclei, mitochondria, and actin networks. Direct visualization of the entire process allows for rapid optimization of cell fixation and staining, as well as straightforward identification of fixation artifacts. Moreover, live imaging prior to fixation reveals the dynamic history of cellular features, making it particularly useful for model systems without the capacity for expressing fluorescent protein fusions. © 2021 The Authors. Current Protocols published by Wiley Periodicals LLC.
Basic Protocol : Fixing, permeabilizing, and staining mammalian cells in one step on the microscope
INTRODUCTION
Cell staining is a widely used technique in cell biology that allows visualization of cellular structures, often in fixed cells. Protocols for fixing and staining generally require multiple steps that take hours to complete, and preclude the association of cell dynamics with staining results. Here, we present a protocol for imaging cells while fixing and staining by adding a single “OneStep” solution containing a fixative, a detergent, and fluorescent dyes. This combined fixation and staining protocol has three main advantages compared to traditional staining protocols: (1) it saves time—we can achieve satisfactory staining in minutes instead of hours; (2) it allows direct comparison of the same cell before and after staining—this means that any artifacts due to buffers, detergents, or fixatives are immediately apparent, allowing for quick optimization; and (3) cellular structures and behaviors observed prior to fixation are easily correlated with subcellular localization information obtained by staining. This ability to correlate subcellular localization with cellular function makes this protocol especially advantageous for studies of non-traditional model organisms that lack the capacity for expressing fluorescent protein fusions.
Here, we provide a detailed protocol for performing a OneStep fixation and staining of mammalian cells while filming. We outline steps for optimizing this protocol for use with other cell types, and describe the modifications we made for its use with Naegleria gruberi amoebae and the chytrid fungus Batrachochytrium dendrobatidis.
CAUTION : This protocol involves the use of paraformaldehyde (PFA)–containing solutions. Please consult with your institution's environmental health and safety department, as recommendations for working with PFA may vary. If appropriate, this hazard can be mitigated by using a microscope that fits inside a chemical fume hood (see Figure S1 in Supporting Information).
Basic Protocol: FIXING, PERMEABILIZING, AND STAINING MAMMALIAN CELLS IN A SINGLE STEP ON THE MICROSCOPE
Materials
- Cells
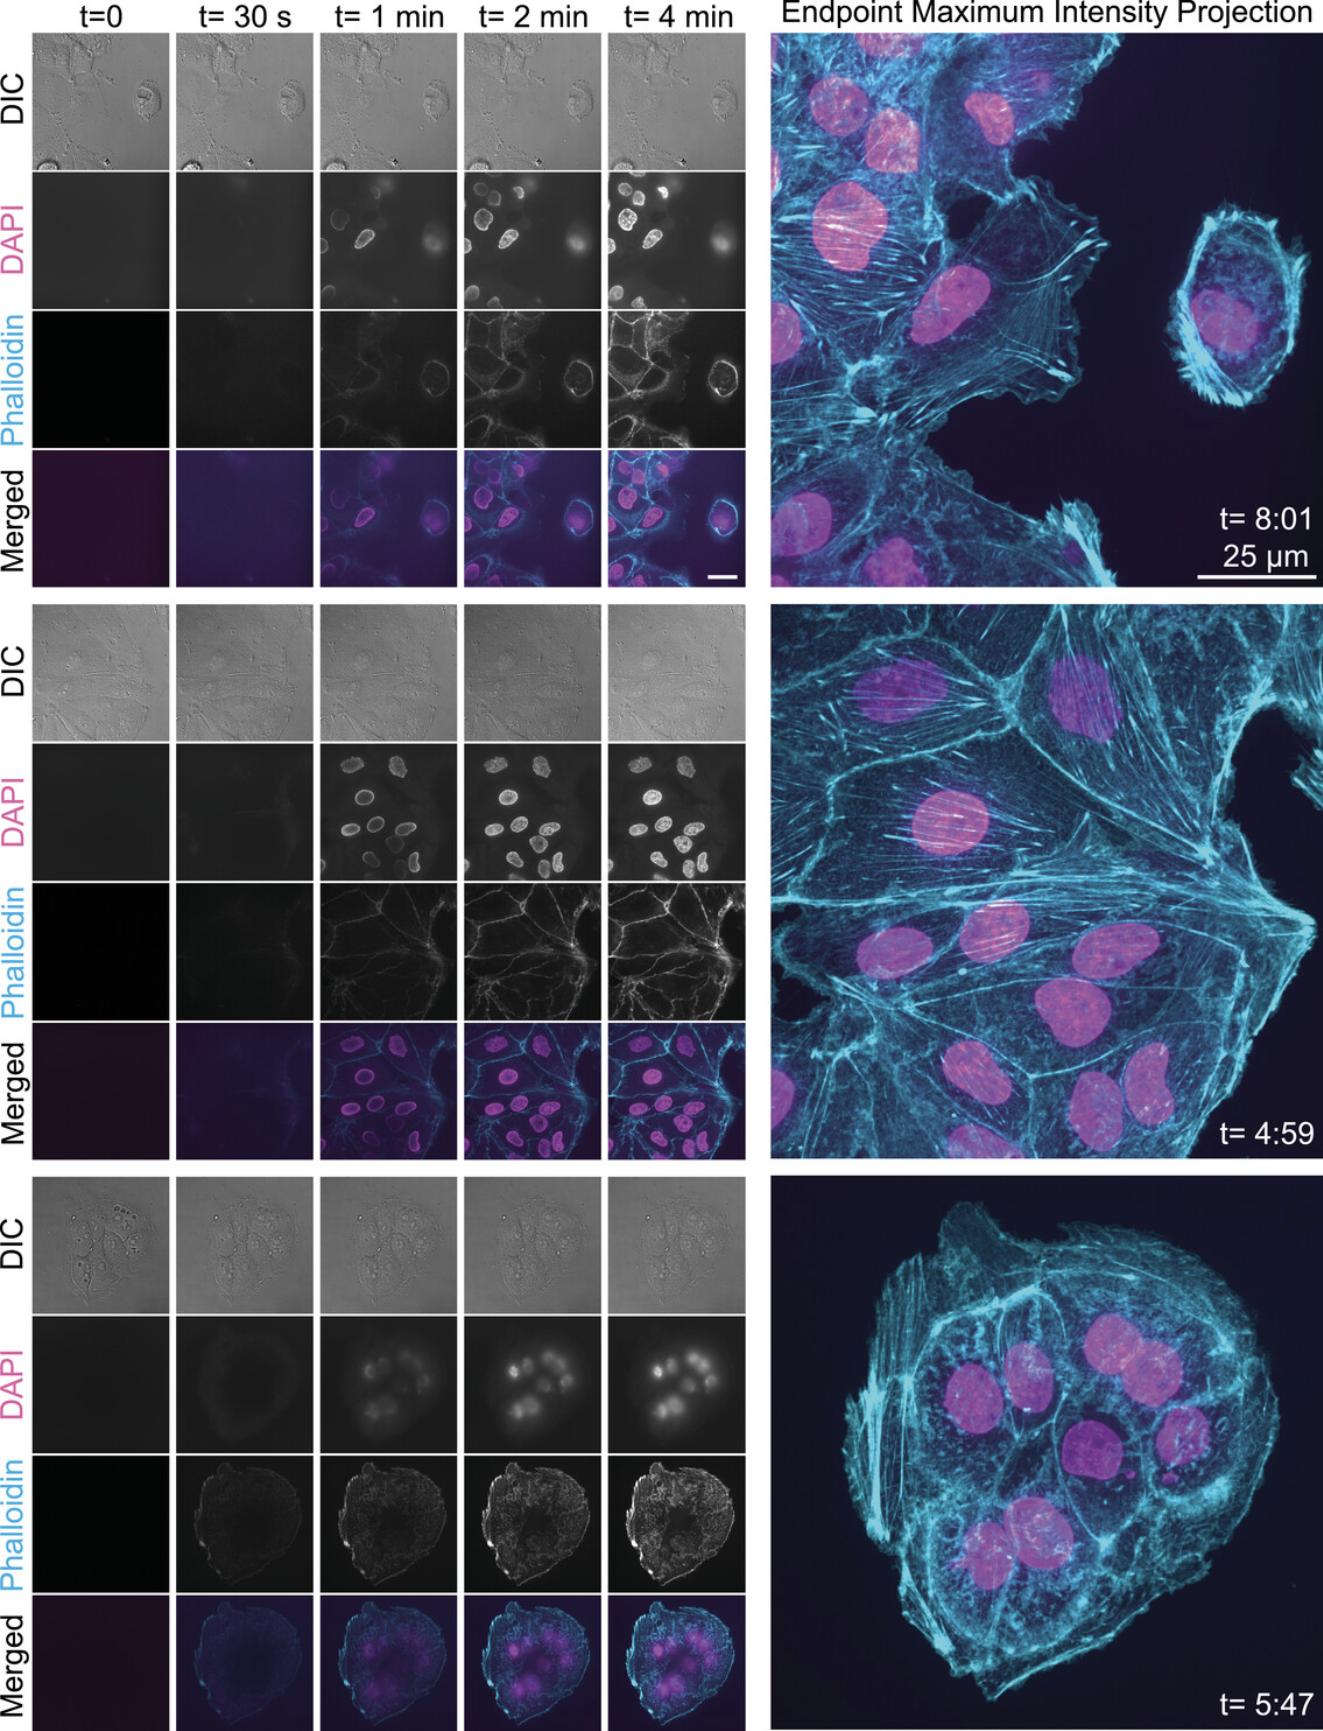
- The type of cells can vary. In the example shown in Figure 1 , we used an LLC-Pk1 pig kidney epithelial cell line.

-
0.25% trypsin-EDTA (ThermoFisher; 25200-056) if needed to detach adherent cells
-
Cell culture medium
- The type of medium can vary. In the example shown in Figure 1 , we grew the cells in a 1:1 mixture of Opti-MEM and F-10 medium supplemented with 7.5% fetal bovine serum and 1% antibiotic/antimycotic.
-
OneStep Solution (optimized for LLC-Pk1 pig kidney epithelial cells; see recipe)
-
Type B immersion oil for microscopy (Cargille; 16484) or similar immersion oil
-
Imaging plate: 96-well glass-bottom plate (Brooks; MGB096-1-2-LG-L), or similar glass bottom dish
-
1.5-ml microcentrifuge tubes (Capp; 5101505, or similar)
-
Micropipettes and micropipette tips (P-2.5, P-20, P-200, P-1000)
-
Fluorescence microscope with a camera capable of time-lapse imaging.
- For Figures 1 - 3 , we used a Nikon Ti2 eclipse equipped with a Plan Apo λ 100 × oil objective (1.45 NA), a Crest spinning disk (50 μm), a Prime 95B CMOS camera, and a Spectra III/Celesta light source (with excitation wavelengths of 405, 477, 546, and 638 nm). This microscope was controlled through NIS Elements software.
-
Chemical hood for preparing paraformaldehyde solutions
-
Tissue culture hood for seeding mammalian cells (any Class II Type A2 Biological Safety Cabinet)
-
A humidified incubator set to 37°C + 5% CO2
1.Seed cells into imaging plates or dishes.
2.Prepare a “2×” OneStep solution on the day of the experiment.
3.Gently aspirate the medium out of the wells.
4.Gently add 150 μl of PBS to each well.
5.Begin imaging the cells using fluorescence and DIC or phase/contrast microscopy as a time series.
6.After a few minutes (or as long as you would like to observe the live cells), add 150 μl of the appropriate OneStep solution to the imaging well. Continue imaging until you are satisfied with the staining intensity. We typically image until the fluorescence signal plateaus.

REAGENTS AND SOLUTIONS
Phosphate-buffered saline (PBS) 10×
- 80 g/L NaCl (Fisher; BP358-1)
- 2 g/L KCl (Fisher; P217-500)
- 14.4 g/L Na2HPO4 (Sigma Aldrich; S9763-1KG)
- 2.4 g/L KH2PO4 (Sigma Aldrich; P0662-1KG),
- Adjust pH to 7.4
- Bring up volume to 1 L
- Autoclave
- Store at room temperature
OneStep Solution (to make 1 ml, optimized for LLC-Pk1 pig kidney epithelial cells)
- 532.5 μl of 1× PBS (make 1× from 10× stock; see recipe)
- 5 μl of 10% Triton X-100 (Promega; H5142) or NP-40 Alternative (Millipore 492016-500 ml); make a 10% solution in PBS, vortex to mix (final concentration: 0.05%)
- 462.5 μl of 16% paraformaldehyde (PFA; Electron Microscopy Sciences; final concentration, 7.4%)
- 2 μl of 1 mg/ml DAPI (4′,6-diamidino-2-phenylindole; Life Technologies; D1306; final concentration 2 μg/ml)
- 4 μl of ∼66 µM Alexa Fluor™ 568 Phalloidin (Invitrogen; A12380) in DMSO (final concentration 132 nM); or substitute another labeled phalloidin
- Protect from light, use the same day
CAUTION: Paraformaldehyde should be added in a fume hood to avoid inhalation. Please consult with your institution's environmental health and safety division, as recommendations for best practices for working with PFA vary.
COMMENTARY
Background Information
Distinct types of microscopy have unique advantages for visualizing cell structures and/or behaviors. For example, light microscopy can be used to observe the behavior of virtually any cell type, while electron microscopy can reveal subcellular structures at much higher resolution in fixed cells. To take advantage of more than one type of microscopy at a time, cell biologists have developed several techniques to correlate data from multiple imaging modalities (Fernandes, Saavedra-Villanueva, Margeat, Milhiet, & Costa, 2020; Gómez-Varela et al., 2020; Navikas et al., 2021; Phillips et al., 2020). For example, Correlative Light and Electron Microscopy (CLEM) allows direct association of light microscopy data (e.g., fluorescent protein localization) with higher-resolution electron microscopy (reviewed in de Boer, Hoogenboom, & Giepmans, 2015). Additionally, protocols for conducting in situ immunofluorescence on a microscope allow biologists to correlate live cell imaging data with that from super-resolution microscopy (Bálint, Verdeny Vilanova, Sandoval Álvarez, & Lakadamyali, 2013; Tam et al., 2014).
Cells are densely packed with organelles, proteins, and a plethora of small molecules. To allow detection of specific cellular structures within this teeming mass, cell biologists have also developed a variety of dyes and staining procedures. These staining procedures typically include a series of distinct steps, which take hours. Although this approach is appropriate for many applications, some cell dyes do not require such complex protocols, and can label subcellular structures in a single step (Taylor, 1980).
We developed this OneStep protocol to combine the simplicity of single-step staining with correlative microscopy. This approach allows rapid association of live cell behavior with the visualization of underlying cellular structures. We recently employed this protocol to determine that actively growing, filopodia-like structures in Naegleria gruberi were filled with polymerized actin (Velle & Fritz-Laylin, 2020). While particularly advantageous for this and other emerging model systems that lack robust genetic tools, we also use this OneStep staining protocol to rapidly correlate behaviors and structures in genetically tractable systems.
Critical Parameters
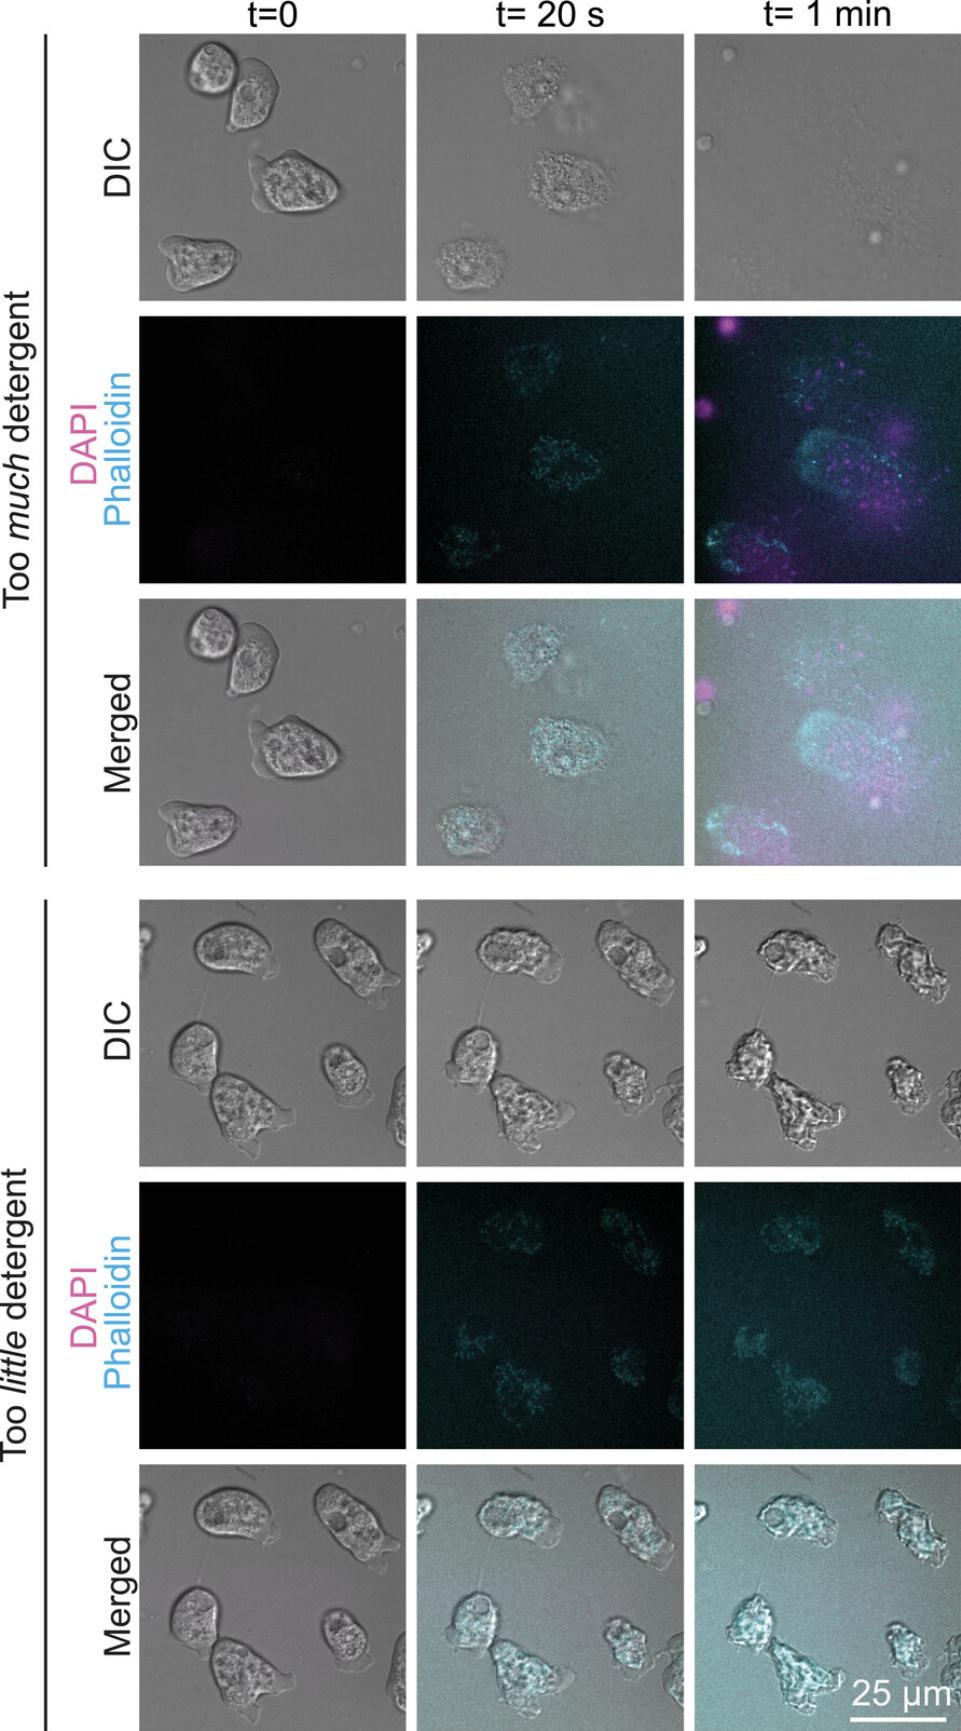
To adapt this protocol to a new cell type, titrating detergent and fixative concentrations is key. Too much detergent dissolves membranes rapidly, causing cytoplasm and entire organelles to leak out and drift away before they can be crosslinked in place (Fig. 3, top). Too little detergent leaves cells impermeable to dyes, and can cause fixation artifacts such as shrivelling (Fig. 3, bottom). Because fixative concentration can also influence these outcomes, we advise setting up a parameter matrix to empirically determine the appropriate concentration of both detergent and fixative for each cell type. We suggest starting with at least three detergent concentrations between ∼0.005% and ∼0.1%, and three dilutions of PFA ranging from 1.8% to 8%. See Table 1 for additional troubleshooting information, and Table 2 for example parameters that were successful in our experiments with three distinct cell types.

| Problem | Possible cause | Solution(s) |
|---|---|---|
| Cytosol spills out of cells (Fig. 3, top) | Too much detergent or too little fixative | Try using detergent at half the strength first. If the problem persists, and further adjustments of detergent concentration do not resolve the issue, also try a higher concentration of PFA. |
| Cells shrivel | Not enough detergent, or the osmotic strength of the buffer is too high | Try using a higher concentration of detergent and less PFA, and/or adjust the buffer composition to lower the osmolarity |
|
Cells shrivel and do not stain (Fig. 3, bottom) |
Not enough detergent | Try using higher concentrations of detergent |
| Cells show signs of phototoxicity before fixation | Illumination used to detect fluorescent signal is damaging cells | Set the software to only image every other frame with fluorescence, and/or adjust the exposure settings to allow the use of less light intensity |
| Cell type | Buffer system | Fixative | Detergent | Staining |
|---|---|---|---|---|
| Mammalian cells (LLC-Pk1 pig kidney epithelial cells, Fig. 1) | PBS | 7.4% PFA | 0.05% Triton X-100 |
2 μg/ml DAPI + 132 nM labeled phalloidin |
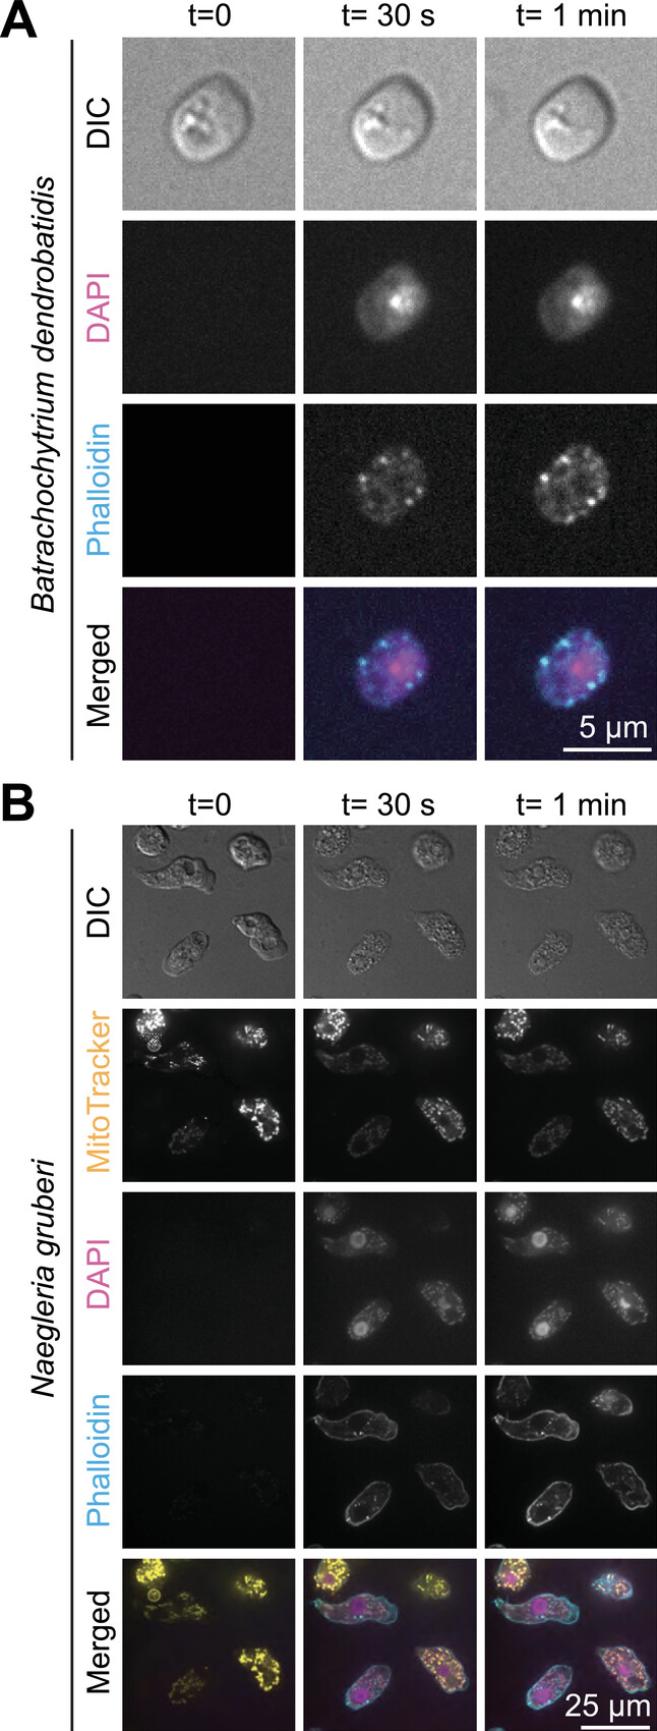
| Amoeboid cells (Naegleria gruberi, NEG-M, Fig. 2B) | 130 mM sucrose + 50 mM sodium phosphate buffer, pH 7.2 | 3.6% PFA | 0.025% NP-40 Alternative | |
| Chytrid fungi (Batrachochytrium dendrobatidis, Fig. 2A) | 65 mM sucrose + 25 mM sodium phosphate buffer, pH 7.2 | 4% PFA | 0.1% NP-40 Alternative |
Another critical aspect of this protocol is even mixing of the OneStep solution with the sample. We use a “2×” concentration of OneStep solution so that we can add an equal volume to the sample, which provides adequate mixing. Adding a smaller volume of a higher concentration may result in fixative and detergent concentrations that are locally concentrated or diluted. This variability will make optimization difficult.
In addition to the concentration and mixing of OneStep solution, consideration should also be given to the suitability of the sample for this type of protocol. Samples that are thick (e.g., embryos, tissue slices) may require additional time for the solution to penetrate, and may demand further optimization. Cells that are weakly adherent or non-adherent may also detach or drift when the solution is added. We have avoided this by using tissue culture−treated glass for Naegleria cells, and concanavalin A−coated glass for B. dendrobatidis.
Troubleshooting
Table 1 lists problems that may arise with the protocol along with their possible causes and solutions.
Understanding Results
We have used this protocol to visualize actin polymer networks and DNA in three cell types: mammalian (pig) epithelial cells (Fig. 1), a chytrid fungus (Batrachochytrium dendrobatidis ; Fig. 2A), and the amoeba Naegleria gruberi (Fig. 2B). We have included specific OneStep formulations for each in Table 2. We have also successfully applied this protocol to Naegleria gruberi cells pre-incubated with fixable MitoTracker (MitoTracker™ Red CM-H2Xros; Invitrogen M7513) to visualize mitochondria in living and fixed cells (Fig. 2B).
Time Considerations
After optimization, OneStep fixing and staining of pre-seeded cells can be fully executed in well under an hour. When optimizing for a new cell line, it may be more efficient to prepare several formulations of “OneStep solution” with varying concentrations of fixative and detergent for testing in parallel.
Acknowledgments
This work was supported by the National Institute of Allergy and Infectious Diseases of the National Institutes of Health under Award Number F32AI150057 to K.B.V., a Smith Family Foundation Award for Excellence in Biomedical Science to L.F.-L., and the National Science Foundation (IOS-1827257 to L.F.-L., MCB 1817926 to P.W. and a Soft Materials for Life National Research Traineeship Award #1545399 to C.F.R.). The authors thank Andrew Swafford and Gabriella Reynolds for providing chytrid cells for testing this protocol.
Author Contributions
Katrina B. Velle : conceptualization, formal analysis, funding acquisition, investigation, methodology, visualization, writing original draft, writing review and editing; Carline Fermino do Rosario : investigation, resources, validation, writing review and editing; Patricia Wadsworth : resources, writing review and editing; Lillian K. Fritz-Laylin : conceptualization, funding acquisition, methodology, project administration, resources, supervision, writing original draft, writing review and editing.
Conflict of Interest
The authors declare no conflict of interest.
Open Research
Data Availability Statement
Data sharing is not applicable to this article as no datasets were generated or analyzed during the current study.
Supporting Information
| Filename | Description |
|---|---|
| cpz1308-sup-0001-FigS1.eps57.7 MB | Supplementary Figure S1: A fluorescence microscope with a small footprint (such as a Keyence BZ-X800E All-in-One Fluorescence Microscope, shown here) may be installed inside a chemical fume hood for safety when working with PFA-containing solutions. |
Please note: The publisher is not responsible for the content or functionality of any supporting information supplied by the authors. Any queries (other than missing content) should be directed to the corresponding author for the article.
Literature Cited
- Bálint, Š., Verdeny Vilanova, I., Sandoval Álvarez, Á., & Lakadamyali, M. (2013). Correlative live-cell and superresolution microscopy reveals cargo transport dynamics at microtubule intersections. Proceedings of the National Academy of Sciences of the United States of America , 110(9), 3375–3380. doi: 10.1073/pnas.1219206110.
- de Boer, P., Hoogenboom, J. P., & Giepmans, B. N. G. (2015). Correlated light and electron microscopy: Ultrastructure lights up! Nature Methods , 12(6), 503–513. doi: 10.1038/nmeth.3400.
- Fernandes, T. F. D., Saavedra-Villanueva, O., Margeat, E., Milhiet, P.-E., & Costa, L. (2020). Synchronous, crosstalk-free correlative AFM and confocal microscopies/spectroscopies. Scientific Reports , 10(1), 7098. doi: 10.1038/s41598-020-62529-3.
- Gómez-Varela, A. I., Stamov, D. R., Miranda, A., Alves, R., Barata-Antunes, C., Dambournet, D., … De Beule, P. A. A. (2020). Simultaneous co-localized super-resolution fluorescence microscopy and atomic force microscopy: Combined SIM and AFM platform for the life sciences. Scientific Reports , 10(1), 1122. doi: 10.1038/s41598-020-57885-z.
- Navikas, V., Leitao, S. M., Grussmayer, K. S., Descloux, A., Drake, B., Yserentant, K., … Fantner, G. E. (2021). Correlative 3D microscopy of single cells using super-resolution and scanning ion-conductance microscopy. Nature Communications , 12(1), 4565. doi: 10.1038/s41467-021-24901-3.
- Phillips, M. A., Harkiolaki, M., Susano Pinto, D. M., Parton, R. M., Palanca, A., Garcia-Moreno, M., … Dobbie, I. M. (2020). CryoSIM: Super-resolution 3D structured illumination cryogenic fluorescence microscopy for correlated ultrastructural imaging. Optica , 7(7), 802–812. doi: 10.1364/OPTICA.393203.
- Tam, J., Cordier, G. A., Bálint, Š., Sandoval Álvarez, Á., Borbely, J. S., & Lakadamyali, M. (2014). A microfluidic platform for correlative live-cell and super-resolution microscopy. PloS One , 9(12), e115512. doi: 10.1371/journal.pone.0115512.
- Taylor, I. W. (1980). A rapid single step staining technique for DNA analysis by flow microfluorimetry. The Journal of Histochemistry and Cytochemistry , 28(9), 1021–1024. doi: 10.1177/28.9.6157714.
- Velle, K. B., & Fritz-Laylin, L. K. (2020). Conserved actin machinery drives microtubule-independent motility and phagocytosis in Naegleria. The Journal of Cell Biology , 219(11), e202007158. doi: 10.1083/jcb.202007158.
