PepSeq: a fully in vitro platform for highly multiplexed serology using customizable DNA-barcoded peptide libraries
Sierra N. Henson, Evan A. Elko, Piotr M. Swiderski, Yong Liang, Anna L. Engelbrektson, Alejandra Piña, Annalee S. Boyle, Zane Fink, Salvatore J. Facista, Vidal Martinez, Fatima Rahee, Annabelle Brown, Erin J. Kelley, Georgia A. Nelson, Isaiah Raspet, Heather L. Mead, John A. Altin, Jason T. Ladner

Extended
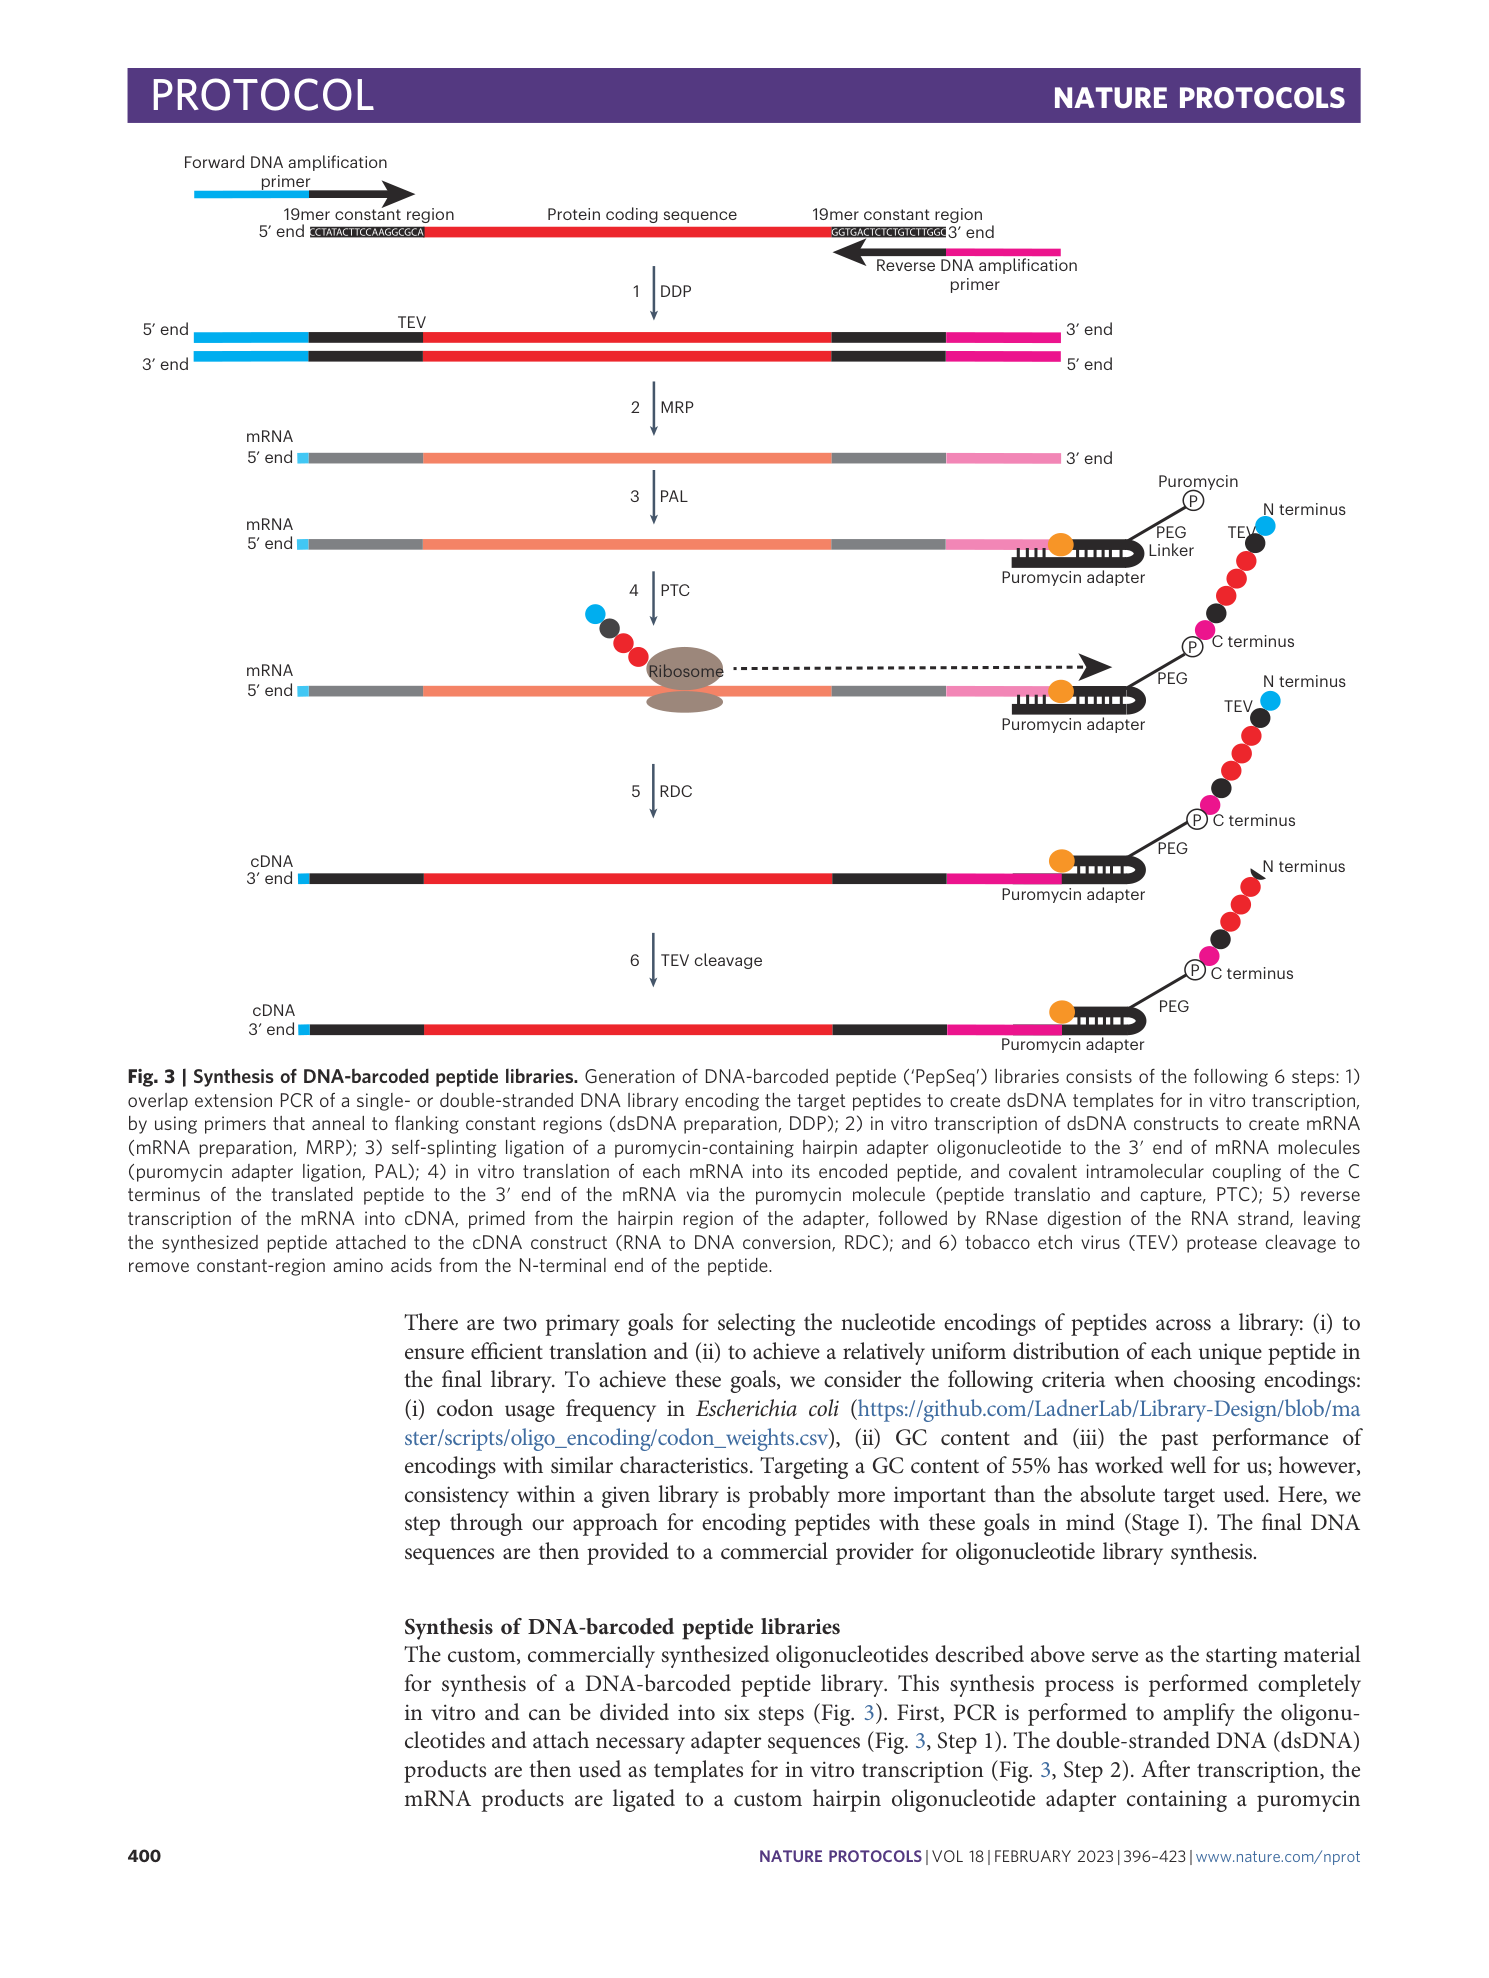
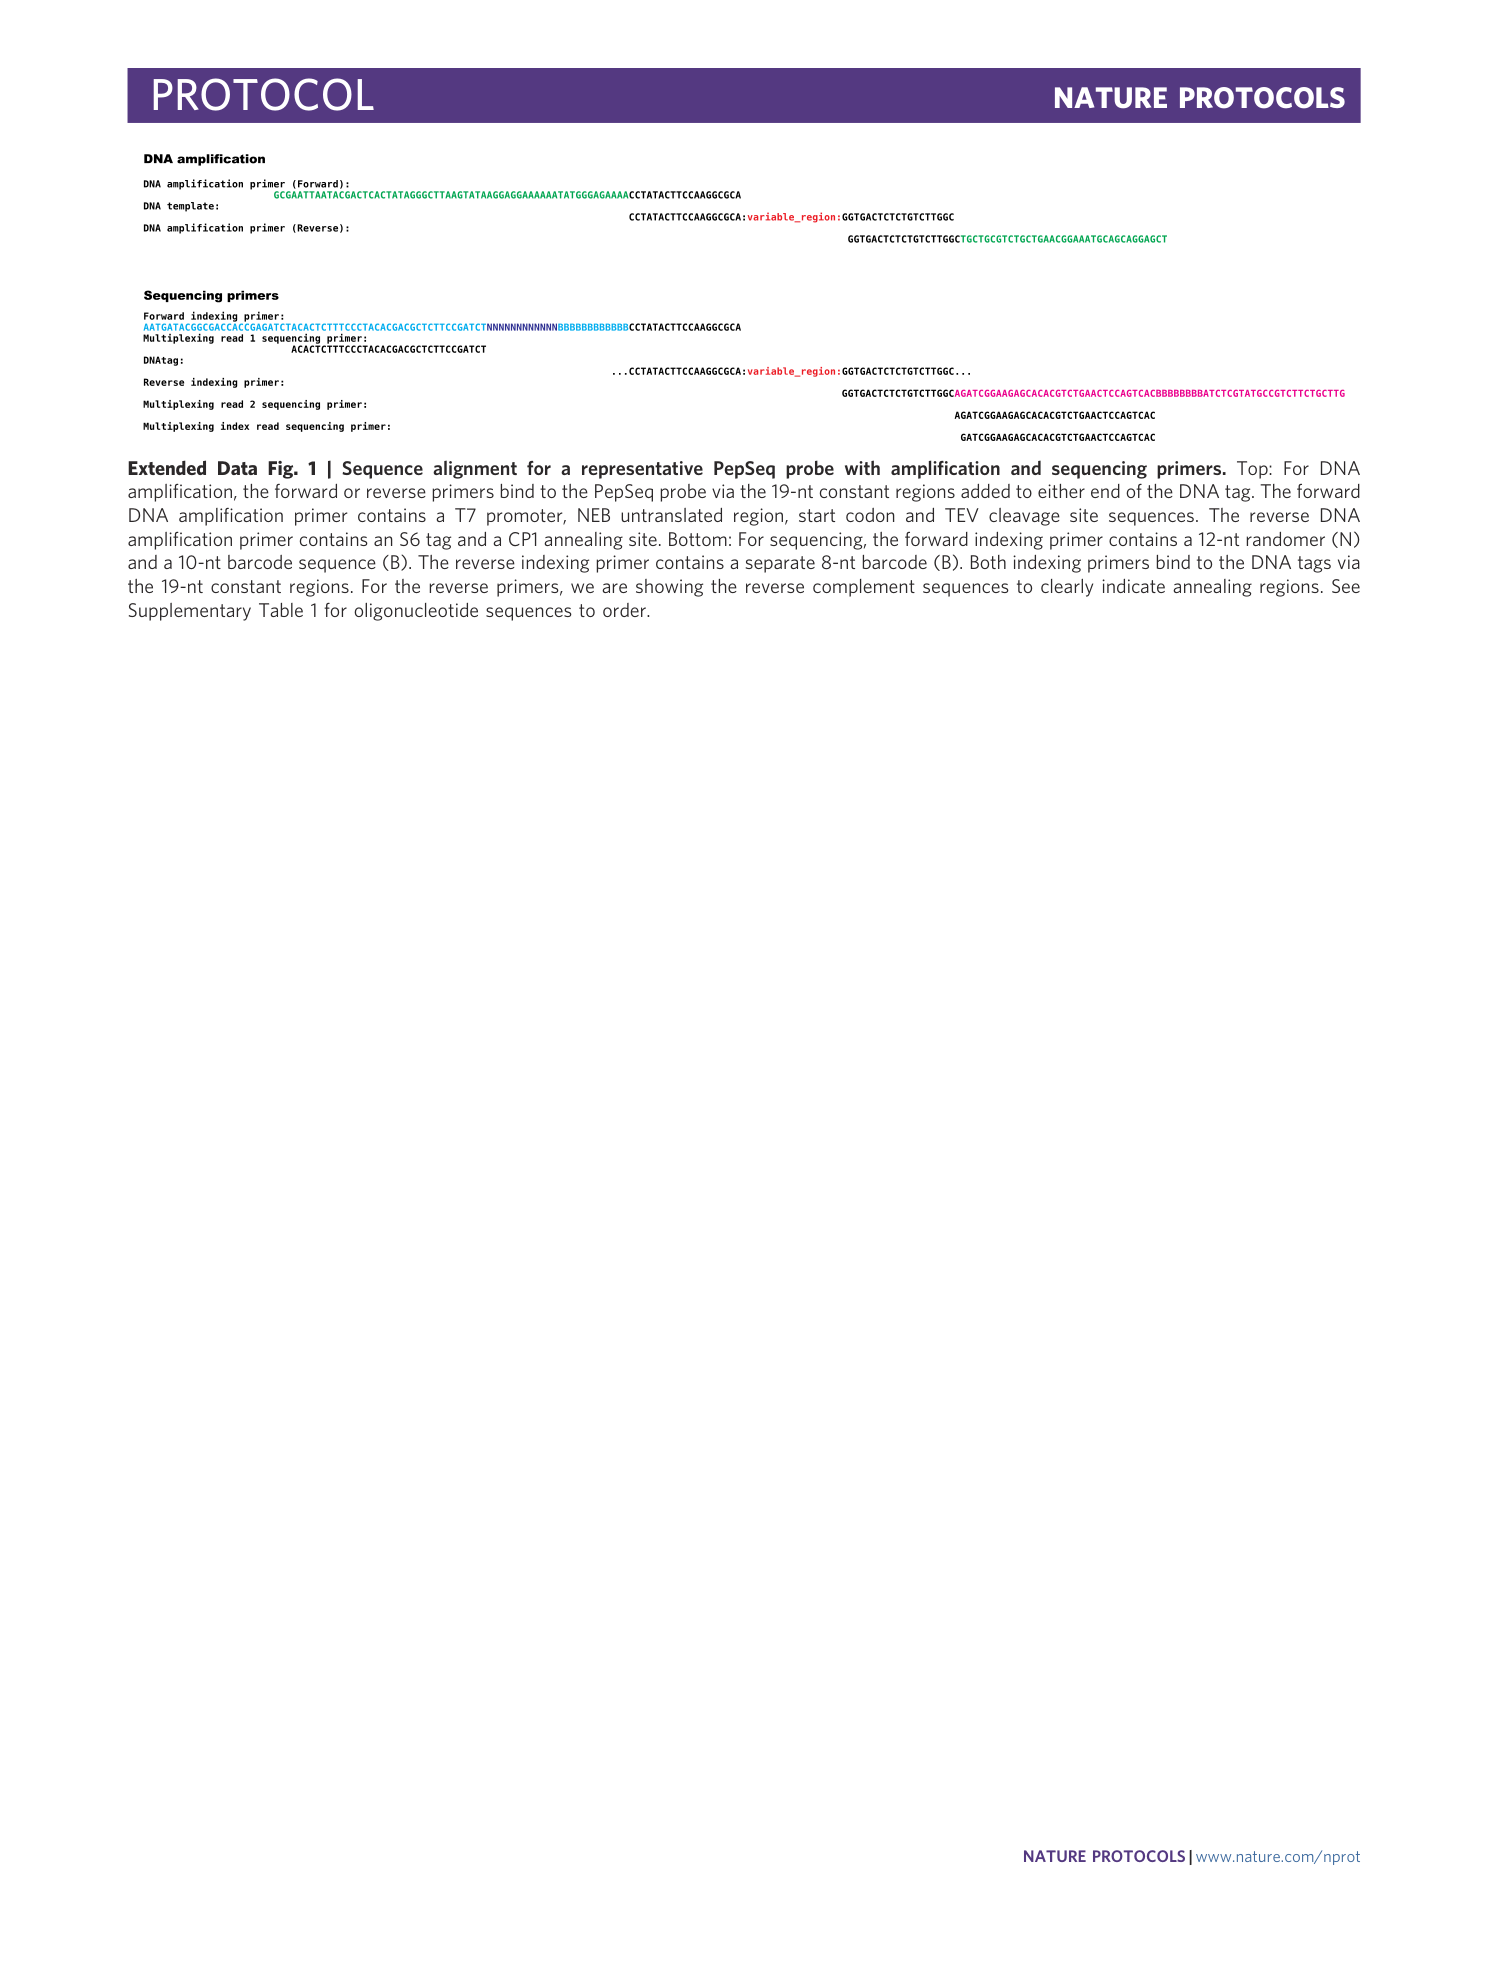
Extended Data Fig. 1 Sequence alignment for a representative PepSeq probe with amplification and sequencing primers.
Top: For DNA amplification, the forward or reverse primers bind to the PepSeq probe via the 19-nt constant regions added to either end of the DNA tag. The forward DNA amplification primer contains a T7 promoter, NEB untranslated region, start codon and TEV cleavage site sequences. The reverse DNA amplification primer contains an S6 tag and a CP1 annealing site. Bottom: For sequencing, the forward indexing primer contains a 12-nt randomer (N) and a 10-nt barcode sequence (B). The reverse indexing primer contains a separate 8-nt barcode (B). Both indexing primers bind to the DNA tags via the 19-nt constant regions. For the reverse primers, we are showing the reverse complement sequences to clearly indicate annealing regions. See Supplementary Table 1 for oligonucleotide sequences to order.
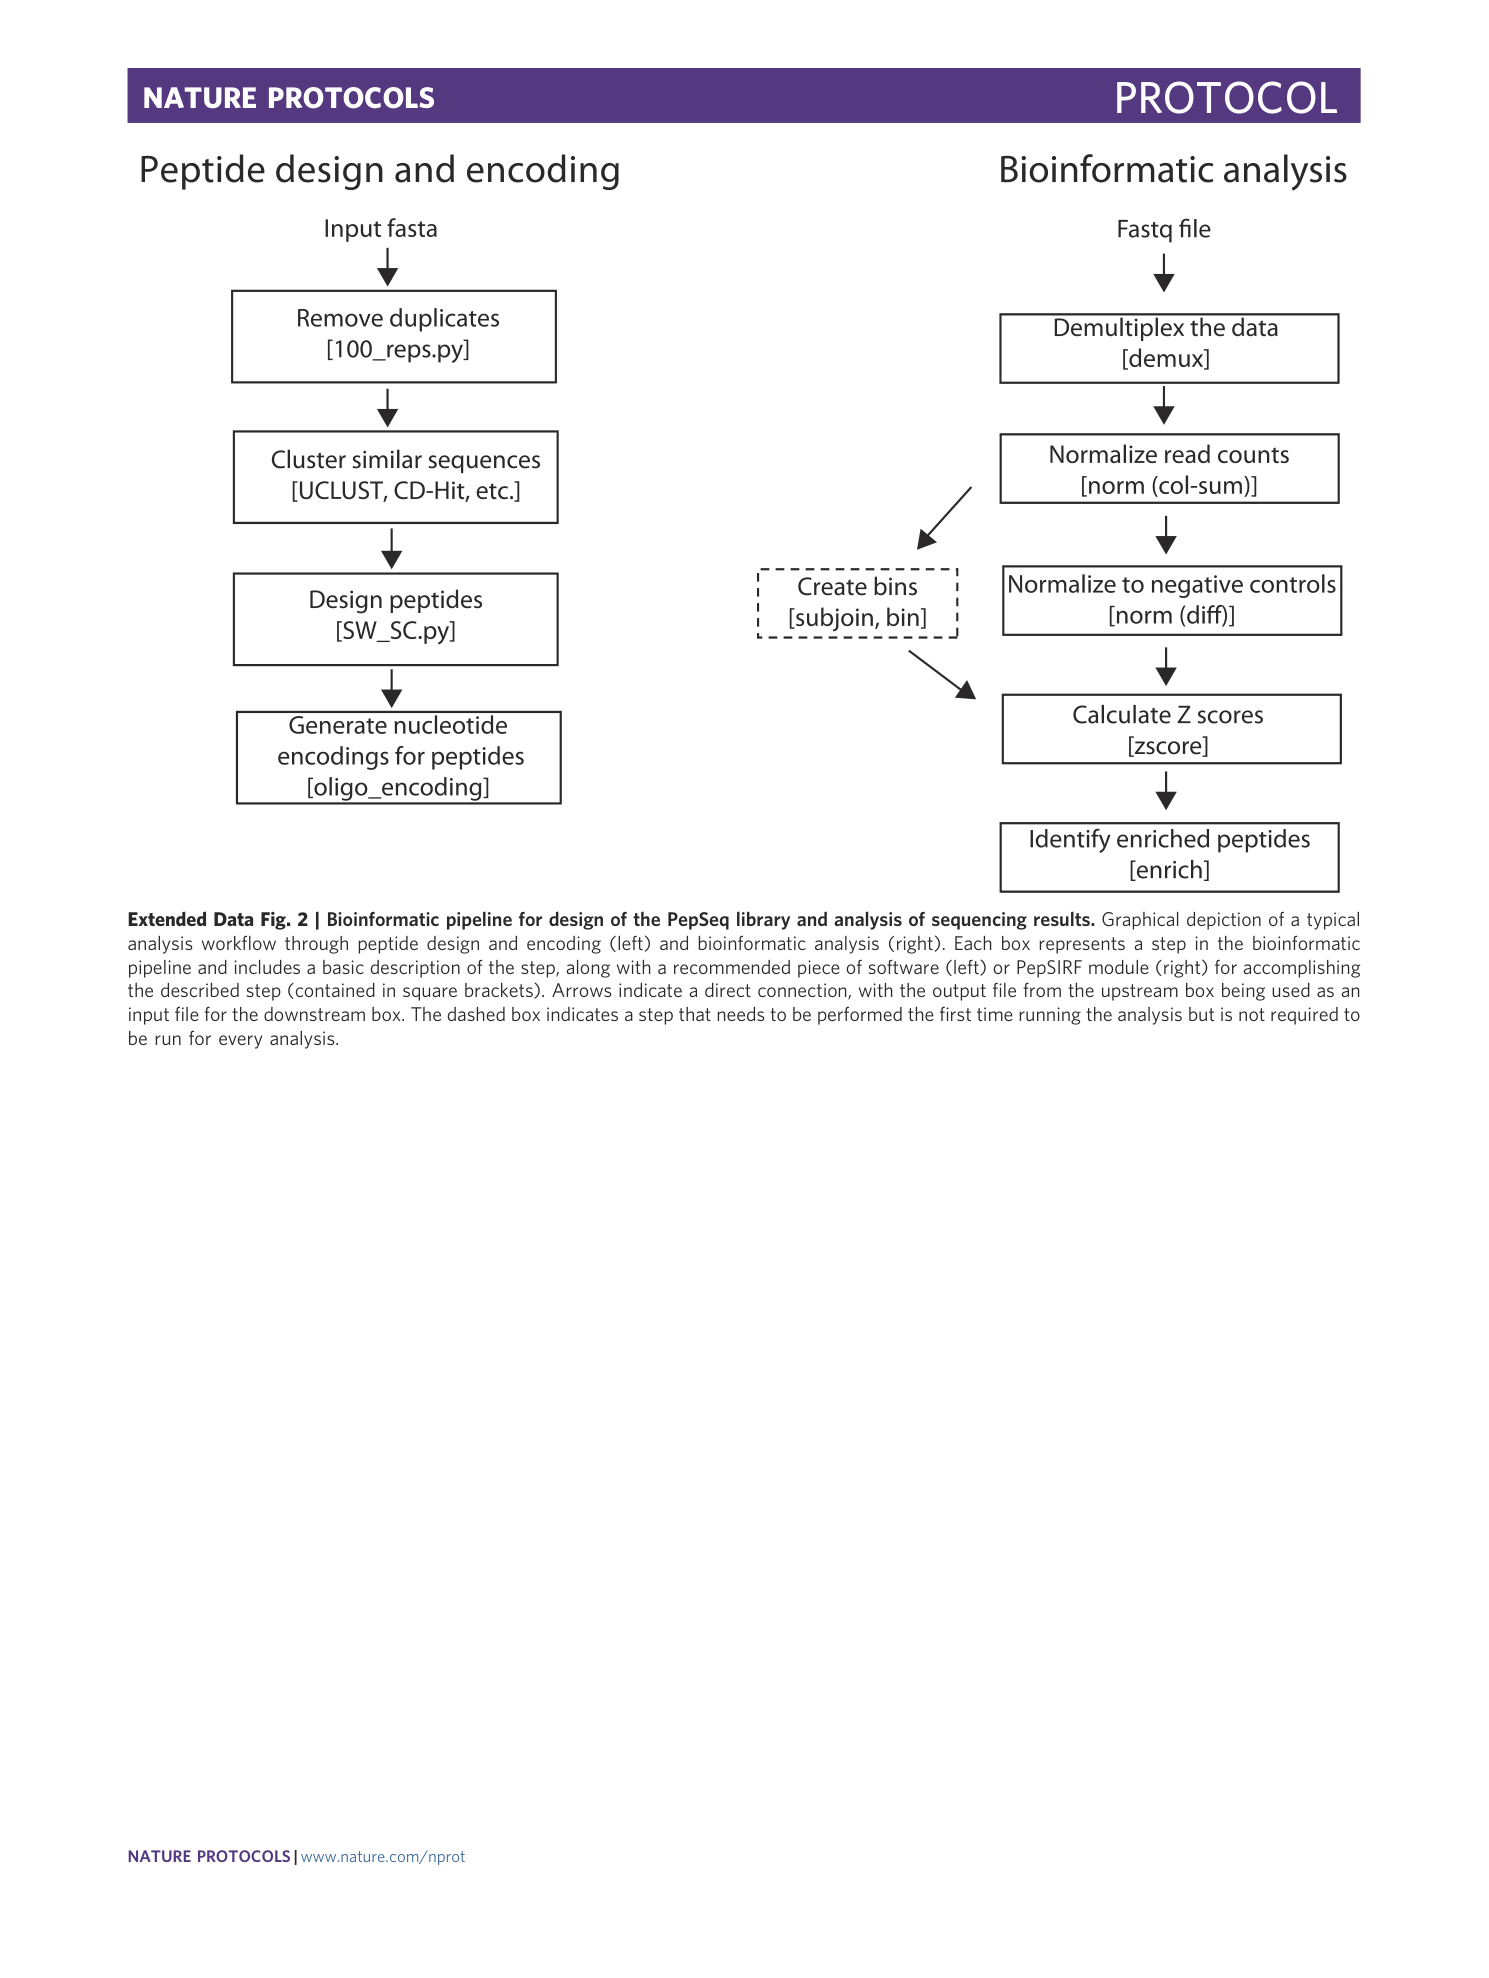
Extended Data Fig. 2 Bioinformatic pipeline for design of the PepSeq library and analysis of sequencing results.
Graphical depiction of a typical analysis workflow through peptide design and encoding (left) and bioinformatic analysis (right). Each box represents a step in the bioinformatic pipeline and includes a basic description of the step, along with a recommended piece of software (left) or PepSIRF module (right) for accomplishing the described step (contained in square brackets). Arrows indicate a direct connection, with the output file from the upstream box being used as an input file for the downstream box. The dashed box indicates a step that needs to be performed the first time running the analysis but is not required to be run for every analysis.
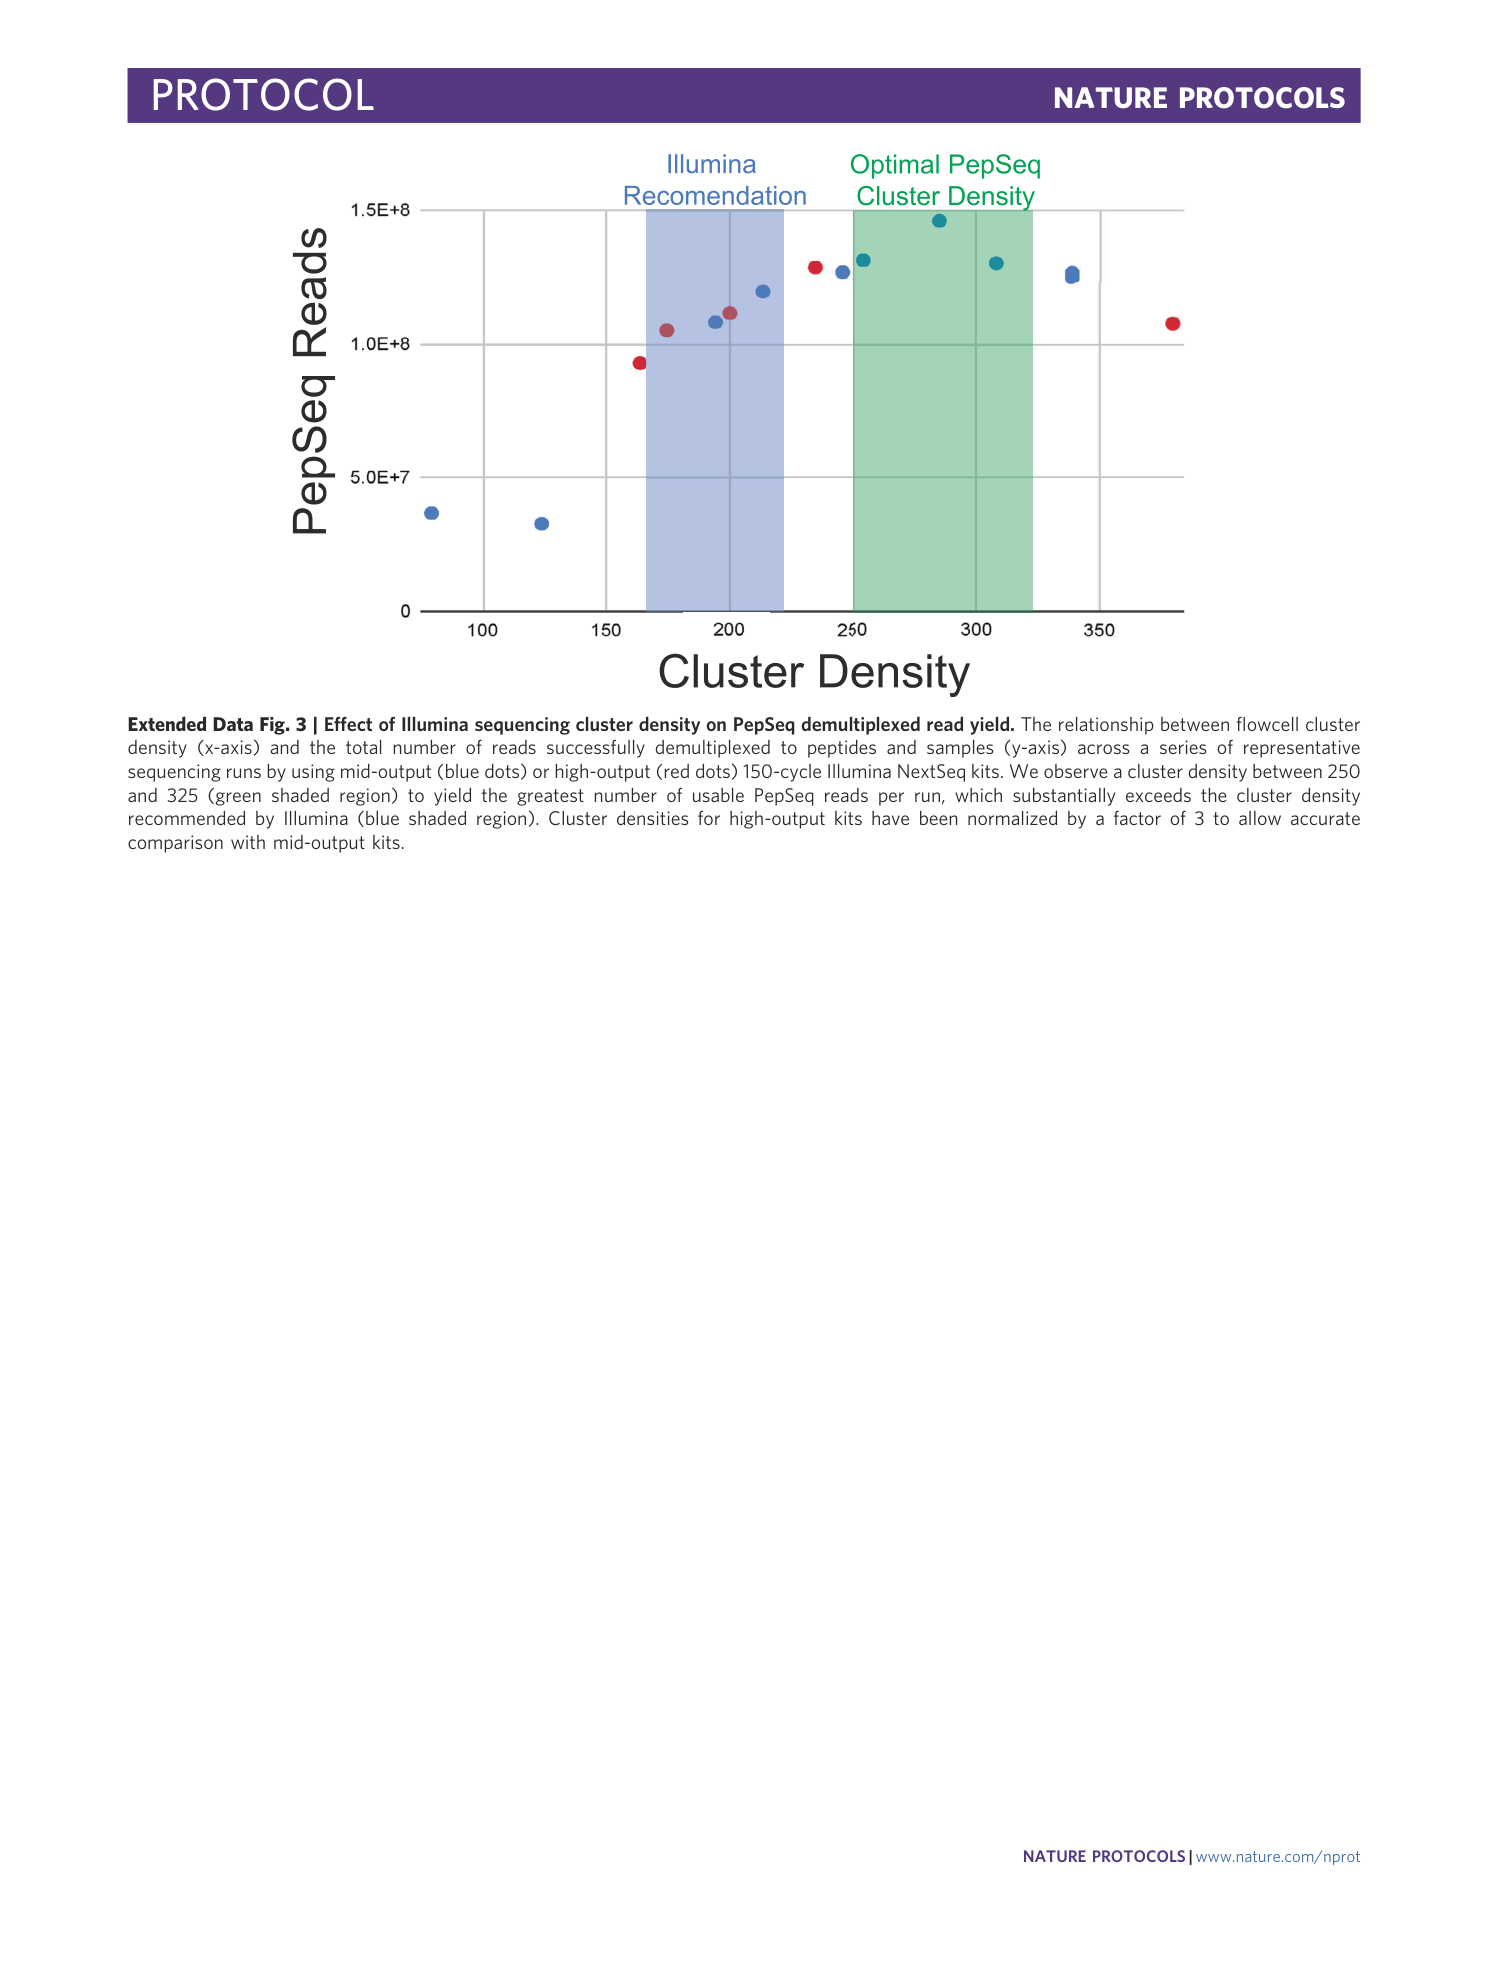
Extended Data Fig. 3 Effect of Illumina sequencing cluster density on PepSeq demultiplexed read yield.
The relationship between flowcell cluster density (x-axis) and the total number of reads successfully demultiplexed to peptides and samples (y-axis) across a series of representative sequencing runs by using mid-output (blue dots) or high-output (red dots) 150-cycle Illumina NextSeq kits. We observe a cluster density between 250 and 325 (green shaded region) to yield the greatest number of usable PepSeq reads per run, which substantially exceeds the cluster density recommended by Illumina (blue shaded region). Cluster densities for high-output kits have been normalized by a factor of 3 to allow accurate comparison with mid-output kits.
Supplementary information
Supplementary Information
Supplementary Methods and Table 1

