Pan-evolutionary and regulatory genome architecture delineated by an integrated macro- and microsynteny approach
Hongwei Yu, Yuli Li, Wentao Han, Lisui Bao, Fuyun Liu, Yuanting Ma, Zhongqi Pu, Qifan Zeng, Lingling Zhang, Zhenmin Bao, Shi Wang


Extended
Extended Data Fig. 1 Extended demonstrations of microsynteny analyses.
( a ) Dot plot or Circos plot visualization of polyploid plant genomes (left) and microbial genomes (right). In the dot plot, homologous gene pairs are shown as dots, and syntenic gene pairs are aligned together. In the Circos plot, lines linking two chromosomes indicate the location of microsynteny genes. ( b ) Microsynteny analysis of heteromorphic and homomorphic sex chromosomes in X/Y and Z/W sexual systems, respectively. Lines linking two sex chromosomes indicate the location of microsynteny genes. The location of sex-determining gene is indicated by a green line. ( c ) Genomic organization of plant gene clusters, which are tandemly connected in metabolic pathways. Homologous genes are represented with rectangles of the same color. Microsynteny between two species is shown with grey curves. ( d ) Integrative analysis of microsynteny with genomic structural variations. Oryza sativa L. indica rice varieties Minghui63 (MH63) and Zhenshan97 (ZS97) genomes are used for displaying the association of genome synteny and different structural variations (insertions/deletions or inversions).
Extended Data Fig. 2 Computational procedure and visualization of network-based microsynteny analysis.
( a , b ) Schematic overview of network-based approaches developed for microsynteny network detection and macroevolutionary history inference (see Zhao et al. 108 and Robert et al. 27 for detailed algorithm descriptions). ( c ) Network-based microsynteny analysis in 18 animal genomes. The heatmap in the top panel shows the pairwise comparisons for microsynteny conservation between any two species. The adjacent network shows several example clusters after microsynteny network clustering. The middle panel shows a binary matrix constructed by the phylogenomic profiling of all clusters, where rows represent clusters and columns represent species. The bottom panel shows the network representation of one conserved (left) and one Eutheria-specific (right) microsynteny genes.
Extended Data Fig. 3 Functional characterization and regulatory analysis of microsynteny gene clusters.
( a ) Association of microsynteny cluster with single-cell transcriptome data of Amphimedon queenslandica (left) and Trichoplax adhaerens (right), with microsynteny genes associated with cell type (top), cell lineage (middle) and co-expression pattern (bottom). ( b ) Identification of the conserved regulatory CNEs for the well-known pharyngeal gene cluster across four placental mammals. Blue and orange rectangles represent the positions of CNEs on chromosomes that are presented in each species (blue) or conserved across all species (orange). Pink rectangles represent the position of conserved gene cluster on the chromosome of the reference species (human Chr14). ( c ) Distribution and comparison of TADs around the conserved pharyngeal gene cluster in human and mouse. The chromatin interaction heatmap was generated using the 3D Genome Browser ( http://3dgenome.fsm.northwestern.edu/ ).
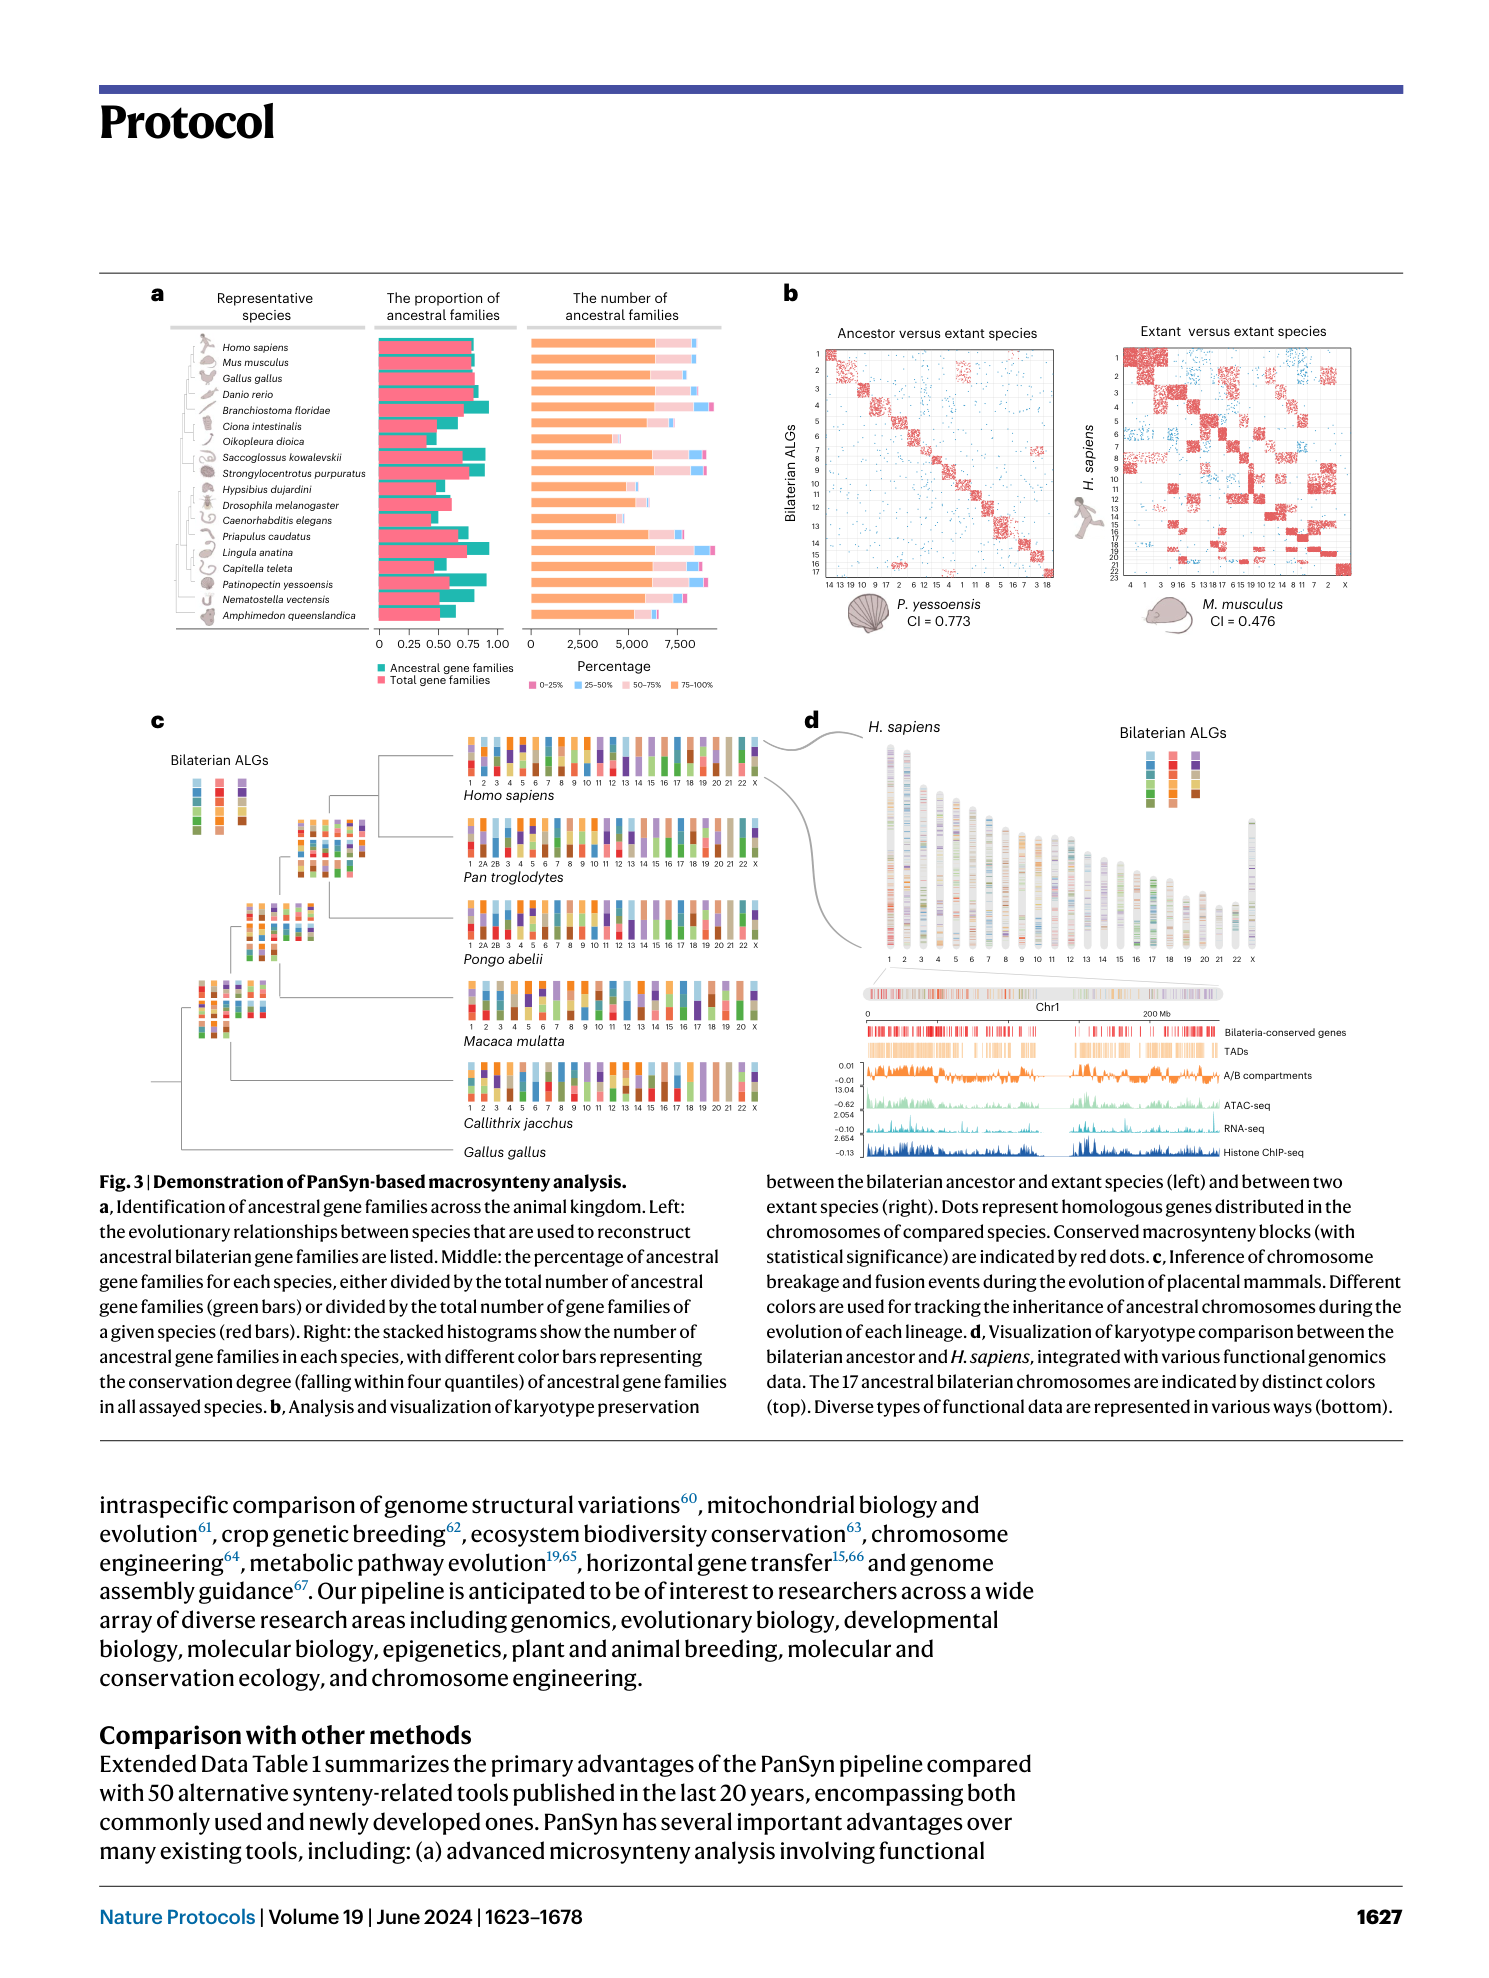
Extended Data Fig. 4 Ancestral genome reconstruction and macrosynteny analysis.
( a ) Schematic overview of ancestral genome reconstruction approaches for macrosynteny analysis, which are suitable for a wide range of evolutionary distance (see Kim et al. 74 and Simakov et al. 75 for detailed algorithm descriptions). ( b ) Various visualizations of genome macrosynteny for human, chimpanzee and mouse in comparison with the deduced karyotype of the eutherian ancestor, including profiling of karyotype evolution and conservation (CI values), identification of chromosome breakage and fusion events, and genome-wide profiling of macrosynteny landscapes for both genomic DNA-based and protein-based analyses.
Extended Data Fig. 5 Macrosynteny analysis of 34 representative species across the animal kingdom.
Macrosynteny analysis using the ancestral linkage groups represented by the ancestral genome of Nematostella vectensis is presented, with orange and blue dots representing chromosome-level and scaffold-level genomes, respectively. In the dot plots, dots represent homologous genes distributed in the chromosomes of compared species (x-axis: extant species, y-axis: bilaterian ancestor). Conserved macrosynteny blocks (with statistical significance) are indicated by red dots.
Extended Data Fig. 6 Visualization of karyotype evolution and integration with functional genomics data.
( a ) Visualization of karyotype comparison of the bilaterian ancestor with human (top) or mouse (bottom). Each color represents one of the 17 chromosomes of bilaterian ancestor. ( b ) Integrative analysis of karyotype and regulatory evolution in humans (top) and mice (bottom). The color density in the heatmap represents the relative number of contacts observed within chromosomes. Various epigenetic and regulatory data are collectively shown for the chromosomes under investigation. The chromatin interaction heatmap was generated using the 3D Genome Browser ( http://3dgenome.fsm.northwestern.edu/ ).
Extended Data Fig. 7 Schematic overview of pan-evolutionary analysis of microsynteny and macrosynteny.
( a ) Recovering macrosyntenic ancient blocks from microsyntenic gene clusters in extant species. Coloured circles correspond to different OGs. The lengths of the edges in the networks are proportional to the intergenic distance. The schematic overview is adapted from the SYNPHONI pipeline 27 . ( b ) Tracing evolutionary trajectories and dynamics of gene contents and gene orders from ancestors to extant species in the aspects of gene gain and loss events and conservative transitions from macrosynteny to microsynteny.
Extended Data Fig. 8 Whole-genome distribution and three-dimensional exhibition of ancient/novel gene clusters.
( a ) Distribution of Eutheria-conserved (green), Boreoeutheria-conserved (pink) and Simian-conserved (blue) microsynteny genes along the human chromosomes. ( b ) Three-dimensional chromosome model of human (top) and mouse (bottom), with color labeling Eutheria-conserved (left), Euarchontoglires-conserved (middle) and Simian/Glires-specific (right) microsynteny locations. Gray thick threads represent the 3D structure of the entire chromosome. 3D genome structures are visualized using the Nucleome Browser ( http://www.nucleome.org ).
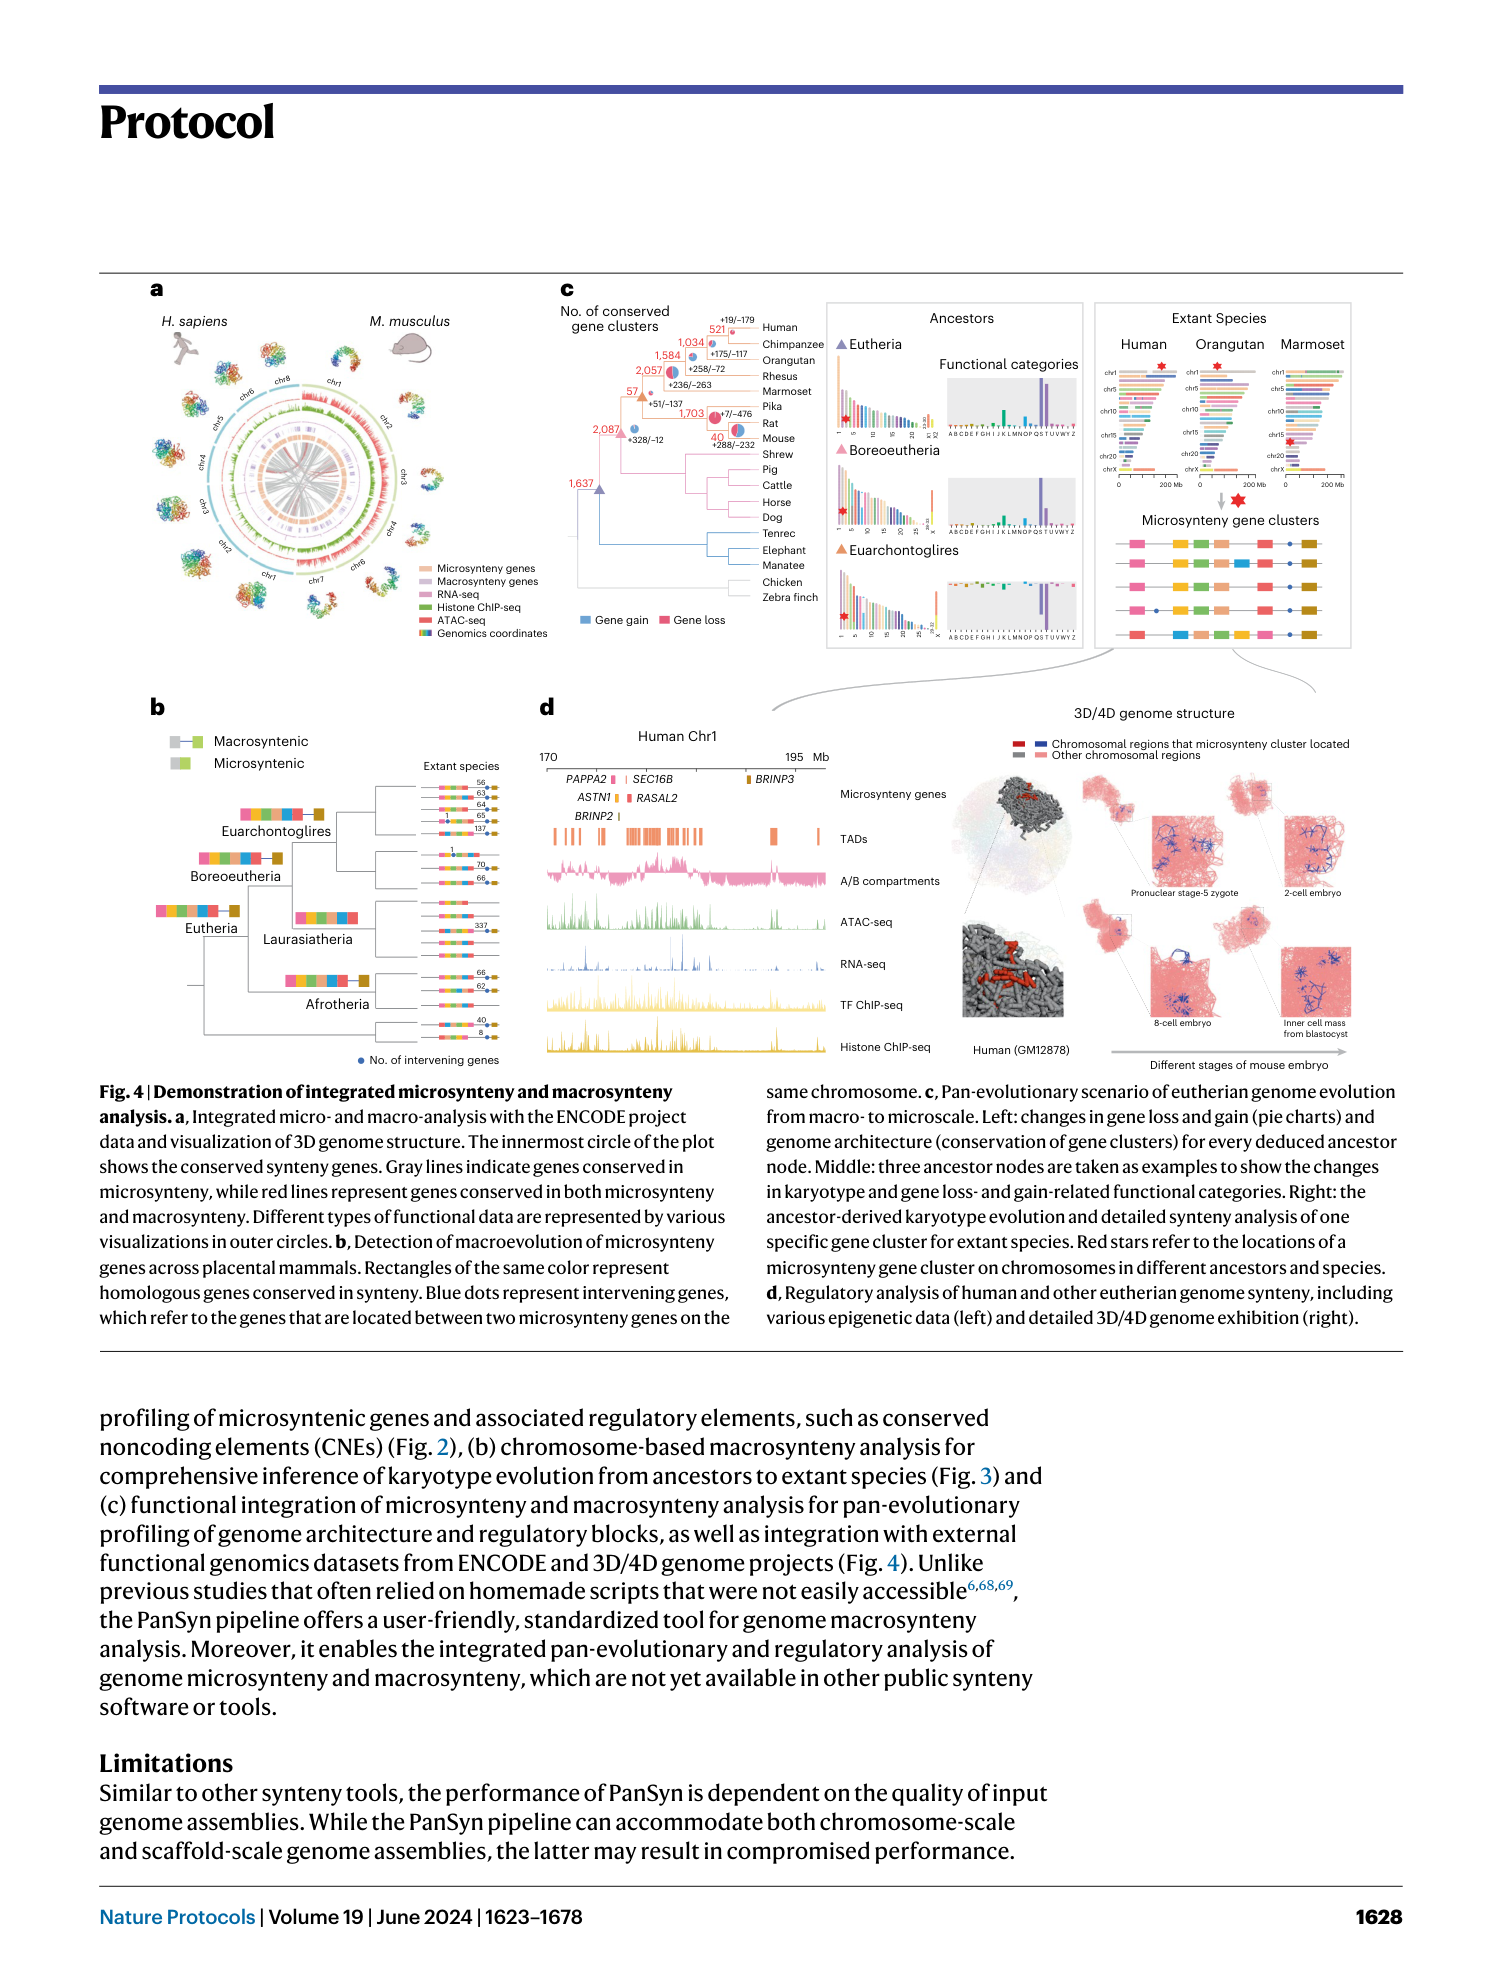
Extended Data Fig. 9 Integrated pan-evolutionary and regulatory analysis of genome microsynteny and macrosynteny.
( a ) Chromosomal distribution of macrosynteny, microsynteny and various regulatory information derived from the ENCODE project in human (left) and mouse (right). Rectangles represent conserved synteny genes (blue: macrosynteny, green: microsynteny, red: microsynteny & macrosynteny). Visualization of various associated regulatory data types is shown below. ( b ) Functional enrichment analysis of macrosynteny/microsynteny genes based on KEGG (top) and GO (bottom) annotation. In the bubble diagrams, the color and size of the bubbles are utilized to convey statistical information, such as the P -value and the number of overlapping genes with the pathway. In the bar charts, the enriched annotated GO terms are shown, with statistical significance indicated by the height of the bars. ( c ) Detailed presentation of CNEs and other regulatory information from ENCODE for the HOXA gene cluster in human and mouse. Blue and red rectangles represent the position of the HOXA gene cluster and identified CNEs on chromosomes, respectively. Various ENCODE data types are collectively shown for the chromosomal regions under investigation.
Extended Data Table 1 Technical comparison between PanSyn and other commonly used or newly published tools
Supplementary information
Supplementary Table 1
The sources of all the input datasets used in demonstration.
Supplementary Code 1
All PanSyn source codes and user guidance.
