Measuring Mitochondrial Respiration in Previously Frozen Biological Samples
Corey Osto, Corey Osto, Ilan Y. Benador, Ilan Y. Benador, Jennifer Ngo, Jennifer Ngo, Marc Liesa, Marc Liesa, Linsey Stiles, Linsey Stiles, Rebeca Acin-Perez, Rebeca Acin-Perez, Orian S. Shirihai, Orian S. Shirihai
Abstract
Measuring oxygen consumption allows for the role of mitochondrial function in biological phenomena and mitochondrial diseases to be determined. Although respirometry has become a common approach in disease research, current methods are limited by the necessity to process and measure tissue samples within 1 hr of acquisition. Detailed by Acin-Perez and colleagues, a new respirometry approach designed for previously frozen tissue samples eliminates these hurdles for mitochondrial study. This technique allows for the measurement of maximal respiratory capacity in samples frozen for long-term storage before testing. This protocol article describes the optimal tissue isolation methods and the combination of substrates to define electron transport chain function at high resolution in previously frozen tissue samples. © 2020 The Authors.
Basic Protocol 1 : Sample collection, storage, and homogenization for previously frozen tissue respirometry
Basic Protocol 2 : Running a Seahorse respirometry assay using previously frozen tissue samples
Basic Protocol 3 : Normalization to mitochondrial content for previously frozen tissue respirometry
INTRODUCTION
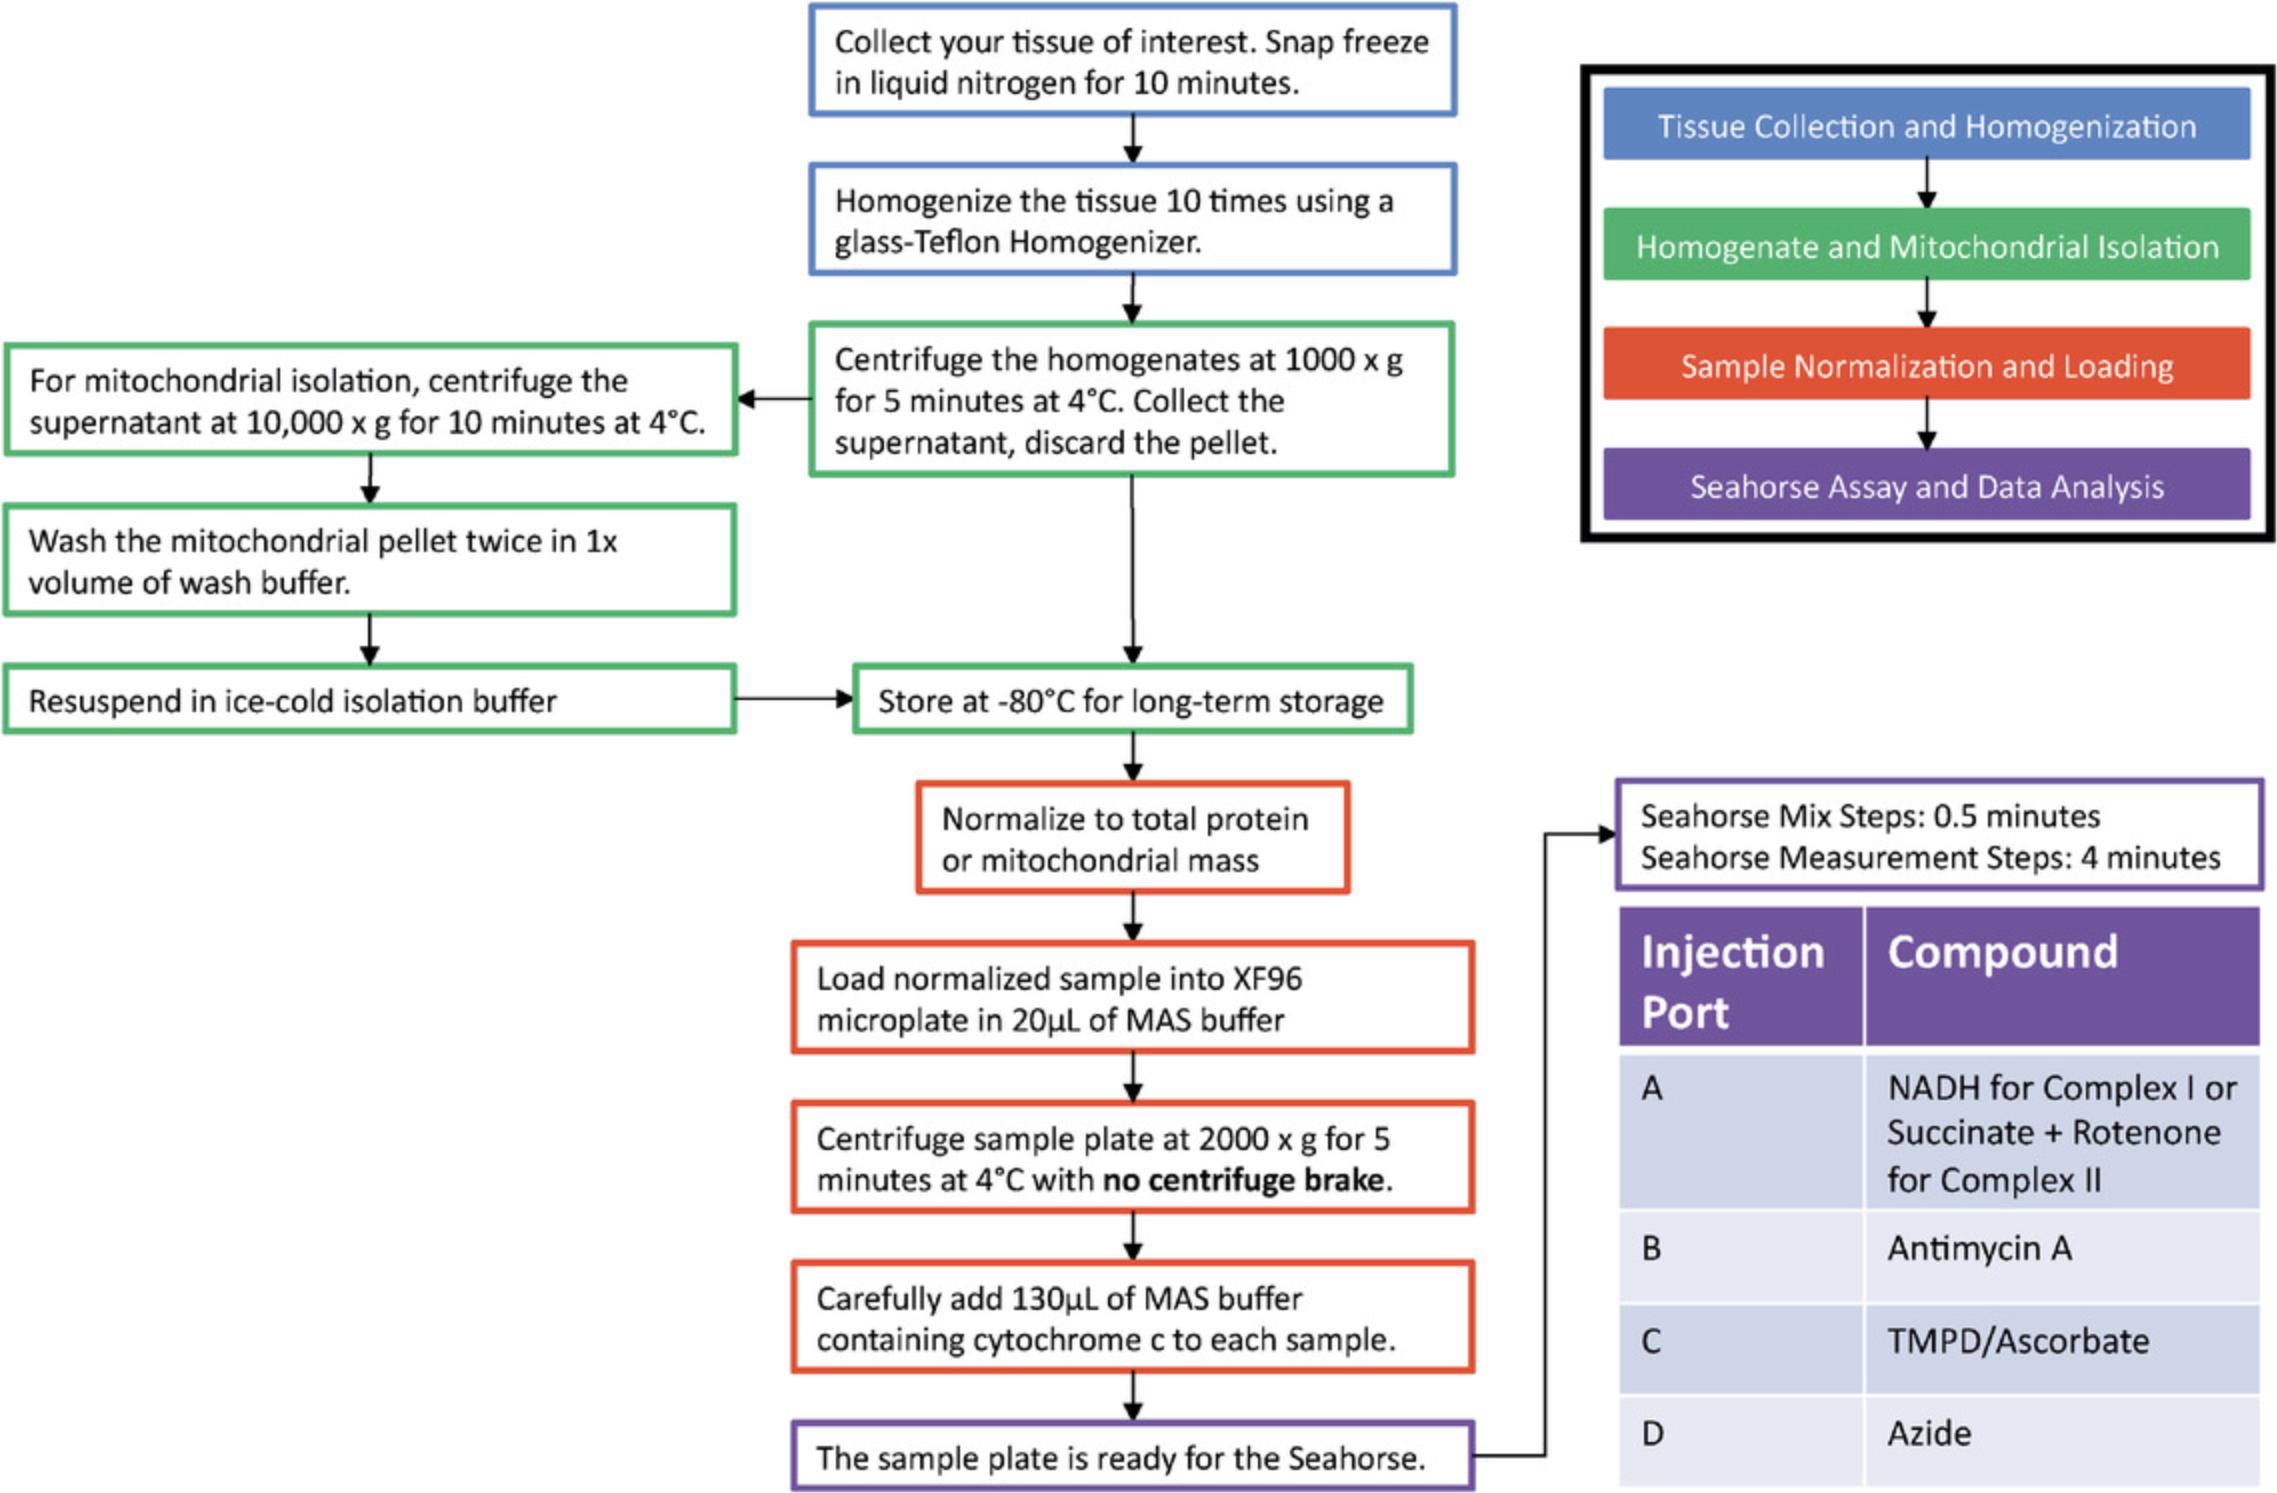
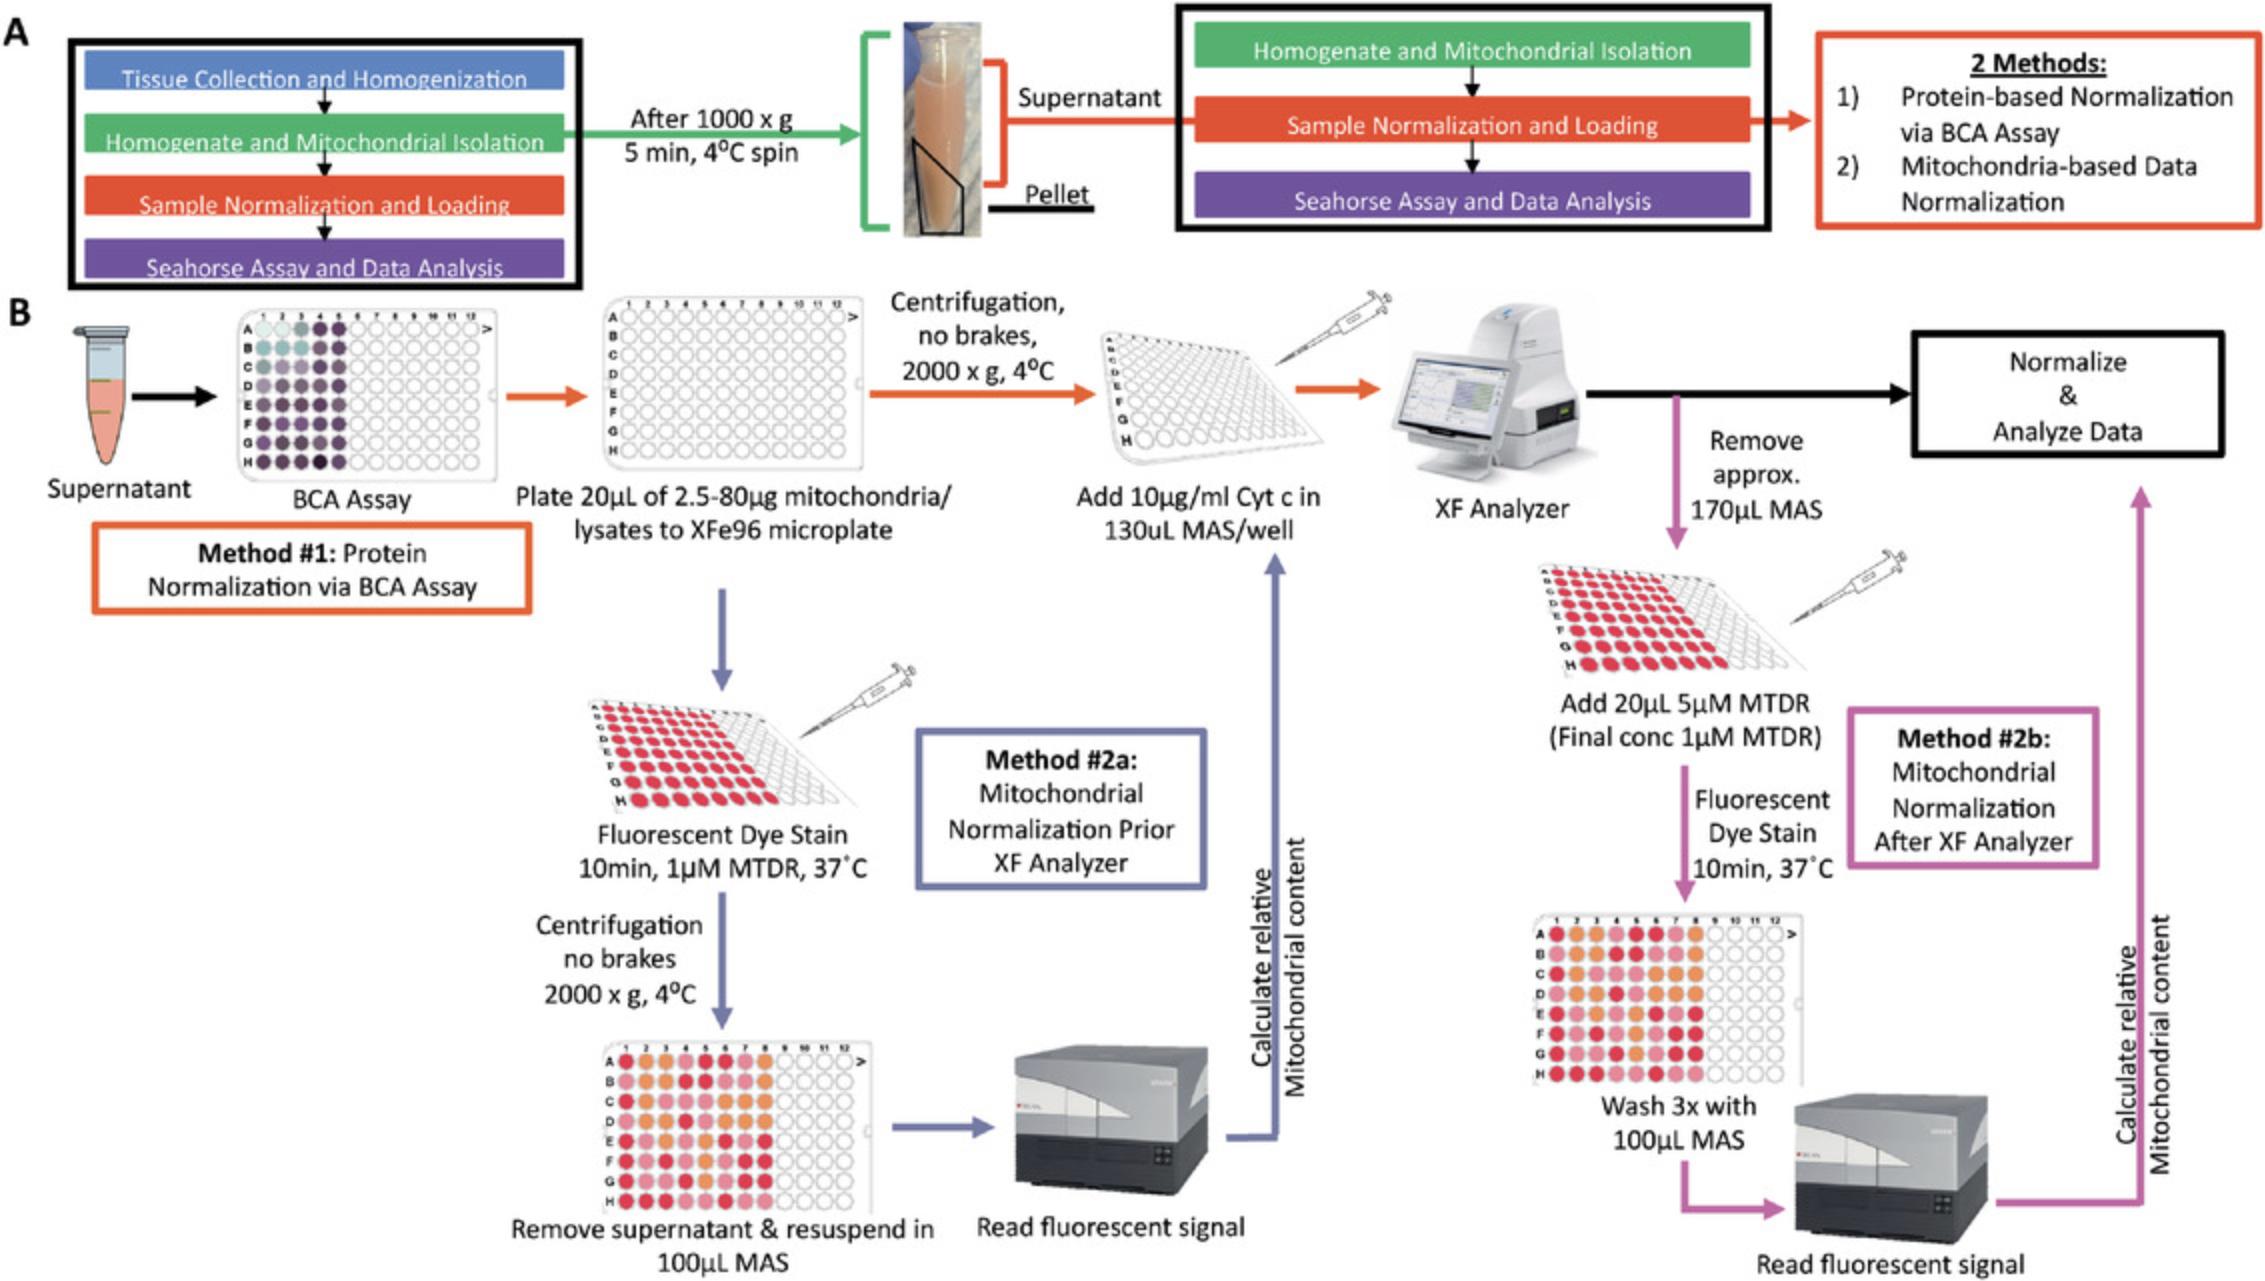
Impaired mitochondrial respiration plays a key role in metabolic, aging-related, and cardiovascular disease (Liesa, Palacín, & Zorzano, 2009; Wallace, 2011). Mitochondrial respiration results from the transfer of electrons between complexes I, II, III, and IV, with complex IV reducing oxygen to water; thus, oxygen consumption integrates electron transport activity from complexes I/II through IV. However, mitochondrial respirometry analysis currently requires processing and measurement of the living tissue sample within an hour of being taken from the patient. This requirement is set by the need to preserve the integrity of the inner mitochondrial membrane, needed both for integrated electron transfer between the complexes as well as to preserve the coupling of electron transfer to ATP synthesis. Consequently, the need to use fresh tissue to assess integrated electron transport activity makes respirometry analysis largely unfeasible for standard clinical practice and clinical studies. This limitation has significantly stalled scientific progress and virtually excluded the possibility of translating some discoveries in mitochondrial physiology into improved patient care. Here we describe a methodology to assess mitochondrial respirometry capacity in previously frozen biological specimens. This procedure (see flowchart in Fig. 1) overcomes the fundamental limitation of conventional respirometry approaches that require freshly isolated tissue, and also allows for the use of less biological material. Furthermore, our approach also allows for the use of a combination of substrates that permits selective measurements of respiratory capacity driven by complex I, II, or IV alone, resembling previous methods for determining isolated electron transport chain complex activity.
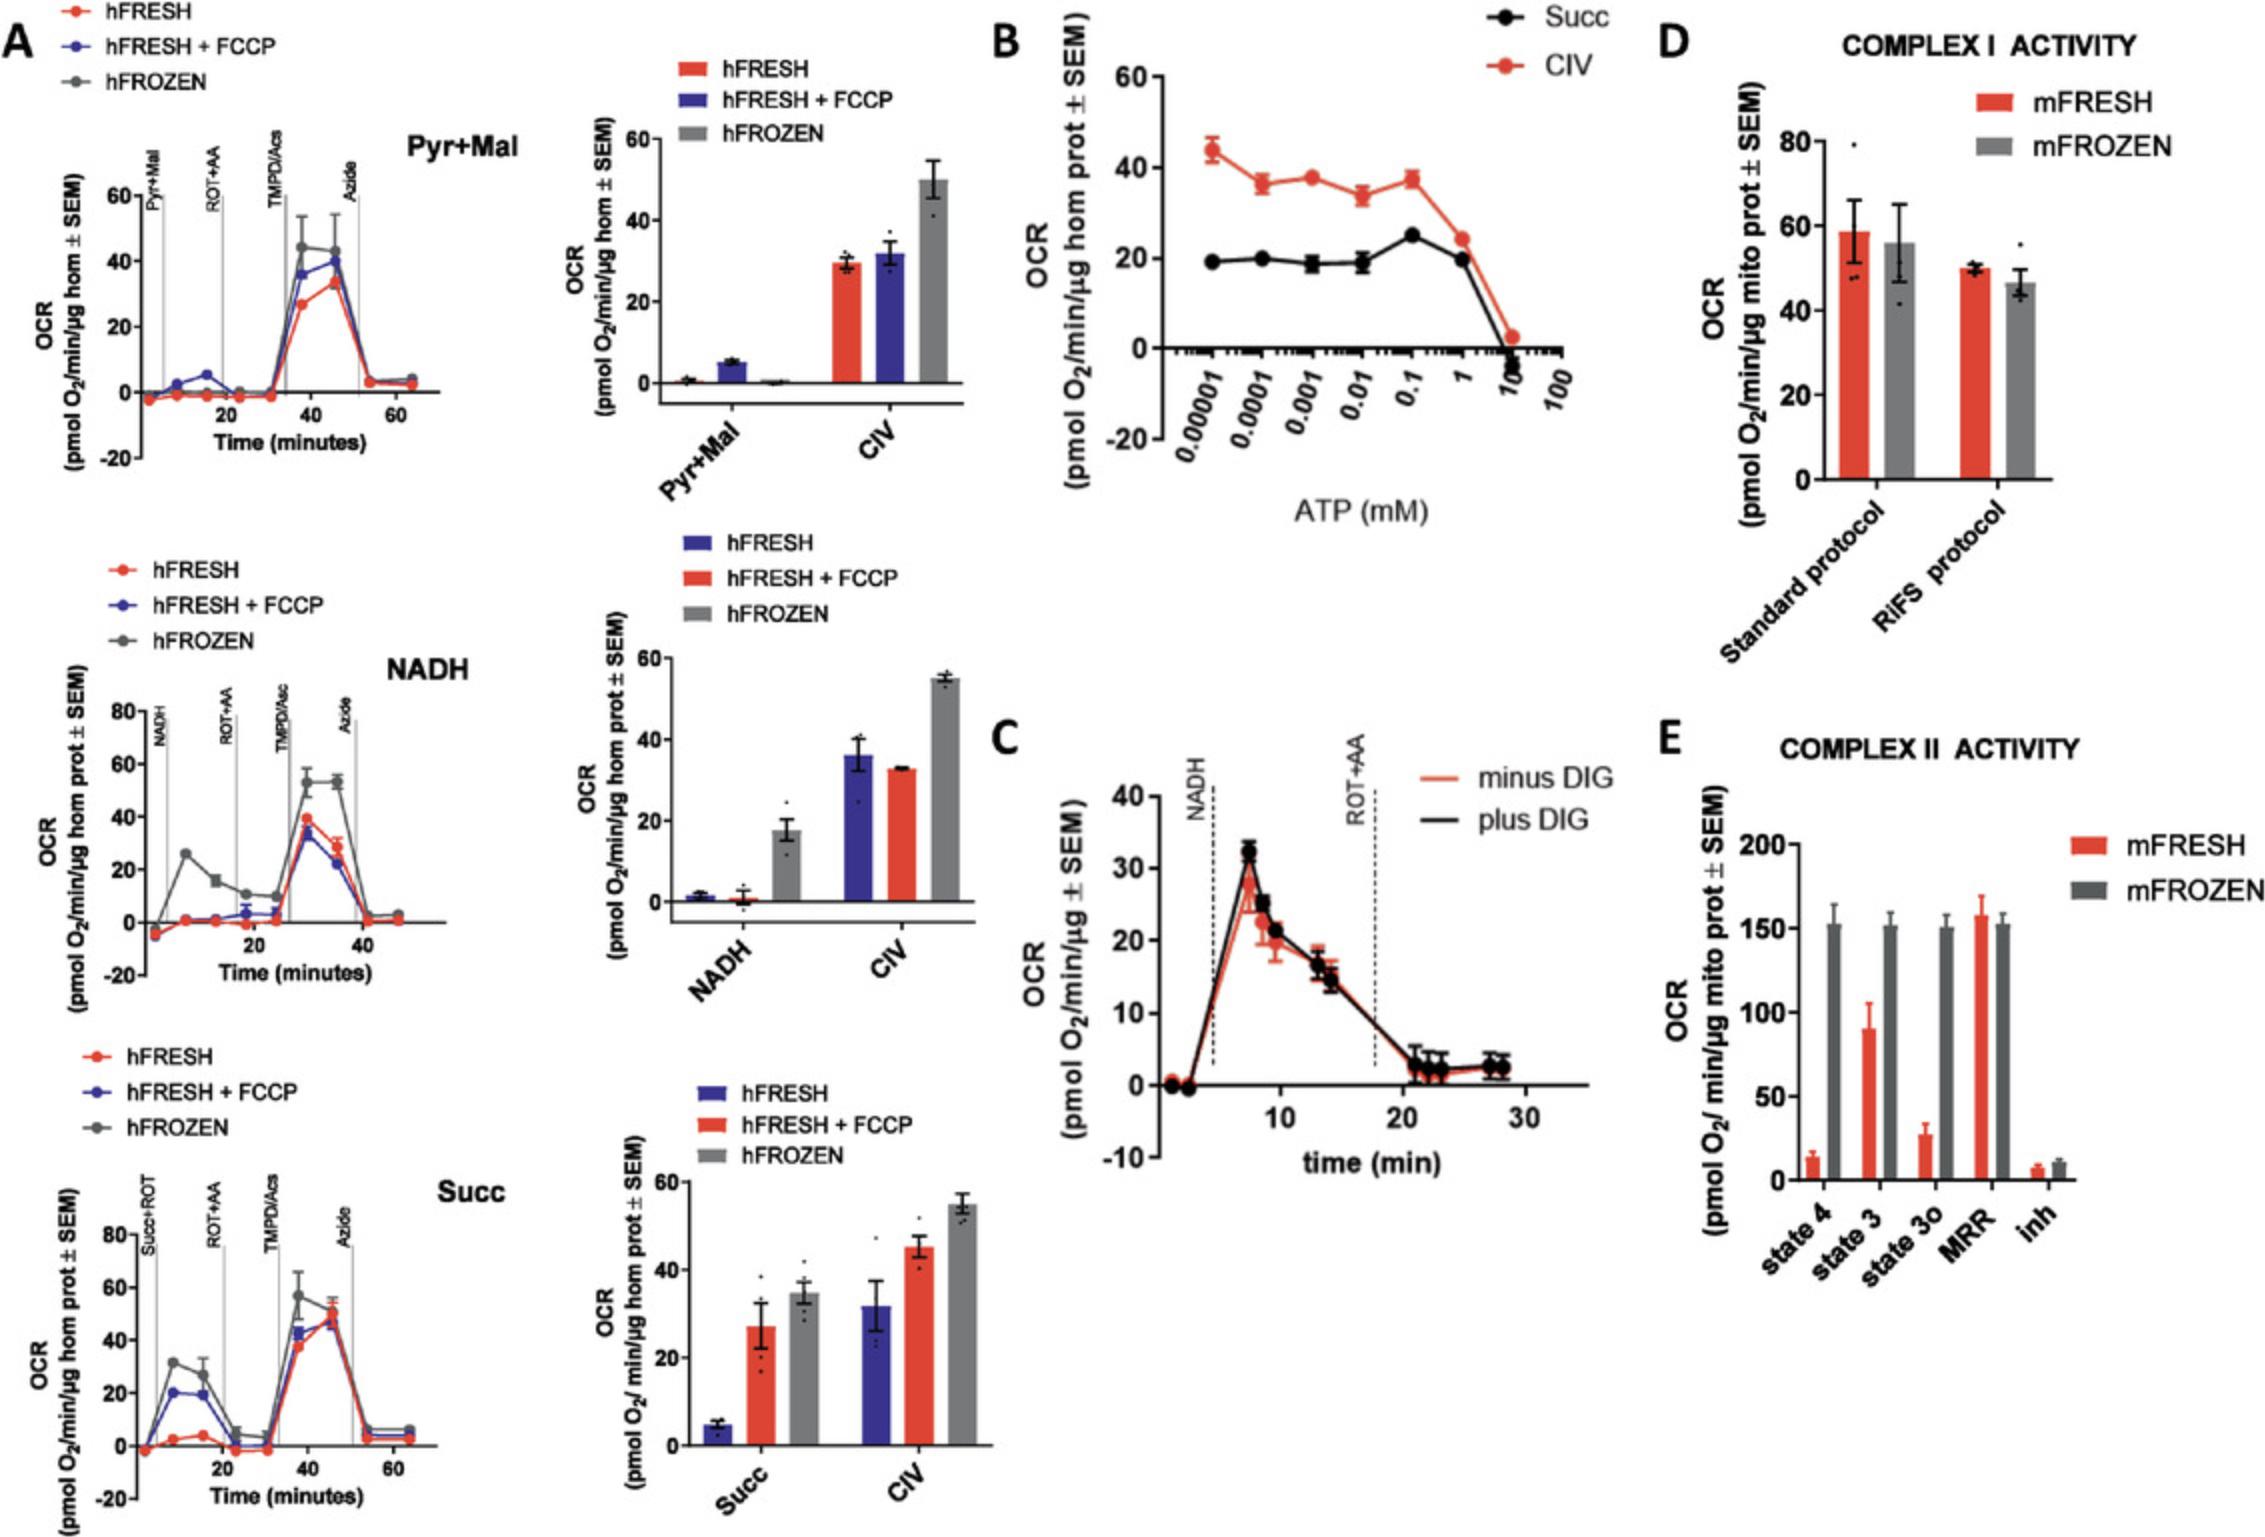
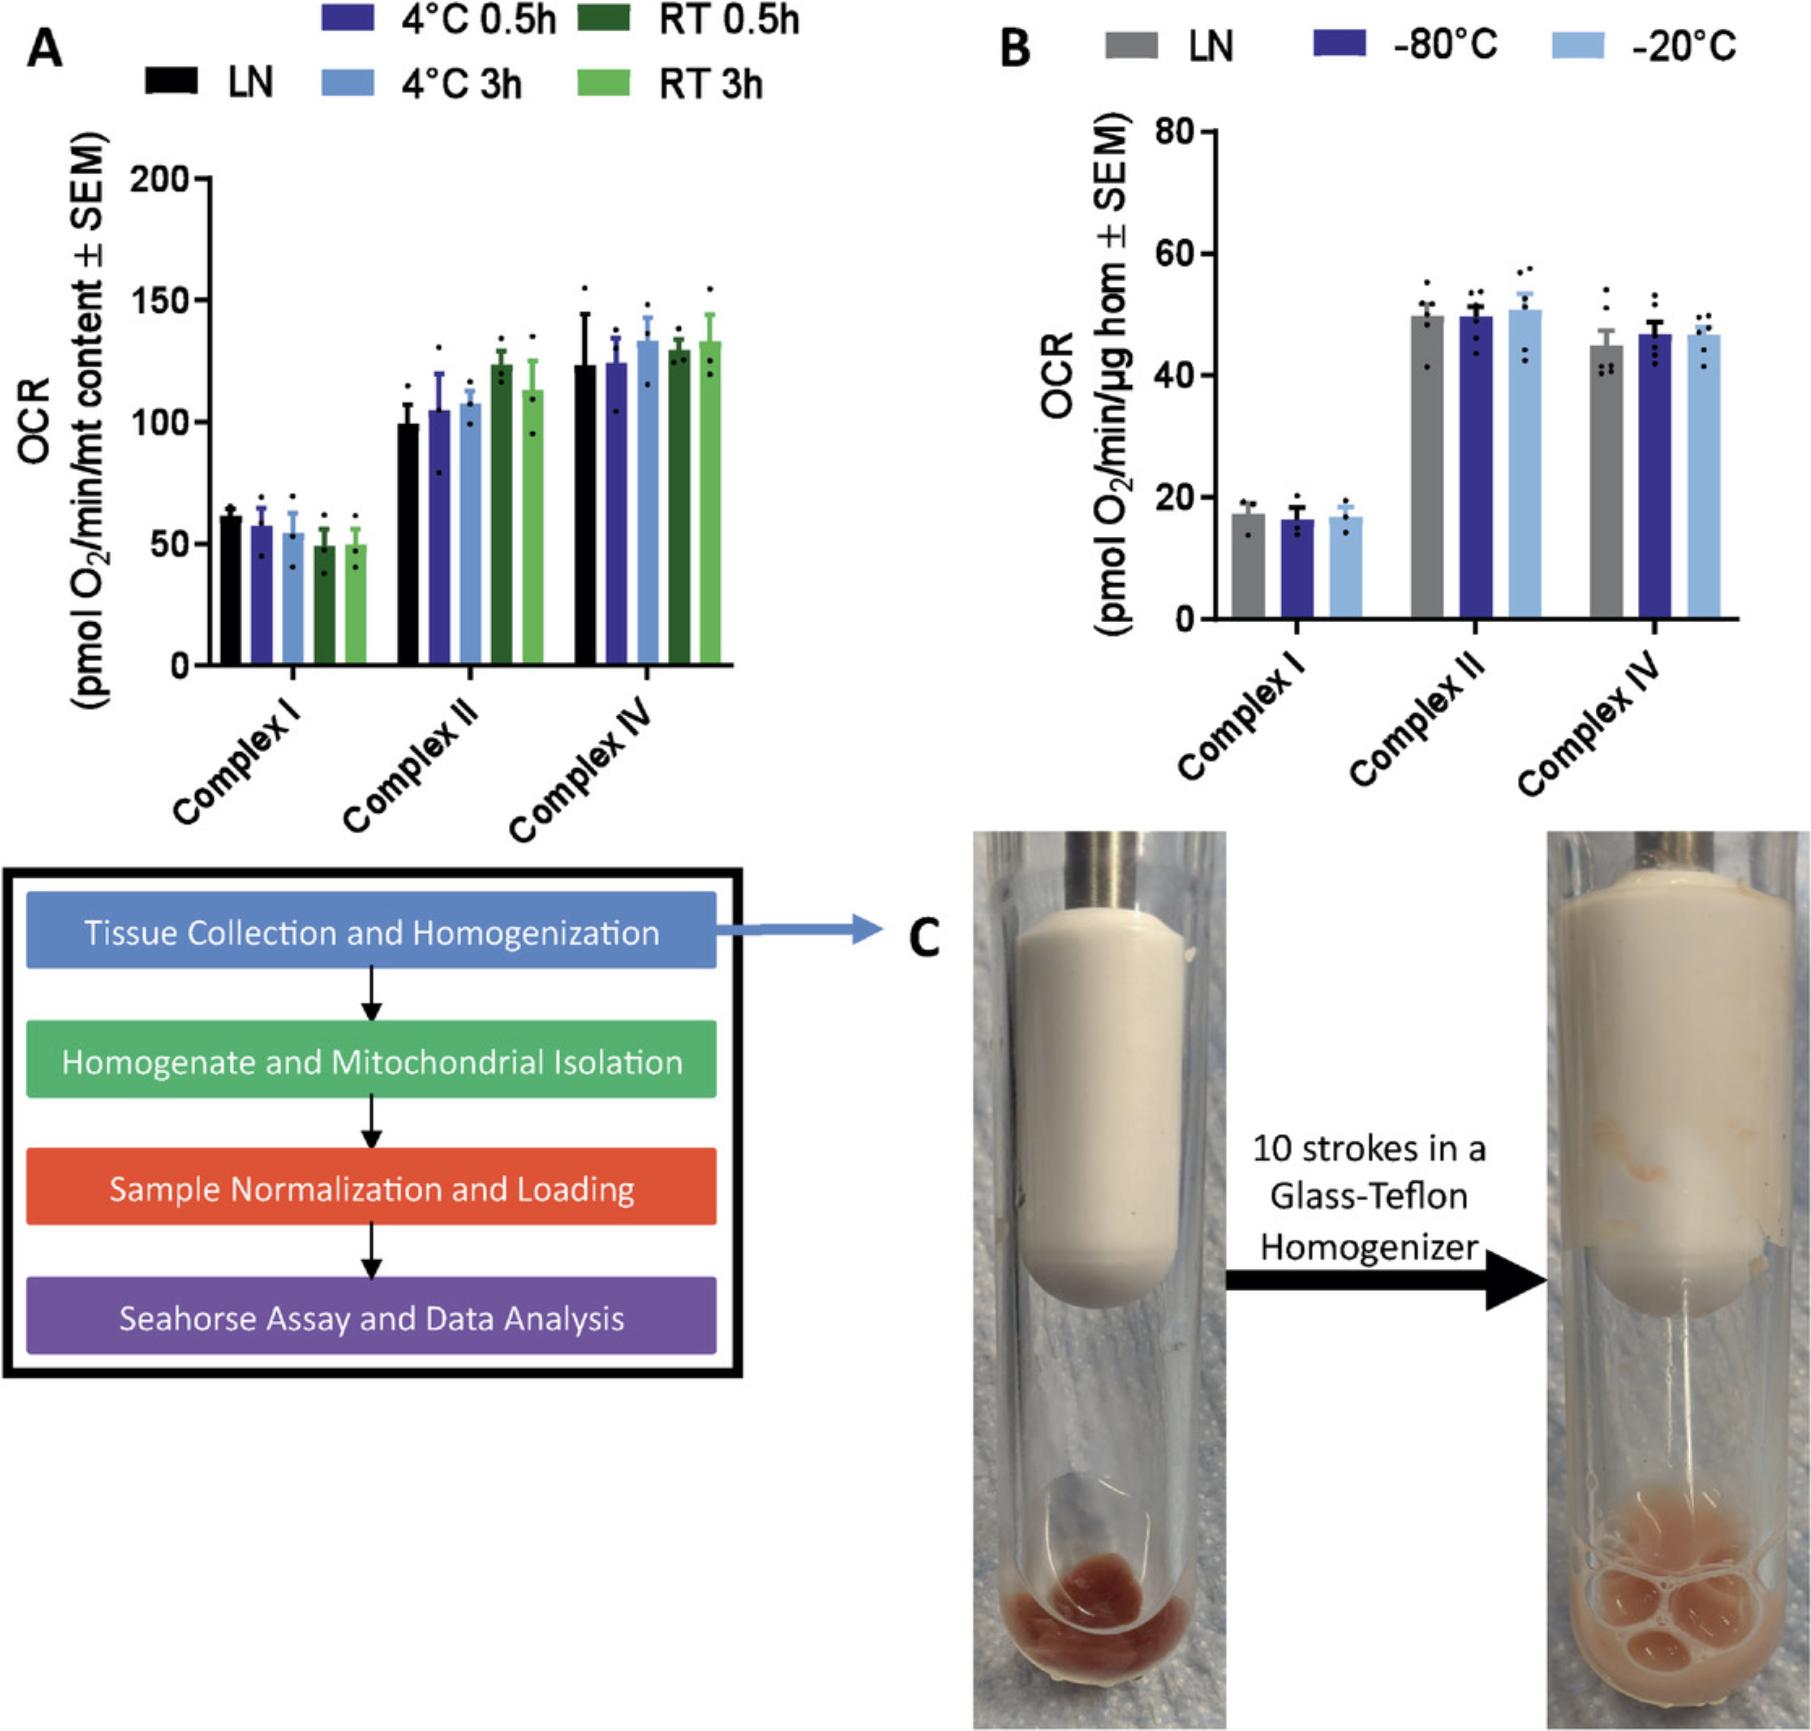
Detailed in Acin-Perez et al. (2020), the maximal respiratory capacity measured from frozen tissues using this assay is comparable to that measured in fresh tissue (Figure 2A). Freeze-thawing impairs mitochondrial respiration by disrupting and permeabilizing the mitochondrial inner membrane, which releases electron carriers that support the electron transport chain (Figure 2C). However, the interaction of electron transport complexes (supercomplexes) remains intact under freeze-thawing conditions, allowing for integrated electron transport as seen in fresh tissues. This article, therefore, provides instructions to rescue the defects induced by freeze-thawing, as well as to control the entry of electrons into the electron transport system by providing different electron carriers. As our procedure allows for the specific measurement of oxygen consumed by complex IV, mitochondrial isolation is no longer necessary, allowing for the use of homogenates to measure mitochondrial function, significantly simplifying tissue preparation (described in Basic Protocol 1).
The methodology described in this article is broken up into three subsections: Basic Protocol 1 for sample collection, storage, and homogenization for respirometry on previously frozen tissue; Basic Protocol 2 for running a Seahorse respirometry assay using previously frozen tissue samples; and Basic Protocol 3 for normalization to mitochondrial content for respirometry on previously frozen tissue (optional). Figure 1 provides a graphical representation of this method from start to finish. Basic Protocol 1 describes the process of dissecting a sample, freezing a sample for storage, and homogenizing a sample for a more simplified sample preparation. Basic Protocol 2 details the loading of the XF96 Seahorse sample plate, describes the compounds to be loaded into the Seahorse cartridge injection ports, and lays out the Seahorse protocol steps to measure respirometry in previously frozen tissues. Basic Protocol 3 describes how to use MitoTracker Deep Red staining to normalize samples to mitochondrial content rather than whole protein content. Completion of this series of protocols will allow users to progress from removing a tissue of interest from a specimen, freeze the tissue for later study, and set up a Seahorse assay to obtain complex I, II, and IV functional readings from the previously frozen tissue sample.
Basic Protocol 1: SAMPLE COLLECTION, STORAGE, AND HOMOGENIZATION FOR PREVIOUSLY FROZEN TISSUE RESPIROMETRY
The following protocol details how tissue samples should be collected and stored prior to being analyzed using the previously frozen tissue respirometry assay. In this protocol, the tissue of interest will be isolated from the organism and frozen for long-term storage. Samples will then be manually homogenized and isolated via centrifugation, or, optionally mitochondria may be isolated from the homogenate. Finally, a BCA protein assay will be performed to normalize the samples either for immediate loading or for normalization to mitochondrial mass (described in Basic Protocol 3). If the protocol is followed accurately, the samples should progress from whole tissue to a homogenate or mitochondrial isolate that is ready for normalized loading on a Seahorse sample plate in Basic Protocol 2.
This sample preparation protocol is optimized for mouse liver isolation. See Troubleshooting (Table 3) for alterations to be made for the collection, preparation, and measurement of other tissue types using the frozen tissue respirometry method.
Materials
-
Mice
-
Phosphate-buffered saline (PBS; Sigma, P3813)
-
Liquid nitrogen (optional)
-
1× MAS buffer (see recipe)
-
Collagenase Type II (Worthington Biochemical, 4174; optional)
-
BCA Protein Assay Kit (ThermoFisher, 23225, or equivalent)
-
Scissors and other dissection tools
-
Glass-glass or glass-Teflon Dounce homogenizer
-
Refrigerated centrifuge
-
Additional reagents and equipment for euthanasia of mice ((see Current Protocols article: Donovan & Brown, 2006)
Tissue collection
1.Euthanize mice using isoflurane anesthesia followed by cervical dislocation (see Current Protocols article: Donovan & Brown, 2006) as approved by Institutional Guidelines for Animal Care in compliance with U.S. Public Health Service Regulations.
2.Dissect the tissue of interest, wash with PBS, and optionally mince with scissors.
3.Snap freeze in liquid nitrogen. For long-term storage, store the frozen tissue at −80°C.
Tissue homogenization
4.Thaw samples in ice-cold PBS and mince with pre-chilled scissors or razor blades.
5.Homogenize using 250 µl to 500 µl per 10 mg of tissue of ice-cold MAS buffer using the appropriate homogenizer (Fig. 3C illustrates this process). For liver, brown adipose tissue, brain, kidney, lung, and skeletal muscle, use ten to twenty strokes in a glass-Teflon Dounce homogenizer. For heart and white adipose tissue, use twenty strokes in a glass-glass Dounce homogenizer.
CRITICAL : For muscle tissue, incubate homogenized tissue in collagenase Type II (0.25 mg/ml final concentration) in MAS at 37°C for 30 min prior to centrifugation.
6.Centrifuge homogenates 5 min at 1000 × g , 4°C.
CRITICAL : If using swinging-bucket centrifuge, measure the precise distance between rotor center and the center of mass of the liquid homogenate in the tube in the horizontal swinging position in order to correctly calculate the g to rpm conversion:

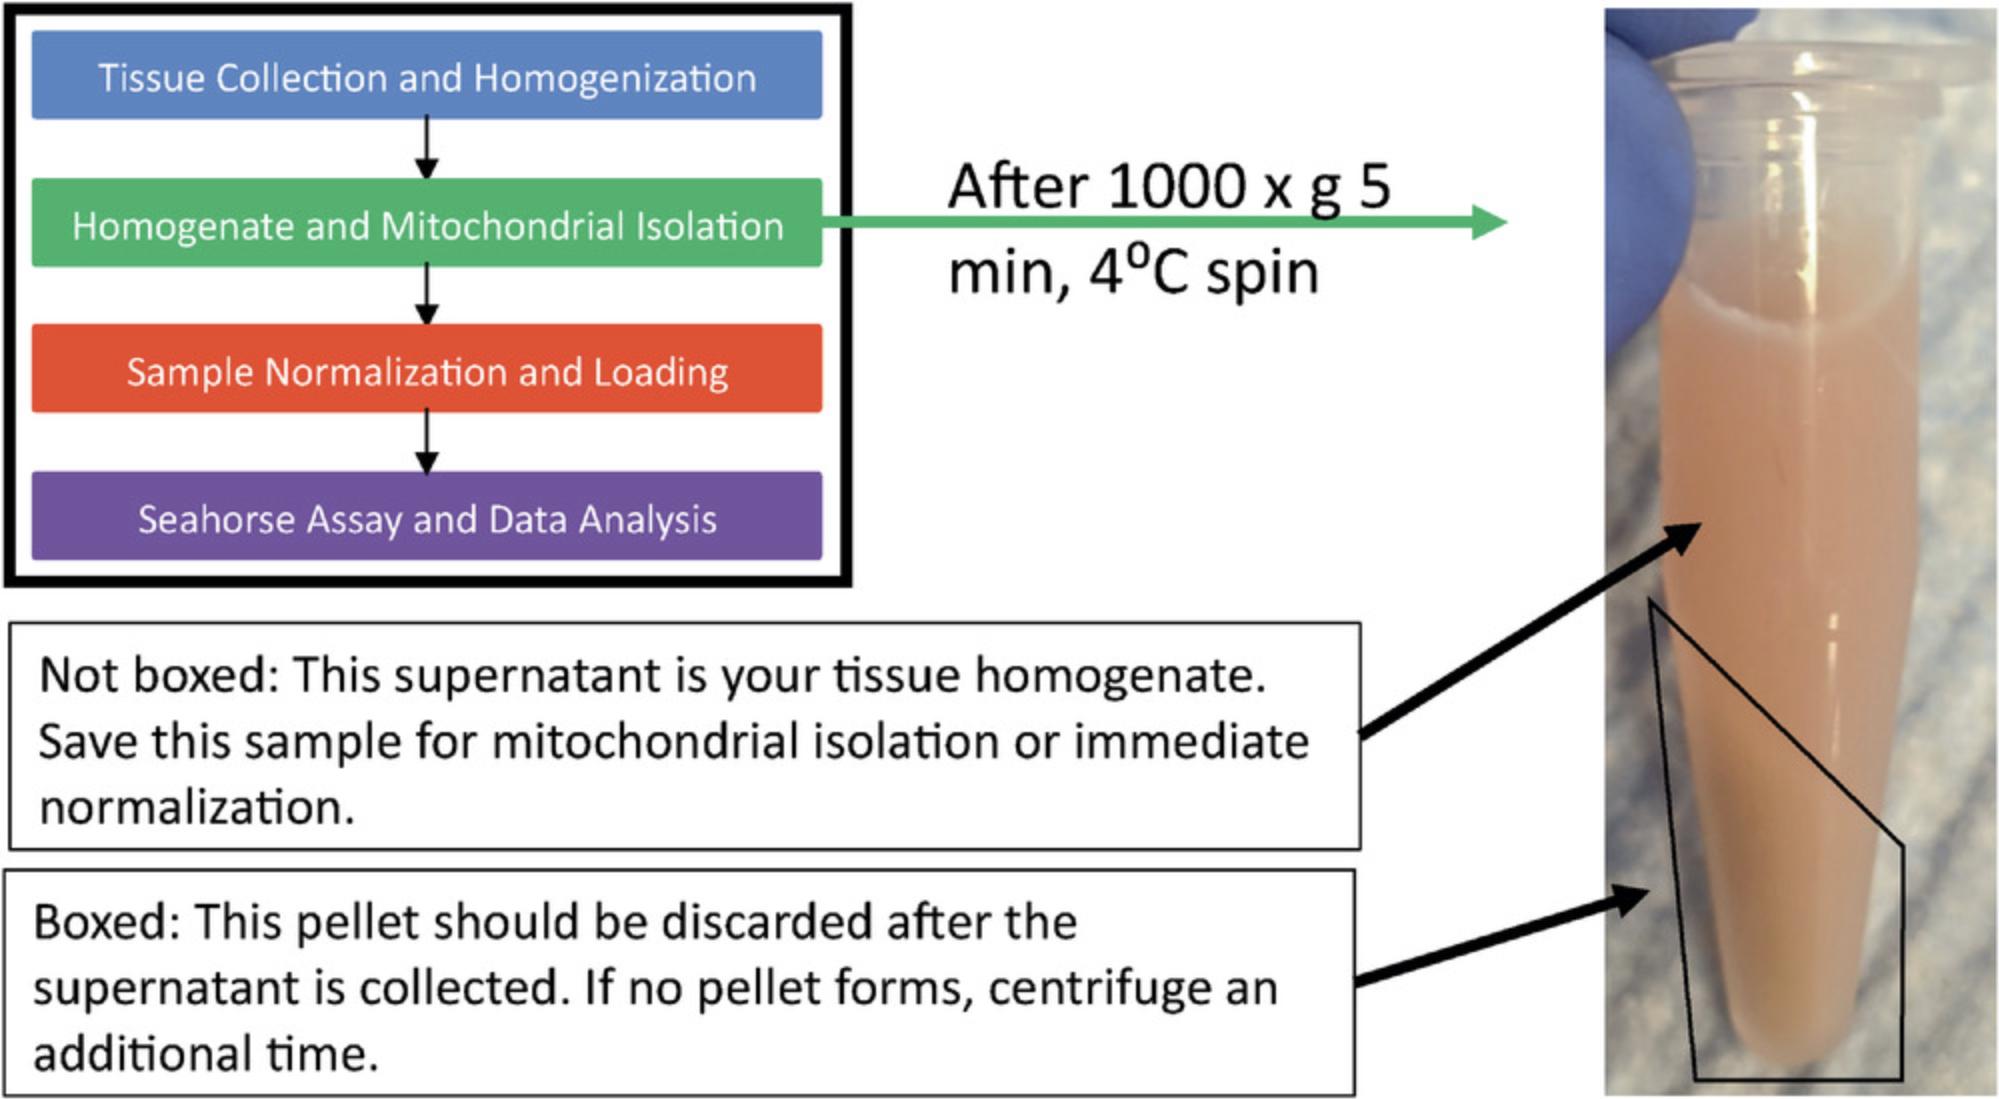
7.Collect the resulting supernatant as the homogenate sample. Discard the pellet (Fig. 4). The supernatant (tissue homogenate) may be stored at −80°C for long-term storage.
8.If you are running the sample as a tissue homogenate, perform a BCA protein assay to normalize your samples according to protein content prior to loading on the Seahorse XF96 sample plate (Fig. 5B, Method 1). If you are normalizing according to mitochondrial content, perform a BCA protein assay and continue with the steps detailed in the optional Basic Protocol 3 (Fig. 5B, Method 2). If you are isolating mitochondria from the tissue homogenate, proceed with the following steps for mitochondrial isolation protocol.
Mitochondrial isolation from homogenate (optional)
9.If mitochondrial isolation is desired, centrifuge the rest of the homogenate preparation (the supernatant from the above centrifugation) 10 min at 10,000 × g , 4°C.
10.Optionally, wash mitochondrial pellets twice in 1× volume of MAS buffer, each time centrifuging as in step 9.
11.Re-suspend final mitochondrial pellet in ice-cold MAS buffer.
12.Perform a BCA protein assay using the mitochondrial homogenates. This may be used to normalize the sample according to protein content for loading, or optionally to prepare for mitochondrial mass normalization using MitoTracker Deep Red dye as described in Basic Protocol 2.
Sample data
Figures 3C and 4 depict the results one should obtain after sample collection. Figure 3C shows a mouse liver sample that has been homogenized using a glass-Teflon homogenizer. Figure 4 shows the same sample after centrifugation, highlighting the pellet formed (which should be discarded) and the supernatant (which should be saved). If this sample separation does not occur after centrifugation, you should repeat the centrifugation step a second time.
Basic Protocol 2: RUNNING A SEAHORSE RESPIROMETRY ASSAY USING PREVIOUSLY FROZEN TISSUE SAMPLES
This protocol will detail the process of loading normalized samples onto an XF96 Seahorse plate, loading the Seahorse cartridge with compound injections, and running samples on the Seahorse platform. Samples will be loaded onto a XF96 sample plate, then centrifuged and diluted before loading the plate onto the Seahorse. Additionally, this protocol describes the loading of the Seahorse cartridge with compound injections. If this protocol is followed accurately, an operator will be capable of loading samples onto an XF96 sample plate, loading compound injections into a Seahorse cartridge, and running the plates on a Seahorse XF96 system. While this protocol is optimized for use with the Seahorse platform, with optimization, it could be adjusted to work with other respirometry platforms like the Oroboros.
Materials
-
Tissue homogenates or mitochondrial isolates (Basic Protocol 1)
-
1× MAS buffer (see recipe)
-
Cytochrome c (Sigma, C2506)
-
Alamethicin (Sigma, A4665; optional)
-
NADH (Sigma, N8129)
-
Succinate (Sigma, S9512)
-
Rotenone (Sigma, R8875)
-
Antimycin A (ENZO, ALX380075M010)
-
TMPD (Sigma, 87890)
-
Ascorbic acid (Fisher, A61-100)
-
Sodium azide (Sigma, S8032)
-
Potassium hydroxide (KOH)
-
Hydrochloric acid (HCl)
-
Seahorse XF96 flux pack (Agilent 102416-100)
-
Swinging-bucket centrifuge with plate carrier adapter
-
Multichannel pipettes
-
Seahorse XF96 instrument
1.Load homogenates or mitochondrial isolates, based on your BCA normalization results, into a Seahorse XF96 microplate (from the Seahorse XF96 flux pack) in 20 µl of MAS buffer. Optimal loading concentration will vary depending on the sample material, but for most samples a concentration between 2.5 and 20 µg of sample per well will be sufficient. See Table 3 in the Troubleshooting section of this document for approximate loading concentrations for different tissue types.
2.Centrifuge the loaded plate 5 min at 2000 × g , 4°C, using a plate carrier.
CRITICAL : Turn OFF the centrifuge brake and let buckets slow down by themselves. Sudden deceleration due to braking will result in uneven distribution of materials on the bottom of the plate.
3.Carefully add 130 µl (or enough to achieve a final volume of 150 µl) per well of 1× MAS buffer containing cytochrome c (10 µg/ml, final concentration) for homogenates, or the same volume of MAS buffer alone for isolated mitochondria.
CRITICAL : For brain and lung homogenates, add alamethicin (10 µg/ml, final) to the MAS buffer containing cytochrome c to allow complete membrane permeabilization to substrates.
4.Load the cartridge to deliver 25 µl of the following injections (Fig. 6A):
-
Port A: NADH (1 mM) for complex I assessment, or 5 mM succinate + 2 µM rotenone for complex II assessment.
-
Port B: Antimycin A (4 µM)
-
Port C: TMPD + ascorbic acid (0.5 mM TMPD + 1 mM ascorbic acid)
-
Port D: Sodium azide (50 mM) at port D.
All compound injections should be diluted in 1× MAS buffer. When making the TMPD + ascorbate solution, add 0.5 mM TMPD into 1 mM ascorbate and adjust the solution to pH 7.2 using potassium hydroxide (KOH) and hydrochloric acid (HCl). NADH and TMPD/ascorbate solutions must be made freshly on the day of the assay, but all other compound injections can be made ahead of time and stored at −20°C until time of use.
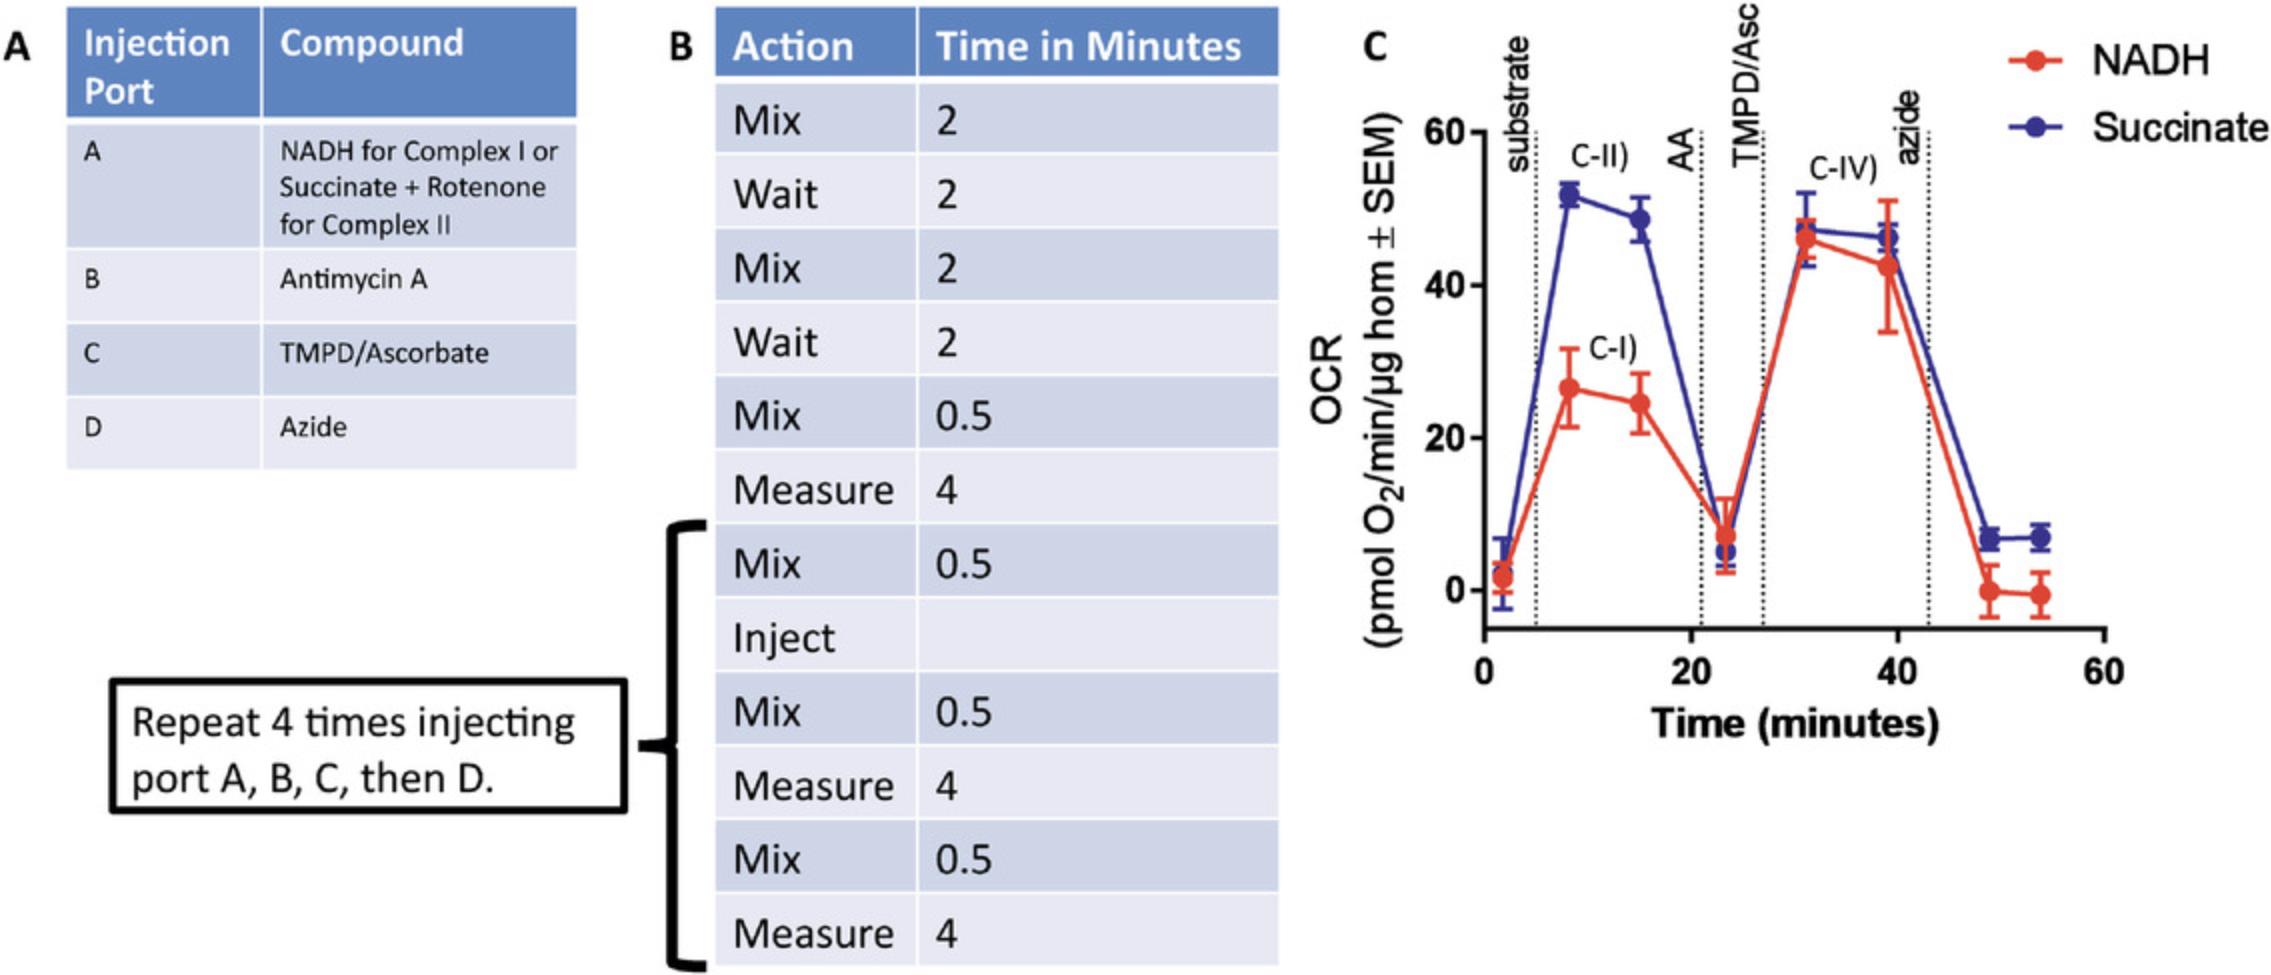
5.Mix and measure times for the Seahorse run protocol are 0.5 and 4 min, respectively. If a protocol includes an oligomycin injection, a 2-min wait time should be included between the injection of oligomycin and the 4-min measurement period (Fig. 6B).
Sample data
Figure 6C depicts a representative Seahorse trace for a standard assay which measures complex I, II, and IV in mouse liver homogenates. Figure 6C-I and C-II highlight the complex I NADH peak and complex II succinate + rotenone peak, respectively. Figure C-IV highlights the complex IV TMPD + ascorbate peaks from the complex I and complex II samples. This Seahorse trace not only has distinct peaks for all substrate injections, but also has strong and distinct responses to the inhibitors (antimycin A and azide) used in the assay, making it an optimal-looking trace.
Basic Protocol 3: NORMALIZATION TO MITOCHONDRIAL CONTENT FOR PREVIOUSLY FROZEN TISSUE RESPIROMETRY (OPTIONAL)
The following protocol describes normalization of the results from respirometry samples according to mitochondrial content. Homogenates or mitochondrial isolates (made in Basic Protocol 1) will undergo MitoTracker Deep Red (MTDR) staining and measurement. Using this data, samples can be normalized based on their mitochondrial content rather than using a whole protein measurement.
Materials
-
Tissue homogenates or mitochondrial isolates (Basic Protocol 1) or Seahorse sample plate from Basic Protocol 2
-
1× MAS buffer (see recipe)
-
MitoTracker Deep Red FM (MTDR; Thermo, M22426)
-
Clear, flat-bottom, black 96-well plate (Corning, 3904 or equivalent)
-
Seahorse XF96 flux pack (Agilent 102416-100) including sample plate
-
Multichannel pipette
-
Refrigerated centrifuge with plate adapter
-
Fluorescence plate reader or high-throughput microscope
Normalizing to mitochondrial content
For protein content−based normalization using homogenates or mitochondrial isolates, use the BCA protein data previously generated (in Basic Protocol 1) to load equivalent protein amounts in the XF96 Seahorse plate as described in Basic Protocol 2 (Fig. 5B, Method 1).Normalization for mitochondrial content using MitoTracker Deep Red (MTDR) may be performed before or after running the Seahorse sample plate.
While MTDR normalization can be performed at any step after BCA values have been generated, loading onto the Seahorse sample plate is exclusively done based on BCA values. Normalization to mitochondrial content should only be done after oxygen consumption rate (OCR) values are obtained.
Normalizing to mitochondrial content before running a Seahorse experiment (Fig. 5B, Method 2a
1a. Perform protein normalization via BCA assay as described above (Basic Protocol 1).
2a. On a clear, flat-bottom, black, 96-well plate, seed 2.5-80 µg of mitochondria or lysate sample (according to protein normalization values) in 100 µl of MAS buffer containing MTDR at 1 µM final concentration.
3a. Incubate the sample plus dye at 37°C for 10 min.
4a. Remove the dye by centrifuging the sample 5 min at 2000 × g , 4°C, with no brake for deceleration. Carefully remove the supernatant and resuspend in 100 µl of MAS buffer.
5a. Measure fluorescence in a plate reader or high-throughput microscope using a clear-bottom black 96-well plate (Corning 3904 or equivalent). MTDR is excited at 625 nm and emits at 670 nm.
6a. Calculate relative mitochondrial content after controlling for background fluorescence using a blank well.
Normalizing to mitochondrial content after running a Seahorse experiment (Fig. 5B, Method 2b)
1b. Remove the Seahorse sample plate from the Seahorse machine.
2b. Carefully, without agitation of the sample material at the bottom of the Seahorse sample plate, remove the MAS buffer from the plate until approximately 80 µl of liquid remains in each well.
3b. Add 20 µl of 5 µM MTDR in MAS buffer to each sample such that each sample now has 100 µl of liquid with a final MTDR concentration of 1 µM.
4b. Incubate the sample plus dye at 37°C for 10 min. Ensure that the incubation period is no more than 10 min; too long of an incubation period can result in high background MTDR fluorescence.
5b. Add 100 µl of MAS buffer without MTDR to each sample. Remove 100 µl of solution from each well. Perform this washing procedure up to three times.
6b. Measure fluorescence in a plate reader or high-throughput microscope.
7b. Calculate relative mitochondrial content after controlling for background fluorescence using a blank well. For absolute quantification, use an isolated mitochondria standard.
Sample data
Table 1 showcases data from a MTDR plate reader assay to normalize mouse liver by mitochondrial content before loading a Seahorse sample plate. The columns titled “raw absorbance units” and “µg of protein loaded via BCA” will be filled in by the user based on the plate reader results and the amount of protein added to the plate for the MTDR reading (determined via BCA). Dividing the raw absorbance minus the background absorbance and the µg of protein loaded results in the data in the farthest right column entitled “(Raw AU - background)/(µg protein),” which is now a reading of mitochondrial content per µg of protein in the sample. Normalization may then be performed such that the OCR values obtained are normalized to measurements of OCR per mitochondrial content.
| Sample number | Raw absorbance units (AU) | Raw AU − background | µg protein loaded via BCA | (Raw AU − background)/(µg protein) |
|---|---|---|---|---|
| Background | 1940 | |||
| 1 | 21540 | 19600 | 10 | 1960 |
| 2 | 19411 | 17471 | 10 | 1747.1 |
| 3 | 23593 | 21653 | 10 | 2165.3 |
| 4 | 36932 | 34992 | 10 | 3499.2 |
| 5 | 41933 | 39993 | 10 | 3999.3 |
| 6 | 18971 | 17031 | 10 | 1703.1 |
| 7 | 34057 | 32117 | 10 | 3211.7 |
| 8 | 39941 | 38001 | 10 | 3800.1 |
| 9 | 49203 | 47263 | 10 | 4726.3 |
- a
This figure shows an example data set of MTDR readings from mouse liver homogenate samples. The user will be generating data to fill the “raw absorbance units” and “ug protein loaded via BCA” columns of the table. The “raw absorbance units” column will be filled with the absorbance readings from the plate reader or high-throughput microscope taking MTDR measurements. The “µg protein loaded” via BCA will be filled with the amount of protein loaded (calculated via BCA) into the well for the MTDR reading. Using these two values, the final column titled “(Raw AU - background)/(µg protein)” can be calculated by dividing the raw absorbance minus background and the µg protein loaded via BCA. Normalizing your samples based upon the values in this column will result in equivalent sample loading based upon mitochondrial content.
REAGENTS AND SOLUTIONS
MAS buffer, 1×
- 70 mM sucrose (Fisher, L-12686)
- 220 mM mannitol (Sigma, M9546)
- 5 mM KH2PO4 (Sigma, P5655)
- 5 mM MgCl2 (Sigma, M0250)
- 1 mM EGTA (Sigma, E4378)
- 2 mM HEPES (Corning, 25-060-CI)
Adjust to pH 7.4 using potassium hydroxide (KOH) or hydrochloric acid (HCl). Store up to 1 year or longer at −20°C.
COMMENTARY
Background Information
Mitochondrial respiration results in the transfer of electrons between electron transport chain complexes I, II, III, and IV, with complex IV reducing oxygen to water. With oxygen playing a primary and crucial role in the process, respirometry platforms like the Seahorse or Oroboros use the measurement of oxygen consumption rate as a surrogate marker for mitochondrial activity. Current mitochondrial respirometry techniques for in vivo samples require that the processing and measurement of the living tissue sample happen within an hour of isolation from the specimen. This requirement is set by the need to preserve the integrity of the inner mitochondrial membrane, needed both for integrated electron transfer between the complexes as well as to preserve the coupling of electron transfer to ATP synthesis. Although freeze-thawing disrupts and permeabilizes the mitochondrial inner membrane, our novel respirometry method overcomes this challenge to allow for previously frozen tissue samples to be measured. Mitochondrial supercomplexes remain intact despite freeze-thawing; therefore, we have developed a set of substrates that are capable of measuring complex I, II, and IV through measurement of these supercomplexes. While this assay cannot measure coupled mitochondrial respiration, as can be done in fresh tissue respirometry, freezing tissues allows for long-term tissue storage and simplified sample processing through use of tissue homogenates, thereby enabling respirometry experiments that are less time-intensive, require less tissue processing, and are less expensive, facilitating large-scale respirometry research studies when compared to current respirometry methods.
Critical Parameters
Multiple parameters within this methodology are critical to obtaining good results from your respirometry run. In Basic Protocol 1, the most critical parameter to success is the homogenization step. If there is too little homogenization, mitochondria will not be released from the cell, resulting in low yield; too much homogenization might impact the mitochondrial supercomplexes. We have provided guidelines for the types of homogenizers and the number of strokes required for different tissues, but this could be a variable to optimize if you are getting suboptimal mitochondrial yield from your tissue samples.
Basic Protocol 2 is likely the part of the procedure that is most sensitive to certain experimental parameters. The most important parameter in this basic protocol is that centrifugation steps be done with the centrifuge brake turned OFF. Braking during deceleration of the centrifuge can result in an uneven distribution of the sample across the bottom of the Seahorse sample plate, adversely effecting OCR results and reproducibility. A centrifuge with the capability of having the brake turned off is necessary for best performance in this assay. An additional variable to consider for this part of the assay is how much sample is being loaded onto the sample plate. Too little sample and OCR values will be very low, but having too much sample can result in oxygen depletion and inconsistent responses to the compound injections (diagnosing these issues is discussed in the Troubleshooting, below). We recommend titrating your sample material to find the optimal loading concentrations that provide the best Seahorse results.
Basic Protocol 3 has few parameters that are critical to results, but it must be noted that while normalization to mitochondrial content is optional, it provides an additional analysis technique that may explain differences in respiration due to samples having differing numbers of mitochondria. An example of where this may be impactful is if two samples have the same OCR reading, but one sample has fewer mitochondria that have higher respiratory capabilities and the other has many mitochondria that have low respiratory capabilities. In this scenario, normalizing the data to mitochondrial content could elucidate these differences.
Troubleshooting
This troubleshooting section is designed to account for issues specific to frozen tissue respirometry, although traditional Seahorse troubleshooting techniques will likely also apply to this technique. Figure 6C displays a representative Seahorse trace for a standard assay measuring complexes I, II, and IV in liver homogenates. Table 2 describes factors that may cause poor respirometry results. Additionally, this table catalogs how to diagnose these errors and the potential solutions to improve respirometry sample performance. This protocol was initially optimized for frozen liver respirometry, but many other tissue types have been successfully tested using this procedure, with some modifications. Table 3 compiles some of the potential optimizations in tissue collection and respirometry when using alternative tissue types with this protocol. Further examples of respirometry results using alternative tissue types including Seahorse traces can be found in Acin-Perez et al. (2020); also see Table 3.
| Observation | Etiology | Solution | Additional confirmation of etiology |
|---|---|---|---|
| Low respiration | Insufficient mitochondrial mass | Remeasure respiration using a larger amount of sample material. Alternatively, using mitochondrial isolates rather than whole tissue homogenate can improve the results when using lower-mitochondrial-mass samples. | Confirm your mitochondrial content using the assays described in Basic Protocol 3 |
| Homogenate too dilute/low mitochondrial mass to total protein ratio | Concentrating the sample material by centrifuging at very high speeds and resuspending in a lower volume can limit the amount of non-mitochondrial “debris” that may clog the pores of the Seahorse plate. Additionally, titrating the amount of sample loaded into the Seahorse plate may also improve performance. | This can be common in tissues like WAT, which may have a lot of non-mitochondrial “debris” that can block the pores of the Seahorse plate. This phenotype commonly causes high variability between samples, oxygen depletion, and possible lack of response to compound injections. | |
| Tissue degradation | Ensure that all samples, buffers, and equipment are kept ice-cold during all steps of the procedure to prevent tissue degradation from occurring | Confirm that the mitochondrial supercomplexes of your sample are intact using Blue Native Gel-Electrophoresis (BNE) | |
| Incomplete uncoupling or permeabilization | Add 10 µg/ml final concentration of alamethicin (or your chosen permeabilization agent) to the assay buffer | Permeability and distribution of some compounds may be limited in samples that contain a large proportion of lipids or membranes. | |
| Over-permeabilization | Titrate the digitonin until supercomplexes are intact and respiration is elicited with membrane-impermeable substrate NADH | Confirm that the mitochondrial supercomplexes of your sample (after detergent addition) are intact using Blue Native Gel-Electrophoresis (BNE) | |
| Insufficient cytochrome c | Titrate cytochrome c for your samples | Measure cytochrome c in your preparation and supernatant. | |
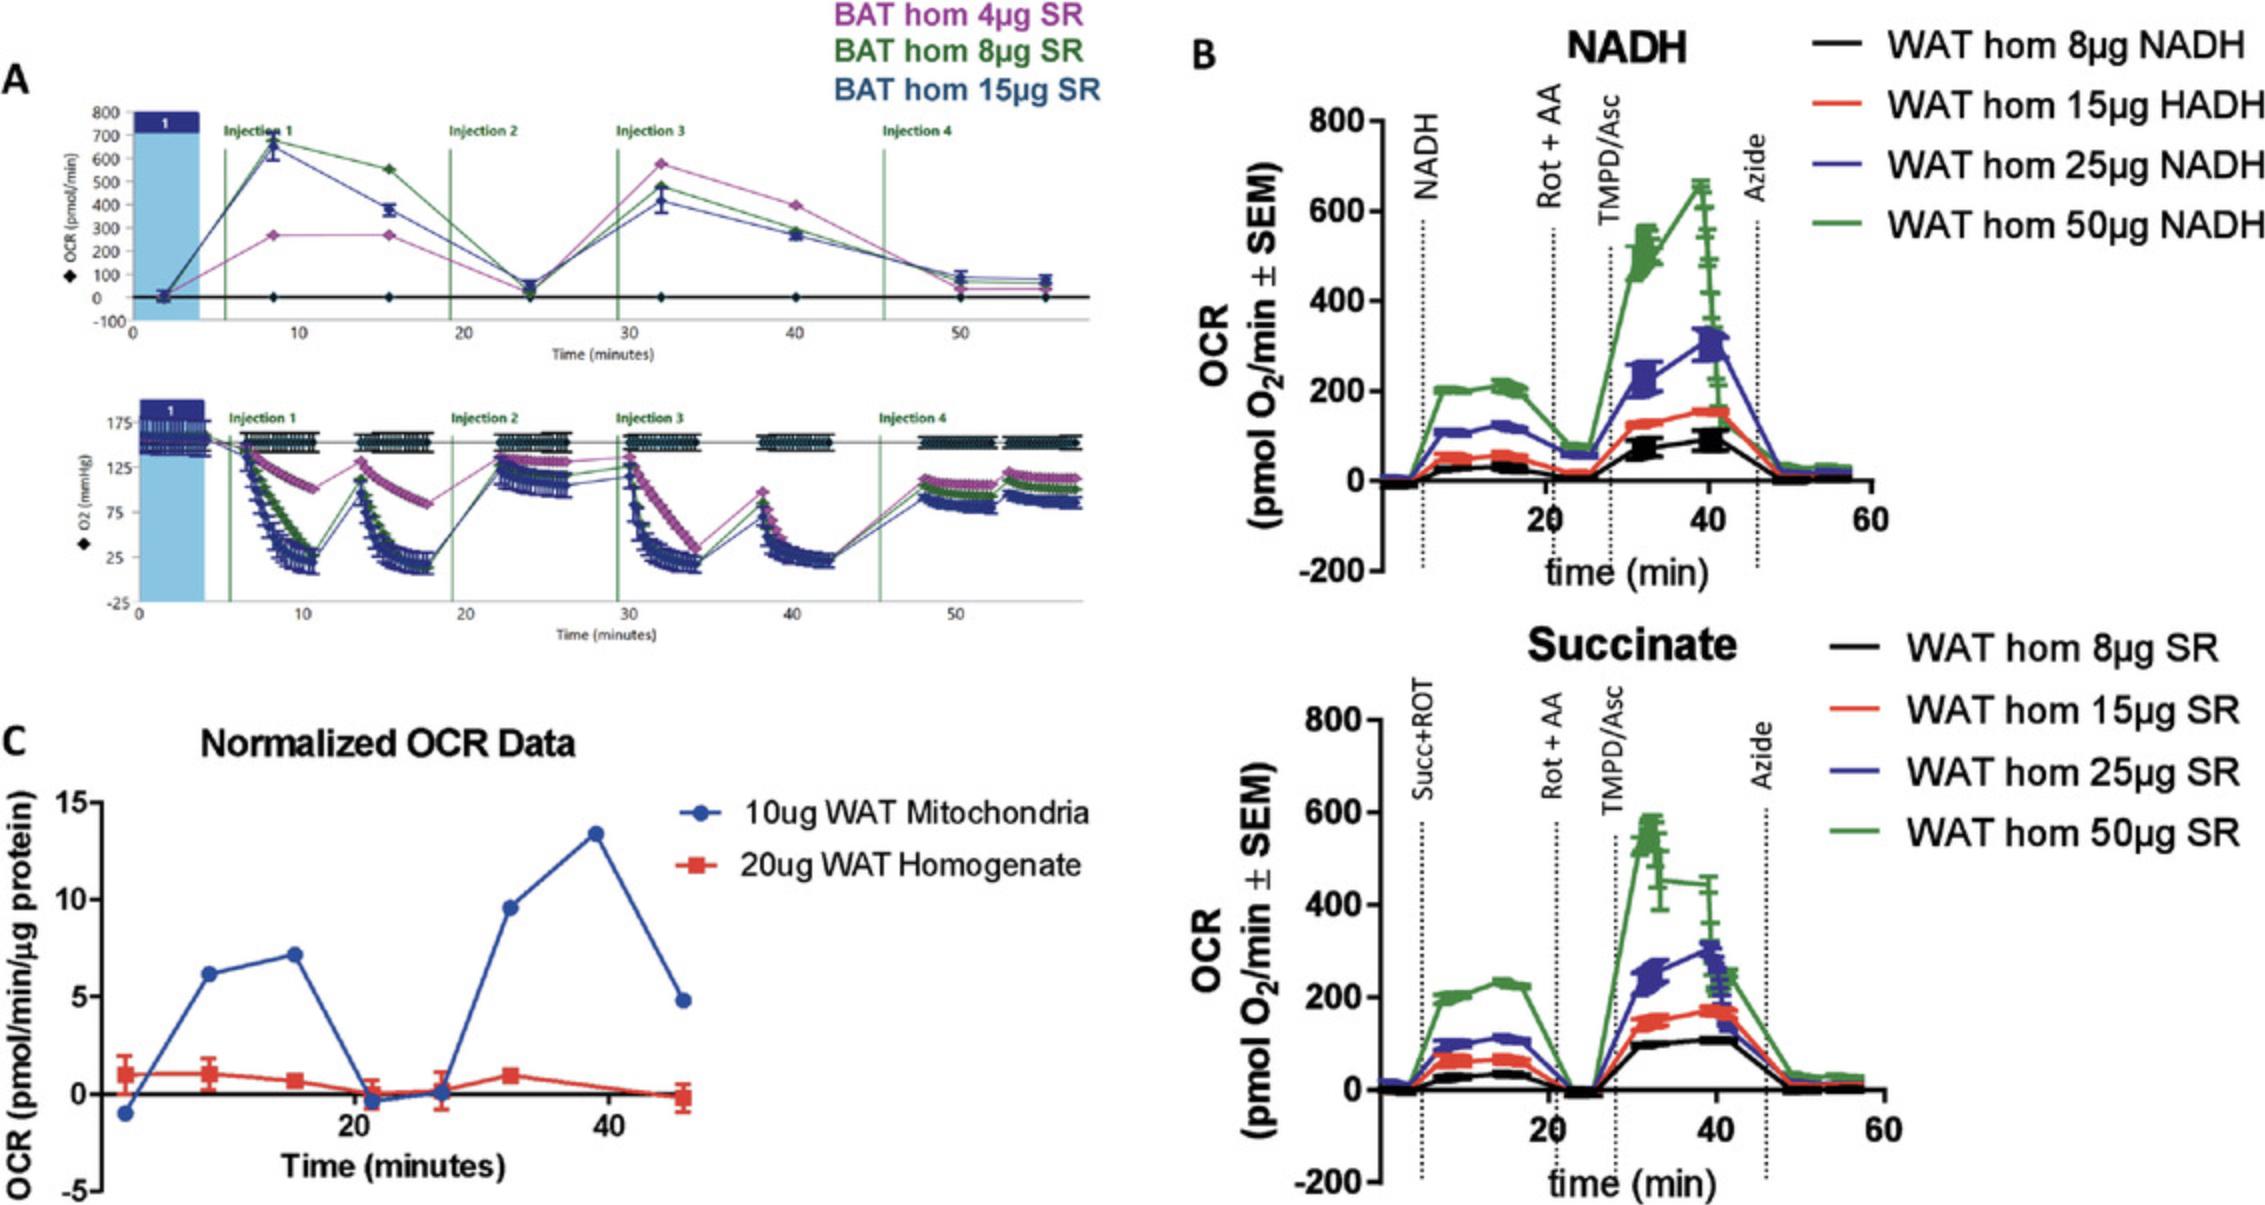
| Excess mitochondrial mass (oxygen depletion) | Down-titrate the amount of sample loaded into the wells to prevent oxygen depletion | Check the oxygen traces generated during the run in the Seahorse software. Sharply declining and/or negative oxygen values (examples shown in Fig. 7A) are associated with oxygen depletion. | |
| Mitochondria are not evenly distributed on the bottom of the sample plate | If a centrifuge brake is applied when spinning down the sample plate, it is possible that the mitochondria will not be evenly distributed along the bottom of the wells of the Seahorse plate | Viewing the sample plate under a microscope prior to running the Seahorse will determine if the mitochondria are not evenly distributed along the bottom of the plate | |
| No NADH response | Incomplete permeabilization | Add 10 µg/ml final concentration of alamethicin (or your chosen permeabilization agent) to the assay buffer | |
| No succinate + rotenone response | Old stocks of succinate/rotenone | Remake the stocks of succinate + rotenone | After prolonged storage, succinate + rotenone may begin to precipitate out of solution |
| No antimycin A response | Non-mitochondrial respiration | Running a mitochondrial isolation rather than homogenates can be used to reduce or even eliminate non-mitochondrial respiration impacting the results | Incomplete inhibition of OCR by antimycin A can be common in some human samples. This typically respresents non-mitochondrial respiration: can impact OCR under antimycin A. |
| No TMPD/ascorbate response | pH imbalance | Adjust the solution to reach pH 7.4 using HCl and KOH | Test the pH of the TMPD + ascorbate solution to ensure it is pH 7.4 |
| After compound injection, measurement 1 is dramatically different from measurement 2 | Oxygen depletion | Down-titrate the amount of sample loaded into the wells to prevent oxygen depletion. Adding a wait or mixing step in between measurement 1 and measurement 2 can allow oxygen levels to equilibrate between measurements to eliminate variability between the two measurements. | Check the oxygen traces generated during the run in the Seahorse software. Sharply declining and/or negative oxygen values (examples shown in Fig. 7A-B) are associated with oxygen depletion. |
| NADH depletion | Higher injection concentrations of NADH, multiple NADH injections, or decreasing mitochondrial loading can alleviate potential NADH depletion | For complex I measurement, it is possible that with high mitochondrial loading in certain cell types, NADH depletion may occur after measurement 1 | |
| TMPD + ascorbate-induced OCR is lower than complex I/II OCR values | Excess mitochondrial mass | Decrease the amount of sample loaded into the sample plate | Diminished TMPD values can occur as a result of oxygen depletion related to having too much mitochondrial mass loaded |
| Tissue type | Tissue collection/isolation | Respirometry considerations | Approximate loading amounts |
|---|---|---|---|
| Heart | A glass-glass Dounce homogenizer should be used to more thoroughly disrupt the tissue for the best results | 1-2 µg | |
| White adipose tissue | A glass-glass Dounce homogenizer should be used to more thoroughly disrupt the tissue for the best results. Spin samples at 20,000 to 25,000 × g to further concentrate the sample and potentially remove the fat from the mitochondria. | Using more concentrated samples can increase rates above baseline and improve response to compounds in the Seahorse plate (Fig. 7C) | 10-15 µg |
| Muscle | Increasing the number of homogenization strokes can improve the results with fibrous tissues like muscle. Alternatively, using collagenase type II at 0.25 mg/ml final concentration during homogenization can aid in the tissue homogenization process. | 6-8 µg | |
| Human samples- white adipose tissue, liver, tumor samples, etc. | Human tissues often have more connective tissue and therefore require more strokes with the homogenizer or enzymatic digestion for the best results | Human tissues often respire at lower rates than mouse tissues or cell lines. To compensate for this, more sample should be loaded into the Seahorse plate. | Human liver: 15-20 µg, human adipose tissue: 10-15 µg, human tumor: 8-12 µg |
| Cell pellets | Alamethicin addition may help further permeabilize the cells. Necessity for further permeabilization is largely cell-type dependent and should be titrated prior to use in respirometry. | Depends on cell type | |
| Brain | Cells from the brain can often be very membrane rich. To compensate for this, alamethicin may be added to further permeabilize the cells for improved respirometry performance. | 6-10 µg |
Statistical Analysis
When the Seahorse run is complete, export the oxygen consumption rates (OCRs) from the Agilent Wave software and (if applicable) normalize by mitochondrial mass (MTDR readings) in Microsoft Excel. Calculate complex I-, II-, and IV-dependent respiration by the following formulas:
- Maximal respiratory capacity through complex I:

urn:x-wiley:19342500:media:cpcb116:cpcb116-math-0002 - Maximal respiratory capacity through complex II:

urn:x-wiley:19342500:media:cpcb116:cpcb116-math-0003 - Maximal respiratory capacity through complex IV:

urn:x-wiley:19342500:media:cpcb116:cpcb116-math-0004
Calculating the complex I to complex IV or complex II to complex IV ratio may serve as an alternative measurement of complex respiratory capacity.
Understanding Results
Figure 6C exhibits a representative Seahorse trace. The trace in red corresponds to a complex I peak (Figure 6C-I) followed by a complex IV peak (Figure 6C-IV) induced by NADH and TMPD/ascorbate, respectively. The trace in blue corresponds to a complex II peak (Figure 6C-II) followed by an additional complex IV peak (Figure 6C-IV) induced by succinate/rotenone and TMPD/ascorbate, respectively. This sample responds to all substrate and inhibitor injections and has relatively low standard deviations for each measurement across the three replicates tested. When analyzing the data, the primary data points of importance will be Figure 6C,D, the complex I respiration induced by NADH addition, Figure 6C,C-II, the complex II respiration induced by succinate addition, and Figure 6C,C-IV, the complex IV respiration induced by TMPD + ascorbate addition. The measurements after antimycin A injection and azide injection are used primarily as background controls where the antimycin A measurement represents any respiratory activity not produced by the non-mitochondrial respiration of the electron-transport chain complexes, and the azide measurement represents any non-mitochondrial respiratory activity still in the sample. Figure 7 showcases Seahorse traces which are not ideal. The Troubleshooting section, above, describes potential reasons for why certain traces may look like those in Figure 7.
Time Considerations
Basic Protocol 1 will take approximately 2 hr for 15 samples, not including dissection of the tissue of interest from the specimen (the time to do this will depend on the specimen and tissue being used). This time is largely based on manual homogenization of the samples; an automated system of tissue homogenization could dramatically decrease the sample processing time, although these methods would need to be optimized for the purpose of this assay. Basic Protocol 2 will take approximately 2 hr to set up for 15 samples, then the Seahorse run will take approximately 90 min, with no user input required. This process could be easily scaled up for more samples with multiple Seahorse instruments, where larger volumes of each compound injection could be made for multiple Seahorse cartridges. Basic Protocol 3 will take approximately 30-60 min for 15 samples. In total, 15 samples will take approximately 6 hr, although this time can be split between 1 day of sample processing and storage and 1 day of running the Seahorse assay.
Acknowledgments
A special thanks to all authors and contributors involved in Acin-Perez et al. (2020) for the foundational work surrounding this assay. The authors would like to thank Alexandra Brownstein and Shai Rambod as well as Drs. Ajit Divakaruni, Michael Shum, Daniel Dagan, Evan Taddeo, Alex Van der Bliek, Jose Antonio Enriquez, and Amy Wang for scientific discussions and valuable advice. This work was supported by UAB-UCSD O'Brien Center P30 DK079337 (VMDU), UAB Nathan Shock Center P30 G050886 (VMDU), HL110349 (RT), U54 DK120342 (KR and LV), R56AG060880 (JW), R01AG055518 (JW), K02AG059847 (JW), R21AR072950 (JW), UCLA Older Americans Independence Center P30AG028748 (JW), R01 DK099618-05 (OSS), R01 CA232056-01 (OSS), R21AG060456-01 (OSS), R21 AG063373-01 (OSS), ADA Grant No. 1-19-IBS-049 (OSS), R01AA026914-01A1 (ML), and Swiss National Science Foundation Grant No. 320030_170062 (FA). This work was supported by the NIH grant number 1R41ES031043-01A1.
Author Contributions
Corey Osto : Conceptualization; data curation; formal analysis; methodology; project administration; visualization; writing-original draft; writing-review & editing. Ilan Y. Benedor : Conceptualization; data curation; formal analysis; investigation; methodology; project administration; writing-original draft; writing-review & editing. Jennifer Ngo : Data curation; visualization; writing-original draft; writing-review & editing. Linsey Stiles : Conceptualization; data curation; formal analysis; investigation; methodology; project administration; supervision; validation; writing-original draft; writing-review & editing. Rebeca Acin-Perez : Conceptualization; data curation; formal analysis; investigation; methodology; project administration; supervision; validation; writing-original draft; writing-review & editing. Marc Liesa : Conceptualization; funding acquisition; methodology; project administration; resources; writing-review & editing. Orian Shirihai : Conceptualization; funding acquisition; methodology; project administration; resources; supervision; writing-review & editing.
Literature Cited
- Acin-Perez, R., Benador, I. Y., Petcherski, A., Veliova, M., Benavides, G. A., Lagarrigue, S., … Shirihai, O. S. (2020). A novel approach to measure mitochondrial respiration in frozen biological samples. The EMBO Journal , 39(13), e104073. doi: 10.15252/embj.2019104073.
- Donovan, J., & Brown, P. (2006). Euthanasia. Current Protocols in Immunology , 73, 1.8.1–1.8.5. doi: 10.1002/0471142735.im0108s73.
- Liesa, M., Palacín, M., & Zorzano, A. (2009). Mitochondrial dynamics in mammalian health and disease. Physiological Reviews , 89(3), 799–845. doi: 10.1152/physrev.00030.2008.
- Wallace, D. C. (2011). Bioenergetic origins of complexity and disease. Cold Spring Harbor Symposia on Quantitative Biology , 76, 1–16. doi: 10.1101/sqb.2011.76.010462.
Internet Resources
The Agilent Seahorse website provides valuable information on the reagents and equipment required for a standard Seahorse assay. Our protocol encompasses many of the special considerations to be made for a Seahorse run using previously frozen tissue, but Agilent provides a protocol for a standard Seahorse assay on their website.
Citing Literature
Number of times cited according to CrossRef: 17
- Pamela J. Yao, Apostolos Manolopoulos, Erden Eren, Susan Michelle Rivera, David R. Hessl, Randi Hagerman, Veronica Martinez‐Cerdeno, Flora Tassone, Dimitrios Kapogiannis, Mitochondrial dysfunction in brain tissues and Extracellular Vesicles Fragile X‐associated tremor/ataxia syndrome, Annals of Clinical and Translational Neurology, 10.1002/acn3.52040, 11 , 6, (1420-1429), (2024).
- Lucia Fernandez-del-Rio, Cristiane Benincá, Frankie Villalobos, Cynthia Shu, Linsey Stiles, Marc Liesa, Ajit S Divakaruni, Rebeca Acin-Perez, Orian S Shirihai, A novel approach to measure complex V ATP hydrolysis in frozen cell lysates and tissue homogenates, Life Science Alliance, 10.26508/lsa.202201628, 6 , 4, (e202201628), (2023).
- Arpita Chowdhury, Angela Boshnakovska, Abhishek Aich, Aditi Methi, Ana Maria Vergel Leon, Ivan Silbern, Christian Lüchtenborg, Lukas Cyganek, Jan Prochazka, Radislav Sedlacek, Jiri Lindovsky, Dominic Wachs, Zuzana Nichtova, Dagmar Zudova, Gizela Koubkova, André Fischer, Henning Urlaub, Britta Brügger, Dörthe M Katschinski, Jan Dudek, Peter Rehling, Metabolic switch from fatty acid oxidation to glycolysis in knock‐in mouse model of Barth syndrome, EMBO Molecular Medicine, 10.15252/emmm.202317399, 15 , 9, (2023).
- Rebeca Acin‐Perez, Cristiane Benincá, Lucia Fernandez del Rio, Cynthia Shu, Siyouneh Baghdasarian, Vanessa Zanette, Christoph Gerle, Chimari Jiko, Ramzi Khairallah, Shaharyar Khan, David Rincon Fernandez Pacheco, Byourak Shabane, Karel Erion, Ruchi Masand, Sundeep Dugar, Cristina Ghenoiu, George Schreiner, Linsey Stiles, Marc Liesa, Orian S Shirihai, Inhibition of ATP synthase reverse activity restores energy homeostasis in mitochondrial pathologies, The EMBO Journal, 10.15252/embj.2022111699, 42 , 10, (2023).
- Pascale Baden, Maria Jose Perez, Hariam Raji, Federico Bertoli, Stefanie Kalb, María Illescas, Fokion Spanos, Claudio Giuliano, Alessandra Maria Calogero, Marvin Oldrati, Hannah Hebestreit, Graziella Cappelletti, Kathrin Brockmann, Thomas Gasser, Anthony H. V. Schapira, Cristina Ugalde, Michela Deleidi, Glucocerebrosidase is imported into mitochondria and preserves complex I integrity and energy metabolism, Nature Communications, 10.1038/s41467-023-37454-4, 14 , 1, (2023).
- Morvarid Kabir, Richard N. Bergman, Jay Porter, Darko Stefanovski, Rebecca L. Paszkiewicz, Francesca Piccinini, Orison O. Woolcott, HsiuChiung Yang, V. Sashi Gopaul, Linsey Stiles, Cathryn M. Kolka, Dapagliflozin prevents abdominal visceral and subcutaneous adipose tissue dysfunction in the insulin‐resistant canine model, Obesity, 10.1002/oby.23771, 31 , 7, (1798-1811), (2023).
- Annette Bellar, Nicole Welch, Jaividhya Dasarathy, Amy Attaway, Ryan Musich, Avinash Kumar, Jinendiran Sekar, Saurabh Mishra, Yana Sandlers, David Streem, Laura E Nagy, Srinivasan Dasarathy, Peripheral blood mononuclear cell mitochondrial dysfunction in acute alcohol‐associated hepatitis, Clinical and Translational Medicine, 10.1002/ctm2.1276, 13 , 5, (2023).
- Jun Zhang, Xueling Liu, Jia Nie, Yuguang Shi, Restoration of mitophagy ameliorates cardiomyopathy in Barth syndrome, Autophagy, 10.1080/15548627.2021.2020979, 18 , 9, (2134-2149), (2022).
- Saki Watanabe, Alzahra J. Al Omran, Amy S. Shao, Zeyu Zhang, Chen Xue, Jifeng Zhang, Junji Watanabe, Jing Liang, Social isolation induces succinate dehydrogenase dysfunction in anxious mice, Neurochemistry International, 10.1016/j.neuint.2022.105434, 161 , (105434), (2022).
- Benjamin R. Troutwine, Taylor A. Strope, Edziu Franczak, Colton R. Lysaker, Laylan Hamid, Clayton Mansel, Julia A. Stopperan, Cynthia M. Gouvion, Mohammad Haeri, Russell H. Swerdlow, Heather M. Wilkins, Mitochondrial function and Aβ in Alzheimer's disease postmortem brain, Neurobiology of Disease, 10.1016/j.nbd.2022.105781, 171 , (105781), (2022).
- Xueling Liu, Jun Zhang, Jie Li, Chengjie Song, Yuguang Shi, Pharmacological inhibition of ALCAT1 mitigates amyotrophic lateral sclerosis by attenuating SOD1 protein aggregation, Molecular Metabolism, 10.1016/j.molmet.2022.101536, 63 , (101536), (2022).
- Maria M. Bayliak, Myroslava V. Vatashchuk, Dmytro V. Gospodaryov, Viktoria V. Hurza, Oleh I. Demianchuk, Marian V. Ivanochko, Nadia I. Burdyliuk, Kenneth B. Storey, Oleh Lushchak, Volodymyr I. Lushchak, High fat high fructose diet induces mild oxidative stress and reorganizes intermediary metabolism in male mouse liver: Alpha-ketoglutarate effects, Biochimica et Biophysica Acta (BBA) - General Subjects, 10.1016/j.bbagen.2022.130226, 1866 , 12, (130226), (2022).
- Rebeca Acin-Perez, Cristiane Benincá, Byourak Shabane, Orian S. Shirihai, Linsey Stiles, Utilization of Human Samples for Assessment of Mitochondrial Bioenergetics: Gold Standards, Limitations, and Future Perspectives, Life, 10.3390/life11090949, 11 , 9, (949), (2021).
- Baoming Wang, Yik-Lung Chan, Gerard Li, Kin Fai Ho, Ayad G. Anwer, Bradford J. Smith, Hai Guo, Bin Jalaludin, Cristan Herbert, Paul S. Thomas, Jiayan Liao, David G. Chapman, Paul S. Foster, Sonia Saad, Hui Chen, Brian G. Oliver, Maternal Particulate Matter Exposure Impairs Lung Health and Is Associated with Mitochondrial Damage, Antioxidants, 10.3390/antiox10071029, 10 , 7, (1029), (2021).
- Karthickeyan Chella Krishnan, Laurent Vergnes, Rebeca Acín-Pérez, Linsey Stiles, Michael Shum, Lijiang Ma, Etienne Mouisel, Calvin Pan, Timothy M. Moore, Miklós Péterfy, Casey E. Romanoski, Karen Reue, Johan L. M. Björkegren, Markku Laakso, Marc Liesa, Aldons J. Lusis, Sex-specific genetic regulation of adipose mitochondria and metabolic syndrome by Ndufv2, Nature Metabolism, 10.1038/s42255-021-00481-w, 3 , 11, (1552-1568), (2021).
- Jennifer Ngo, Ilan Y. Benador, Alexandra J. Brownstein, Laurent Vergnes, Michaela Veliova, Michael Shum, Rebeca Acín-Pérez, Karen Reue, Orian S. Shirihai, Marc Liesa, Isolation and functional analysis of peridroplet mitochondria from murine brown adipose tissue, STAR Protocols, 10.1016/j.xpro.2020.100243, 2 , 1, (100243), (2021).
- Martin Picard, Blood mitochondrial DNA copy number: What are we counting?, Mitochondrion, 10.1016/j.mito.2021.06.010, 60 , (1-11), (2021).

