Histology: Analysis Protocol
Sasha Burwell
Abstract
This protocol details the analysis of histology images, including usage of Matlab codes to draw regions of interest (ROIs) and ilastik software to perform pixel classification.
Steps
Analysis Protocol
Go to the folder with all of the .vsi images from one brain.
Use the
HistoROI
``` Matlab code to manually draw regions of interest (ROIs) of the left VTA and right VTA per section.
Change the channels and intensities (top right table) as needed to visualize your signal.
Make sure the tissue is oriented correctly (left hemisphere on the left) – use the “VS200” button to rotate, and the “FlipLR” button to flip horizontally, as necessary.
Click the “PP” button to draw two polygons.
- Left VTA first, then right VTA.
- After both polygons are drawn, you can move points on the polygon to edit them.
Repeat for each section with the VTA.
These drawn ROIs automatically save in a
HistoROI.mat
``` structure, but you can click “SaveBkp” to create a backup if there are any issues.
For pixel intensity calculation:
- Run
HistoOfflineAnalysis
``` to calculate the fluorescence of the specified channels in your drawn ROIs.


* Then run
HistoVTASummaryDV
For cell counting:
Save the ROIs as jpg images by clicking “Export” in the
HistoROI
``` code GUI, making sure the contrast allows visualization of cells and color of cells and only channels of interest are turned on.
Run ilastik software (https://www.ilastik.org/documentation/)..)
Perform Pixel Classification:
- Load raw data (the previously created jpg images).
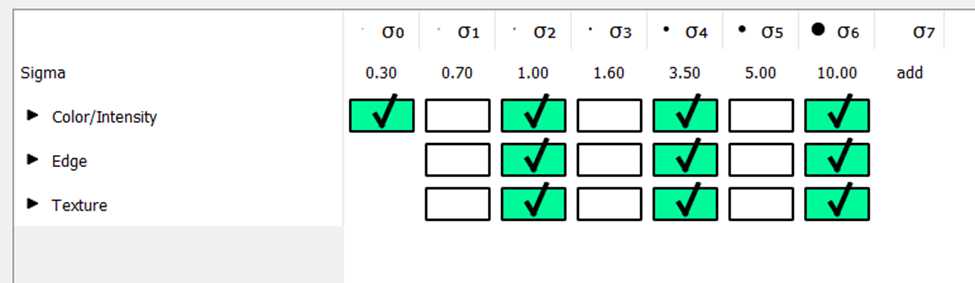
- Feature selection:
- Training: train the algorithm to detect a cell versus not-cell (background tissue) by manually labeling cell and background in various sections.
- Once you are happy with the segmentation performed by the classifier, export all predictions.
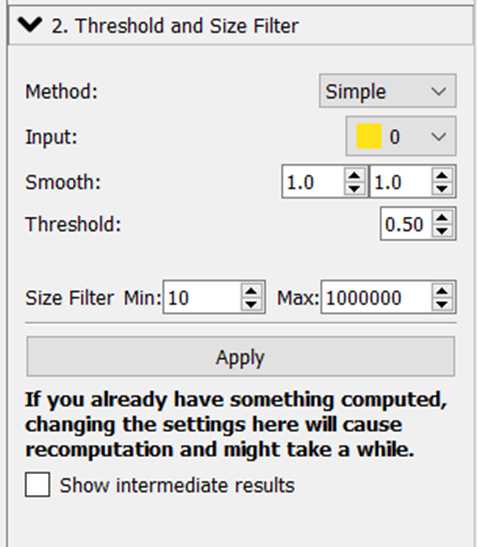
Perform Object Classification:
Load raw data (jpg images) and prediction maps (the predictions from pixel classification).
Use standard Threshold and Size Filter settings.
Click “Select Features”.
In Object Classification, create 3 label classes:
- red only,
- green only, and
- both.
Train the algorithm to classify these 3 classes by labeling different cells as having red only (ex, only dTomato), green only (ex, only TH or GCaMP), or both (yellow, both proteins).
Once you are happy with the predictions from the classifier, export the Object Identities as .csv files.
Use these .csv files to count how many cells were identified in each label class across all the sections.
